
Assess and Promote Students' Group Cohesion in Larger ...
15
Association for Information Systems AIS Electronic Library (AISeL) MCIS 2018 Proceedings Mediterranean Conference on Information Systems (MCIS) 2018 Assess and Promote Students' Group Cohesion in Larger Sized Classrooms Michael Kallookaran Technische Universitaet Braunschweig, Braunschweig, Germany, [email protected] Susanne Robra-Bissantz Technische Universitaet Braunschweig, Braunschweig, Germany, [email protected] Follow this and additional works at: hps://aisel.aisnet.org/mcis2018 is material is brought to you by the Mediterranean Conference on Information Systems (MCIS) at AIS Electronic Library (AISeL). It has been accepted for inclusion in MCIS 2018 Proceedings by an authorized administrator of AIS Electronic Library (AISeL). For more information, please contact [email protected]. Recommended Citation Kallookaran, Michael and Robra-Bissantz, Susanne, "Assess and Promote Students' Group Cohesion in Larger Sized Classrooms" (2018). MCIS 2018 Proceedings. 21. hps://aisel.aisnet.org/mcis2018/21 brought to you by CORE View metadata, citation and similar papers at core.ac.uk provided by AIS Electronic Library (AISeL)
Transcript of Assess and Promote Students' Group Cohesion in Larger ...

Association for Information SystemsAIS Electronic Library (AISeL)
MCIS 2018 Proceedings Mediterranean Conference on Information Systems(MCIS)
2018
Assess and Promote Students' Group Cohesion inLarger Sized ClassroomsMichael KallookaranTechnische Universitaet Braunschweig , Braunschweig , Germany, [email protected]
Susanne Robra-BissantzTechnische Universitaet Braunschweig , Braunschweig , Germany, [email protected]
Follow this and additional works at: https://aisel.aisnet.org/mcis2018
This material is brought to you by the Mediterranean Conference on Information Systems (MCIS) at AIS Electronic Library (AISeL). It has beenaccepted for inclusion in MCIS 2018 Proceedings by an authorized administrator of AIS Electronic Library (AISeL). For more information, pleasecontact [email protected].
Recommended CitationKallookaran, Michael and Robra-Bissantz, Susanne, "Assess and Promote Students' Group Cohesion in Larger Sized Classrooms"(2018). MCIS 2018 Proceedings. 21.https://aisel.aisnet.org/mcis2018/21
brought to you by COREView metadata, citation and similar papers at core.ac.uk
provided by AIS Electronic Library (AISeL)

The 12th Mediterranean Conference on Information Systems (MCIS), Corfu, Greece, 2018
ASSESS AND PROMOTE STUDENTS’ GROUP COHESION IN LARGER SIZED CLASSROOMS
Research full-length paper IS Education in a Digital Business Process Transformation Perspective
Kallookaran, Michael, Technische Universitaet Braunschweig, Braunschweig, Germany, [email protected]
Robra-Bissantz, Susanne, Technische Universitaet Braunschweig, Braunschweig, Germany, [email protected]
Abstract Courses that exceed regular class sizes represent a challenge for teachers. With an increasing number of students, it is not only difficult to assess students’ academic performance but also their social inte-gration. A teacher who is not able to determine which students are isolated may not be able to intervene if they choose to cut their studies short. In this research paper we demonstrate how teachers are able to assess their students’ social integration by leaving it up to the students to self-select their group work partners and solve tasks together. The introduction of a newly created artifact helps to automate this process and gather the necessary data to discover companionless students even in larger learning en-vironments. Keywords: social integration, peer interaction, larger learning environment, classroom community.
Introduction Over the last few decades postsecondary institutions, such as universities, have been faced with the challenge of students cutting their studies short (Barefoot 2004). Researchers have ever since been trying to understand the reasons why students are dropping out (Astin 1975; Spady 1970; Tinto 1975; Tinto 2006). However, the decision of a student to leave their higher education institution is not easy to un-derstand as different complex factors interact with each other which are hard to comprehend (Pantages and Creedon 1978). Two of these complex factors which are relevant to a student’s persistence are social and academic integration (Spady 1970; Tinto 1993; Tinto 1975). Academic integration can be under-stood as the grade performance of students as well as how much they identify themselves ”with the norms of the academic system” (Tinto 1975, p.104). Social integration, on the other hand, is ”the quan-tity and quality of social interactions that students have with faculty and other students” (Rubin 2012, p.22). While it can be manageable for a teacher to assess students’ academic integration by looking at their grades, it can be quite difficult to get an adequate impression of their social integration. For example, considering a classroom with a regular class size, a teacher is able to visually observe and assess the cohesion of the classroom. Visual signals in this face-to-face situation could be for example, to check for attendance or see how students interact with each other (Reffay and Chanier 2003). Even though this is a good place to start, there are some difficulties when being faced with courses that exceed regular class sizes. In such larger learning environments interactivity can drop (Hansen and Jensen 1994), ano-nymity can prevail (Ward and Jenkins 1992), and grades of students can be affected (Kokkelenberg et al. 2008). However, one of the most important ways to support students according to Tinto (2012) is in the classroom. In fact he is convinced that ”in no place is support more needed than in the classroom where success is constructed one course at a time” (Tinto 2012, p.7). Our main goal in this research paper is to aid teachers in assessing social integration in the classroom. Especially larger learning environments where hundreds of students attend class are problematic. They

Kallookaran et al. /Assess and promote students’ group cohesion
The 12th Mediterranean Conference on Information Systems (MCIS), Corfu, Greece, 2018 2
make it very difficult for teachers to (1) recognize social behavior among students on an individual level and (2) promote social connectedness. A formative assessment that is applicable in various classroom settings and for different class sizes is needed. By introducing an artifact, we try to give teachers an opportunity to assess group cohesion even in larger learning environments. We will try to assess to which degree students are interconnected and further encourage them to engage in new peer connections. This will give teachers a good assessment which students are isolated in class and offer them an oppor-tunity to increase interaction and integration. Lastly, we will monitor the changes that occurred due to our artifact and see how well this contributed to a more balanced classroom where peers are intercon-nected instead of isolated.
1 Background When it comes to assessment we need to differentiate between formative and summative assessment. Formative assessment is information that is being used when comparing a current state to a desired state and using that information to take action to close the gap between both of them. Summative assessment on the other hand is passed on to someone who isn’t directly involved and does not lead to an action that tries to close the gap (Black and Wiliam 1998). Our goal is to use formative assessment to help teachers better assess their own classroom structure and act on those results. Later on, the summative assessment should help teachers and institutions to create a predictive system that is able to intervene as soon as a student is detected as being isolated. Both assessments will rely on the introducing of a newly created artifact that tries to increase interaction, collaboration in a group, and reduce anonymity. These are all factors that affect student retention. How-ever, when introducing a technological artifact, it is also necessary to make sure that it aids and not undermines the pedagogical approach of the teacher.
1.1 Student retention Unsatisfied students are likely to drop out of their studies. Trying to retain them has been an ongoing challenge for higher education institutions for the last several decades. The task to find an ideal approach that lowers student dropout rates, however, is not that easy. This is due to the fact that this complex problem is made out of several interacting elements which need to be considered (Pantages and Creedon 1978). In fact, Tinto (2006) argues that the process of retaining students can be very different for each individual institutional setting. Looking at past research we see similar tendencies among institutions to retain students. According to Carey (2005) these include the attempt to get students more involved in the student life, make sure that teaching and learning circumstances are of a high standard, observe students’ progress, and finally make student success a priority among institutional goals. These findings are very similar to the four areas that Tinto (2010) has identified as the reasons for students to remain at their post-secondary institution. He lists ”expectations, support, feedback, and involvement” (Tinto 2010, p.56) as the dimensions that pro- mote retention and student graduation. When it comes to expec-tations it is favorable for student success if students have clear and high expectations of themselves. A good measure is to give frequent feedback to all participants so that everyone can keep track of their performance and give them an opportunity to adjust it if necessary. Involvement or rather engagement describes how important it is for students to interact with faculty, staff, and peers. By engaging socially and academically students become more involved with one another which, on an educational level, helps them graduate. However, most of the undertaken measures that have been brought under way are paying little to no attention to the classroom (Tinto 2012). Our approach, with the introduction of an artifact, will directly target the classroom and will try to iden-tify students who are socially isolated within the classroom. We will try to offer them an opportunity to connect with others and increase social contact. By giving the teacher the opportunity to automatically dis- tribute tasks we target a social and academic integration of students. The application will make

Kallookaran et al. /Assess and promote students’ group cohesion
The 12th Mediterranean Conference on Information Systems (MCIS), Corfu, Greece, 2018 3
students self-responsible for choosing peers they want to work with and asks them to establish contact with them when they receive a task provided by the teacher.
1.2 Student interaction One of the most determining factors for persisting in a higher degree program is the level of interaction that a student has within the social and academic systems (Terenzini and Pascarella 1977; Tinto 1993). These interactions and the resulting integration within the system can redefine individuals’ goals and plans for the future and their decision to persist. Interactions with peers are of particular interest as they share the same values and goals and represent an opportunity for students to gain friendship support (Spady 1970). Also, the interaction, between students and faculty, is essential as it influences their edu-cational outcome and their level of satisfaction (Endo and Harpel 1982). Socially well integrated stu-dents also seem to be more likely to finish their studies and not drop out of college (Gloria and Robinson Kurpius 2001; Spady 1970; Tinto 1993; Tinto 1975; Tinto 1987). In fact ”social integration is often measured as a composite of peer-peer interactions and faculty-student interactions” (Kuh et al. 1994, p.37). Research literature has already shown that interaction can contribute to the positive perception of the quality of a course (Fulford and Zhang 1993; Zhang and Fulford 1994; Zirkin and Sumler 1995). Also, it might be considered a better learning experience when interacting with people rather than only with books (Vygotsky 1978). In fact, not only does it improve the perceived quality of a course, but it also contributes to better test performance, grades, and satisfaction among students (Zirkin and Sumler 1995). There has also been evidence that the availability of the faculty beyond the classroom (Astin 1993), as well as the interaction with fellow students (Astin 1993), can contribute to the overall satisfaction of students’ university experience. By making use of our artifact teachers will be able to rely on a scalable solution that can address different class sizes, create interaction, and help diminish anonymity. This is helpful when considering that ano-nymity has been identified as one of the reasons why students cut their studies short (Heublein et al. 2017).
1.3 Anonymity Anonymity in classrooms can not only lead to student dropout but it can also lead to other problems especially in larger learning environments (Ward and Jenkins 1992). Here, it can not only lead to inci-vilities but also to deindividuation (Forni 2002; Harris 2006). Incivilities can be described as any actions that obstruct regular classroom activities (Feldmann 2001). As an instructor and educator, it is therefore wise to prevent anonymity before it leads to a show of bad manners in the classroom (Pearson et al. 2001). It is possible to counteract incivilities by keeping classroom sizes small and using immediacy, like talking to students when they enter the class, or knowing their names. This helps to individualize all participants and thus, reduce anonymity (Forni 2002; Harris 2006). Deindividuation opposed to in-civilities means the loss of personal believes and characteristics. Instead of acting according to their own personal belief they do act according to the belief a group, which does not have to match the one of the individuals (Harris 2006). In order to avoid incivilities and deindividuation it is necessary to individualize participants (Feldmann 2001; Forni 2002; Harris 2006). However, this is a difficult endeavor when dealing with larger learning environments. One approach that has tried to solve this problem introduced a gamified mobile applica-tion that encourages students to meet other peers in the course (Kallookaran and Robra-Bissantz 2016). However, it can also be helpful to keep anonymity in place in order to allow students to participate anonymously and answer questions during class, without having to worry to answer them incorrectly (Davis 2003; Nicol and Boyle 2003; Sievers et al. 2012).
Kallookaran et al. /Assess and promote students’ group cohesion
The 12th Mediterranean Conference on Information Systems (MCIS), Corfu, Greece, 2018 4
1.4 Group formation Research has shown that collaborative learning can be beneficial to students when it comes to learning (Cohen 1994; Dillenbourg et al. 1995). Working together can benefit students in different ways. It can motivate students to talk more and more effectively with one another, create a better classroom climate, give students more autonomy, or give them their freedom to choose their level of participation (Harmer 2007; Long and Porter 1985). Teachers are also able to handout complex assignments to a group that would be too demanding for a single individual to complete (Mello 1993). However, it is important to consider the conditions under which group work happens so that it can be effective. Jacobs and Hall (2002), for example, argue to consider different aspects. One of them is the question how groups should be formed. Johnson and Johnson (1990) in fact say that if the members of the group don’t have the necessary interpersonal and small-group skills then they won’t be able to work effectively in a cooper-ative manner. The group formation process can therefore decide whether or not a group will be success-ful. Group formation is typically either done by the students themselves or by the teacher (Hilton and Phillips 2010). Both methods have, however, different effects on the selection of group members and on the outcome. For example, during the selection process where students are allowed to self-select their own group members they are being affected by different aspects. They are not only influenced by the relationship they have towards other students but also by their status hierarchies. This means that stu-dents feel compelled to choose friends as their partners and avoid peers who have a lower status (Mitch-ell et al. 2004). Teachers on the other hand can either choose to randomly assign students to a group or use a systematic approach (Hilton and Phillips 2010) such as students’ abilities (Harmer 2007). Other things that need to be considered are for example the tendency of students to befriend other students who are on the same level. In fact, students who are overachievers tend to be- friend other overachievers and underachievers tend to choose other underachievers (Malloy 1954). In larger groups there is also the problem with members and their differences in status. Low-status group members are in fact often ignored by the rest of the group, even if their contributions would lead to a better outcome (Cohen and Lotan 2014). We will introduce another approach which will work similar to the classic self-selection method. The idea is that it also leaves it up to the students to choose peers that they want to work with. The literature suggests that this will lead students to collaborate with already known peers. In order to encourage the contact with unknown peers we introduced a gamified approach that rewards participants with points for connecting with others. This leads to students connecting with not only people they have already known but also with others they haven’t met before (Kallookaran and Robra-Bissantz 2016). Further-more, we hope that this will also encourage students who don’t know anyone in class to establish a connection and collaborate. Our mobile application collects the data when people connect and later allows a teacher to monitor the social structure of the classroom. This enables them to detect socially isolated students and in future iterations influence the group formation process by giving teachers back-ground information about the social connectedness of a student.
1.5 Integrating technology into teaching As mentioned above this predictive system that we want to implement will be an artifact in the form of a mobile application. However, introducing and using a new technology in a classroom can be challeng-ing. One major framework that was developed over the past few years, that tries to effectively integrate technology into teaching, by building on Shulman’s idea of pedagogical content knowledge (PCK), is the Technological Pedagogical And Content Knowledge (TPACK) framework (Cox and Graham 2009; Mishra and Koehler 2006). Koehler and Mishra (2005) believe that ”Good teaching is not simply adding technology to the existing teaching and content domain. Rather, the introduction of technology causes the representation of new concepts and requires developing a sensitivity to the dynamic, transactional relationship between all three components suggested by the TPCK framework.” (Koehler and Mishra 2005, p. 134). The developed TPACK framework by Mishra and Koehler (2006) tries to show how teachers’ knowledge of content, pedagogy and technology are intertwined and how they interact with
Kallookaran et al. /Assess and promote students’ group cohesion
The 12th Mediterranean Conference on Information Systems (MCIS), Corfu, Greece, 2018 5
each-other. They argue that such a framework ”can transform the conceptualization and the practice of teacher education, teacher training, and teachers’ professional development” and then produce better and effective teaching (Mishra and Koehler 2006, p. 1019). The core of the framework consists of three main knowledge components that represent a distinct form of a teacher’s knowledge. These include technological knowledge (TK), content knowledge (CK) and pedagogical knowledge (PK). In order to achieve a better teaching situation for teachers we introduce our app that provides teachers with new information about the social structure of participants in the classroom and helps them connect unknown peers. This implementation requires teachers to have an adequate understanding of the new technology to be used, the knowledge that can be transmitted using it, as well as the pedagogical back-ground knowledge to apply it. Before introducing the app, it is therefore necessary to properly train the teacher in its usage and demonstrate how it can benefit the goal of the course to transfer knowledge.
2 Research Approach With the introduction of our artifact we give teachers, on the one hand, the opportunity to send out tasks to their students and, on the other hand, allow students to self-select the peers they would like to solve those tasks with. The artifact itself automates the assignment of the tasks and enables students to connect with other peers. By observing this procedure, the system is able to identify the social structure of the classroom. This will give teachers the opportunity to (1) create a classroom where each student has the possibility to connect with others, (2) create a more balanced classroom, and (3) be aware of isolated students. We will lay a special focus on how the social structure is affected by group formation and compare our findings with previously recorded data. We used a Design Science Research (DSR) approach as it ”creates and evaluates IT artifacts intended to solve identified organizational problems” (Hevner et al. 2004, p.77). With its help we created a mobile app that helps to assess the social relationships and social networks within a class. Peffers et al. (2007) offer four possible reasons why research is initiated using DSR. They include the need to solve a prob-lem that was identified, find a better solution to a given problem, focus on the design and development of an artifact that helps to solve a problem, and solve an externally initiated problem e.g. by a client. As we are trying to improve teachers’ actions when it comes to improve the classroom we can categorize our research as an objective-centered approach.
2.1 Approach In order to find a solution that is able to automate the group formation process with self-selection it is necessary to choose a technology that can be used under common classroom circumstances. For this purpose, we developed a mobile application that can be installed on the two most commonly used smartphone operating systems, iOS and Android (comScore 2016). Figure 1 exemplifies our approach and the three steps we took. The first step consists of a teacher in-structing students on how to use our mobile application. The second step follows the approach we made earlier (Kallookaran and Robra-Bissantz 2016) and helps to establish interpersonal ties. It consists of a gamified approach that rewards students with points for establishing connections with other peers. This is achieved by providing each student with an individual QR-code and a scanner. They can use these to get scanned by other peers or scan other students themselves. Each scan is accompanied by the question if they knew each other before. This enables the observer to determine if this has been a preexisting connection or a new one. Who the students choose to scan is completely up to them. The process differ-entiates between scanning and being scanned which will enable the teacher to see the direction of the relationship in a directed graph. Students were offered spare time to scan other peers when the teacher first explained the functionality of the app as well as during our tutorial session that took place every other week. The third step consists of the teacher creating a task for the students. In this step the system takes the task provided by the teacher and randomly assigns it to mutual pair of students. A mutual pair are two students who scanned each other in a reciprocal manner.

Kallookaran et al. /Assess and promote students’ group cohesion
The 12th Mediterranean Conference on Information Systems (MCIS), Corfu, Greece, 2018 6
Figure 1: Observing student group formation and task completion process
We performed two sets of observations and collected the data for each individual occurrence in our introductory course of information system. The course is being attended by several hundred students who are pursuing different degree programs. Our first observation was concluded during the winter term 2014/15 (WT14/15) where we determined whether or not students were actually willing to connect with other peers (Kallookaran and Robra-Bissantz 2016). The second observation took place during the win-ter term of 2016/17 (WT16/17) where we introduced the ability for a teacher to create tasks. These were assigned to pair of students in an effort to automate and trigger reciprocal peer learning (Kallookaran and Siemon 2017). In this study we will compare these data sets in order to determine the social structure among students and how it was affected by the introduction of the application and the group work. Table 1 shows how many students were enrolled in our course during the two different winter terms. Here we differentiate between students who subscribed to our Learning Management System (LMS) and those who actually installed our application. The usage of the LMS is a requirement for the courses that take place at the university where we performed our study. Participating in our study, however, was not a requirement. All students that took part in our study did so voluntarily. They were purely motivated by the discovery of learning points and the collection of game points. The numbers of the LMS are a good indicator for determining the number of enrolled students in the course. Even though the LMS subscribers remained almost constant for both terms there is a substantial increase in the app installations of our artifact. Also, the number of students, which are later represented as nodes in the network analysis, doubled over the course of our two observations. These are students who installed the application and scanned at least one other student. The connections, also called edges, between students or nodes, did also almost triple over the same amount of time. Furthermore, table 2 shows the composition of the course depending on the different degree programs. The three most common programs are shown and how their distribution changed over time. Even though we observed an introductory course for information systems most of the participants did study industrial engineering – mechanical engineering, represented as purple in the following figures. This is due to the fact that there are considerably more students with that major at this particular institution than students studying information systems.
Gamified learning environment
3. Group task
2. Establishing a connection
1. Ins
tructi
ons
Ranking
Determine social structure Observe task completion
3. Grou
p tas
k1. Instructions

Kallookaran et al. /Assess and promote students’ group cohesion
The 12th Mediterranean Conference on Information Systems (MCIS), Corfu, Greece, 2018 7
WT14/15 WT16/17 LMS subscribers 670 639 App installations 272 411 Students/Nodes 93 224 Connections/Edges 289 817
Table 1: Subscriber stats for the different winter terms
WT14/15 WT16/17 Industrial engineering – mechanical engineering
42% 44%
Information systems 39% 32% Industrial engineering – civil engineering
11% 17%
Table 2: Most represented degree programs for the different degree programs
3 Evaluation In order to determine the classroom structure over the two previously mentioned time periods we per-formed a Social Network Analysis (SNA) using the collected data. SNA considers each student as a node of the system. The lines connecting the nodes are edges that represent the relationship between them. In a directed graph, which we used, there are three possible type of connections. There is a null, an asymmetric, and a mutual type. The null type represents no connection between the nodes whereas the asymmetric one represents a one-sided relationship. In our case this represents the case where one student scanned a peer but wasn’t scanned back. The direction between the nodes is represented in a clockwise manner. Lastly, the mutual type is the case where a student scanned a peer and was also scanned back. Figure 2a shows the preexisting classroom structure during WT14/15. Edges are only shown between nodes where students responded that they had previously known each other. We used the Gephi appli-cation (Bastian et al. 2009) in the following figures to visualize the network structure and used the Yifan-Hu layout algorithm (Hu 2005) for the layout of the nodes. The Gephi application is especially helpful as it is able to display the classroom structure even for larger learning environments. This makes it easier for teachers and staff to visualize and analyze the interactions among students. Different coloring was used in order to rep- resent the different degree programs that students are pursuing in our course. Figure 2b in comparison to figure 2a represents the classroom structure by showing all preexisting and newly established connections.

Kallookaran et al. /Assess and promote students’ group cohesion
The 12th Mediterranean Conference on Information Systems (MCIS), Corfu, Greece, 2018 8
(a) Preexisting connections (b) Total connections of a student
Figure 2: Graphical representation of connections made by students in WT14/15
Figure 3a shows the classroom structure for the WT16/17 where tasks were introduced. Again, this represents the preexisting connections in the classroom. On the other side, figure 3b represents all preex-isting and the newly established ones. This means all the connections a student has made at the end of the semester regardless of whether they knew each other before or not.
(a) Preexisting connections (b) Total connections of a student
Figure 3: Graphical representation of connections made by students in WT16/17
Lastly, figure 4a and figure 4b showcase the different degree of betweenness centrality values for each node for the two different terms. Depending on their magnitude the respective nodes are either repre-sented bigger for a higher degree of betweenness centrality or smaller for a lower degree. Betweenness centrality is a measure to highlight the significance of a node within a network. It is determined by

Kallookaran et al. /Assess and promote students’ group cohesion
The 12th Mediterranean Conference on Information Systems (MCIS), Corfu, Greece, 2018 9
looking at each node and work out how many shortest paths pass through it. Even though this measure goes back to Bavelas (1948), one of the most commonly used definition is by Freeman (1977) who puts it as ”a point in a communication network is central to the extent that it falls in the shortest path between pairs of other points” (Freeman 1977, p.35). The calculations were performed by using Brandes (2001) algorithm for determining the degree of betweenness centrality.
(a) Connection betweenness for WT14/15 (b) Connection betweenness for WT16/17
Figure 4: Decreasing anonymity in a gamified learning environment
4 Discussion Comparing both winter terms, we are able to see an increase in student participation when we look at table 1. We credit the increase to the introduction of the task feature which represents not only a way to connect with other peers but also an opportunity to learn together. This is the only changed we performed between both observation terms. Students seem to be better motivated to participate if there is also an academic purpose rather than just a social one. Looking at figure 2a and figure 3a we can see the preex-isting class structure. In both figures we can see a high number of weakly and strongly connected com-ponents. The difference between them is how a node is connected to every other node in a set. A weak connection in a directed graph neglects the direction and looks for a connection to the other nodes. This compares to a strong connection which doesn’t neglect the direction (Mislove et al. 2007). We used the algorithm by Tarjan (1972) and found 39 weakly and 71 strongly connected components in figure 2a and 77 weakly and 170 strongly connected components in figure 3a. Considering not only the preexisting connections but also the new ones we can see a substantially lower number of subgraphs in figure 2b and figure 3b. For WT14/15 we observed a drop to 13 weakly and 40 strongly connected components whereas for WT16/17 they dropped to 16 weakly and 54 strongly connected components. Further, using the algorithm provided by Blondel et al. (2008) using a resolution of 1 (Lambiotte et al. 2008) we are able to detect 41 communities when only considering preexisting connections. Looking at all the connections, which are the preexisting and the new connections, we see 18 communities that are left for WT14/15. This means a higher interconnectivity between all students. In comparison, WT16/17 revealed 83 communities for preexisting connections and 26 communities when including the newly established connections. These values show us that by allowing students to connect with other peers there is a possibility to create a more interconnected structure which can lead to a better information

Kallookaran et al. /Assess and promote students’ group cohesion
The 12th Mediterranean Conference on Information Systems (MCIS), Corfu, Greece, 2018 10
penetration. This means that teachers can better rely on the fact that information is passed on to other students who, for example, might not be present because they are sick. All of the students in our specific course are enrolled in eight different degree programs. It is interesting to notice that the amount of communities is substantially higher than the amount of degree programs. We would have anticipated a lower amount of communities as we would have expected that students from the same degree program would form a single community. This could be explained by the fact that students are able to take our class whenever they choose to. Since our class is not a prerequisite for future classes there are several students who choose to postpone our class to another semester. This means that there are students from the same degree program but who started their studies at a different point in time and therefore don’t necessarily know each other. Furthermore, the size of the degree pro-grams per semester can also reach several hundred of students which makes it hard for a student to know each and every peer they are studying with. Students who are still represented as a stand-alone sub-graph, in figure 2b and figure 3b, with only a few connections to others, should be closely monitored by the teacher. In order to now create a better-connected class, it would be recommended to take measures to establish a connection between all of the students. This could now be done more easily as the sub-groups or rather students have been identified. Lastly, looking at figure 4a and figure 4b we can see the degree of betweenness centrality. Here we can see the students who are most important when it comes to deliver information throughout the network. While students from a certain degree program represented the highest concentration of these points in WT14/15 we can see a shift to students from another degree program in WT16/17. Green representing students studying information system and students studying civil engineering - mechanical engineering in purple. This highlights the importance of reassessing network structure in every course and not rely solely on experience or the number of students represented by a degree program. Knowing which stu-dents represent key node points can help a teacher to quickly disperse information throughout the class.
5 Limitations Even though our approach allows teachers to identify socially isolated students in their classroom it does not mean that they are actually socially isolated. Our approach offers only a narrow perspective on the social connectedness of a student. In order to get a more complete picture it is necessary to track the social activities of students not only in one classroom but rather in all of them. This will lead to a more complete picture which teachers can use to base their decision on. Once gathered, this information can especially benefit future courses and their teachers. Having past data at their disposal enables teachers to better adjust to students’ abilities and their social connectedness. However, if a student is not socially well connected does not mean that he or she lacks an entire social support system. Friends or family outside of the higher educational institution are still able to support the student. This means that in order to gain an even better insight on students’ social integration it would be necessary to also include the social structure of a student’s entire environment. However, this approach could be seen as invasive as it directly takes place in the private life of a student. Another critical point to consider are the students who don’t own a smartphone or don’t want to participate. The former group is excluded from this new form of teaching and might also have a feeling of discomfort because of their inability to participate. Here it would be adequate to provide devices that can be bor-rowed. This will, however, not only increase cost but also put pressure on the students to use it. Further-more, students who now seem to be socially isolated may only appear to be so because they only know other peers who don’t want to or can’t participate. The considered approach does further not consider the academic performance of students. In order to also achieve a productive result from students’ group work it is necessary to consider students’ academic performance and achievements. Students who are matched up because of their social differences can be helpful in order to better integrate them into the classroom and decrease anonymity but it does not nec-essarily contribute to their academic performance. The undertaken approach does further not prevent

Kallookaran et al. /Assess and promote students’ group cohesion
The 12th Mediterranean Conference on Information Systems (MCIS), Corfu, Greece, 2018 11
dropout but it helps to recognize possible at-risk students. The best approach for an institution, a staff member, or a teacher to help still needs to be determined. Furthermore, the effort to determine at-risk students in the classroom also means to make up time for this new method. This means that lecture time needs to be sacrificed and the course process reorganized. The trade-off between determining at-risk students and altering the lectures needs to be further evaluated in order to make sure that the learning quality is not diminished.
6 Future Research In future research we will need to perform a longitudinal study that will involve multiple courses in order to gain a better insight on which students are actually isolated. We will further integrate an extra step to determine at-risk students. By making use of a preestablished questionnaire, such as the College Persistence Questionnaire (Davidson et al. 2009), we are confident to find students who might consider not to return the following semester. We will then adapt our application to not randomly assign students to work together but choose and match students according to their abilities, social integration, and their risk to leave their studies. The enhanced process can be seen in figure 5. This larger spectrum of criteria will hopefully contribute to a more balanced classroom and a better group formation process that con-tributes to student retention. This approach will hopefully give teachers and institutions more relevant information to base their decision on. The goal is that institutions will be able to better assess and identify at-risk students and offer further assistance inside and outside of the classroom. Teachers, on the other hand, will be able to actively make use of the information in the classroom and offer in class support. Lastly, students can be more easily identified as being at risk and receive more immediate support during class and also beyond the classroom. Instead of having to seek out help for themselves, which many students might not do, teachers and staff will be able to recognize them more easily.
Figure 5: Identifying at-risk students and influence group formation accordingly
7 Conclusion In an effort to better assess the classroom, we created an artifact that tries to influence the academic and social experience of students. Both of these aspects have been known to determine a student’s decision
Gamified learning environment
4. Specific group
formation / task
Obs
erve
task
and
gro
up
perfo
rman
ce
4. Spe
cific g
roup
formati
on / t
ask
Survey
Survey
3. Establishing a connection
Ranking
Determ
ine social structure
2.Participate
2.Participate
Determ
ine persistence
1. Ins
tructi
ons
1. Instructions

Kallookaran et al. /Assess and promote students’ group cohesion
The 12th Mediterranean Conference on Information Systems (MCIS), Corfu, Greece, 2018 12
to drop out of their higher education institution or persist. We tried to address both of them by introduc-ing a mobile application that encourages social contact and builds academically relevant group work on top of it. Specifically, we put a focus on the social aspect. By leaving it up to the students to self-select their own study partners we are able to observe their social behavior and relieve teachers of this duty. The entire process does not only help to create interaction among students but it also lets a teacher know which students act on their own. Looking at the data we collected we were able to see that the social structure of students inside the classroom was dispersed. By introducing our application, we were able to connect student groups and determine which students were not well connected to others. This gives teachers the possibility to observe student structure even in larger learning environments. Furthermore, by determining the betweenness centrality measure for each student, teachers are able to spot the most connected students. This enables them to directly address these students in an effort to disperse infor-mation more effectively.
References Astin, A. W. 1993. What matters in college?: Four critical years revisited, vol. 1. Jossey-Bass San
Francisco. Astin, A. W. 1975. Preventing students from dropping out, San Francisco: Jossey-Bass. Barefoot, B. O. 2004. “Higher education’s revolving door: Confronting the problem of student drop out
in US colleges and universities,” Open Learning: The Journal of Open, Distance and e-Learning (19:1), pp. 9–18.
Bastian, M., Heymann, S., Jacomy, M., et al. 2009. “Gephi: an open source software for exploring and manipulating networks.” Icwsm (8), pp. 361–362.
Bavelas, A. 1948. “A mathematical model for group structures,” Human organization (7:3), pp. 16–30. Black, P. and Wiliam, D. 1998. “Assessment and classroom learning,” Assessment in Education: prin-
ciples, policy & practice (5:1), pp. 7–74. Blondel, V. D., Guillaume, J.-L., Lambiotte, R., and Lefebvre, E. 2008. “Fast unfolding of communities
in large networks,” Journal of statistical mechanics: theory and experiment (2008:10), P10008. Brandes, U. 2001. “A faster algorithm for betweenness centrality,” Journal of mathematical sociology
(25:2), pp. 163–177. Carey, K. 2005. “Choosing to improve: Voices from colleges and universities with better graduation
rates,” (). Cohen, E. G. and Lotan, R. A. 2014. Designing Groupwork: Strategies for the Heterogeneous Class-
room Third Edition, Teachers College Press. Cohen, E. G. 1994. “Restructuring the classroom: Conditions for productive small groups,” Review of
educational research (64:1), pp. 1–35. comScore 2016. comScore Reports January 2016 U.S. Smartphone Subscriber Market Share. 2016. Cox, S. and Graham, C. R. 2009. “Using an elaborated model of the TPACK framework to analyze and
depict teacher knowledge,” TechTrends (53:5), pp. 60–71. Davidson, W. B., Beck, H. P., and Milligan, M. 2009. “The college persistence questionnaire: Develop-
ment and validation of an instrument that predicts student attrition,” Journal of College Student De-velopment (50:4), pp. 373–390.
Davis, S. 2003. “Observations in classrooms using a network of handheld devices,” Journal of Computer Assisted Learning (19:3), pp. 298–307.
Dillenbourg, P., Baker, M. J., Blaye, A., and O’Malley, C. 1995. The evolution of research on collabo-rative learning.
Endo, J. J. and Harpel, R. L. 1982. “The effect of student-faculty interaction on students’ educational outcomes,” Research in Higher Education (16:2), pp. 115–138.
Feldmann, L. J. 2001. “Classroom Civility Is Another of Our Instructor Responsibilities,” College Teaching (49:4), pp. 137–140.
Forni, P. M. 2002. Choosing civility: The twenty-five rules of considerate conduct, Macmillan.
Kallookaran et al. /Assess and promote students’ group cohesion
The 12th Mediterranean Conference on Information Systems (MCIS), Corfu, Greece, 2018 13
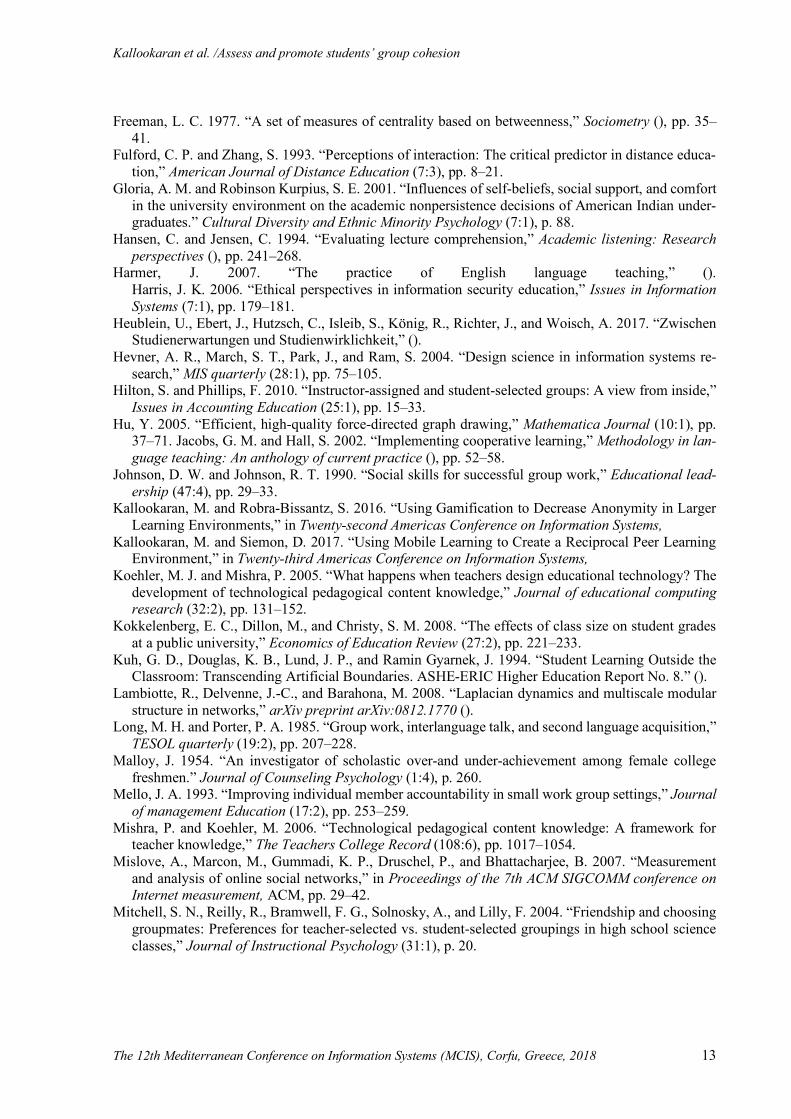
Freeman, L. C. 1977. “A set of measures of centrality based on betweenness,” Sociometry (), pp. 35–41.
Fulford, C. P. and Zhang, S. 1993. “Perceptions of interaction: The critical predictor in distance educa-tion,” American Journal of Distance Education (7:3), pp. 8–21.
Gloria, A. M. and Robinson Kurpius, S. E. 2001. “Influences of self-beliefs, social support, and comfort in the university environment on the academic nonpersistence decisions of American Indian under-graduates.” Cultural Diversity and Ethnic Minority Psychology (7:1), p. 88.
Hansen, C. and Jensen, C. 1994. “Evaluating lecture comprehension,” Academic listening: Research perspectives (), pp. 241–268.
Harmer, J. 2007. “The practice of English language teaching,” (). Harris, J. K. 2006. “Ethical perspectives in information security education,” Issues in Information Systems (7:1), pp. 179–181.
Heublein, U., Ebert, J., Hutzsch, C., Isleib, S., König, R., Richter, J., and Woisch, A. 2017. “Zwischen Studienerwartungen und Studienwirklichkeit,” ().
Hevner, A. R., March, S. T., Park, J., and Ram, S. 2004. “Design science in information systems re-search,” MIS quarterly (28:1), pp. 75–105.
Hilton, S. and Phillips, F. 2010. “Instructor-assigned and student-selected groups: A view from inside,” Issues in Accounting Education (25:1), pp. 15–33.
Hu, Y. 2005. “Efficient, high-quality force-directed graph drawing,” Mathematica Journal (10:1), pp. 37–71. Jacobs, G. M. and Hall, S. 2002. “Implementing cooperative learning,” Methodology in lan-guage teaching: An anthology of current practice (), pp. 52–58.
Johnson, D. W. and Johnson, R. T. 1990. “Social skills for successful group work,” Educational lead-ership (47:4), pp. 29–33.
Kallookaran, M. and Robra-Bissantz, S. 2016. “Using Gamification to Decrease Anonymity in Larger Learning Environments,” in Twenty-second Americas Conference on Information Systems,
Kallookaran, M. and Siemon, D. 2017. “Using Mobile Learning to Create a Reciprocal Peer Learning Environment,” in Twenty-third Americas Conference on Information Systems,
Koehler, M. J. and Mishra, P. 2005. “What happens when teachers design educational technology? The development of technological pedagogical content knowledge,” Journal of educational computing research (32:2), pp. 131–152.
Kokkelenberg, E. C., Dillon, M., and Christy, S. M. 2008. “The effects of class size on student grades at a public university,” Economics of Education Review (27:2), pp. 221–233.
Kuh, G. D., Douglas, K. B., Lund, J. P., and Ramin Gyarnek, J. 1994. “Student Learning Outside the Classroom: Transcending Artificial Boundaries. ASHE-ERIC Higher Education Report No. 8.” ().
Lambiotte, R., Delvenne, J.-C., and Barahona, M. 2008. “Laplacian dynamics and multiscale modular structure in networks,” arXiv preprint arXiv:0812.1770 ().
Long, M. H. and Porter, P. A. 1985. “Group work, interlanguage talk, and second language acquisition,” TESOL quarterly (19:2), pp. 207–228.
Malloy, J. 1954. “An investigator of scholastic over-and under-achievement among female college freshmen.” Journal of Counseling Psychology (1:4), p. 260.
Mello, J. A. 1993. “Improving individual member accountability in small work group settings,” Journal of management Education (17:2), pp. 253–259.
Mishra, P. and Koehler, M. 2006. “Technological pedagogical content knowledge: A framework for teacher knowledge,” The Teachers College Record (108:6), pp. 1017–1054.
Mislove, A., Marcon, M., Gummadi, K. P., Druschel, P., and Bhattacharjee, B. 2007. “Measurement and analysis of online social networks,” in Proceedings of the 7th ACM SIGCOMM conference on Internet measurement, ACM, pp. 29–42.
Mitchell, S. N., Reilly, R., Bramwell, F. G., Solnosky, A., and Lilly, F. 2004. “Friendship and choosing groupmates: Preferences for teacher-selected vs. student-selected groupings in high school science classes,” Journal of Instructional Psychology (31:1), p. 20.

Kallookaran et al. /Assess and promote students’ group cohesion
The 12th Mediterranean Conference on Information Systems (MCIS), Corfu, Greece, 2018 14
Nicol, D. J. and Boyle, J. T. 2003. “Peer instruction versus class-wide discussion in large classes: a comparison of two interaction methods in the wired classroom,” Studies in Higher Education (28:4), pp. 457–473.
Pantages, T. J. and Creedon, C. F. 1978. “Studies of college attrition: 1950–1975,” Review of educa-tional research (48:1), pp. 49–101.
Pearson, C. M., Andersson, L. M., and Wegner, J. W. 2001. “When workers flout convention: A study of workplace incivility,” Human Relations (54:11), pp. 1387–1419.
Peffers, K., Tuunanen, T., Rothenberger, M. A., and Chatterjee, S. 2007. “A design science research methodology for information systems research,” Journal of management information systems (24:3), pp. 45–77.
Reffay, C. and Chanier, T. 2003. “How social network analysis can help to measure cohesion in collab-orative distance-learning,” in Designing for change in networked learning environments, Springer, pp. 343–352.
Rubin, M. 2012. Social class differences in social integration among students in higher education: A meta- analysis and recommendations for future research.
Sievers, M., Reinhardt, W., Kundisch, D., and Herrmann, P. 2012. “Developing Electronic Classroom Response Apps for a Wide Variety of Mobile Devices: Lessons Learned from the PINGO project.” in mLearn, vol. 955, pp. 248–251.
Spady, W. G. 1970. “Dropouts from higher education: An interdisciplinary review and synthesis,” Inter- change (1:1), pp. 64–85.
Tarjan, R. 1972. “Depth-first search and linear graph algorithms,” SIAM journal on computing (1:2), pp. 146– 160.
Terenzini, P. T. and Pascarella, E. T. 1977. “Voluntary freshman attrition and patterns of social and academic integration in a university: A test of a conceptual model,” Research in Higher Education (6:1), pp. 25–43. Tinto, V. 1993. Leaving College: Rethinking the Causes and Cures of Student At-trition, University of Chicago Press.
Tinto, V. 1975. “Dropout from higher education: A theoretical synthesis of recent research,” Review of educational research (45:1), pp. 89–125.
Tinto, V. 1987. Leaving college: Rethinking the causes and cures of student attrition. ERIC. Tinto, V. 2006. “Research and practice of student retention: What next?,” Journal of College Student
Retention: Research, Theory & Practice (8:1), pp. 1–19. Tinto, V. 2010. “From theory to action: Exploring the institutional conditions for student retention,” in
Higher education: Handbook of theory and research, Springer, pp. 51–89. Tinto, V. 2012. Completing college: Rethinking institutional action, University of Chicago Press. Vygotsky, L. 1978. “Mind in Society. The Development of Higher Psychological Processes,” (). Ward, A. and Jenkins, A. 1992. “The problems of learning and teaching in large classes,” Teaching
Large Classes in Higher Education: How to Maintain Quality with Reduced Resources (), p. 23. Zhang, S. and Fulford, C. P. 1994. “Are Interaction Time and Psychological Interactivity the Same
Thing in the Distance Learning Television Classroom?.” Educational Technology (34:6), pp. 58–64. Zirkin, B. and Sumler, D. 1995. “Interactive or Non-interactive?: That Is the Question!!!,” International
Journal of E-Learning & Distance Education (10:1), pp. 95–112.


