ASPIRES Family Care
42
ASPIRES Family Care Summary Research Report
Transcript of ASPIRES Family Care

ASPIRES Family Care
Summary Research Report

ASPIRES Family Care 2 Summary Research Report
September 2019
Emily Namey & Lisa Laumann
This publication was prepared by the FHI 360-managed ASPIRES project. Find out more about ASPIRES at http://www.fhi360.org/projects/accelerating-strategies-practical-innovation-and-research-economic-strengthening-aspires. For comments or queries regarding this publication, please contact us at [email protected].
This report was produced under United States Agency for International Development (USAID) Cooperative Agreement No. AID-OAA-LA-13-00001 and was made possible by the generous support of the American people through USAID. The contents are the responsibility of FHI 360 and do not necessarily reflect the views of USAID or the United States Government.
ASPIRES Family Care
Summary Research Report

ASPIRES Family Care 3 Summary Research Report
Table of Contents ACKNOWLEDGMENTS .............................................................................................................. 5
EXECUTIVE SUMMARY ............................................................................................................. 6
Background .............................................................................................................................. 6
Methods .................................................................................................................................... 6
Findings .................................................................................................................................... 7
Drivers of separation ............................................................................................................ 7
Economic well-being, family well-being, and child protection indicators for at-risk households............................................................................................................................ 7
Economic well-being, family well-being, and child protection indicators for reintegrating households............................................................................................................................ 8
Child-level effects of integrated programming ..................................................................... 9
Discussion ................................................................................................................................ 9
INTRODUCTION........................................................................................................................ 10
Theory of change ................................................................................................................... 10
Figure 1. Factors driving risk of child separation ............................................................... 11
FARE project background ...................................................................................................... 11
Table 1. Activities included in FARE’s economic strengthening strategy ......................... 12
ESFAM project background ................................................................................................... 13
Figure 2. FARE and ESFAM implementation areas .......................................................... 13
Table 2. Activities included in ESFAM’s economic strengthening “packages”, assigned according to economic vulnerability status of household .................................................. 14
Summary of activities ............................................................................................................. 14
Figure 3. FARE and ESFAM activities linked to drivers of separation .............................. 15
METHODS ................................................................................................................................. 15
Sample selection .................................................................................................................... 16
Table 3. Qualitative research high level strata/targets for random sampling of Family Care beneficiary households .............................................................................................. 16
Data collection ........................................................................................................................ 16
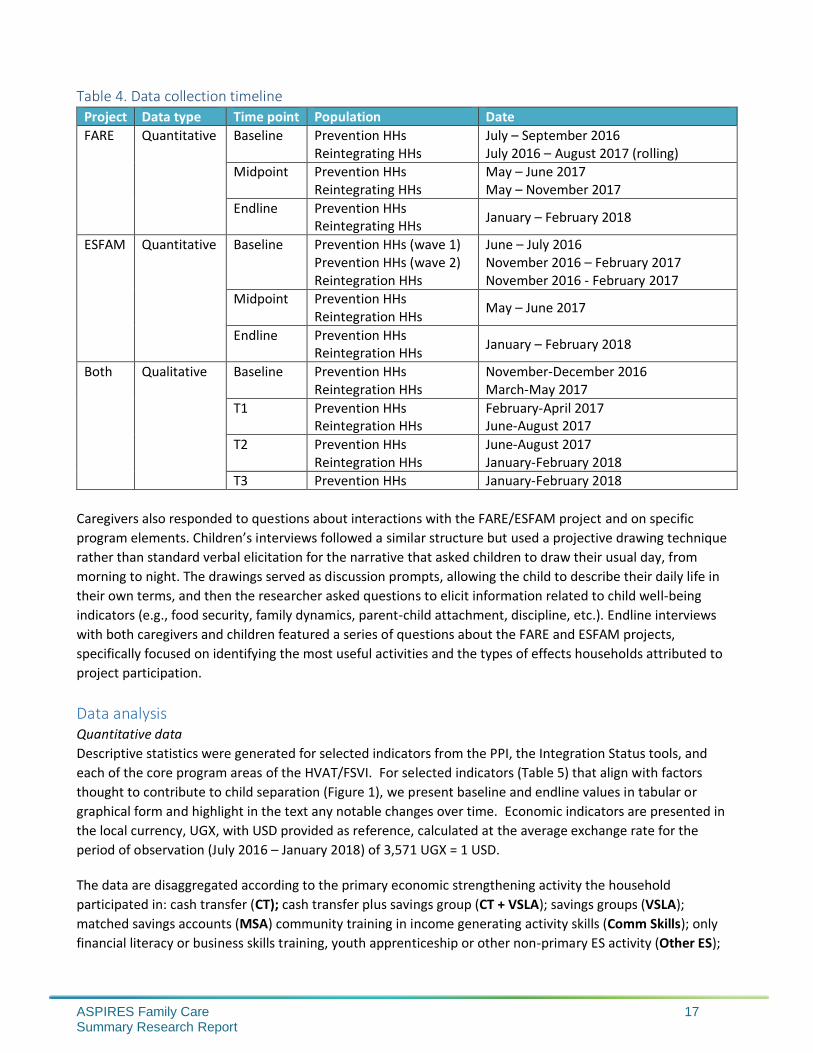
Table 4. Data collection timeline ........................................................................................ 17
Data analysis .......................................................................................................................... 17
Table 5. Selected quantitative indicators included in this report ....................................... 18
FINDINGS .................................................................................................................................. 19
Participant characteristics ...................................................................................................... 19
Family-perceived drivers of child separation ......................................................................... 19

ASPIRES Family Care 4 Summary Research Report
Table 6. Family Care participating household characteristics at baseline ........................ 20
Table 7. Qualitative sample characteristics at baseline, primary economic strengthening activity ................................................................................................................................. 21
Table 8. Drivers of child separation according to at-risk families (with illustrative quotes) ............................................................................................................................................ 22
Summary findings for at-risk households .............................................................................. 23
Economic well-being indicators .......................................................................................... 23
Table 9. At-risk households, summary of changes observed in key economic well-being indicators ............................................................................................................................. 24
Family/social well-being indicators ..................................................................................... 24
Table 10. At-risk households, summary of changes observed in key family and social well-being indicators ........................................................................................................... 25
Child protection/separation indicators ................................................................................ 26
Table 11. At-risk households, summary of changes observed in child protection and separation indicators .......................................................................................................... 27
Summary findings for reintegrating households .................................................................... 27
Economic well-being indicators .......................................................................................... 27
Table 12. Reintegrating households, summary of changes observed in economic well-being indicators ................................................................................................................... 28
Family/social well-being indicators ..................................................................................... 29
Table 13. Reintegrating households, summary of changes observed in family/social well-being indicators ................................................................................................................... 30
Child protection/separation indicators ................................................................................ 30
Table 14. Reintegrating households, summary of changes observed in child protection and separation indicators ................................................................................................... 31
Participant reflections on project effects ................................................................................ 31
Effects of economic strengthening programming .............................................................. 31
Effects of family social support programming .................................................................... 33
Summary of child-level effects of FARE and ESFAM programming................................. 35
DISCUSSION ............................................................................................................................. 36
Limitations............................................................................................................................... 37
CONCLUSION ........................................................................................................................... 38
Annex I. Description of data collection tools ............................................................................. 39
Annex II. FARE Project - Summary of key indicators by ES Activity ....................................... 41
Annex III. ESFAM Project - Summary of key indicators by ES Activity .................................... 42

ASPIRES Family Care 5 Summary Research Report
ACKNOWLEDGMENTS
The authors would like to thank John Williamson and Jamie Gow at USAID’s Vulnerable Children Fund for their
guidance and support of the Family Care research process over the life of the project. Their technical review and
helpful comments on study documents, preliminary findings, and this report consistently focused the research
and strengthened the output. The authors also thank the FARE and ESFAM project teams for collaborating on
the design and implementation of the quantitative research, and the social and behavioral research team at
Rakai Health Sciences Program for fielding the qualitative research. The research skills and tireless efforts of
our Ugandan colleagues through several phases of data collection were foundational to this work.

ASPIRES Family Care 6 Summary Research Report
EXECUTIVE SUMMARY
Background
With support from USAID’s Vulnerable Children Fund (formerly Displaced Children and Orphans Fund - DCOF),
ASPIRES’ Family Care project focused on how economic strengthening (ES) interventions can help prevent
unnecessary separation of children from families as well as support the reintegration into family care of
children who were already separated. In particular, the project sought to assess how to match specific kinds of
economic strengthening activities to the capacities, limitations, and context of particular households, with the
aim of supporting the development of technical guidance to inform future programming.1 Through Family
Care, ASPIRES supported two learning projects in Uganda: the Family Resilience (FARE) project, implemented
by AVSI Foundation, and Economic Strengthening to Keep and Reintegrate Children in Family Care (ESFAM)
project, implemented by ChildFund.2 Both projects were intended to reach economically and socially
vulnerable families at risk of separation (prevention families) and those whose previously separated children
were returning to family care (reintegrating families). Implemented between late 2015 and early 2018, the
Family Care projects were based on the theory that a combination of case management, family social support
and household economic and livelihood strengthening would stabilize highly vulnerable households,
facilitating the return of separated children to family care or preventing children’s separation from their
families. FARE was implemented in more urban areas, where the cost of living and incomes are, on average,
higher than in the more rural areas where ESFAM was implemented.
ES activities across FARE and ESFAM included cash transfers (CT); cash transfers plus participation in a savings
group (CT + village savings and loan association, VSLA); savings groups (VSLA) without cash transfers; matched
savings accounts (MSA); community training in income generating activity skills (Comm Skills); only financial
literacy or business skills training, youth apprenticeship or other non-primary ES activity (Other ES); or no ES
for those who could not access or chose not to participate in any economic strengthening activities (No ES).
FARE cash transfers and all ESFAM ES activities were assigned based on the assessed level of household
poverty. In addition to these ES activities, all households received family support activities including, at a
minimum, case management and counselling by project social workers, and for many, training on parenting
skills for caregivers. Most households received Family Care interventions for a period of approximately 12 – 18
months, beginning in September 2016 and concluding in January-February 2018.
Methods Because ES activities should be matched to a household’s situation and because of uncertainty about when
and where households in the reintegration sample would be reunified, random assignment of ES activities to
households was not advisable or feasible within the Family Care research design. The Family Care team
therefore designed a mixed methods evaluation to be implemented alongside programming that included
longitudinal quantitative data collection with all participating FARE and ESFAM households (N=1305) at three
time points to assess a range of indicators related to household economic and family well-being. Descriptive
statistics were generated at baseline and endline for more than 20 outcome variables selected from across the
domains of economic well-being, social/family well-being, and child protection. Changes in the average or
distribution of responses were calculated and tests of statistical significance were performed, as appropriate.
1 See Meeting the Costs of Family Care: Household Economic Strengthening to Prevent Children’s Separation and Support Reintegration , A Resource Guide. 2 Originally, Family Care sought project proposals from both Latin America/the Caribbean and Africa; however, the strongest proposals received were both from Uganda.

ASPIRES Family Care 7 Summary Research Report
The data are disaggregated according to separation status (at-risk or reintegrating) and the primary economic
strengthening activity the household participated in. Additionally, the research design included in-depth,
longitudinal qualitative research to help understand how (well), from participants’ perspectives, the FARE and
ESFAM interventions aligned with perceived drivers of separation and families’ experienced child-level effects
of programming.
Findings
Drivers of separation Caregivers and children in the qualitative research provided remarkably similar descriptions of key drivers of
child separation across the FARE and ESFAM contexts and between at-risk and reintegrating families. The three
factors most commonly identified as driving child separation were parental behaviors, caregiver inability to
meet children’s basic needs, and children’s behavior (which was often related to caregiver behavior).
Economic well-being, family well-being, and child protection indicators for at-risk households At baseline, the estimated poverty rate of the urban households at risk of family-child separation participating
in FARE (n=350) was 44% at the USD 2.00/day poverty threshold; this fell to about 41% at endline. On specific
indicators of economic vulnerability, overall the FARE at-risk households showed improvement at endline, as
indicated by increases in:
• median household income (from roughly USD 24 per month to USD 42);
• the proportion of households able to consistently pay for basic needs (48% to 65%);
• the proportion of households typically eating two or more meals per day (47% to 72%); and
• the proportion of households with adequate shelter for their families (59% to 75%).
These reductions in economic vulnerability were generally accompanied by:
• reductions in the proportion of households with out-of-school youth,
• reductions in reported child protection issues and use of harsh discipline practices; and
• improvements in caregiver access to emotional and material support.
The observed rate of child separation at endline among all FARE at-risk households was 3% (10 separations
recorded across 292 households at endline), compared to a baseline rate of 7%. The endline separation rate
for at-risk households that participated in VSLA (2%) was slightly less than the overall average, while among
the more vulnerable CT+VSLA group the child separation rate at endline was 14% (5 of 36 households). This
was consistent with the finding that while the CT+VSLA group showed the greatest magnitude of change on
many economic indicators, the relative economic vulnerability of these households persisted, and they
continued to have lower educational engagement of children than the VSLA group.
A comparison of baseline characteristics of FARE at-risk households that did and did not experience a child
separation at endline identified statistically significant differences (at p≤0.05) in the education level of the
head of household, family shelter status, and availability of caregiver emotional support, all of which were
lower among households that reported a child separation.
The more rural at-risk households selected for enrollment in ESFAM (n=611) were extremely economically
vulnerable. At baseline, the estimated poverty rate for this sample was 71% at the USD 2.00/day threshold. At
endline, 67% of the beneficiary households were still likely to be living below the USD 2.00/day poverty
threshold, yet the aggregate sample recorded improvements (most statistically significant) across a range of
economic and well-being indicators, including increases in:

ASPIRES Family Care 8 Summary Research Report
• median household income (from roughly USD 8 to USD 17);
• the proportion of households able to consistently pay for basic needs (23% to 61%);
• the proportion of households typically eating two or more meals per day (42% to 83%);
• the proportion of households with adequate shelter (42% to 84%);
• the proportion of households with all children attending school regularly (55% to 77%); and
• the proportion of families where no child protection issues were suspected or observed (40% to 74%).
These changes were accompanied by overall improvements in child protection concerns, as indicated by a
reduction in the percentage of households with a child living outside of family care and in reported use of most
harsh discipline practices.
The observed rate of child separations at endline among all ESFAM at-risk households was 7% (37 separations
recorded across 569 households at endline), compared to a baseline rate of 13%. The highest rate of
separation for at-risk households was recorded among those in the VSLA-only group (14%), while the lowest
rates were recorded by the Other ES and cash transfer groups. A comparison of the baseline characteristics of
households that did and did not experience a separation at endline yielded a few statistically significant
differences (at p ≤.05). Among at-risk households, baseline values for ability to pay for food in the past three
months were significantly lower for households that recorded a child separation. And, counterintuitively,
households that experienced a separation had more adequate shelter than households that did not report a
child separation.
Economic well-being, family well-being, and child protection indicators for reintegrating households The reintegrating households enrolled in FARE (n=205) were more diverse than the project’s at-risk
households, in terms of their locations, range and types of vulnerability, and the economic strengthening
activities they could access. Notably, half of this sample was not able to access or chose not to participate in
any economic strengthening activities. Overall, the FARE reintegrating households compared to prevention
households recorded relatively higher incomes at baseline coupled with relatively good shelter and food
security, with only modest changes at endline in:
• median household income (from roughly USD 28 to USD 34);
• the proportion of households typically eating at least two meals per day (76% to 80%); and
• the proportion of households with adequate shelter (75% to 80%).
Despite being relatively less economically vulnerable than prevention households, at both baseline and
endline, the aggregate FARE reintegration sample recorded a lower proportion of households able to
consistently pay for basic needs than the at-risk sample. The proportion of reintegrating households with all
children regularly attending school remained fairly low (43% to 45%). Reintegrating households also reported
varied changes in the presence of child protection concerns and harsh discipline practices, with some
improvements and some areas of concern across sub-groups. For example, the proportion of households
reporting neglect rose slightly from 17% to 20% in the aggregate sample, driven by increases among Cash
Transfer, Other ES, and No ES groups. The overall sample also recorded a slight increase in child labor (from
11% to 13%), reflecting increases in the Cash Transfer and Community Skills groups. Together, these findings
suggest that factors in addition to (or other than) economic circumstances may have contributed to the
original separation of children from some proportion of these households.
The average separation rate across FARE reintegrating families at endline was higher (16%) than among at-risk
households (3%). Among reintegrating households, the separation rate was highest among households that did
not receive/participate in economic strengthening activities (18%) and lowest among Other ES recipient

ASPIRES Family Care 9 Summary Research Report
households (12%). Across the reintegration sample, households that experienced a separation had statistically
significantly (at p ≤.05) lower baseline values for education level of the head of household and level of regular
school attendance by children in the household.
Households in the ESFAM reintegration sample (n=89) were less economically vulnerable at baseline compared
to the ESFAM at-risk sample, with an estimated baseline poverty rate of 59% at the USD 2.00/day poverty
threshold. The aggregate sample for reintegration households recorded improvements (some statistically
significant) across a range of economic and well-being indicators, including increases in:
• median household income (from roughly USD 8 to USD 15);
• the proportion of households able to consistently pay for basic needs (30% to 44%);
• the proportion of households typically eating two or more meals per day (56% to 88%);
• the proportion of households with adequate shelter (37% to 83%);
• the proportion of households with all children attending school regularly (74% to 81%); and
• the proportion of families where no child protection issues were suspected or observed (23% to 68%).
Across the ESFAM reintegration sample, the most vulnerable households that received CT+VSLA registered the
most consistent pattern of positive changes, followed by the next most vulnerable group, those provided
MSAs. The VSLA and Other ES groups for this sample were too small (n=11) for meaningful interpretation of
findings.
The observed rate of child separations at endline among all ESFAM reintegrating households was 7% (6
separations reported across 88 families). Differences in sample sizes across sub-groups make comparison of
separation rates tenuous, but the highest rate of separation among reintegrating households was for the MSA
group (15%). A comparison of the baseline characteristics of households showed higher rates of male-headed
households (at p ≤.05) among families that had recorded a child separation at endline.
Child-level effects of integrated programming
Finally, qualitative data provided rich examples of the child-level effects of economic and family strengthening
programming for FARE and ESFAM households. Caregivers described how economic strengthening activities
(CT, VSLA, MSA) directly affected children in their households through spending on school fees, scholastic
materials, food, and medical care for children. Financial literacy and business skills trainings were linked
indirectly to child-level effects through caregiver ability to budget, increased caregiver motivation to prioritize
education, and increased household income through increased success with a business. To family support
interventions (e.g., regular visits from a (para)social worker or case manager and parenting skills training),
caregivers attributed improved caregiver-child relationships built on improved communication, less use of
harsh punishment, and an increase in child respect and attitudes.
Discussion While it is not possible quantitatively to tease out attribution of specific outcomes to specific activities, the
general improvement of at-risk households across indicators of economic status, family and social well-being,
and child protection for most categories of participants suggests that economic strengthening activities do
have a role to play in preventing family separation. The qualitative data corroborate this finding. These trends
were present but less clear for the reintegrating families, particularly those in urban households reintegrating a
child from the streets or the juvenile justice system; among these households economic vulnerability may be
secondary to family dynamics, caregiver behavior, and social conditions (e.g., stigma). Both of these findings
reinforce the necessity of determining whether, which, and when economic strengthening activities may best
address a family’s immediate and longer-term needs in support of keeping children in family care.

ASPIRES Family Care 10 Summary Research Report
INTRODUCTION The Accelerating Strategies for Practical Innovation & Research in Economic Strengthening (ASPIRES) project,
funded by PEPFAR and USAID and managed by FHI 360, was designed to support gender-sensitive
programming, research and learning to improve the economic security of highly vulnerable individuals, families
and children. The ASPIRES mandate included designing and implementing rigorous research to evaluate
programs and inform a new understanding of best practices in economic strengthening (ES) for vulnerable
populations. With support from USAID’s Vulnerable Children Fund (formerly Displaced Children and Orphans
Fund - DCOF), ASPIRES’ Family Care project focused on how ES interventions can help children remain in family
care rather than separating to residential care facilities, living on the street, or migrating for work. Keeping
families together reduces children’s risk of neglect, abuse and exploitation and increases the likelihood that
they will experience positive physical and mental health outcomes.
Through Family Care, ASPIRES sponsored two learning projects in Uganda intended to reach economically and
socially vulnerable families at risk of separation or whose previously separated children were returning to
family care. The Family Resilience (FARE) project, implemented by AVSI Foundation, and Economic
Strengthening to Keep and Reintegrate Children in Family Care (ESFAM) project, implemented by ChildFund,
offered a range of services to increase family stability and reduce the likelihood of future separation or re-
separation. Both projects were based on the theory that a combination of case management, social support
and household economic and livelihood strengthening would stabilize highly vulnerable households,
facilitating the return of separated children to family care or preventing children’s separation from their
families. FARE was implemented in more urban areas, where the cost of living and incomes are, on average,
higher than in the more rural areas where ESFAM was implemented.
Theory of change Both FARE and ESFAM were based on an understanding, from practice wisdom and the literature, that a
combination of economic, social, and structural issues contribute to family-child separation, in ways that likely
differ for every family (Figure 1). Interventions, therefore, should be aligned to the specific needs of a
household. The projects’ theory of change posited that tailored ES activities along with case managed family
support activities should reduce drivers of separation and make families more resilient, which would reduce
child separation and support child reintegration.

ASPIRES Family Care 11 Summary Research Report
Figure 1. Factors driving risk of child separation
FARE project background The Family Resilience (FARE) learning project was led by AVSI Foundation in collaboration with Retrak and in
association with Companionship of Works Association (COWA) and Fruits of Charity Foundation (FCF). FARE
was implemented in the urban and peri-urban areas of Kampala Capital City and Wakiso District.
FARE selected targeted areas within each geographical division based on data provided by project partners and
the Ugandan government’s Kampiringisa National Rehabilitation Centre that suggested these areas had higher
levels of family-child separation than others. In these areas, FARE selected nine parishes in which to identify
project beneficiary families at risk of separation and implement prevention of family-child separation
programming, based on the recommendation of the local Community Development Officers (CDOs), district
and sub-county leadership, police, and available partner data (there was no official data on incidence of family-
child separation). FARE worked across Kampala and Wakiso to support families accepting children for
reintegration.
The project had planned to reach 350 households at risk of separation and support 300 reunified children and
their families. The identification of families at risk of separation for inclusion in FARE was based on a process
that involved initial identification and pre-screening against specific vulnerability criteria by members of Local
Councils. These criteria were drawn from a Government of Uganda pre-screening tool used in orphans and
vulnerable children (OVC) programming, with additional indicators thought to be associated with risk of family-
child separation. In a second step, FARE staff further screened and verified families’ eligibility using a brief
Household Vulnerability Prioritization Tool, again adapted from a Government of Uganda tool. The project thus
identified 350 at-risk families in four target sub-counties/divisions.
The process for identifying separated children who might be reunified with their families involved several
coordinating partners, namely Naguru Remand Home, Home (a juvenile detention facility) in collaboration
with COWA, three Retrak drop-in/rehabilitation centers for street children, and FCF’s center for street children

ASPIRES Family Care 12 Summary Research Report
and other separated children. FARE also received referrals of separated children by police or para-social
workers. FARE’s three implementing partners (Retrak, COWA, FCF) had direct access to these children on a
daily basis by virtue of their work and helped to identify those who were eligible: children below 18 years from
Kampala or Wakiso who had separated from their families and were interested in returning to family care.
Children who met these criteria were taken into care, assessed using the Child Needs Assessment Tool, and
supported to create a Child Development Plan. Ultimately, between January 2016 and August 2017, FARE
reunified and enrolled into the project 268 children from 255 families across 19 sub-counties in the two target
districts.3
AVSI estimated that 10-15% of project beneficiaries would be classified as in need of consumption smoothing
through direct cash transfers. However, analysis of the baseline economic vulnerability data indicated that
over 40% of at-risk households were living on less than USD $2 per day, which was more than the project was
financially able to assist. FARE therefore selected 80 families (13%) assessed to be at greatest economic
vulnerability to receive the cash transfers. All other households were offered a selection of the other ES
activities (Table 1), as feasible given a household’s location and situation.
Table 1. Activities included in FARE’s economic strengthening strategy
Economic activity
Description
Cash transfers (CT)
Monthly transfer of UGX 70,000 (~USD 20) for six months via mobile money payment. Prior to receipt of CT, all households were trained in selection, planning, and management of enterprises. CT was followed by VSLA participation for many families.
Savings groups (VSLA)
Village Savings and Loans Associations were formed around project families and included non-project community members. Most VSLA groups were also trained in microenterprise selection, planning, and management in the last quarter of the project. (Predominantly an option for at-risk families that were concentrated in certain geographic areas; the scattered nature of reintegrating households limited the availability of this option for most of them.)
Community skills (Comm skills)
Community skills were short, practical hands-on trainings to promote production of marketable goods (e.g., student copy books or a local millet drink).
Other ES This included apprenticeship training for youth, or ad hoc support to households for educational expenses in the absence of any of the activities above.
In addition to these ES activities, all households received social and family support activities including, at a
minimum, home visiting and counselling by project social workers, and for many, training on parenting skills
for caregivers, training in life skills and interactive dialogues for adolescents, community dialogues on topics of
interest, and/or recreational activities aimed at promoting psychosocial well-being and fostering a sense of
community. Across all activities, FARE found variable interest and availability of participating households; some
families engaged in all activities and participated throughout the life of the project, while others chose more
limited and/or sporadic participation.
3 Further description of the household identification, screening, and enrolment process is available in the FARE Project final report.

ASPIRES Family Care 13 Summary Research Report
ESFAM project background The ESFAM project was implemented by ChildFund in Gulu, Luwero and Kamuli districts of Uganda, with
reintegration support provided to families in Jinja district as well. The three ESFAM implementation districts
for at-risk households were shared with a pre-existing DCOF-funded project led by ChildFund called
Deinstitutionalization of Orphans and Vulnerable Children in Uganda (DOVCU). DOVCU selected these districts
based on assessment that these areas exhibited a high incidence of family-child separation, high numbers of
children in child care institutions (CCIs) and were some of the top districts for “supplying” children to CCIs in
other districts.
The project had planned to reach 350 households at risk of separation and support 350 reunified children and
their families. The initial identification of families at risk of separation for inclusion in ESFAM was conducted as
a part of the DOVCU project; in DOVCU target districts, DOVCU staff facilitated a participatory rapid appraisal
(PRA) exercise at the community level to identify families likely to be at risk of family-child separation. These
families were subsequently assessed at the household level using DOVCU’s Family Status Vulnerability Index
(FSVI) tool to determine eligibility for DOVCU. DOVCU provided to ESFAM information on families it did not
have the capacity to support.
ChildFund had planned that DOVCU would refer some families reunified under DOVCU to ESFAM. By
September 2016, however, it became clear that DOVCU could not transfer families to ESFAM and still meet its
own targets. Instead, ESFAM and DOVCU worked together with twelve CCIs in the three targeted districts to
identify children in those institutions that had either returned to family care without preparation of the
children/family or were preparing to return to family care in the near future. As a result, the project enrolled
89 of these children and families who were reunified by CCIs between December 2015 and February 2017. To
reach its total enrollment target, ESFAM then increased its at-risk-of-separation target to 611 households. An
additional caseload of 261 households at risk of
separation was obtained through a residual caseload
that the DOVCU project was unable to serve, as well
as through a new participatory rural appraisal process
carried out by the ESFAM project to validate and
identify more families at risk of separation for
inclusion in the project. The project used the FSVI tool
(described below) to assess and enroll the additional
households in November and December 2016.4
Ultimately, ESFAM participants included 611 families
in the “prevention” arm of the project who were
assessed to be at risk of family-child separation and 89
families in the “reintegration” arm of the project who
had a child who had already returned or who was
returning to the household from a child care
institution.
Once enrolled in the project, all families were
connected with a community-based para-social
worker who conducted case management activities,
including assessment of family well-being and needs,
4 Further description of the household identification, screening, and enrolment process is available in the ESFAM Project final report.
Figure 2. FARE and ESFAM implementation areas

ASPIRES Family Care 14 Summary Research Report
development of household plans, and monthly or quarterly family visits/monitoring. All households also
participated in a formal baseline data collection process that helped to identify the most economically
vulnerable families (described in Methods). The ESFAM team used data from the baseline FSVI assessment to
classify target households.
The most vulnerable (destitute) households were offered a series of ES activities anchored around a structured, time-limited unconditional cash transfer (CT), after which households could choose to join a savings group (VSLA) if accessible. The next most vulnerable group (Struggling 1) was offered a series of ES activities focusing on matched savings accounts (MSA) for educational expenses, while the somewhat less vulnerable (Struggling 2) group’s package of ES activities was anchored around VSLA (Table 2).
In addition to these ES activities, all ESFAM households received social support services from project para-social workers that included discussion of child protection issues, prevention, and response; positive parenting skills development for caregivers; and psycho-social support to strengthen coping skills and hope for families struggling with a range of social and emotional challenges.
Table 2. Activities included in ESFAM’s economic strengthening “packages”, assigned according to
economic vulnerability status of household
Economic status Economic Strengthening Interventions
Most vulnerable (Destitute)
Household financial literacy training + cash transfer (CT) + (for some) village-based lending and saving association (VSLA) + group-based business skills training + economic and social coaching at home.
Highly vulnerable (Struggling 1)
Household financial training + matched saving accounts at banks + business skills training at home + economic and social coaching at home.
Vulnerable (Struggling 2)
VSLA + group-based financial literacy and business skills training + economic and social coaching at home. (Predominantly for at-risk families; the scattered nature of reintegrating households made this option difficult to implement for them.)
Mixed Other ES: home-based financial literacy or business skills training and coaching only were provided for those who did not participate in the primary ES activity for their household’s classification
Summary of activities The family social support and economic strengthening activities offered by FARE and ESFAM were selected
based on an understanding of the drivers of separation and the theory of change for the projects. Figure 3
connects the project activities to family capacities and areas of need to illustrate conceptualized intervention
points.

ASPIRES Family Care 15 Summary Research Report
Figure 3. FARE and ESFAM activities linked to drivers of separation
METHODS In support of ASPIRES’ objective to assess the effects of different types of economic strengthening activities
integrated with family support activities among targeted families, the Family Care project designed a mixed
method evaluation to be implemented alongside programming.5 While a full-factorial (2x2) randomized control
trial (RCT) could help to isolate effects of separate project elements by comparing “family social support-only”
to “family social support plus (different) economic strengthening activities” to a control group that received
only the standard of care, the absence of a simple linear x-to-y-to-z causal pathway and the added complexity
of cross-sector factors affecting family-child separation generated a number of challenges to this type of
design. Further, there was limited evidence in support of any particular household ES intervention in this
context to justify selection of one economic intervention over another, and there were no estimates of
incidence of separation to inform estimations of statistical power. Contextual factors, such as the geographic
complexities of reintegrating children (research staff cannot control which children are ready for reunification,
or when or where), and logistical factors, such as limited staff experience implementing a combined family and
economic strengthening program, were also considered. Based on these challenges, along with time and
resource constraints, the study team ruled out a factorial RCT design. Instead, the focus from the beginning
was on building an evaluation framework that would generate robust data to address programmatic learning
needs while filling in some of the evidence gaps.
5 A more detailed description of the overall research design is accessible here. Namey, E., Laumann, L.C., Brown, A.N. Learning about integrated development using longitudinal mixed methods programme evaluation. IDS Bulletin 49 (4). 2018.

ASPIRES Family Care 16 Summary Research Report
This evaluation therefore examines descriptively, rather than measures, the beneficiary-level outcomes related
to the project theory of change. Additionally, a local research team led by Rakai Health Sciences Program was
contracted by the Family Care project to conduct in-depth longitudinal qualitative research to help understand
how (well), from participants’ perspectives, the FARE and ESFAM interventions aligned with perceived drivers
of separation and families’ experienced effects on economic and social family well-being. The findings
presented in this report are derived from the longitudinal descriptive data generated as part of the evaluation
design.
Sample selection Sampling for the quantitative research followed a census approach: all FARE and ESFAM households
(approximately 1,305) were eligible and were enrolled in the study after providing consent. For the qualitative
research, we used a stratified random
quota sampling strategy to select 16
households per implementation district,
as described in Table 3. Within each
district and category (reintegration or at
risk) we attempted to select
approximately equal numbers of
families by economic status and, for
ESFAM, by economic strengthening
activity assigned. Within the designated
strata, we used random sampling to
maximize the diversity of other
characteristics of households in the sample (e.g., gender, age of index child, disability status). For each selected
household, the primary caregiver and one index child between 8 and 17 years of age was invited to enroll in
the study.
Data collection Quantitative data collection was carried out at three time points throughout the project (see Table 4 for
detailed timeline).6 FARE staff performed quantitative data collection in the course of their regularly scheduled
visits with households. ESFAM hired and trained consultant data collectors (8-10 per district) to conduct
quantitative data collection. Endline data were collected for all FARE and ESFAM households in January and
February 2018, following 12 – 18 months of activity implementation. At all timepoints, data were collected
using a vulnerability assessment tool (the Household Vulnerability Assessment Tool [HVAT] for FARE and the
Family Status Vulnerability Index [FSVI] for ESFAM), the Uganda Progress out of Poverty Index (PPI), a Caregiver
Integration Status Tool and a Child Integration Status Tool. The Annex provides greater detail on each tool.
The Rakai Health Sciences Program team carried out the qualitative data collection activities at four time
points (Table 4) for at-risk households and at three time points among reintegrating households. Each
caregiver interview began with a narrative “daily snapshot” comprising a description of the life in the
household according to series of prompts. At each subsequent visit, the previously collected snapshot served
as a reference, and the caregiver was asked to reflect on whether HH dynamics and HH economics had
improved or declined and to what they attributed any changes.
6 To simplify quantitative data reporting, midline findings are not presented here.
Table 3. Qualitative research high level strata/targets for random sampling of Family Care beneficiary households Reintegration At Risk TOTAL
FARE N = 16 N = 16 N = 32
Wakiso 8 8 16
Kampala 8 8 16 ESFAM N = 24 N = 24 N=48
Gulu 8 8 16
Luwero 8 8 16
Kamuli 8 8 16 TOTAL N=40 N=40 N=80
ASPIRES Family Care 17 Summary Research Report
Table 4. Data collection timeline
Project Data type Time point Population Date
FARE
Quantitative
Baseline Prevention HHs Reintegrating HHs
July – September 2016 July 2016 – August 2017 (rolling)
Midpoint Prevention HHs Reintegrating HHs
May – June 2017 May – November 2017
Endline Prevention HHs Reintegrating HHs
January – February 2018
ESFAM
Quantitative Baseline Prevention HHs (wave 1) Prevention HHs (wave 2) Reintegration HHs
June – July 2016 November 2016 – February 2017 November 2016 - February 2017
Midpoint Prevention HHs Reintegration HHs
May – June 2017
Endline Prevention HHs Reintegration HHs
January – February 2018
Both Qualitative Baseline Prevention HHs Reintegration HHs
November-December 2016 March-May 2017
T1 Prevention HHs Reintegration HHs
February-April 2017 June-August 2017
T2 Prevention HHs Reintegration HHs
June-August 2017 January-February 2018
T3 Prevention HHs January-February 2018
Caregivers also responded to questions about interactions with the FARE/ESFAM project and on specific
program elements. Children’s interviews followed a similar structure but used a projective drawing technique
rather than standard verbal elicitation for the narrative that asked children to draw their usual day, from
morning to night. The drawings served as discussion prompts, allowing the child to describe their daily life in
their own terms, and then the researcher asked questions to elicit information related to child well-being
indicators (e.g., food security, family dynamics, parent-child attachment, discipline, etc.). Endline interviews
with both caregivers and children featured a series of questions about the FARE and ESFAM projects,
specifically focused on identifying the most useful activities and the types of effects households attributed to
project participation.
Data analysis Quantitative data
Descriptive statistics were generated for selected indicators from the PPI, the Integration Status tools, and
each of the core program areas of the HVAT/FSVI. For selected indicators (Table 5) that align with factors
thought to contribute to child separation (Figure 1), we present baseline and endline values in tabular or
graphical form and highlight in the text any notable changes over time. Economic indicators are presented in
the local currency, UGX, with USD provided as reference, calculated at the average exchange rate for the
period of observation (July 2016 – January 2018) of 3,571 UGX = 1 USD.
The data are disaggregated according to the primary economic strengthening activity the household
participated in: cash transfer (CT); cash transfer plus savings group (CT + VSLA); savings groups (VSLA);
matched savings accounts (MSA) community training in income generating activity skills (Comm Skills); only
financial literacy or business skills training, youth apprenticeship or other non-primary ES activity (Other ES);

ASPIRES Family Care 18 Summary Research Report
and those who could not access or chose not to participate in any economic strengthening activities (No ES).
Note that in each data table, column headers indicate the number of households responding in the complete
sample or sub-sample and the denominators used to calculate cell values have been adjusted accordingly7.
To test for statistical significance, we used paired t-tests for continuous data and chi-squared tests (or Fisher’s
exact tests as appropriate) for categorical variables. Results that are statistically significant at the p ≤ 0.05 level
with 95% confidence intervals are indicated with an asterisk (*). Tests of statistical significance were not
performed on disaggregated data with a sample size of 30 respondents or less. Additionally, we were unable to
run statistical significance tests on some variables given their construction; these are marked in the tables with
a ^ symbol.
Table 5. Selected quantitative indicators included in this report
Economic well-being Family/social well-being Child protection concerns/separation
Median monthly income Ability to pay for basic needs Food security Shelter
Regular school attendance Caregiver social support Child integration Caregiver integration
Use of harsh discipline practices Child abuse/neglect/labor Children living outside of family care Child separations
Qualitative data
Life snapshot narrative discussions with caregivers and children were audio-recorded, transcribed verbatim,
and translated into English by the local research team. The remaining questions and discussion were
documented on a structured debriefing form for interviewers to complete following each interview, using the
digital audio recording as reference to capture key quotes. Narratives and debriefing notes were coded
according to a master codebook using NVivo 12, with structural codes to tag content areas (questions/topics),
and content codes to represent and tag emergent themes. Coding reliability was assessed through periodic
inter-coder agreement checks; coding discrepancies were resolved through discussion and modifications made
to the codebook as necessary. Data summaries were developed by pulling data from sections of the interview
that corresponded to specific research questions.8 The data presented here focus on two main questions:
1. How do FARE and ESFAM households characterize drivers of family-child separation? What do they see
as the factors that lead to children living in child care institutions, on the streets, or in remand centers?
2. What do FARE and ESFAM caregivers experience as child-level outcomes of integrated economic and
family strengthening activities?
Data responsive to these questions are summarized descriptively to explain the concept or theme, with code
frequencies where appropriate as an indication of relative saliency of a particular theme, and with exemplary
quotes to illustrate the participants’ meaning(s).
7 We exclude from the tables the few sub-groups with extremely small sample sizes: FARE at-risk Other ES (n=6); ESFAM at-risk No ES
(n=18 at endline); ESFAM reintegrating CT-only (n=5) and No ES (n=4). There was also considerable loss to follow-up in the FARE at-risk No ES households (n=119 at baseline, n=65 at endline), which should be considered in interpretations.
8 Additional qualitative analysis describing caregivers’ experiences with different ES interventions is included in the ASPIRES Family Care Qualitative Research Report.

ASPIRES Family Care 19 Summary Research Report
FINDINGS Findings from the Family Care research are presented in five main sections: Participant Characteristics, Drivers
of Child Separation, Summary Findings for At-Risk Households, Summary Findings for Reintegrating
Households, and Participant Reflections on Project Effects. Each of the two summary findings sections covers
economic well-being indicators, family/social well-being indicators, and child protection/separation indicators.
Participant characteristics As stated, all willing FARE and ESFAM project participants were included in the Family Care research and had a
baseline assessment completed (Table 6). Comparing the two projects’ samples of families at risk of
separation, more FARE households were led by women (83%) and FARE households had, on average, more
adults and more non-biological children in the household and more families that reported use of harsh
discipline practices. FARE households reported greater average ability to pay for basic needs at baseline than
ESFAM households, but a greater proportion of ESFAM households reported having all children attending
school regularly. Key differences between the two projects’ samples of reintegrating households (beyond the
sample size) were the education level of the household head (lower for ESFAM), and again, FARE households
had, on average, more adults and more non-biological children in the household while a greater proportion of
ESFAM households reported having all children attending school regularly. Ability to pay for basic needs was
relatively similar between the two samples of reintegrating families, as was use of harsh discipline practices.
The qualitative sample (Table 7) was generally reflective of these trends in the aggregate sample.
Family-perceived drivers of child separation Caregivers and children were asked the same question during endline qualitative interviews: “What do you
think are the main reasons that children are separated from their families and end up on the streets, in
remand homes, or in childcare institutions?” The responses to this open-ended question were similar across
the FARE and ESFAM contexts and between caregivers and children (Table 8, blue shading highlights most
common themes). The three most common factors identified as driving child separation were parental
behavior, caregiver inability to meet children’s basic needs (including education), and children’s behavior
(which was often related to caregiver behavior).
Comments about caregiver behavior focused generally on how caregivers treated children in the household,
both emotionally and physically. The topic of harsh discipline of children, the most frequently cited factor
within the category of caregiver behavior, was mentioned by about half of all caregivers and children and
included descriptions of how caregivers often physically beat, hit, or caned children when they’d done
something wrong. Mis-treatment of children by step-parents – assigning extra chores, withholding or limiting
food, and general lack of sympathy for non-biological children – was also commonly cited.
Economic scarcity was at the center of the driver related to caregiver inability to meet children’s basic needs.
Both caregivers and children noted lack of food as the primary factor contributing to child separation within
this category, but also cited lack of items like bedding, soap, school fees, and books. Issues of child behavior
were raised primarily by caregivers, and had three main components: general misbehavior and lack of respect
from children (which they attributed in most cases to poor parenting), children being out of school and
therefore idle, and relatedly, children becoming involved with unsavory peer groups. Children’s discussion of
child behavior as a factor contributing to child separation related mostly to child disobedience: children not
listening to their parents, not wanting to do house work, or not obeying family rules.

ASPIRES Family Care 20 Summary Research Report
Table 6. Family Care participating household characteristics at baseline
At-Risk Households Reintegrating Households
FARE ESFAM FARE ESFAM (N = 350) (N = 611) (N = 205) (N = 89)
Age of HH head
Mean (SD) 40.91 (12.17) 46.15 (15.57) 39.95 (10.60) 42.74 (12.49)
Female
Yes 289 (82.6%) 329 (55.1%) 114 (55.6%) 48 (56.5%)
Education of HH Head
None 52 (14.9%) 158 (26.1%) 14 (7.3%) 19 (22.1%)
Primary 198 (56.7%) 346 (57.2%) 106 (55.2%) 46 (53.5%)
Secondary and above 99 (28.4%) 101 (16.7%) 72 (37.5%) 21 (24.4%)
Marital Status of HH Head
Single 63 (18.0%) 21 (3.4%) 29 (14.3%) 7 (8.1%)
Married/Cohabitating 144 (41.1%) 334 (54.7%) 113 (55.7%) 41 (47.7%)
Widowed 62 (17.7%) 186 (30.4%) 26 (12.8%) 28 (32.6%)
Separated/divorced 81 (23.1%) 67 (11.0%) 35 (17.2%) 10 (11.6%)
NA (If a child) 0 (0.0%) 3 (0.5%) 0 (0.0%) 0 (0.0%)
N of adults in HH
Mean (SD) 2.32 (1.53) 1.83 (1.05) 2.16 (1.34) 1.54 (0.92)
N of children in HH
Mean (SD) 4.18 (2.06) 4.86 (2.30) 3.38 (1.98) 4.87 (3.24)
Non-biological children in HH
Mean (SD) 1.84 (2.16) 0.10 (0.50) 1.30 (1.70) 0.34 (0.84)
Shelter unstable, inadequate or unsafe
Yes 145 (41.4%) 354 (58.0%) 50 (24.4%) 56 (62.9%)
HH able to pay food last 3 months
No 144 (41.1%) 358 (58.6%) 103 (50.2%) 48 (53.9%)
Less than 2 meals per day
Yes 185 (52.9%) 356 (58.4%) 49 (23.9%) 40 (45.5%)
HH able to pay health last 3 months
No 165 (47.1%) 380 (62.2%) 126 (61.5%) 52 (58.4%)
HH able to pay education last 3 months
No 166 (47.4%) 398 (65.1%) 129 (62.9%) 54 (60.7%)
Regular school attendance
All children in HH 103 (29.4%) 343 (56.4%) 96 (47.3%) 70 (78.7%)
Some children in HH 175 (50.0%) 219 (36.0%) 64 (31.5%) 18 (20.2%)
None 72 (20.6%) 46 (7.6%) 43 (21.2%) 1 (1.1%)
Harsh discipline methods (any)
Yes 257 (73.4%) 349 (57.5%) 149 (73.4%) 48 (71.6%)
Caregiver emotional support
Nobody 68 (19.4%) 112 (18.4%) 25 (12.3%) 21 (23.6%)
1 164 (46.9%) 293 (48.0%) 82 (40.4%) 40 (44.9%)
2 or more 118 (33.7%) 205 (33.6%) 96 (47.3%) 28 (31.5%)

ASPIRES Family Care 21 Summary Research Report
Table 7. Qualitative sample characteristics at baseline, primary economic strengthening activity
At-Risk Households Reintegrating Households FARE ESFAM FARE ESFAM
(n=16) (n=24) (n=15) (n=23)
District
Wasiko 8 (50.0%) -- 10 (66.7%) --
Kampala 8 (50.0%) -- 5 (33.3%) --
Gulu -- 8 (33.3%) -- 7 (30.4%)
Luwero -- 8 (33.3%) -- 8 (34.8%)
Kamuli -- 8 (33.3%) -- 8 (34.8%)
Household composition
Number of adults in HH (mean) 2 2 2 2
Number of children in HH (mean) 4 4 4 4
Gender of caregiver - female (%) 81.3 41.7 60.0 43.5
Age of caregiver (median) 41.5 49.0 42.0 41.0
Gender of index child - female (%) 43.8 45.8 33.3 52.4
Age of index child (median) 14.5 13.0 14.0 10.0
Economic indicators
HH income (median UGX) 100,000 30,000 100,000 27,500
Poverty rate at <$2/day (%) 39.2 70.5 35.6 45.0
Living in inadequate shelter (%) 25.0 45.8 33.3 56.5
HHs with <2 meals/day (%) 43.8 50.0 33.3 56.5
Child well-being indicators
HHs with all school-aged children attending school regularly (%)
37.5 70.8 53.3 87.0
HHs reporting harsh discipline (punching, hitting, kicking) (%)
43.8 41.7 20.0 52.2
Primary ES activity
Cash transfer 0 (0%) 0 (0%) 2 (13.3%) 3 (13.0%)
Cash transfer + VSLA 7 (31.3%) 9 (37.5%) 1 (6.7%) 9 (39.1%)
VSLA 5 (43.8%) 4 (16.7%) 0 (0%) 2 (8.7%)
MSA -- 7 (29.2%) -- 4 (17.4%)
Community skills 0 (0%) -- 3 (20.0%) --
Other ES 0 (0%) 3 (12.5%) 0 (0%) 4 (17.4%)
No ES 4 (25.0%) 1 (4.2%) 9 (60.0%) 1 (4.4%)

ASPIRES Family Care 22 Summary Research Report
Table 8. Drivers of child separation according to at-risk families (with illustrative quotes) a. It is usually the situation at
home that pushes the children to
run away from home. Some
children are ill treated at home and
others are not well advised by their
parents, the parents have no time
to talk to their children and find out
what oppresses their children. (170
- Kampala caregiver, prevention)
b. Children run away from their
home because they are tortured.
There are some parents who
severely beat their children. This
makes the children run away from
home. Some parents are too tough
with their children. (167 - Kampala
caregiver, prevention)
c. This happens when children are
given a lot of work to do which is
not appropriate to their age, denying them food and this is common with children living with their stepmother. On
top of all that stepmothers tend to over cane these children to the extent of wounding them even. (149 – Kampala
caregiver, prevention)
d. There is a lot of violence in homes, where the parents are always fighting, to the extent that sometimes the children
are caught in the middle. This pushes the kid to run away from home. (042 - Wakiso caregiver, prevention)
e. Some children are thrown at the foster homes when they are babies by their parents because they do not like them.
(047 – Kampala caregiver, prevention)
f. Some parents are over drink alcohol and when you tell them about it, they don’t listen. (11022 – Kamuli child,
prevention)
g. The first major reason is the inability to cater for children's needs. A child can run away from home if you don't have
money to buy beddings like a blanket. In addition, lack of food in the home can also make a child to run to the
streets. (23063 – Kamuli caregiver, prevention)
h. There are children who are disobedient that even if you aren't treating him/her badly, he/she is just disobedient.
He/she will go away from home. (037 – Wakiso caregiver, prevention)
i. The problem is that some parents bring up naughty children then the situation at home becomes bad yet the child is
not used to doing any work. The end result is that he will join a group of bad people and those friends will tell
him/her that we live life in such a way. (009 – Wakiso caregiver, prevention)
j. Some parents fail to pay school fees for their children and when they are home, they tend to be idle. This pushes
them to join bad groups. (170 – Kampala caregiver, prevention)
k. It is brought about by the death of any of his/her parents. They run away from home due to trauma and loneliness.
(037 – Wakiso child, prevention)
l. This happens when children are given a lot of work to do which is not appropriate to their age, denying them food
and this is common with children living with their stepmother. (149 – Kampala child, prevention)
Factors driving child
separation
At-Risk Households Reintegrating
Households
Caregivers Children Caregivers Children
(n=35/40) (n=31/38) (n=30/38) (n=28/38)
Caregiver behaviora 29 22 28 21
Harsh discipline/treatmentb 16 16 23 15
Step-parent mistreatmentc 5 6 5 1
HH disagreements/fightingd 5 1 5 5
Chasing child awaye 2 2 0 2
Alcohol usef 3 1 0 1
Failure to meet basic needsg 19 10 19 12
Child behaviorh 10 11 9 11
Peer influencei 9 1 6 0
Lack of schoolj 11 1 3 1
Death of parentk 0 2 0 0
Child labor/workl 0 2 0 0
ASPIRES Family Care 23 Summary Research Report
Summary findings for at-risk households
Economic well-being indicators Across projects and sub-groups, families showed reduced economic vulnerability between baseline and
endline on a range of indicators. A quick-reference comparison of improvements on primary economic
indicators – median household income, ability to pay for food, shelter, healthcare, and education in the past
three months, food security and shelter status – is provided in Table 9 and key findings are highlighted below.
Detailed findings are available in the FARE and ESFAM Endline Quantitative Findings reports, specifically in
Tables 7a, 8a, 11a, and 12a.
Generally, the FARE households that participated in an ES intervention recorded statistically significant
improvements on each of these economic indicators, as did the ESFAM households that received cash
transfers (with or without VSLA). The ESFAM MSA and VSLA groups also showed improvement on all
indicators, but as they were less economically vulnerable at baseline, the magnitude of the changes was
smaller (and not statistically significant). The FARE No ES and ESFAM Other ES groups, neither of which
received a primary economic strengthening activity, showed varied changes on these indicators.
Of note, there was a significant increase in median monthly income for both aggregate samples. The FARE at-
risk households’ median monthly income rose from approximately USD 24 to USD 42 over the course of the
project and more than doubled (from USD 17 to USD 35) for the “destitute” CT+VSLA group which began
substantially lower than the aggregate. Among all ESFAM households, the median monthly income roughly
doubled, from USD 9 to USD 18, a finding that was mirrored in the most economically vulnerable groups that
received CTs.9 Increases in the proportion of households able to pay for basic needs accompanied the rise in
household incomes. For the FARE sample, 65% of at-risk households indicated ability to pay for all three
categories of basic needs consistently over the past three months, compared with 48% at baseline. For
ESFAM’s aggregate at-risk sample, the change was from 23% to 61% of households able to pay. Within both
samples, the groups that received cash transfers recorded the greatest magnitude of change.
In terms of food security, about three-quarters (72%) of all FARE at-risk households reported eating two or
more meals per day at endline, a 25-point increase from baseline. The proportion of FARE households having
only one meal per day decreased significantly at endline, though it remained above 25% for all groups. About
83% of all ESFAM at-risk households reported eating two or more meals per day at endline, a 41-point increase
from baseline. For all ESFAM groups, the proportion of households having only one meal per day decreased
substantially at endline, and fell below 20% for all but the CT-only group.
Substantial improvements were also noted in shelter status. At baseline, less than half (49%) of FARE at-risk
households were living in adequate or fairly adequate shelter; this increased to 75% at endline. Similarly, about
42% of ESFAM at-risk HHs were living in adequate or fairly adequate shelter at baseline, and this increased to
over 80% at endline. Improvements to HH shelter status were observed in every category, with the greatest
improvements in HH shelter observed among destitute households receiving CT or CT+VSLA.
9 Cash transfers ended at least six-months prior to endline data collection and are therefore not reflected in endline household income values.

ASPIRES Family Care 24 Summary Research Report
Table 9. At-risk households, summary of changes observed in key economic well-being indicators
Increase in…
FARE At-risk HHs ESFAM At-risk HHs
All HHs
VSLA CT+
VSLA No ES
All HHs
CT CT + VSLA
MSA VSLA Other
ES n=292 n=187 n=36 n=63 n=580 n=55 n=303 n=107 n=64 n=33
Median HH income ✔*
(73%) ✔*
(60%) ✔*
(108%) ✔*
(150%) ✔*
(100%) ✔*
(150%) ✔*
(100%) ✔*
(75%) ✔*
(50%) -
(-33%)
% HHs able to pay basic needs past 3 months
✔* (36%)
✔* (51%)
✔* (78%)
✔ (18%)
✔* (170%)
✔* (310%)
✔* (439%)
✔* (73%)
✔* (23%)
- (-30%)
% HHs with 2+ meals/day ✔*
(53%) ✔*
(35%) ✔*
(110%) ✔*
(69%) ✔*
(99%) ✔*
(366%) ✔*
(278%) ✔
(16%) ✔
(13%) ✔
(5%)
% HHs with adequate shelter
✔* (27%)
✔* (21%)
✔* (235%)
✔ (15%)
✔* (99%)
✔* (215%)
✔* (183%)
✔* (51%)
✔* (24%)
✔ (46%)
✔Indicates an observed increase in value or percentage from baseline to endline; – indicates no change or a decrease
*Indicates statistically significant change from baseline to endline at p≤0.05
(%) Indicates the percent change in value or proportion from baseline to endline
Family/social well-being indicators The Family Care project tracked several indicators of family and social well-being, including children’s
education, caregiver emotional support, and both caregiver and child integration into family and community.
Of the family and social well-being indicators highlighted here, regular school attendance by children has the
most immediate connection to the economic condition of the household. The others, availability of caregiver
emotional support and indices of child and caregiver well-being, are connected more directly to the family
support activities offered by FARE and ESFAM, though we also might expect improved emotional support and
well-being among participants in VSLA as a result of social connection and support from group members. A
comparative summary of changes observed in these indicators is provided in Table 10, with more detailed
information below. The full findings related to family and social well-being indicators are available in Tables
13a, 14a, 16a, and 17a of the FARE Endline Quantitative Findings report, and in Tables 13a, 15a, 17a, and 18a
of the ESFAM Endline Quantitative Findings report.
Educational participation was considered essential to the well-being of children and was operationalized as the
proportion of school-aged children in the family who attend school regularly (generously defined as not
missing more than 30 days within a school term). Over half (51.7%) of children in the FARE at-risk sample were
reported to be attending school regularly at endline, up from 26% at baseline. The average increase in the
aggregate sample was driven by similar increases in the VSLA and No ES households; the CT+VSLA at-risk group
registered a slight but not significant decrease (22% to 19%) in the proportion of households with all children
attending school regularly, though given the small sample size this represents a difference in just one
household. All categories of at-risk households reported a substantial decrease in the proportion of
households with no children attending school (significant for the overall sample and VSLA sub-group). The
ESFAM at-risk sample began at a much higher rate of households with all children attending school regularly
(55.4%) and increased at endline to over 75%. ESFAM endline data also showed substantial reductions in the
proportion of CT and CT+VSLA at-risk households with no children attending school (from 11-12% to 0-1%),
though the CT-only group also continued to have the lowest rate of full educational participation at 57.4%.

ASPIRES Family Care 25 Summary Research Report
Under the core program area of psychosocial support, the Family Care projects asked caregivers to list the
people they might approach for emotional support in times of need and then tallied the responses. All
categories of FARE and ESFAM at-risk households at endline recorded decreases in the proportion of
households reporting no one to turn to for emotional support and increases in the proportion of households
reporting two or more sources of external emotional support.
Overall child well-being was assessed using an index with six key domains theorized to be related to a child’s
risk of separation: enjoyment of education; social well-being; parent-child attachment; community belonging;
emotional well-being; and safety. The caregiver well-being assessment included five of the same domains:
social well-being, parent-child attachment, community belonging, emotional well-being and care and safety (of
children). Scores on both could range from 0-20. In the FARE at-risk sample, average domain scores for
children increased significantly for most domains and all groups. The average score at endline was lowest for
enjoyment of education (16.0) and highest for social well-being (18.6). Average domain scores among children
in the ESFAM at-risk sample increased for all domains, with the greatest increase for most groups in the
domain of Safety. In the overall sample, the average score was lowest for Community Belonging (15.7) and
highest for Safety (17.3). The few notable differences to these general trends were among ESFAM CT
households, whose scores on Parent-Child Attachment decreased from 12.4 at baseline to 6.4 at endline.
As with children, FARE and ESFAM household caregivers’ average scores showed significant increases over
baseline scores. In the FARE sample of at-risk household caregivers, the lowest endline domain score was for
community belonging (17.5), though this domain showed the greatest increase from baseline. In the ESFAM
sample, the lowest endline domain score was for Emotional Well-being (15.9); again this domain showed the
greatest increase from baseline.
Table 10. At-risk households, summary of changes observed in key family and social well-being
indicators
Increase in…
FARE At-risk HHs ESFAM At-risk HHs
All HHs
VSLA CT + VSLA
No ES All
HHs CT
CT + VSLA
MSA VSLA Other
ES n=292 n=187 n=36 n=63 n=580 n=55 n=303 n=107 n=64 n=33
% HHs with all children in school regularly
✔* (97%)
✔* (148%)
- (-13%)
✔ (126%)
✔* (38%)
✔* (26%)
✔* (54%)
✔* (32%)
✔ (19%)
✔ (9%)
% HH caregivers with 2+ emotional supports
✔* (107%)
✔* (119%)
✔* (156%)
✔* (68%)
✔* (93%)
✔ (63%)
✔* (160%)
✔* (65%)
✔ (40%)
✔* (64%)
Child well-being/integration scores, all domains
✔* ✔* ✔ ✔ ✔* ✔* ✔* ✔* ✔ ✔
Caregiver well-being/ integration scores, all domains
✔* ✔* ✔* ✔* ✔* ✔* ✔* ✔* ✔ ✔
✔Indicates an observed increase in percentage or scores from baseline to endline. For the child and caregiver well-being indicators,
signifies an increased score on each of the 5-6 specific domains measured.
– indicates no change or a decrease
*Indicates statistically significant change from baseline to endline at p≤0.05. (%) Indicates the percent change in proportion from baseline to endline, where applicable

ASPIRES Family Care 26 Summary Research Report
Child protection/separation indicators Key indicators within the child protection domain included harsh or abusive child disciplinary practices used by
caregivers (punching, kicking or hitting a child; withholding meals as punishment; and use of abusive language
toward a child) and enumerator observed (ESFAM) or self-reported (FARE) issues of abuse, neglect, or other
child protection issues in the household (four categories possible for ESFAM; eight issues reported on for
FARE). Child separation indicators tracked information on children living outside of the home for any reason,
including those for which the child was presumed to still be connected to the family (living with relatives or
attending school) and those considered concerning (child left home for a job, the family doesn’t know where
the child is, or the child isn’t with the family because s/he doesn’t like living there). Table 11 provides a
comparative summary of changes observed in these indicators, with more detailed information provided
below. Full findings related to child protection and separation indicators are available in Tables 15a and 18a of
the FARE Endline Quantitative Findings report, and in Tables 16a and 19a of the ESFAM Endline Quantitative
Findings report.
Substantial reductions from baseline to endline in rates of harsh discipline practices were reported across all
categories of FARE at-risk households, which also recorded considerable reductions across all types of child
protection concerns. The largest declines across the FARE at-risk sample were in the areas of child neglect
(49% to 8%), child labor (43% to 14%), and repeated physical abuse (26% to 5%). However, considerable rates
of adult abuse of drugs/alcohol in front of children persisted (50% at endline). Across ESFAM at-risk
households, use of harsh discipline remained relatively stable from baseline to endline for physical punishment
(40% - 38%) and withholding basic needs (9% - 6%), though slight increases in punching, kicking, or hitting a
child were observed among CT+VSLA (32% - 37%) and VSLA-only households (33% - 41%). There was a 20-point
reduction in the proportion of ESFAM at-risk households reporting the use of abusive language towards
children, which reflected decreases across all sub-groups. Enumerator-observed assessments of child
protection issues in ESFAM households indicated movement from more-risky to less-risky home environments
for children, with significantly more households receiving a “clear” report of no perceived abuse, neglect or
exploitation of children (74% in the overall sample at endline, compared to 40% at baseline).
Both FARE and ESFAM at-risk households recorded reductions in the proportion of families with a child living
outside of family care for any reason at some time within past six months. The percentage of FARE households
with a child living outside of the home fell from 31% to 22%, with the CT+VSLA group higher at both timepoints
(36% to 28%). The number of ESFAM families with a child living outside the home decreased by half, from 43%
to 20%, consistent across groups.
Concerning child separations – separation of a child from his or her household for a reason other than going to
school or living with relatives – were a primary outcome measure for assessment of the FARE and ESFAM
combinations of activities. At endline, 10 (3%) of the FARE at-risk households had a child who was currently
separated or had been within the past six months (down from 7% at baseline). The CT+VSLA group of
households reported the greatest proportion of separations (14%) among the FARE at-risk sample. Within the
ESFAM sample, 37 (6.5%) of the at-risk households had a child who was currently separated or had been within
the past six months (down from 13% at baseline). The VSLA (least economically vulnerable) group of
households reported the greatest proportion of separations (14%) among the ESFAM at-risk sample.

ASPIRES Family Care 27 Summary Research Report
Table 11. At-risk households, summary of changes observed in child protection and separation
indicators
Decrease in…
FARE At-risk HHs ESFAM At-risk HHs
All HHs
VSLA CT + VSLA
No ES All
HHs CT
CT + VSLA
MSA VSLA Other
ES
n=292 n=187 n=36 n=63 n=580 n=55 n=303 n=107 n=64 n=33
% HHs with child protection issues (all types)#
✔ ✔ ✔ ✔ ✔* ✔* ✔* ✔* ✔* ✔
% HHs reporting harsh discipline practices (all types)#
✔ ✔ ✔ - ✔ - - - - ✔
% HHs with child living outside family for any reason
✔* (-30%)
✔ (-26%)
✔ (-23%)
✔ (-35%)
✔* (-53%)
✔* (-65%)
✔* (-47%)
✔* (-53%)
✔* (-56%)
✔* (-70%)
HHs with a child separated at endline
10 (-54%)
4 (-68%)
5 (136%)
1 (-80%)
37 (-51%)
1 (-80%)
19 (-58%)
8 (-54%)
9 (126%)
0 (-100%)
✔Indicates an observed reduction in percentage from baseline to endline; – indicates no change or an increase
*Indicates statistically significant change from baseline to endline at p≤0.05 #Variable construction precludes tests of statistical significance; a checkmark indicates reductions across ALL issues/practices (%) Indicates the percent change in proportion from baseline to endline, where applicable
Summary findings for reintegrating households
Economic well-being indicators Across projects, families in most sub-groups showed reduced economic vulnerability between baseline and
endline on a range of indicators, including changes in median household income, ability to pay for food and
shelter, healthcare, and education in the past three months, and more specific measures of food security and
shelter status (summary in Table 12). Details for key findings are provided below; the full findings are available
in Tables 7b, 8b, 11b, and 12b of the FARE and ESFAM Endline Quantitative Findings reports.
There was a small but not significant increase in median monthly income for the FARE aggregate reintegration
sample from approximately USD 28 to USD 34 over the course of the project. This was fairly consistent across
sub-groups, though the small group of Other ES households recorded a larger gain. The No ES households were
the only group to record a decline in median monthly income. At endline, the median monthly household
income across the FARE reintegration sample remained below USD 28 (100,000 UGX) for 47% of at-risk
households, down slightly from 51% of households at baseline. However, 50% or more of Community Skills and
No ES households remained below the UGX 100,000 (USD 28) threshold. Among all ESFAM households, the
median monthly income roughly doubled, from USD 8 to USD 15. The less-economically-vulnerable VSLA group
saw a slightly smaller increase, and the Other ES group recorded a reduction in median monthly income. At
endline, over 85% of all ESFAM reintegrating households reported earning less than USD 28 (100,000 UGX) per
month.
Despite modest gains in median monthly income, the average number of months that FARE reintegration
families could pay for resources increased for every category of economic strengthening activity and for each
type of basic resources. There were generally increases across the board from baseline to endline in ability to
pay, though the only group to register over 50% of households indicating full ability to pay for basic resources
was the No ES group (potentially skewed by loss to follow up). The ESFAM reintegration sample started with
about 30% of household indicating consistent ability to pay for basic needs and increased significantly to 44%.
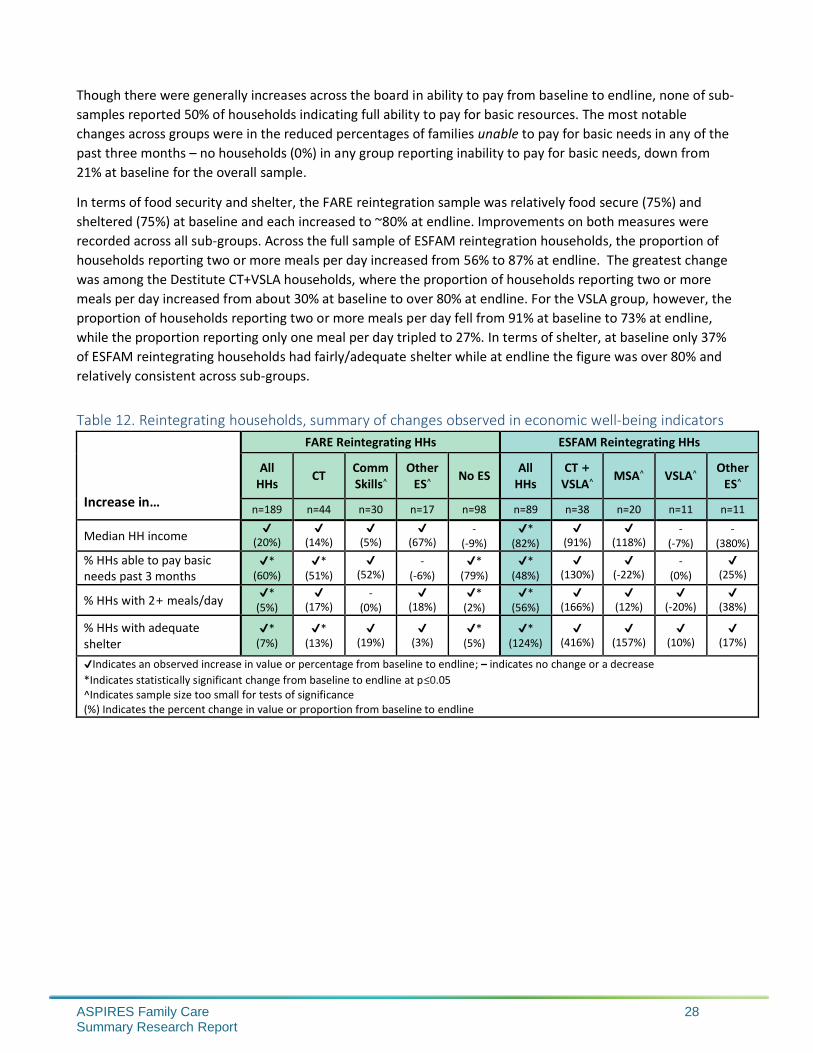
ASPIRES Family Care 28 Summary Research Report
Though there were generally increases across the board in ability to pay from baseline to endline, none of sub-
samples reported 50% of households indicating full ability to pay for basic resources. The most notable
changes across groups were in the reduced percentages of families unable to pay for basic needs in any of the
past three months – no households (0%) in any group reporting inability to pay for basic needs, down from
21% at baseline for the overall sample.
In terms of food security and shelter, the FARE reintegration sample was relatively food secure (75%) and
sheltered (75%) at baseline and each increased to ~80% at endline. Improvements on both measures were
recorded across all sub-groups. Across the full sample of ESFAM reintegration households, the proportion of
households reporting two or more meals per day increased from 56% to 87% at endline. The greatest change
was among the Destitute CT+VSLA households, where the proportion of households reporting two or more
meals per day increased from about 30% at baseline to over 80% at endline. For the VSLA group, however, the
proportion of households reporting two or more meals per day fell from 91% at baseline to 73% at endline,
while the proportion reporting only one meal per day tripled to 27%. In terms of shelter, at baseline only 37%
of ESFAM reintegrating households had fairly/adequate shelter while at endline the figure was over 80% and
relatively consistent across sub-groups.
Table 12. Reintegrating households, summary of changes observed in economic well-being indicators
Increase in…
FARE Reintegrating HHs ESFAM Reintegrating HHs
All HHs
CT Comm Skills^
Other ES^
No ES All
HHs CT +
VSLA^ MSA^ VSLA^
Other ES^
n=189 n=44 n=30 n=17 n=98 n=89 n=38 n=20 n=11 n=11
Median HH income ✔
(20%) ✔
(14%) ✔
(5%) ✔
(67%) -
(-9%) ✔*
(82%) ✔
(91%) ✔
(118%) -
(-7%) -
(380%)
% HHs able to pay basic needs past 3 months
✔* (60%)
✔* (51%)
✔ (52%)
- (-6%)
✔* (79%)
✔* (48%)
✔ (130%)
✔ (-22%)
- (0%)
✔ (25%)
% HHs with 2+ meals/day ✔*
(5%) ✔
(17%) -
(0%) ✔
(18%) ✔*
(2%) ✔*
(56%) ✔
(166%) ✔
(12%) ✔
(-20%) ✔
(38%)
% HHs with adequate shelter
✔* (7%)
✔* (13%)
✔ (19%)
✔ (3%)
✔* (5%)
✔* (124%)
✔ (416%)
✔ (157%)
✔ (10%)
✔ (17%)
✔Indicates an observed increase in value or percentage from baseline to endline; – indicates no change or a decrease
*Indicates statistically significant change from baseline to endline at p≤0.05 ^Indicates sample size too small for tests of significance (%) Indicates the percent change in value or proportion from baseline to endline

ASPIRES Family Care 29 Summary Research Report
Family/social well-being indicators The same indicators for family and social well-being were assessed for reintegrating households as for at-risk
households. A summary of changes observed in these indicators is provided in Table 13, with more detailed
information below. The full findings related to family and social well-being indicators are available in Tables
13b, 14b, 16b, and 17b of the FARE Endline Quantitative Findings report, and in Tables 13b, 15b, 17b, and 18b
of the ESFAM Endline Quantitative Findings report.
On regular school attendance, operationalized as the proportion of school-aged children in the family who
attend school regularly (generously defined as not missing more than 30 days within a school term), there was
little change among the reintegrating samples. The proportion of FARE households reporting regular school
attendance for all children in the family rose slightly, from 43% to 45% while the proportion of children not
attending school at baseline fell (from 19% - 9%). The CT and Community Skills households had lower-than-
average regular school attendance for all children (25% and 30%, respectively) compared to over 50% of
households in Other ES and No ES groups. ESFAM reintegrating families reported increased rates of
educational participation, from 74% to 81%. This trend was consistent across sub-groups, except among the
small Other ES group, which recorded a slight decline.
Under the core program area of psychosocial support, the Family Care projects asked caregivers to list the
people they might approach for emotional support in times of need and then tallied the responses. FARE
reintegrating households at endline recorded, on average, slight increases in the proportion of households
reporting two or more sources of external emotional support (from 50% to 53%), with the exception of the
Other ES group. Among ESFAM reintegrating households, VSLA-only and Other ES groups registered declines in
the proportion of households with two or more sources of emotional support, while all others reported
increases. The aggregate ESFAM sample recorded an increased proportion of caregivers with two or more
sources of emotional support, from 31% to 55%.
Overall child well-being was assessed using an index with six key domains: enjoyment of education; social well-
being; parent-child attachment; community belonging; emotional well-being; and safety. The caregiver well-
being assessment included five domains: social well-being, parent-child attachment, community belonging,
emotional well-being and care and safety (of children). Scores on both could range from 0-20. In the FARE
reintegration sample, average domain scores for children increased for all domains and all groups. The
average score at endline was lowest for enjoyment of education (13.9) and highest for social well-being and
parent-child attachment (each 17.0). Average domain scores among children in the ESFAM reintegration
sample also increased for all domains. In the overall sample, the average score was lowest for community
belonging (15.7) and highest for safety (17.3)
As with children, FARE and ESFAM reintegrating household caregivers’ average scores mostly showed increases
over baseline scores. In the FARE sample, the lowest endline domain score was for community belonging
(16.3), and highest for social well-being (17.2). Average domain scores among children in the ESFAM
reintegration sample increased for all domains, with the lowest average score for community belonging (15.7)
and highest for safety (17.3)

ASPIRES Family Care 30 Summary Research Report
Table 13. Reintegrating households, summary of changes observed in family/social well-being
indicators
Increase in…
FARE Reintegrating HHs ESFAM Reintegrating HHs
All HHs
CT Comm Skills^
Other ES^
No ES All
HHs CT +
VSLA^ MSA^ VSLA^
Other ES^
n=189 n=44 n=30 n=17 n=98 n=89 n=38 n=20 n=11 n=11
% HHs with all children in school regularly
✔* (6%)
- (-2%)
- (-17%)
✔ (21%)
✔* (12%)
✔ (9%)
✔ (10%)
✔ (7%)
✔ (38%)
- (-36%)
% HH caregivers with 2+ emotional supports
✔* (6%)
✔* (13%)
✔ (48%)
- (-21%)
✔* (12%)
✔* (95%)
✔ (256%)
✔ (114%)
✔ (-33%)
- (0%)
Child well-being/integration, all domains
✔* ✔ ✔ - ✔* ✔* ✔ ✔ ✔ ✔
Caregiver well-being/ integration, all domains
✔* ✔ ✔ - ✔ ✔* ✔ ✔ - ✔
✔Indicates an observed increase in percentage or scores from baseline to endline; – indicates no change or a decrease
*Indicates statistically significant change from baseline to endline at p≤0.05 ^Indicates sample size too small for tests of significance (%) Indicates the percent change in proportion from baseline to endline, where applicable
Child protection/separation indicators As with at-risk households, key indicators within the child protection domain included harsh or abusive child
disciplinary practices used by caregivers (punching, kicking or hitting a child; withholding meals as punishment;
and use of abusive language toward a child) and enumerator observed (ESFAM) or self-reported (FARE) issues
of abuse, neglect, child labor, or other child protection issues in the household (four categories possible for
ESFAM; eight issues reported on for FARE). Child separation indicators tracked information on children living
outside of the home for any reason, including those for which the child was presumed to still be connected to
the family (living with relatives or attending school) and those considered concerning (child left home for a job,
the family doesn’t know where the child is, or the child isn’t with the family because s/he doesn’t like living
there). Table 14 provides a summary of changes observed in these indicators, with key findings highlighted
below. Full findings related to child protection and separation indicators are available in Tables 15b and 18b of
the FARE Endline Quantitative Findings report, and in Tables 16b and 19b of the ESFAM Endline Quantitative
Findings report.
Families in the FARE reintegration sample recorded variable changes across child protection concerns, with no
group showing decreasing rates of all types of concerns. Among CT-only households, there were increases in
reported rates of child labor (23% to 30%) and neglect (23% to 36%). Within the community skills group, there
was a small increase in reported child labor (7% to 10%), while in the Other ES group there reported rates of
physical abuse (13% to 18%) and neglect (13% to 29%) rose from baseline to endline. Overall, the FARE
reintegration households indicated some movement away from harsh discipline practices, with substantial
reductions in the use of physical discipline or withholding food, but minimal change on the use of abusive
language toward children. In the ESFAM reintegrating sample, the proportion of HHs with no child protection
concerns nearly tripled, from 23% to 68%, with less improvement among the MSA group (only 45% of
households recorded without any child protection concerns). Overall, the ESFAM reintegration households
indicated movement away from harsh discipline practices, with a reduction by half in the number of

ASPIRES Family Care 31 Summary Research Report
households reporting punching, kicking, or hitting a child and in withholding meals or basic needs as
punishment. There was also a substantial decrease in the proportion of households reporting use of abusive
language toward children.
At endline, 30 (16%) of the FARE reintegrating households had a child who was currently separated or had
been within the past six months. The No ES group reported the highest proportion of separations among the
reintegration sample (18%). Within the ESFAM sample, 6 (6.8%) of the reintegrating households had a child
who was currently separated or had been within the past six months, with the MSA group reporting the
highest proportion of separations among the reintegration sample (15%). A comparison of the baseline
characteristics of households that did and did not experience a separation at endline yielded a few statistically
significant differences (at p ≤.05). Across the FARE reintegration sample, families that experienced a separation
had lower baseline values for education level of the head of household and level of regular school attendance
by children in the household. ESFAM families with a separation had higher rates of male-headed households.
Table 14. Reintegrating households, summary of changes observed in child protection and separation
indicators
Decrease in…
FARE Reintegrating HHs ESFAM Reintegrating HHs
All HHs
CT Comm Skills^
Other ES^
No ES All
HHs CT +
VSLA^ MSA^ VSLA^
Other ES^
n=189 n=44 n=30 n=17 n=98 n=89 n=38 n=20 n=11 n=11
% HHs with child protection issues (all types)#
- - - - - ✔* ✔ ✔ ✔ -
% HHs reporting harsh discipline practices (all types)#
✔ ✔ ✔ ✔ - ✔ ✔ ✔ - ✔
HHs with a child separated at endline (%)
29 (15%)
6 (14%)
4 (13%)
2 (12%)
17 (17%)
6 (7%)
1 (3%)
3 (15%)
0 (0%)
1 (9%)
✔Indicates an observed reduction in percentage from baseline to endline; – indicates no change or an increase
*Indicates statistically significant change from baseline to endline at p≤0.05 ^Indicates sample size too small for tests of significance #Variable construction precludes tests of statistical significance; a checkmark indicates reductions across ALL issues/practices
Tables summarizing observed changes in key economic and well-being indicators across at-risk and
reintegrating households are included in Annexes II and II for FARE and ESFAM, respectively.
Participant reflections on project effects One of the gaps in evidence around economic strengthening for child protection programming is around the
child-level effects of interventions. Given the relatively small sample sizes and similarities between at-risk and
reintegrating households, this section provides a combined summary of caregivers’ views of how FARE and
ESFAM integrated programming affected children in their homes.
Effects of economic strengthening programming Caregivers’ discussions of child level effects resulting from economic strengthening interventions covered both
direct and indirect effects. CTs, MSAs, and VSLAs were seen to provide positive direct effects for children as
additional funds resulting from these interventions were typically spent on school fees, scholastic materials,
food, and medical care for children. Financial literacy and business skills trainings were linked indirectly to
child-level effects through caregiver ability to budget, increased caregiver motivation to prioritize education,
and increased household income through a (more) successful business. Each of these effects is described
briefly below with illustrative comments from participants.

ASPIRES Family Care 32 Summary Research Report
Increased educational participation
According to the qualitative research participants, CTs, MSAs, and VSLAs all directly affected caregivers’ ability
to pay for school fees and scholastic materials for the children under their care. Scholastic materials included
school uniforms, pens/pencils, and exercise books. Increased educational participation was mentioned by 20 of
31 CT recipients, 9 of 11 MSA participants, and 19 of 37 VSLA members in the qualitative sample.
– Yes, the cash transfers helped me because my children didn’t sit at home because during that time
when they almost sent them back home for school fees at school, that [CT] money could come and I
paid their school fees. (23076 – Kamuli caregiver, prevention)
– [MSA] has brought a change …when I save 100,000/= they match it with 100,000/=. This 100,000/=
does a lot because it helps me cover what I would have failed to cover… I [have] five children but I
would manage to pay for only a few, but right now I can afford to pay school fees for all the children.
(11050 – Kamuli caregiver, prevention)
– I think all the needs we may have will be solved because we shall be getting [VSLA] loans to help us
meet those needs. For example, if a child is chased from school for school fees, I can go take a loan of
fifty thousand shillings and pay school fees. (12067 – Luwero caregiver, prevention)
Increased food security for entire family, including children
Money received from CTs, MSAs, and VSLAs was often used in households to increase food security. In
alignment with their purpose to stabilize household consumption, cash transfers were more frequently cited in
reference to purchasing additional food for the family than MSA or VSLA.
– I would have died of hunger if it were not for this [CT] money, it helped me to buy food, basic needs in the home and children’s school fees. (77032 – Kamuli caregiver, reintegration)
– [CT] has improved the household capacity to purchase food and other basic needs like soap and medicine. It has affected the whole of the household because when food is brought everybody eats. (11040 – Gulu caregiver, reintegration)
Increased child access to medical treatment
Money received from CTs and VSLA loans was used at times to pay children’s medical bills or to access
treatment for sick children. Six CT and 5 VSLA households discussed using these funds to cover child health
care costs. Here again, VSLA members talked of future possibilities as well as past experiences.
– [CT] helped me pay hospital bills for my grandchild who was sick. (12044 – Gulu caregiver, prevention)
– If one of my children is to fall sick, I can go to the welfare officer and borrow some 20,000 UGX, which
does not have interest and can be given even without a guarantor. I get the money, take the child for
treatment and then pay the money back in a specified period. This never existed before the VSLA. I had
nowhere to run in case of an emergency. (042 – Wakiso caregiver, prevention)
Indirect effects for children of household economic strengthening activities
Caregivers linked financial literacy and business skills trainings indirectly to child-level effects through caregiver
ability to budget, increased caregiver motivation to prioritize education, and increased household income
through a (more) successful business. Financial literacy and budget management training was one of the most
discussed economic strengthening activities, as caregivers found both immediate and lasting value in the skills
they learned. Caregivers highlighted the positive effects of financial literacy training on their motivation to

ASPIRES Family Care 33 Summary Research Report
save to cover large anticipated and unexpected events, including school fees, scholastic materials, and medical
care. They discussed being able to save because of their new household budgeting skills.
– During the trainings, they taught us about spending sparingly. You cannot say that since I have 130,000 shillings, let me go and buy chicken, yet I have no food, no charcoal or even salt. You have to budget for the little you have so that in the end there is something small you can save for tomorrow. (149 - Kampala caregiver, prevention)
Caregivers often explicitly described prioritizing the most important expenses instead of carelessly spending
money without a plan. The highest priority expenses related to necessities for children including school fees,
food, and saving for emergencies like sickness.
– I have become like a teacher in my home, if I get any money first priority is to spend on food and school fees, secondly is to save in the bank to help in emergency situations, and also raise enough capital to start up a business. (77001 – Gulu caregiver, reintegration)
Caregivers also linked business skills training to increased business profits, which they saw benefitting the
children in the household through increased food and more money to pay school fees.
– They benefit because when my business works well and I earn some money, the people in my household will also benefit when I am able to buy for the food, clothes, school fees and other needs. (055 – Wakiso caregivers, prevention)
Additionally, a few caregivers shared the financial literacy trainings with their children, providing their children
the opportunity to understand how household funds were budgeted or to take part in the creation of a
household budget. Caregivers viewed this sharing of knowledge as a way to increase future benefits of the
training for children.
– You see, I always call my granddaughter [the index child] and we plan together on how we can use our money. This will train her for future life to be responsible. (24130 – Gulu caregiver, prevention)
Effects of family social support programming The primary family social support interventions available to FARE and ESFAM households were regular visits
from a (para)social worker or case manager and parenting skills training. To these activities, caregivers
attributed improved caregiver-child relationships, built on improved communication, less use of harsh
punishment, and an increase in child respect and attitudes.
Improved caregiver-child communication
When asked whether and how social worker visits and parenting skills trainings affected their families, caregivers often talked about learning how to communicate effectively with their children. Several described the change in communication in terms of making friends with their children, encouraging them to speak freely about their lives in general and more specifically about their problems.
– We were advised to be friends with our children by having chats with them and listen to them with a non-judgmental mind whenever they have something to share with us but try to understand them and advise them accordingly. This has brought about openness between my family members and I, which has eventually made the children to disclose to me even when they get some money. (016 – Kampala caregiver, prevention)
Opening the dialogue between caregivers and children contributed to children’s greater understanding of the
family’s economic situation while also giving children the opportunity to contribute ideas related to improving
the family’s economic situation. Some caregivers felt that sharing the family’s economic situation with their

ASPIRES Family Care 34 Summary Research Report
children would allow their children to understand why they could not provide adequately for all their
children’s needs, ultimately resulting in less resentment towards caregivers.10
– [Parenting skills training] has affected my family positively in a way that my children no longer get
angry at me when I don’t provide for all their needs, like enough food because they too know the real
situation at home. My 14 year-old son and the 13 year-old daughter are more open to me unlike before
and I think this is partly because I listen to their opinion and bring my opinions in form of suggestions
and advice, not decisions and orders. (066 – Kampala caregiver, prevention)
Several caregivers described the importance of parenting skills training in helping them share decision making
with the family instead of making all the decisions themselves. Caregivers expressed how collective decision
making with the family unit led to happier households through more shared responsibilities.
– For example ever since I received the training, we now have family meetings at home. The other thing my children are reporting back to school. We no longer think for them and buy them things, we listen to them and they buy the school requirements themselves, so we give them that chance to make a decision rather than before when we could just buy for them. All this has been COWA’s efforts, because I used to leave all that responsibility for my wife but through the training I realized it is a collective responsibility to take care of children. (047 – Wakiso caregiver, reintegration)
Improved caregiver-child respect
The more open communication attributed by caregivers to social worker visits and parenting skills training also
seemed to reduce caregivers’ use of harsher forms of punishment. Prior to family strengthening activities,
caregivers commonly described a “cane first, ask questions later” approach to child misbehavior. Caregivers
described changing this behavior as a result of social worker visits and parenting skills training, which
encouraged them to talk with the child first to understand the situation surrounding the poor behavior. This
further created an atmosphere of unity and openness as children had more respect for their caregivers and
less fear. This change in caregiver behavior was noted in the quantitative data and confirmed by several
children.
– It [parenting skills] has enabled me to get closer to the children because I freely talk to them and in case they do something wrong I sit them down, and talk to them calmly. This has made them more respectful and free with me. (77005 – Gulu caregiver, reintegration)
– Child: … If I have committed something wrong they don’t just beat me or shout over me or quarrel on me but they call and put me down and then talk to me in a low tone and warn me not to repeat the same mistake.
Interviewer: What do you think caused this change?
Child: The social worker has been talking to them [caregivers]. (77005 – Gulu child, reintegration)
Family strengthening activities often included mediation and check-in visits, particularly for reunified children.
Several caregivers described their children’s lack of respect prior to the project and felt that the social workers’
role as an intermediary between the caregiver and child brought respect and repaired a deeply damaged
relationship. Other caregivers described how the social workers’ discussions with children led to a reduction in
unwanted behaviors ranging from associating with negative peer groups, leaving home without permission,
and stealing.
10 This theme was more widely reported among FARE households.

ASPIRES Family Care 35 Summary Research Report
– They have helped my daughter to change her attitude and behaviors. She used to be big headed that
she used not to listen and follow my orders and very unruly that she used to go out for parties with her
peers without my permission. But more often, when the social worker comes to visit my household, she
endeavors to talk to her and advise her on how to behave right. (016 – Kampala caregiver, prevention)
A handful of caregivers (n=5) with reunified children, particularly in the urban FARE context, credited the social
worker visits with keeping the reunified child in the household. For these caregivers, social worker visits were
viewed as an important part of the reintegration process that deterred the reunified child from running away
again.
Increased Commitment to Child Education
Nearly one-quarter of caregivers in the qualitative sample (n=19), particularly in prevention households,
credited project family strengthening social support activities for a renewed motivation to send the children in
their care to school. Citing primarily parenting skills training, these caregiveres described working harder to
send their children to school, prioritizing school fees and scholastic materials.
– Currently due to the parenting skills I received about children’s care. I work so hard to pay my children’s school fee which is different from last time, when I could wait for their biological father to pay for their school fees. (023 – Wakiso caregiver, reintegration)
A few caregivers reported that parenting skills and social worker visits motivated their children to resume school even if they were initially uninterested. One caregiver discussed how a social worker encouraged an index child to go back to school instead of becoming a housemaid. This caregiver reported less stress with her child back in school and felt school attendance would lead to a brighter future for her child. Lastly, several caregivers described how they were now encouraging their children to read outside of school and complete their homework and related this to improved school performance.
– I always remind my children to do their homework in time whenever they come back from school, that is why these days they perform better at school. They are always in the first positions. (11016 – Luwero caregiver, prevention)
Summary of child-level effects of FARE and ESFAM programming Caregivers involved in the qualitative research associated with the FARE and ESFAM projects described a
number of changes they saw in themselves, their children, and their households as a result of project activities.
They cited direct (immediate) and indirect (longer term) effects of economic strengthening interventions on
child-level outcomes, namely the caregivers’ improved ability and commitment to secure education, food, and
health care for their children. These economic strengthening activities were integrated with family
strengthening activities that caregivers also connected to several child-level outcomes, including improved
caregiver-child communication and respect, and increased commitment to education. The overlapping and
complementary nature of the child-level outcomes described by caregivers for these two types of
interventions illustrates and affirms the mutually reinforcing nature of economic conditions and family
dynamics within a household:
– Our relationship is now better because we are no longer constrained by money problems. I am no
longer worried as before, so I do not take out my stress on the children by shouting at them. I talk to
them in case they have done something wrong. (149 – Kampala caregiver, prevention)

ASPIRES Family Care 36 Summary Research Report
DISCUSSION The ASPIRES Family Care project provided an opportunity to pilot selected economic strengthening activities in
conjunction with family strengthening and case management with families at risk of family-child separation
and families in the process of reintegrating a separated child. The settings for the two learning projects in
Uganda – FARE in and around slum areas near the capital city Kampala with a reunification focus on street-
connected children and children in conflict with the law and ESFAM in three more rural districts with a
reunification focus on children recently returning from a childcare institution – highlighted areas, on the one
hand, where context contributed to differences, and, on the other, where similar vulnerabilities and similar
outcomes were observed.
For example, qualitative data collected with caregivers and children in all five implementation districts on
factors contributing to child separation were remarkably similar across geography, project, separation status
(at-risk or reintegrating) and source (caregiver or child). The three factors most commonly mentioned – harsh
discipline and other mistreatment by caregivers, caregivers’ inability to provide food and other basic needs,
and children’s (mis)behavior – are largely captured in Figure 1, but perhaps with slightly different emphasis.
The proximal intra-household behavioral dynamics, the daily experience of caregivers and children of relating
to one another in often stressful and uncomfortable circumstances, may come to mind more readily than the
distal and less emotively tangible dynamics of household economic resources. Though as was evident in the
qualitative data on perceived effects of economic and family strengthening programming, there is a
connection between the two.
For at-risk households in both projects, there was an improvement on economic indicators across all groups,
regular school attendance improved across all groups, and fewer households reported child protection issues.
Across both projects and the urban/rural populations they represented, the largest changes, particularly on
economic indicators, were generally among the poorest families, who, based on their economic vulnerability,
received cash transfers (preceded by financial literacy training), followed by, for some, participation in a VSLA.
The improvements these households registered were instructive. For example, among the ESFAM sample,
though income doubled, more than 80% of families were still living on an average of less than $1/day. And yet,
even at this still-vulnerable level, households had substantially increased their ability to pay for basic needs.
The CT+VSLA combination together with training, motivation, and encouragement to save seem helpful to help
households stabilize. However, the poorest households still struggled more than others to have all children
enrolled in and regularly attending school, raising the possibility that school-focused assistance in addition to
or after basic needs stabilization may be a necessary complementary step.
On the child protection side, addressed primarily by family and social support activities, context and emphasis
may matter more. Some harsh physical discipline practices persisted among ESFAM households, while among
FARE households adult alcohol use in front of children remained a common issue, highlighting the potential
need for emphasis on these different topics. Both projects recorded lower average child separation rates at
endline, but each had one group with rates substantially higher. For FARE that was the most economically
vulnerable CT+VSLA group, for whom the urban setting, frequent movement of household shelter, or low
levels of social and emotional support may have played a role. For ESFAM, the highest rate of child separation
was recorded among the (relatively) less vulnerable group that participated in VSLAs. This may be attributable
to the high loss-to-follow-up and non-participation rate in this group that did not receive any cash (as the CT
and MSA ESFAM participants did), or perhaps the VSLA was not enough on its own to help reduce family
economic stress, given the very low income levels across the ESFAM sample.

ASPIRES Family Care 37 Summary Research Report
The situations of the reintegrating households in the FARE and ESFAM samples were more varied than among
the prevention households, reflecting a more disparate sample, assembled around households that were
reunifying a child from the street, the remand system, or a childcare institution and not based on geographic
proximity. Even so, there was improvement in economic indicators generally, though less consistent changes
were observed across groups. About half of the FARE reintegrating households could not access or chose not
to participate in economic strengthening activities. Additionally, the FARE reintegration sample recorded
relatively high median monthly incomes and ability to pay at baseline, suggesting that perhaps economic
vulnerability was less of a primary force for separation in these families. Supporting this, FARE households
continued to report issues with child labor, neglect, and physical abuse. Regular school attendance of all
children in the household remained very low, especially for the more economically vulnerable households
receiving cash transfers. In contrast, the ESFAM reintegrating CT+VSLA and MSA HHs – some of the most
vulnerable – showed the greatest improvements on economic indicators, including on ability to pay for basic
needs and shelter, and improved already high education participation rates.
For both FARE and ESFAM the child separation rates among reintegrating households were higher than for at-
risk households at endline. FARE recorded rates over 10% for all sub-groups, with a high of 17% among the No
ES group. This perhaps goes along with the persistent child protection issues reported among this population
and may indicate that urban households with a child reunified from the streets or remand may require (more)
substantial case management and social support. The child separation rate for reintegrating households in
ESFAM was 7%, though the MSA group had more than double that at 15%. The MSA group relative to the
other ESFAM reintegrating groups had the highest percentage of male-headed HHs (65%, married), the highest
average number of children/household (5.7), and the highest rate of harsh discipline reported (65%),
suggesting that for such households additional family and social support activities, perhaps including
discussions of gender and family dynamics, may be helpful.
Limitations The nature and the complexity of the issue of family-child separation, with multiple inter-connected drivers,
coupled with the challenges of implementing a diverse set of activities with households experiencing a range
of economic and family stressors, presented limitations for both the FARE and ESFAM projects and for the
research and learning activities that could be constructed around them. More detailed descriptions are
available in the comprehensive quantitative research reports for each project. Briefly, the main limitations of
the findings presented in this report include:
• A large number of FARE households that did not receive or participate in economic strengthening
activities.
• An unequal distribution of households across the categories of economic strengthening activities for
both projects. This unequal distribution makes it more difficult to compare households across
categories, and for the smaller samples, limits tests of statistical significance.
• Unequal durations of interventions and timing of observation. The start date of implementation of
household-level activities differed; at-risk households generally had a longer period of project contact.
• Lack of a counterfactual. Given resource constraints – and the changing nature of the distribution of
respondents – the research design did not include control households, which could have enabled
assessment of impact of the (different) economic strengthening activities. The findings here are
therefore only descriptive.
• No estimates of the background rate of family-child separation in Uganda against which to compare
observed rates of separation.

ASPIRES Family Care 38 Summary Research Report
Nonetheless, interpreted with these limitations in mind, the findings in this report provide a range of
qualitative and quantitative data related to drivers of family-child separation among populations receiving
integrated family strengthening activities and economic strengthening activities.
CONCLUSION The experience of the at-risk households that participated in FARE and EFAM, as assessed and documented in
this report, lends credence to the theory that reducing economic stress in the household may contribute to
better general family well-being, thus reducing drivers of family-child separation and facilitating children’s
reintegration in families. There are mutually reinforcing social benefits to economic well-being and economic
benefits to social well-being. While we cannot tease out attribution of specific outcomes to specific activities,
the general improvement of at-risk households across indicators of economic status, family and social well-
being, and child protection for most categories of participants suggests that economic strengthening activities
do have a role to play in preventing family separation. These trends were present but less clear for the
reintegrating families, particularly those in urban households reintegrating a child from the streets or the
juvenile justice system; among these households economic vulnerability may be secondary to family dynamics,
caregiver behavior, and social conditions (e.g., stigma). Both of these findings reinforce the necessity of
determining whether, which, and when economic strengthening activities may best address a family’s
immediate and longer-term needs in support of keeping children in family care.

ASPIRES Family Care 39 Summary Research Report
Annex I. Description of data collection tools
FARE’s HVAT was adapted from the Uganda Ministry of Gender, Labour and Social Development’s revised
tool. The HVAT collects household background/demographic data and information about household
members, along with information under six core program areas (CPA) prioritized in Uganda’s National
Strategic Programme Plan of Interventions-2 (NSPPI2) including economic strengthening; food security and
nutrition; health, water, sanitation and shelter; education; psychosocial support and basic care; and child
protection and legal support. In consultation with ASPIRES Family Care team members, FARE adapted the
HVAT to include some additional questions related to household economic capacity, ability to deal with
shocks, psychosocial well-being, and child protection.
ESFAM’s FSVI was adapted from the FSVI used in the DOVCU project, which in turn was designed to include
vulnerability assessment data required by the Ugandan government from orphans and vulnerable children
(OVC) projects. The FSVI collects household background/demographic data and information about household
members, along with information under five core program areas (CPA) including household economic
security; access to basic needs; health and care; psychosocial support and basic care; and child protection
and legal support. In consultation with ASPIRES Family Care team members, ESFAM adapted the DOVCU FSVI
to include some additional questions related to household economic capacity, ability to deal with shocks,
psychosocial well-being, and child protection. Responses to the FSVI are summed in composite scores within
each domain and as a total score for each family. In the DOVCU project’s PRA exercise, community members
identified poverty (including associated elements of access to land, access to credit and livestock ownership)
as a leading factor in family-child separation. The household economic security and access to basic needs
CPAs are therefore weighted in the FSVI’s overall vulnerability analysis. ASPIRES Family Care requested that
ESFAM add a question on asset acquisition to be asked after FSVI questions; this question was not included in
the FSVI scoring itself. Economic indicators are presented in the local currency, UGX, with USD provided as
reference, calculated at the average exchange rate for the period of observation (July 2016 – January 2018)
of 3,571 UGX = 1 USD.
The PPI is a validated, 10-item questionnaire that generates a score indicating the likelihood that a surveyed
household falls below a given poverty line. The PPI for Uganda is based on Uganda’s 2012/13 National
Household Survey. ASPIRES Family Care requested its partners collect PPI data to help compare approaches
to household economic categorization.
The Child Integration Status Tool and Caregiver Integration Status Tool are related and were specifically
designed to reflect domains of child well-being that the literature and practice wisdom identify as central
drivers of family-child separation. Members of the Family Care team, with colleagues from the 4Children
project and Retrak, evaluated several tools that look at child well-being, including the Developmental Assets
Profile (DAP) and the Child Status Index (CSI), but none were perfectly suited for use in the Family Care
context. Family Care and partners together selected relevant indicators from these and other tools, licensing
several DAP items from the Search Institute. The Child Integration Status Tool includes six key domains:
enjoyment of education; social well-being; parent-child attachment; community belonging; emotional well-
being; and safety; the Caregiver Integration Status Tool includes the same, with the exception of the
enjoyment of education domain. These tools were intended to be used to facilitate case management and to
serve as data collection instruments. The star diagram that followed the questions allowed case managers to
plot progress on each domain and facilitate discussion of development plans with children and caregivers. FHI
360 assessed the measurement reliability and validity of the two tools using available baseline data from
Family Care learning projects. Both the Child and Caregiver Integration Status Tools exhibited fairly strong

ASPIRES Family Care 40 Summary Research Report
measures of reliability (Cronbach’s alpha of 0.7 or higher) and construct validity (comparative fit index of 0.9
or higher for confirmatory factor analyses).
The HVAT and PPI data reflect the situation of the household, as reported by the head of household/primary
caregiver, while the Integration Status tools profile the primary caregiver and a specific index child, either the
one determined to be at highest risk of separation in the family or the reunified child.
Copies of all quantitative data collection tools are available as annexes within the FARE and ESFAM endline
quantitative findings reports.

ASPIRES Family Care 41 Summary Research Report
Annex II. FARE Project - Summary of key indicators by ES Activity
Improvements on key indicators at endline
At-risk HHs Reintegrating HHs
All HHs
VSLA CT+
VSLA No ES
All HHs
CT Comm Skills
Other ES
No ES
(n=292) (n=187) (n=36) (n=63) (n=188) (n=44) (n=30) (n=17) (n=97)
Decrease in % HHs with child living outside family ✔* ✔ ✔ ✔ NA NA NA NA NA
Reduction in % HHs with reported child protection issues (reductions across all issues)^
✔ ✔ ✔ ✔ ✔ - - - -
Reduction in % HHs reporting harsh discipline practices (reductions in all types)^
✔ ✔ ✔ - ✔ ✔ ✔ ✔ -
Reduction in economic vulnerability (CPA1) ✔* ✔* ✔* ✔* ✔* ✔* ✔ ✔ ✔*
Reduction in % destitute HHs (Simple Tool) ✔* ✔* ✔* ✔* ✔* ✔ ✔ - ✔
Reduction in % HHs likely to be living on <$2/day PPP (PPI) ✔* ✔* ✔* ✔ - - - - -
Increase in median HH income ✔* ✔* ✔* ✔* ✔ ✔ ✔ ✔ -
Reduction in % HHs with risky coping strategies ✔* ✔* ✔* ✔ ✔ - ✔ - -
Increase in % HHs with ability to cover all basic needs past 3 months
✔* ✔* ✔* ✔ ✔* ✔* ✔ - ✔*
Increase in % HHs with 2+ meals/day ✔* ✔* ✔* - ✔* ✔ - ✔ ✔*
Increase in % HHs with adequate shelter ✔* ✔* ✔* ✔ ✔* ✔* ✔ ✔ ✔*
Increase in % HHs with all children in school ✔* ✔* - ✔ ✔* - - ✔ ✔*
Increase in % HHs with 2+ emotional supports ✔* ✔* ✔* ✔* ✔* ✔* ✔ - ✔*
Increase in % HHs with 2+ material supports ✔* ✔* ✔ ✔* ✔* ✔* ✔ - ✔*
Improved child well-being/integration, all domains ✔* ✔* ✔ ✔ ✔* ✔ ✔ - ✔*
Improved caregiver well-being/integration, all domains ✔* ✔* ✔* ✔* ✔* ✔ ✔ - ✔
✔Indicates an observed increase or reduction from baseline to endline, as specified
*p<0.05 (according to paired t-test for mean variables, chi-squared or Fisher’s exact tests for categorical variables, and median test for median variables)

ASPIRES Family Care 42 Summary Research Report
Annex III. ESFAM Project - Summary of key indicators by ES Activity
Indicator
At-risk HHs Reintegrating HHs
All HHs
CT CT + VSLA
MSA VSLA Other
ES All
HHs CT + VSLA
MSA VSLA Other
ES (n=580) (n=55) (n=303) (n=107) (n=64) (n=33) (n=89) (n=38) (n=20) (n=11) (n=11)
Decrease in % HHs with child living outside family ✔* ✔* ✔* ✔* ✔* ✔* (NA) (NA) (NA) (NA) (NA)
Increase in % HHs with no observed child protection issues
✔* ✔* ✔* ✔* ✔* ✔ ✔* ✔ ✔ ✔ -
Reduction in % HHs reporting harsh discipline practices (reductions in all types)^
✔ - - - - ✔ ✔ ✔ ✔ - ✔
Reduction in economic vulnerability (CPA1) ✔* ✔* ✔* ✔* ✔* - ✔* ✔ ✔ - ✔
Reduction in % destitute HHs (FSVI) ✔* ✔* ✔* - - - ✔* ✔ - - -
Reduction in % HHs likely to be living on <$2/day PPP (PPI)
✔* ✔* - - ✔ - - - - ✔ -
Increase in median HH income ✔* ✔* ✔* ✔* ✔* - ✔* ✔ ✔ - -
Reduction in % HHs with risky coping strategies ✔* ✔* ✔* - - - ✔ ✔ - - ✔
Increase in % HHs with ability to cover all basic needs past 3 months
✔* ✔* ✔* ✔* ✔* - ✔* ✔ ✔ - ✔
Increase in % HHs with 2+ meals/day ✔* ✔* ✔* ✔ ✔ ✔ ✔* ✔ ✔ ✔ ✔
Increase in % HHs with adequate shelter ✔* ✔* ✔* ✔* ✔* ✔ ✔* ✔ ✔ ✔ ✔
Increase in % HHs with all children in school ✔* ✔* ✔* ✔* ✔ ✔ ✔ ✔ ✔ - -
Increase in % HHs with 2+ emotional supports ✔* ✔ ✔* ✔* ✔ ✔* ✔* ✔ ✔ ✔ -
Increase in % HHs with 2+ material supports ✔ ✔ ✔* ✔* ✔* ✔* ✔* ✔ ✔ - ✔
Improved child well-being/integration, all domains ✔* ✔* ✔* ✔* ✔ ✔ ✔* ✔ ✔ - ✔
Improved caregiver well-being/integration, all domains
✔* ✔* ✔* ✔* ✔ ✔ ✔* ✔ ✔ - ✔
✔Indicates an observed increase or reduction from baseline to endline, as specified
*p<0.05 (according to paired t-test for mean variables, chi-squared or Fisher’s exact tests for categorical variables, and median test for median variables); tests of significance were not run on disaggregated Reintegration sample given small sample sizes.