Aspirations and well being outcomes in ethiopia evidence from a randomized field experiment...
21
ETHIOPIAN DEVELOPMENT RESEARCH INSTITUTE Aspirations and well-being outcomes in Ethiopia Evidence from a randomized field experiment Tanguy Bernard, Stefan Dercon, Kate Orkin , Fanaye Tadesse, and Alemayehu Seyoum Taffesse IFPRI ESSP-II and University of Oxford Ethiopian Economic Association Conference July 19, 2011 Addis Ababa 1
Transcript of Aspirations and well being outcomes in ethiopia evidence from a randomized field experiment...
ETHIOPIAN DEVELOPMENT RESEARCH INSTITUTE
Aspirations and well-being outcomes in Ethiopia Evidence from a randomized field
experiment
Tanguy Bernard, Stefan Dercon, Kate Orkin , Fanaye Tadesse, and Alemayehu SeyoumTaffesseIFPRI ESSP-II and University of Oxford
Ethiopian Economic Association ConferenceJuly 19, 2011Addis Ababa
1

2
"Fatalism" in Ethiopia
"We live only for today""We have neither a dream nor an imagination""Waiting to die while seated""It is a life of no thought for tomorrow"
(Rahmato and Kidane,1999)
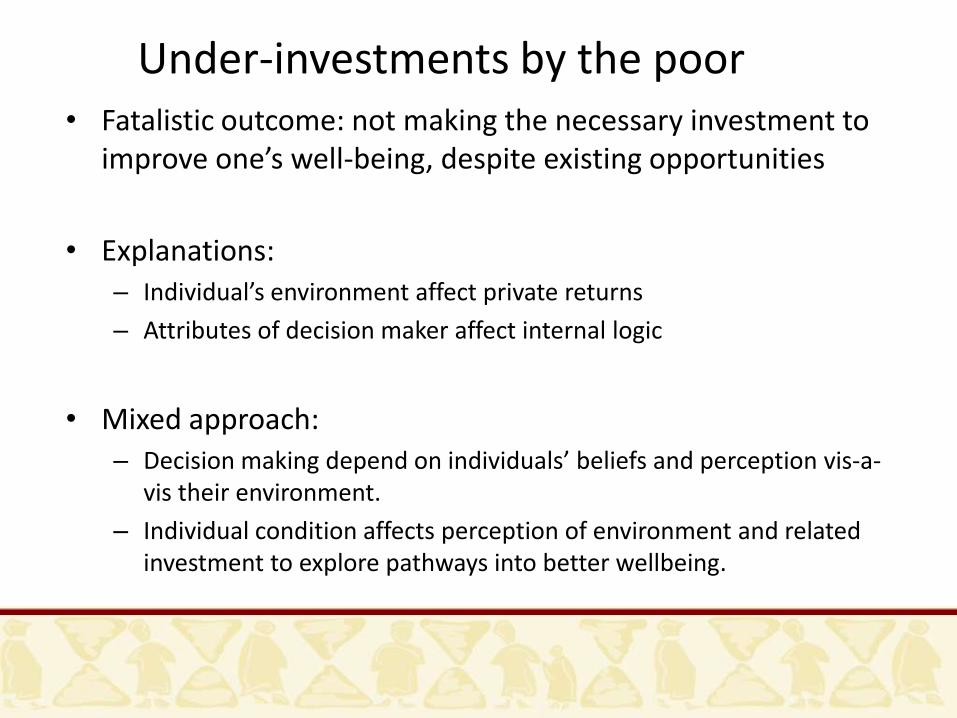
Under-investments by the poor• Fatalistic outcome: not making the necessary investment to
improve one’s well-being, despite existing opportunities
• Explanations:– Individual’s environment affect private returns
– Attributes of decision maker affect internal logic
• Mixed approach: – Decision making depend on individuals’ beliefs and perception vis-a-
vis their environment.
– Individual condition affects perception of environment and related investment to explore pathways into better wellbeing.

• Aspirations : – A desire or an ambition to achieve something
– An aim and implied effort to reach it
– Combination of preferences and beliefs
• Related concepts– Economics : Satisficing
– Psychology : self-efficacy, locus of control
– Anthropology : Aspiration failures
• Common elements– Goals and aspirations are important to determine success
– Evolution through time in response to circumstances
– Role of social comparisons and learning from relevant others, beyond social learning
• An individual-level yet culturally determined concept towards exploration of individual-group symbiosis

“Aspirations” project
Step 1 – correlates of aspiration-related concepts
Step 2 – test and validate a measurement strategy
Step 3 – assess validity of « aspiration window " theory
• A “mobile movie” experiment– Exogenous shock to aspirations: Mini-documentaries of local
success stories screened to randomly selected individuals. Placebo: local TV show.
– 3 rounds of data• Baseline pre-treatment (Sept-Dec 2010)
• Aspirations retest immediately after treatment
• Follow-up (Mar-May 2011)

Aspiration measures200,000 ETB ~ value of
one harvest of chat
from one hectare
100,000 ETB ~ value of
one harvest of chat
from half a hectare
0 ETB
• 4 dimensions
– Annual income in cash
– Assets – house, furniture, consumer goods, vehicles
– Social status – whether people in the village ask advice on decisions
– Level of education of oldest child• “What is the level of <> you would like to
achieve?”
• Individual specific weights
• Standardised

Aspirations - Determinants
asp_r1 a_income_r1 a_wealth_r1 a_educ_r1 a_status_r1
age 0.012 0.003 -0.008 0.035 -0.004
(2.99)** (0.38) (0.80) (2.92)** (0.33)
age2 -0.000 -0.000 0.000 -0.000 0.000
(2.80)** (0.73) (0.73) (2.57)* (0.85)
gender 0.178 0.203 0.074 0.262 0.167
(7.46)** (4.19)** (1.93) (5.90)** (3.20)**
read 0.102 -0.016 0.193 0.263 0.081
(3.04)** (0.28) (2.90)** (4.13)** (1.35)
R2 0.10 0.06 0.04 0.08 0.03
N 1,638 1,748 1,759 1,754 1,778
* p<0.05; ** p<0.01
Screening site fixed effects not reported
Robust standard errors clustered at village-level
t-stats in parentheses

Aspirations - Determinants asp_r1 a_income_r1 a_wealth_r1 a_educ_r1 a_status_r1
age 0.009 0.003 -0.008 0.034 -0.008
(2.93)** (0.46) (0.86) (2.88)** (0.77)
age2 -0.000 -0.000 0.000 -0.000 0.000
(2.70)** (0.89) (0.75) (2.52)* (1.18)
gender 0.179 0.196 0.073 0.270 0.160
(7.37)** (3.84)** (1.86) (6.18)** (3.29)**
read 0.117 0.040 0.201 0.244 0.100
(3.80)** (0.75) (3.06)** (4.06)** (1.85)
others_asp 0.033
(27.81)**
others_a_income 0.031
(41.01)**
others_a_wealth 0.019
(7.15)**
others_a_educ 0.021
(9.73)**
others_a_status 0.030
(18.14)**
R2 0.28 0.26 0.06 0.11 0.18
N 1,638 1,748 1,759 1,754 1,778
* p<0.05; ** p<0.01
Screening site fixed effects not reported
Robust standard errors clustered at village-level
t-stats in parentheses

Aspirations – Impact
Hypothetical demand for credit
loan_1year_R1 loan_5years_R1 loan_10years_R1
asp_r1 5,382.324 21,487.324 61,547.013
(4.09)** (2.53)* (3.43)**
N 1,702 1,702 1,702
* p<0.05; ** p<0.01
Screening site fixed effects not reported
Robust standard errors clustered at village-level
t-stats in parentheses
Other effects
• Increase in withdrawal and deposit into savings among treatment group – small net increase in savings;
• Decrease in proportion of treatment group who agree that poverty has “fatalistic”(destiny, bad luck) causes;

Experimental design
Surveyed : Treatment, 6 households (12 individuals)/village
Placebo, 6 households (12 individuals)/village
Control, 6 households (12 individuals)/village
Non-Surveyed : Treatment, 18 households (36 individuals)/ treatment village
Placebo, 18 households (36 individuals)/ placebo village
Treatment village Placebo village
16 Screening sites, 4 villages/screening sites (2 Treatment and 2 Control)

Distribution of treatment
All villages Treatment villages Placebo villages
Treatment individuals 0.32 0.33 0.31
(0.46) (0.47) (0.46)
Placebo individuals 0.33 0.32 0.34
(0.47) (0.46) (0.47)
Control individuals 0.33 0.33 0.33
(0.47) (0.47) (0.47)
# peers invited to treatment 0.85 1.26 0.40
(0.93) (0.97) (0.63)
# peers invited to placebo 0.79 0.38 1.24
(0.89) (0.31) (0.93)
Sample balanced on gender, literacy, age and most outcomes

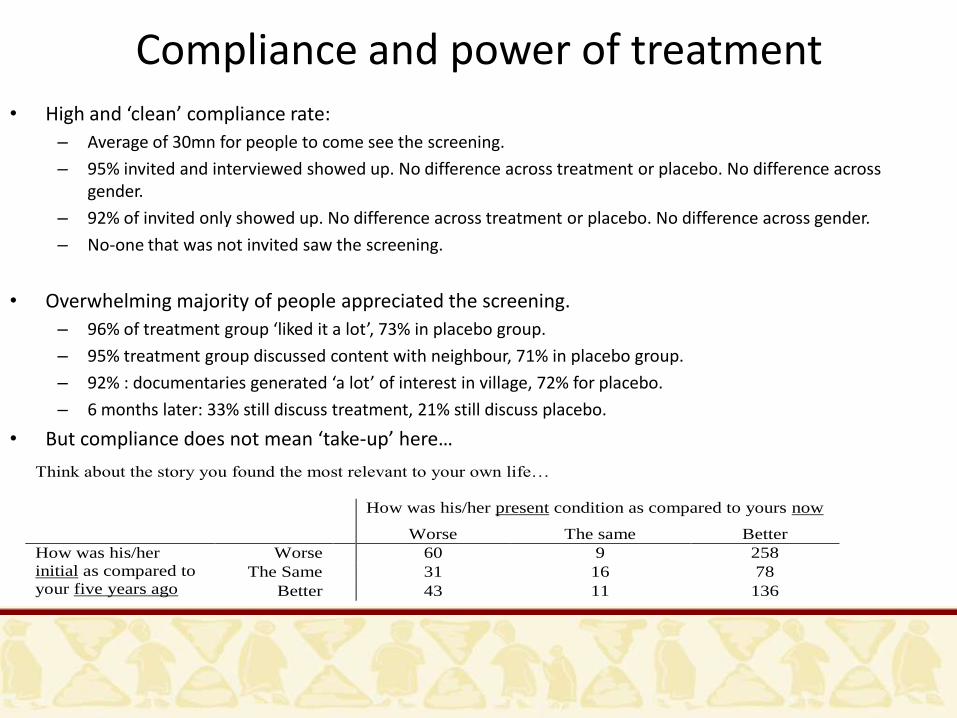
Compliance and power of treatment• High and ‘clean’ compliance rate:
– Average of 30mn for people to come see the screening.
– 95% invited and interviewed showed up. No difference across treatment or placebo. No difference across gender.
– 92% of invited only showed up. No difference across treatment or placebo. No difference across gender.
– No-one that was not invited saw the screening.
• Overwhelming majority of people appreciated the screening.
– 96% of treatment group ‘liked it a lot’, 73% in placebo group.
– 95% treatment group discussed content with neighbour, 71% in placebo group.
– 92% : documentaries generated ‘a lot’ of interest in village, 72% for placebo.
– 6 months later: 33% still discuss treatment, 21% still discuss placebo.
• But compliance does not mean ‘take-up’ here…
Think about the story you found the most relevant to your own life…
How was his/her present condition as compared to yours now
Worse The same Better
How was his/her
initial as compared to
your five years ago
Worse 60 9 258
The Same 31 16 78
Better 43 11 136

Estimation strategy
162 1
, , , , , ,
1
T
s v i s v i s v i s v i
s
y T n y
• s=screening site, v=village, i=individual.
• T=treatment, nT=number of treated peers of ind i
• y1 = asp at round 1
• π=screening site fixed effects.
All standard errors clustered at village level, since part of the treatment is done at the village level.

Impact on aspirations – final round asp_r2 asp_r2 asp_r2 asp_r2
treat_cont 0.040 0.040
(1.15) (1.13)
plac_cont 0.005 0.004
(0.13) (0.12)
nb_doc 0.020 0.012
(0.96) (0.61)
nb_plac -0.020 -0.009
(0.93) (0.40)
asp_r1 0.446 0.447 0.418 0.419
(10.91)** (10.93)** (11.27)** (11.30)**
R2 0.19 0.19 0.17 0.17
N 1,061 1,061 1,076 1,076
* p<0.05; ** p<0.01
Screening site fixed effects not reported
Robust standard errors clustered at village-level
t-stats in parentheses

Impact on aspirations – post screening
asp_fu asp_fu asp_fu asp_fu
treat_cont 0.014 0.013
(0.34) (0.32)
plac_cont -0.049 -0.046
(1.35) (1.26)
nb_doc 0.015 0.051
(0.74) (2.44)*
nb_plac -0.001 -0.001
(0.07) (0.05)
asp_r1 0.573 0.574 0.500 0.505
(10.20)** (10.32)** (10.40)** (10.27)**
R2 0.30 0.30 0.29 0.28
N 1,004 1,004 1,022 1,022
* p<0.05; ** p<0.01
Screening site fixed effects not reported
Robust standard errors clustered at village-level
t-stats in parentheses
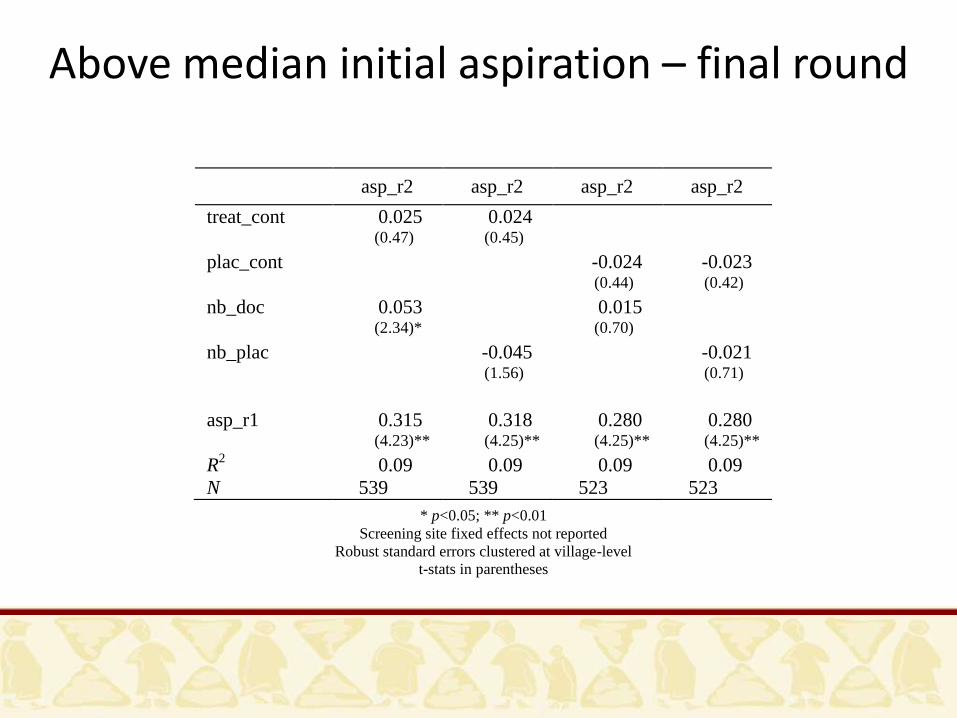
Above median initial aspiration – final round
asp_r2 asp_r2 asp_r2 asp_r2
treat_cont 0.025 0.024
(0.47) (0.45)
plac_cont -0.024 -0.023
(0.44) (0.42)
nb_doc 0.053 0.015
(2.34)* (0.70)
nb_plac -0.045 -0.021
(1.56) (0.71)
asp_r1 0.315 0.318 0.280 0.280
(4.23)** (4.25)** (4.25)** (4.25)**
R2 0.09 0.09 0.09 0.09
N 539 539 523 523
* p<0.05; ** p<0.01
Screening site fixed effects not reported
Robust standard errors clustered at village-level
t-stats in parentheses

Educational aspiration only – final round
a_educ_r2 a_educ_r2 a_educ_r2 a_educ_r2
treat_cont 0.107 0.107
(1.70) (1.72)
plac_cont 0.040 0.041
(0.67) (0.69)
nb_doc 0.058 0.055
(1.74) (1.58)
nb_plac -0.078 -0.007
(2.21)* (0.23)
a_educ_r1 0.240 0.241 0.242 0.244
(7.11)** (7.08)** (8.64)** (8.61)**
R2 0.09 0.09 0.07 0.07
N 1,151 1,151 1,174 1,174
* p<0.05; ** p<0.01
Screening site fixed effects not reported
Robust standard errors clustered at village-level
t-stats in parentheses

Educational aspiration only – post-screening a_educ_fu a_educ_fu a_educ_fu a_educ_fu
treat_cont 0.100 0.101
(1.59) (1.61)
plac_cont 0.070 0.075
(1.07) (1.12)
nb_doc 0.017 0.076
(0.69) (2.76)**
nb_plac -0.034 0.002
(0.89) (0.06)
a_educ_r1 0.429 0.429 0.401 0.402
(7.43)** (7.42)** (6.85)** (6.76)**
R2 0.22 0.22 0.20 0.20
N 1,134 1,134 1,160 1,160
* p<0.05; ** p<0.01
Screening site fixed effects not reported
Robust standard errors clustered at village-level
t-stats in parentheses

Impact on demand for loans
loan_10years_R2 loan_10years_R2 loan_10years_R2 loan_10years_R2
treat_cont 5,670.973 4,897.515
(1.01) (0.89)
plac_cont 516.208 896.126
(0.12) (0.22)
nb_doc 5,278.431 5,778.825
(1.63) (2.12)*
nb_plac 3,802.248 4,224.977
(1.15) (1.38)
loan_10years_R1 0.277 0.283 0.591 0.595
(2.34)* (2.40)* (4.28)** (4.30)**
N 1,230 1,230 1,245 1,245
* p<0.05; ** p<0.01
observations left-censored at demand = 0
Robust standard errors clustered at village-level
t-stats in parentheses

Conclusion
• "Weak " treatment and very preliminary analysis, butsome indications that:
– Documentaries affect perception more than placebo
– Not so much seeing the documentary, but discussing itwith friends who have seen it – more of an aspirationwindow story rather than a role model one.
– Impact more important on education-related aspiration
– Indication of positive effects onto demand for credit
– Although some decay, effects still visible 6 months aftertreatment