ASOS.com PowerPoint Template/media/Files/A/Asos-V2/results-archive/pdf... · Retail sales 197,859...
47
Final results for the year to 31 March 2012 24 May 2012
Transcript of ASOS.com PowerPoint Template/media/Files/A/Asos-V2/results-archive/pdf... · Retail sales 197,859...
Final results for the year to 31 March 2012
24 May 2012
Full Year Highlights
• Retail sales up 49%, total group revenues up 46%
• Strong UK and international retail sales, up 7% and up 103% respectively
• Profit before tax1 of £40.9 million up 43%
• International sales mix 59% - Q4 62%
• On track for 1:5:5
2
1 Excluding exceptional items
• Leverage cost base
• Maximise cash EBIT
• Strong return on invested capital
Nick Beighton – Financial Review
3
... driving fuel for growth
Financial discipline ...
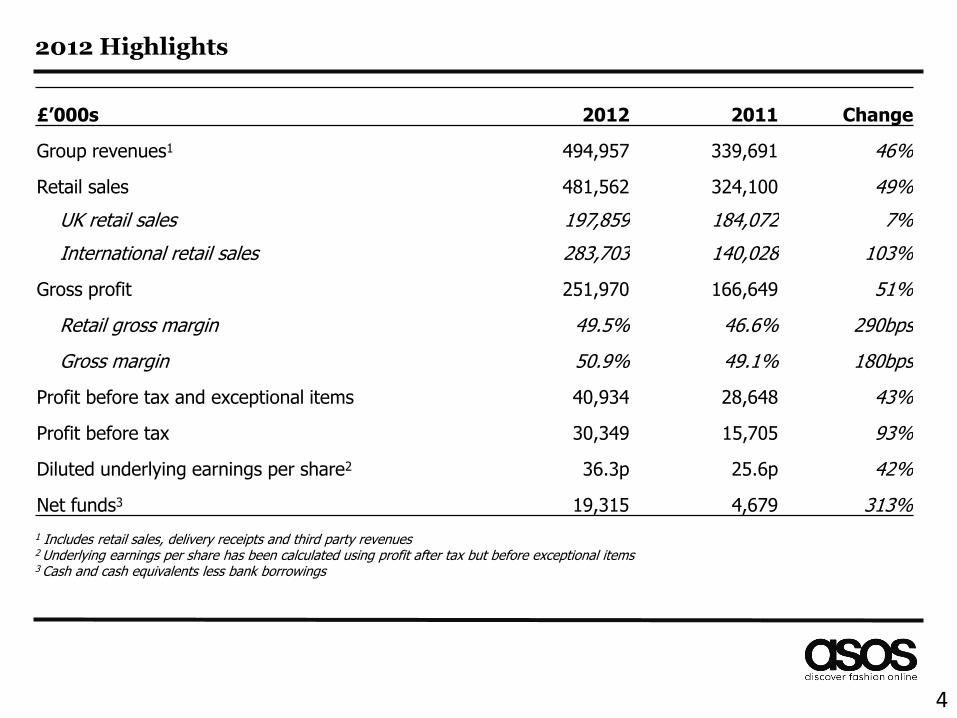
2012 Highlights
£’000s 2012 2011 Change
Group revenues1 494,957 339,691 46%
Retail sales 481,562 324,100 49%
UK retail sales 197,859 184,072 7%
International retail sales 283,703 140,028 103%
Gross profit 251,970 166,649 51%
Retail gross margin 49.5% 46.6% 290bps
Gross margin 50.9% 49.1% 180bps
Profit before tax and exceptional items 40,934 28,648 43%
Profit before tax 30,349 15,705 93%
Diluted underlying earnings per share2 36.3p 25.6p 42%
Net funds3 19,315 4,679 313%
1 Includes retail sales, delivery receipts and third party revenues 2 Underlying earnings per share has been calculated using profit after tax but before exceptional items 3 Cash and cash equivalents less bank borrowings
4
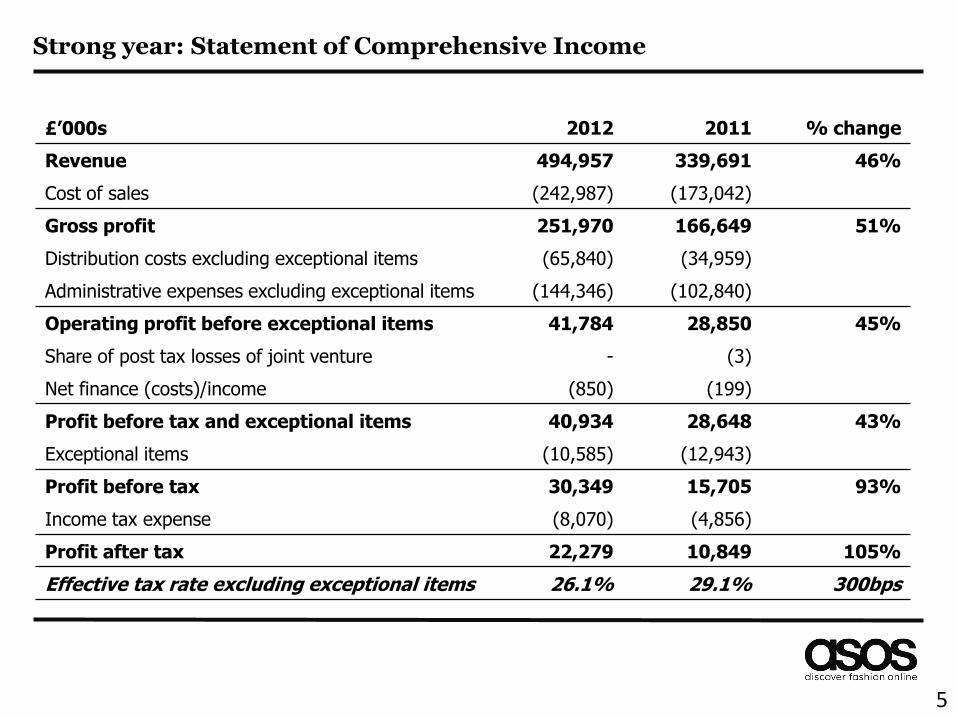
Strong year: Statement of Comprehensive Income
£’000s 2012 2011 % change
Revenue 494,957 339,691 46%
Cost of sales (242,987) (173,042)
Gross profit 251,970 166,649 51%
Distribution costs excluding exceptional items (65,840) (34,959)
Administrative expenses excluding exceptional items (144,346) (102,840)
Operating profit before exceptional items 41,784 28,850 45%
Share of post tax losses of joint venture - (3)
Net finance (costs)/income (850) (199)
Profit before tax and exceptional items 40,934 28,648 43%
Exceptional items (10,585) (12,943)
Profit before tax 30,349 15,705 93%
Income tax expense (8,070) (4,856)
Profit after tax 22,279 10,849 105%
Effective tax rate excluding exceptional items 26.1% 29.1% 300bps
5
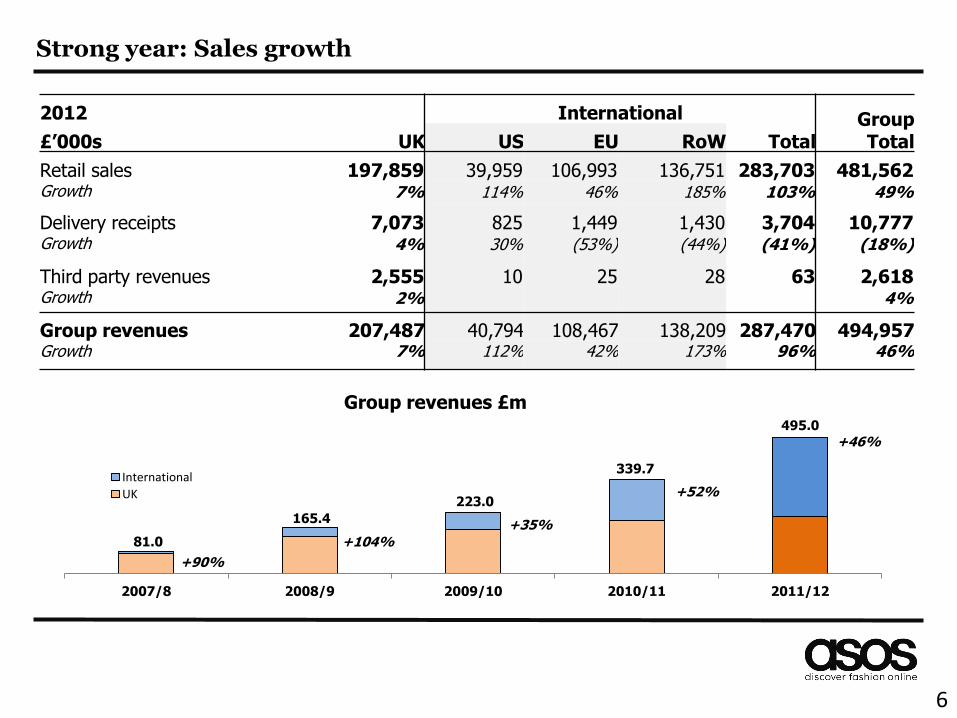
2012
UK
International Group Total £’000s US EU RoW Total
Retail sales 197,859 39,959 106,993 136,751 283,703 481,562 Growth 7% 114% 46% 185% 103% 49%
Delivery receipts 7,073 825 1,449 1,430 3,704 10,777 Growth 4% 30% (53%) (44%) (41%) (18%)
Third party revenues 2,555 10 25 28 63 2,618 Growth 2% 4%
Group revenues 207,487 40,794 108,467 138,209 287,470 494,957 Growth 7% 112% 42% 173% 96% 46%
Strong year: Sales growth
81.0
165.4
223.0
339.7
495.0
2007/8 2008/9 2009/10 2010/11 2011/12
Group revenues £m
International
UK
+90%
+104% +35%
+52%
+46%
6
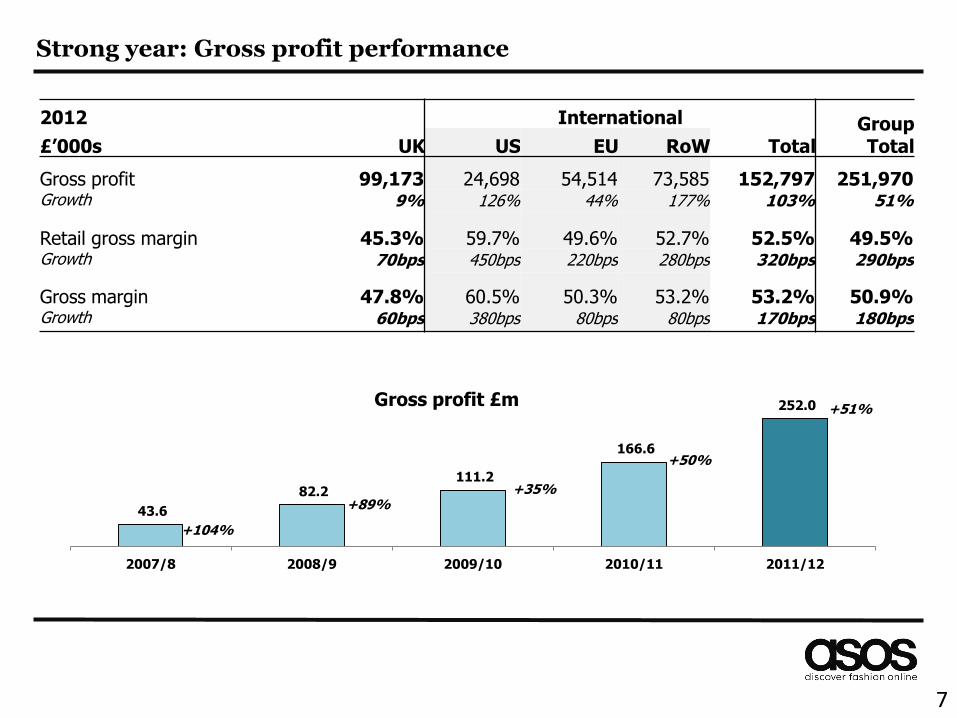
2012
UK
International Group Total £’000s US EU RoW Total
Gross profit 99,173 24,698 54,514 73,585 152,797 251,970 Growth 9% 126% 44% 177% 103% 51%
Retail gross margin 45.3% 59.7% 49.6% 52.7% 52.5% 49.5% Growth 70bps 450bps 220bps 280bps 320bps 290bps
Gross margin 47.8% 60.5% 50.3% 53.2% 53.2% 50.9% Growth 60bps 380bps 80bps 80bps 170bps 180bps
Strong year: Gross profit performance
43.6
82.2 111.2
166.6
252.0
2007/8 2008/9 2009/10 2010/11 2011/12
Gross profit £m
+104%
+89% +35%
+50%
+51%
7
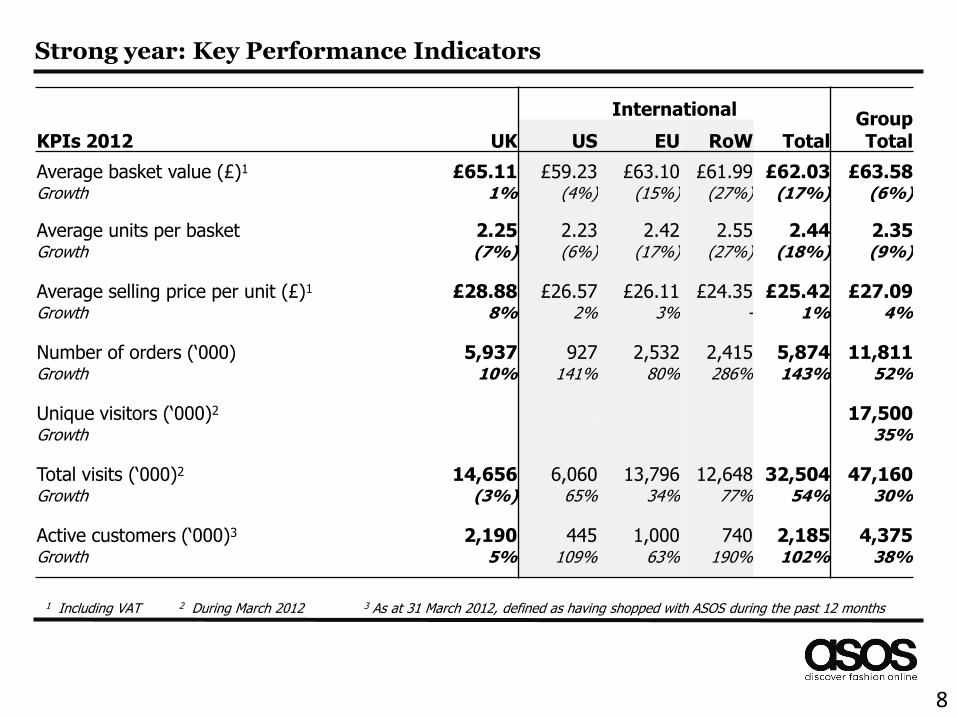
Strong year: Key Performance Indicators
KPIs 2012 UK
International Group Total US EU RoW Total
Average basket value (£)1 £65.11 £59.23 £63.10 £61.99 £62.03 £63.58 Growth 1% (4%) (15%) (27%) (17%) (6%)
Average units per basket 2.25 2.23 2.42 2.55 2.44 2.35 Growth (7%) (6%) (17%) (27%) (18%) (9%)
Average selling price per unit (£)1 £28.88 £26.57 £26.11 £24.35 £25.42 £27.09 Growth 8% 2% 3% - 1% 4%
Number of orders (‘000) 5,937 927 2,532 2,415 5,874 11,811 Growth 10% 141% 80% 286% 143% 52%
Unique visitors (‘000)2 17,500 Growth 35%
Total visits (‘000)2 14,656 6,060 13,796 12,648 32,504 47,160 Growth (3%) 65% 34% 77% 54% 30%
Active customers (‘000)3 2,190 445 1,000 740 2,185 4,375 Growth 5% 109% 63% 190% 102% 38%
2 During March 2012 3 As at 31 March 2012, defined as having shopped with ASOS during the past 12 months 1 Including VAT
8
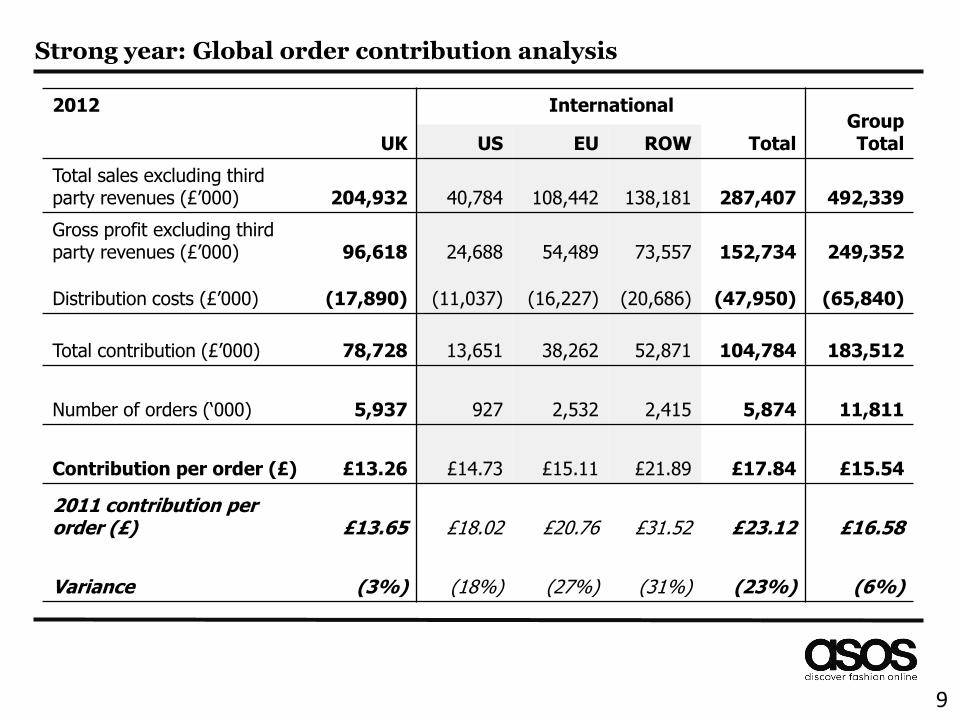
Strong year: Global order contribution analysis
2012 International Group Total UK US EU ROW Total
Total sales excluding third party revenues (£’000) 204,932 40,784 108,442 138,181 287,407 492,339
Gross profit excluding third party revenues (£’000) 96,618 24,688 54,489 73,557 152,734 249,352
Distribution costs (£’000) (17,890) (11,037) (16,227) (20,686) (47,950) (65,840)
Total contribution (£’000) 78,728 13,651 38,262 52,871 104,784 183,512
Number of orders (‘000) 5,937 927 2,532 2,415 5,874 11,811
Contribution per order (£) £13.26 £14.73 £15.11 £21.89 £17.84 £15.54
2011 contribution per order (£) £13.65 £18.02 £20.76 £31.52 £23.12 £16.58
Variance (3%) (18%) (27%) (31%) (23%) (6%)
9
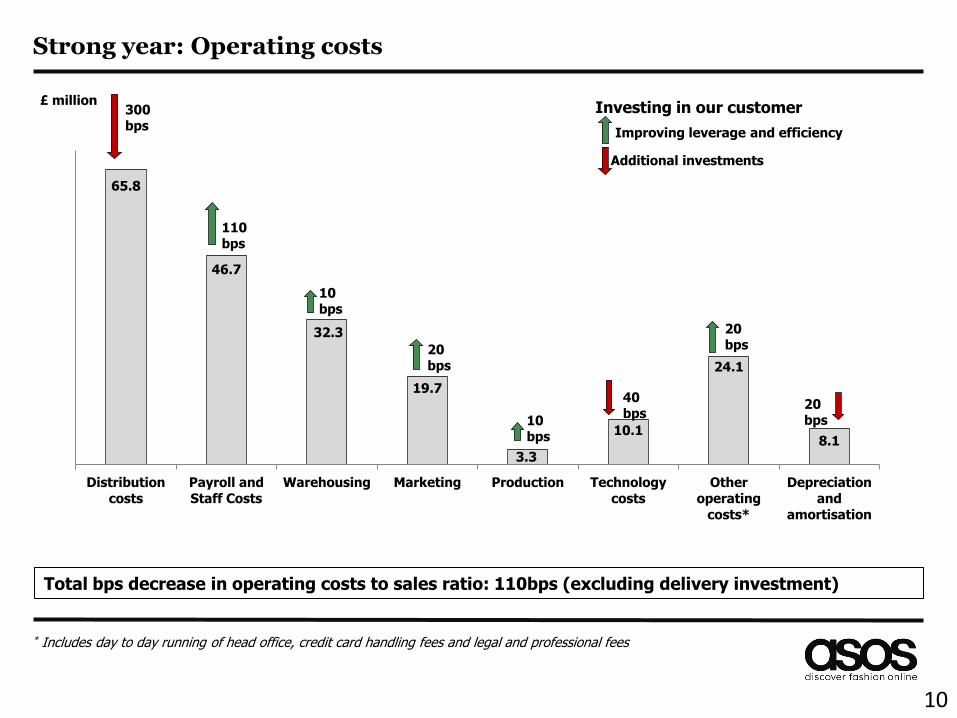
Strong year: Operating costs
* Includes day to day running of head office, credit card handling fees and legal and professional fees
Total bps decrease in operating costs to sales ratio: 110bps (excluding delivery investment)
10
65.8
46.7
32.3
19.7
3.3
10.1
24.1
8.1
Distribution
costs
Payroll and
Staff Costs
Warehousing Marketing Production Technology
costs
Other
operating
costs*
Depreciation
and
amortisation
£ million
10 bps
110 bps
Investing in our customer 300 bps
Improving leverage and efficiency
Additional investments
40 bps
10 bps
20 bps
20 bps
20 bps
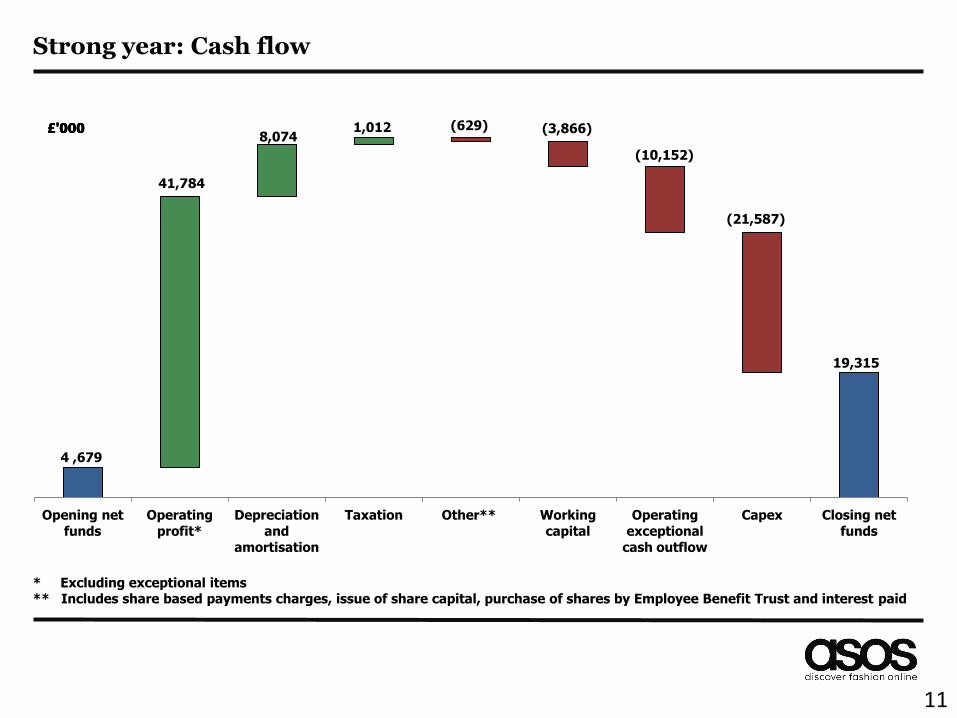
Strong year: Cash flow
11
4 ,679
41,784
8,074 1,012 (629) (3,866)
Opening net
funds
Operating
profit*
Depreciation
and
amortisation
Taxation Other** Working
capital
Operating
exceptional
cash outflow
Capex Closing net
funds
£'000 £'000
(21,587)
19,315
£'000 £'000
(10,152)
* Excluding exceptional items ** Includes share based payments charges, issue of share capital, purchase of shares by Employee Benefit Trust and interest paid
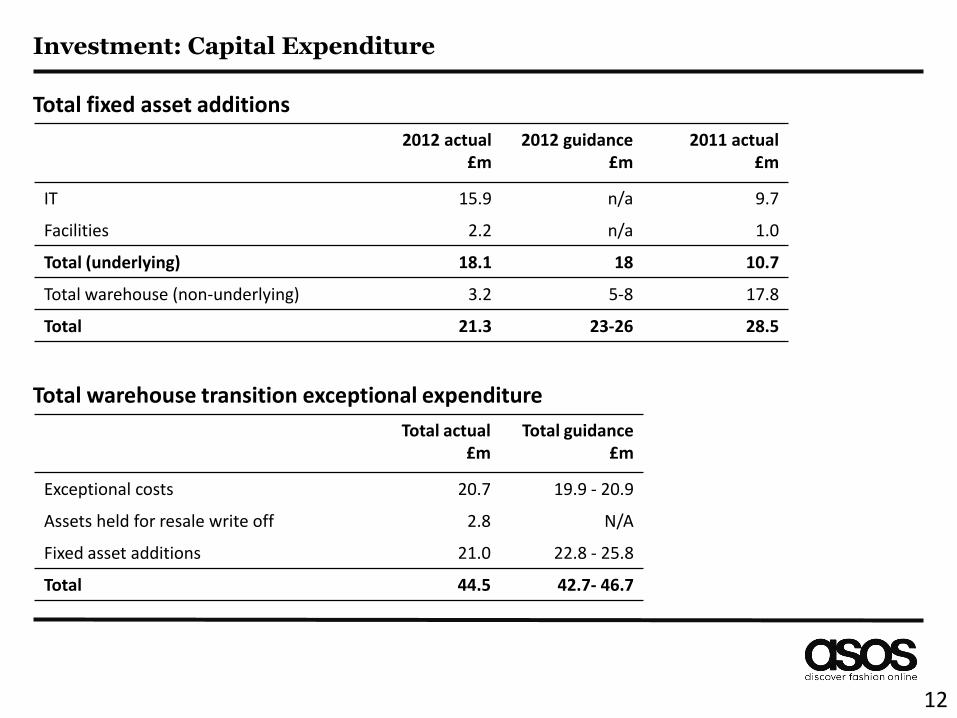
Investment: Capital Expenditure
2012 actual £m
2012 guidance £m
2011 actual £m
IT 15.9 n/a 9.7
Facilities 2.2 n/a 1.0
Total (underlying) 18.1 18 10.7
Total warehouse (non-underlying) 3.2 5-8 17.8
Total 21.3 23-26 28.5
Total actual £m
Total guidance £m
Exceptional costs 20.7 19.9 - 20.9
Assets held for resale write off 2.8 N/A
Fixed asset additions 21.0 22.8 - 25.8
Total 44.5 42.7- 46.7
Total fixed asset additions
Total warehouse transition exceptional expenditure
12
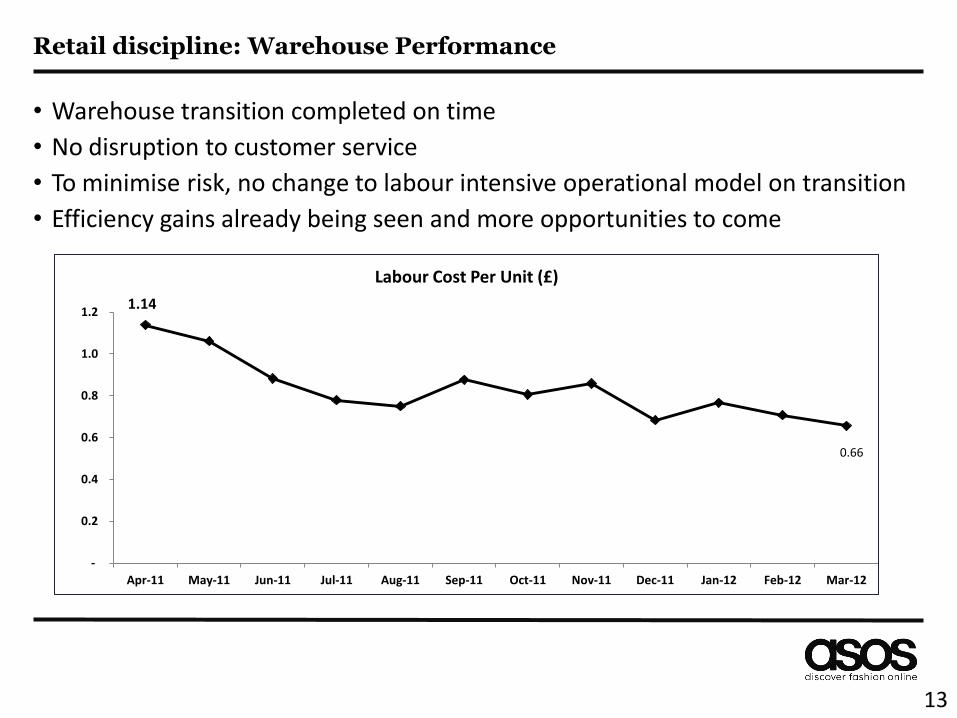
• Warehouse transition completed on time
• No disruption to customer service
• To minimise risk, no change to labour intensive operational model on transition
• Efficiency gains already being seen and more opportunities to come
Retail discipline: Warehouse Performance
0.66
-
0.2
0.4
0.6
0.8
1.0
1.2
Apr-11 May-11 Jun-11 Jul-11 Aug-11 Sep-11 Oct-11 Nov-11 Dec-11 Jan-12 Feb-12 Mar-12
Labour Cost Per Unit (£)
1.14
13
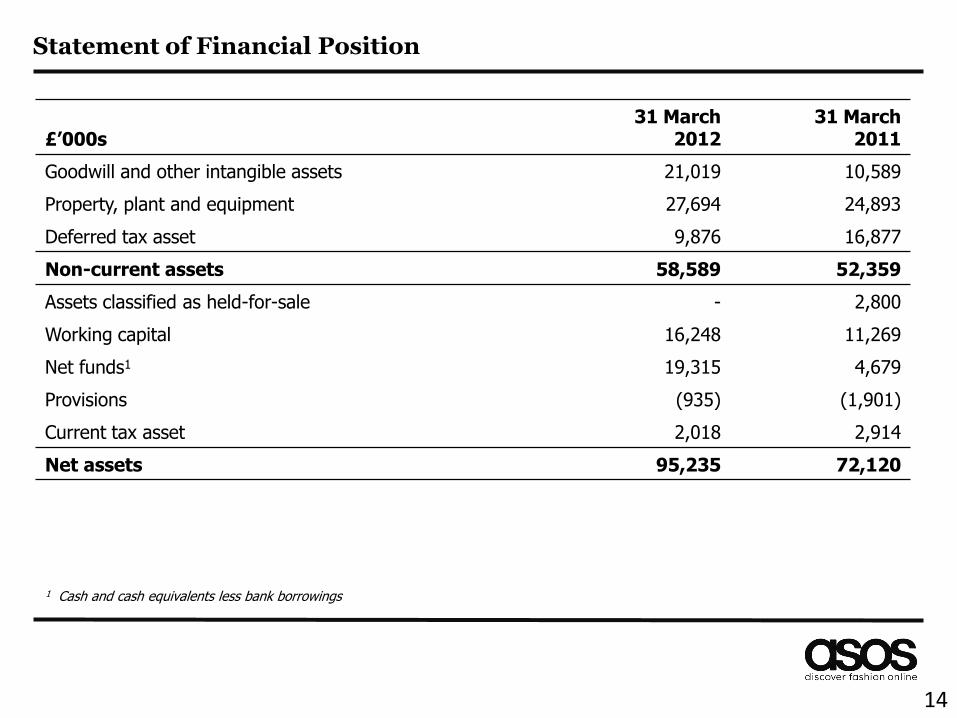
Statement of Financial Position
1 Cash and cash equivalents less bank borrowings
£’000s 31 March
2012 31 March
2011
Goodwill and other intangible assets 21,019 10,589
Property, plant and equipment 27,694 24,893
Deferred tax asset 9,876 16,877
Non-current assets 58,589 52,359
Assets classified as held-for-sale - 2,800
Working capital 16,248 11,269
Net funds1 19,315 4,679
Provisions (935) (1,901)
Current tax asset 2,018 2,914
Net assets 95,235 72,120
14
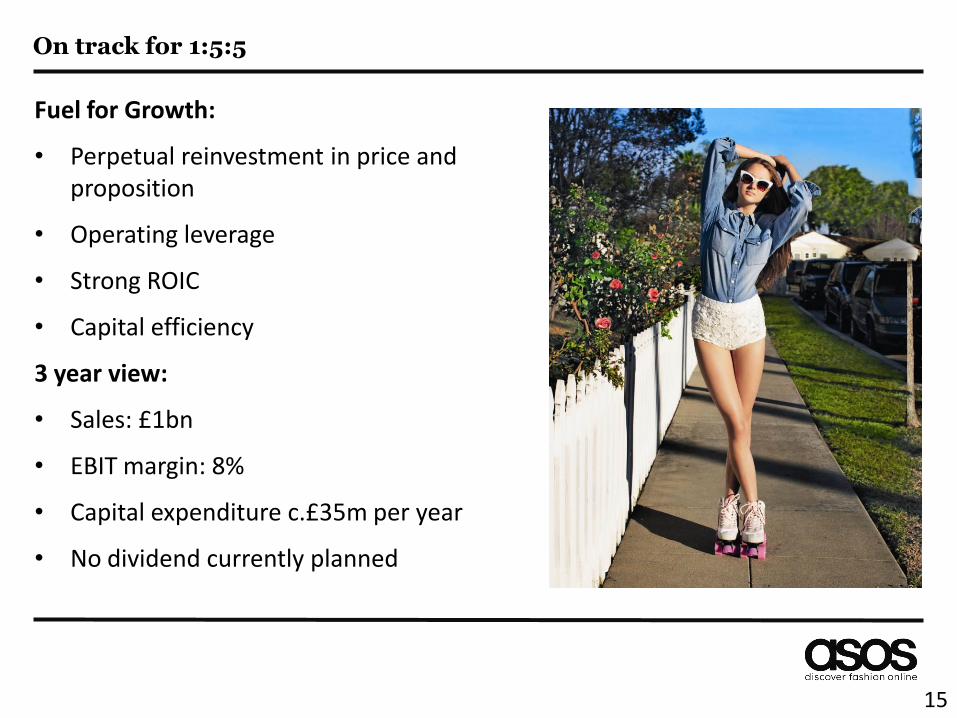
On track for 1:5:5
Fuel for Growth:
• Perpetual reinvestment in price and proposition
• Operating leverage
• Strong ROIC
• Capital efficiency
3 year view:
• Sales: £1bn
• EBIT margin: 8%
• Capital expenditure c.£35m per year
• No dividend currently planned
15
16
Nick Robertson – CEO
17
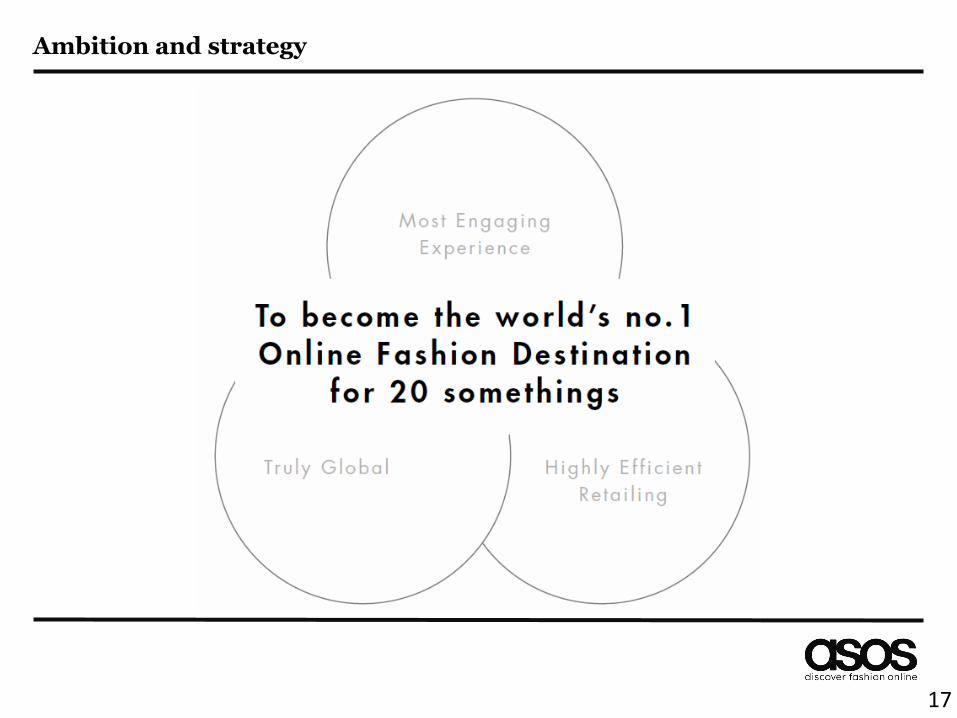
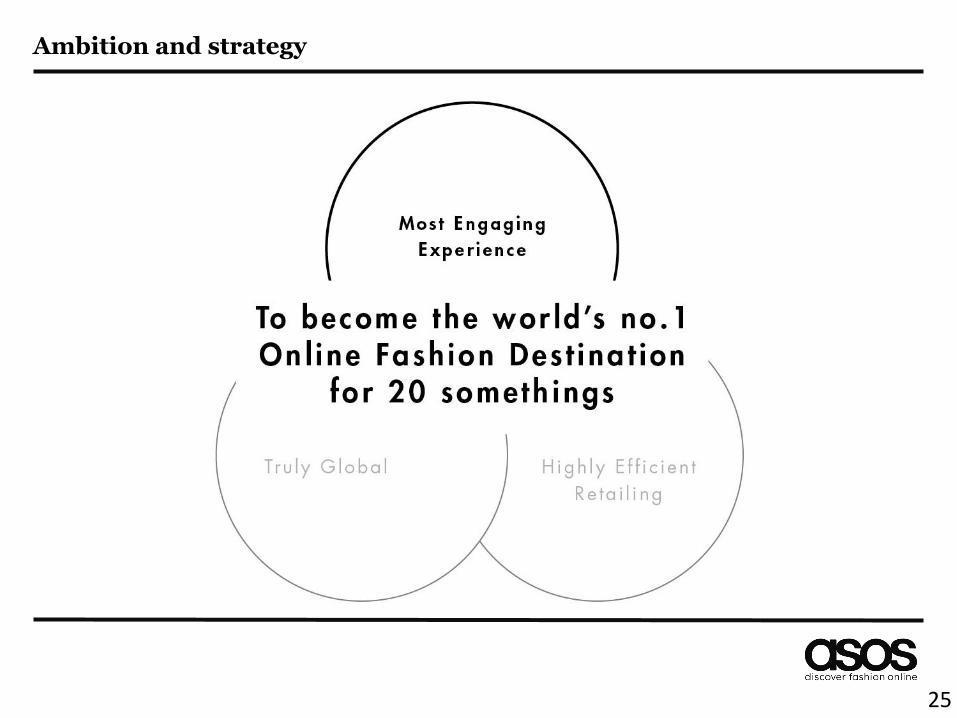
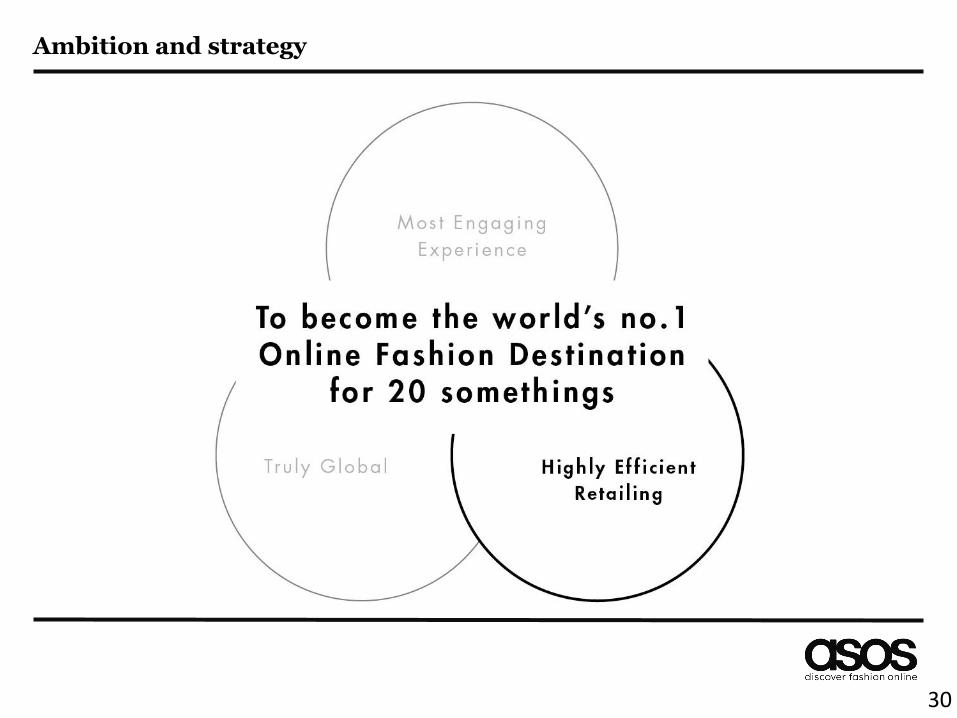
Ambition and strategy
18
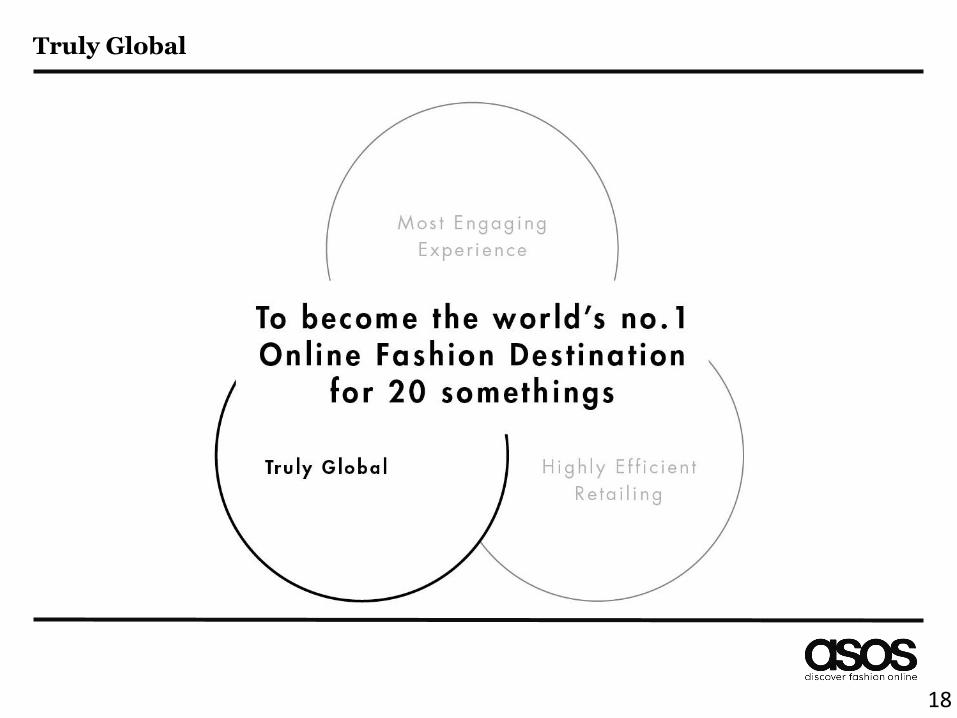
Truly Global
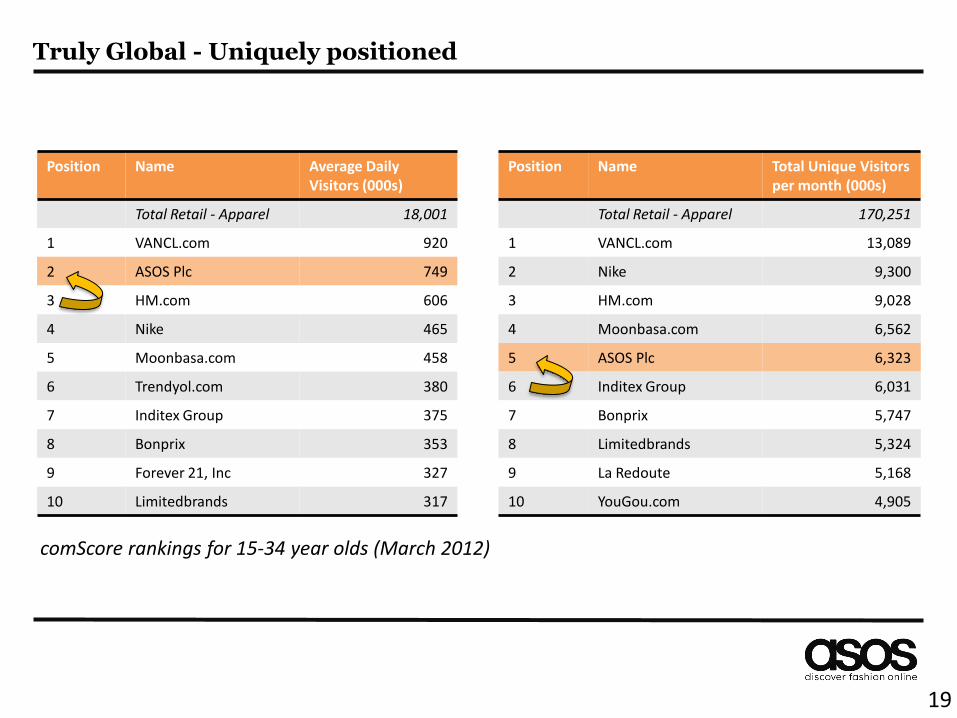
Position Name Average Daily Visitors (000s)
Total Retail - Apparel 18,001
1 VANCL.com 920
2 ASOS Plc 749
3 HM.com 606
4 Nike 465
5 Moonbasa.com 458
6 Trendyol.com 380
7 Inditex Group 375
8 Bonprix 353
9 Forever 21, Inc 327
10 Limitedbrands 317
Position Name Total Unique Visitors per month (000s)
Total Retail - Apparel 170,251
1 VANCL.com 13,089
2 Nike 9,300
3 HM.com 9,028
4 Moonbasa.com 6,562
5 ASOS Plc 6,323
6 Inditex Group 6,031
7 Bonprix 5,747
8 Limitedbrands 5,324
9 La Redoute 5,168
10 YouGou.com 4,905
comScore rankings for 15-34 year olds (March 2012)
Truly Global - Uniquely positioned
19
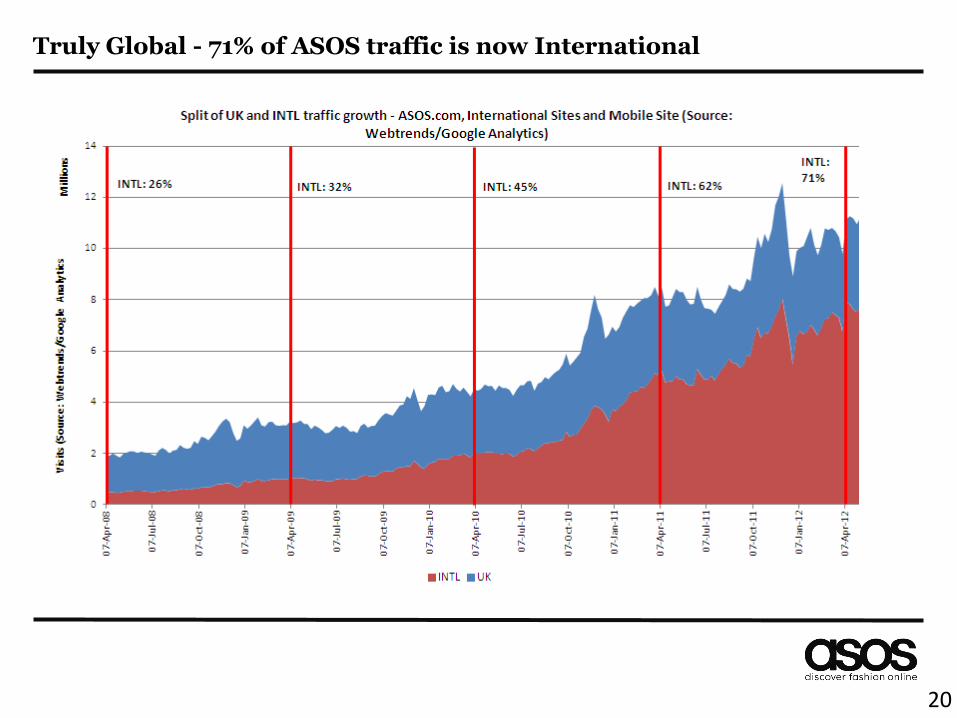
Truly Global - 71% of ASOS traffic is now International
20
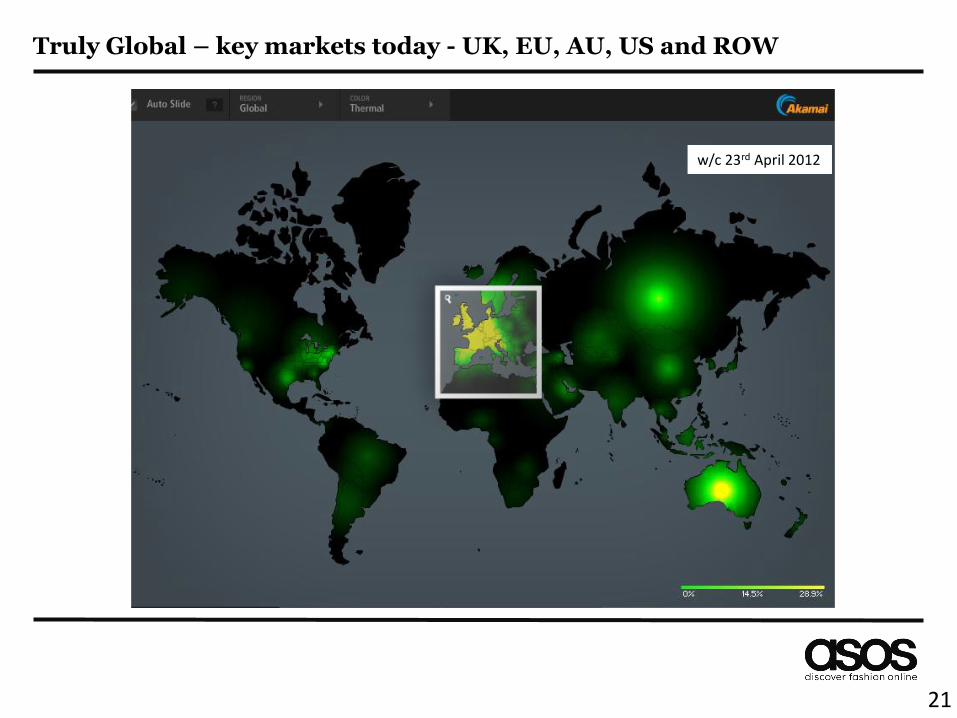
Truly Global – key markets today - UK, EU, AU, US and ROW
21
w/c 23rd April 2012
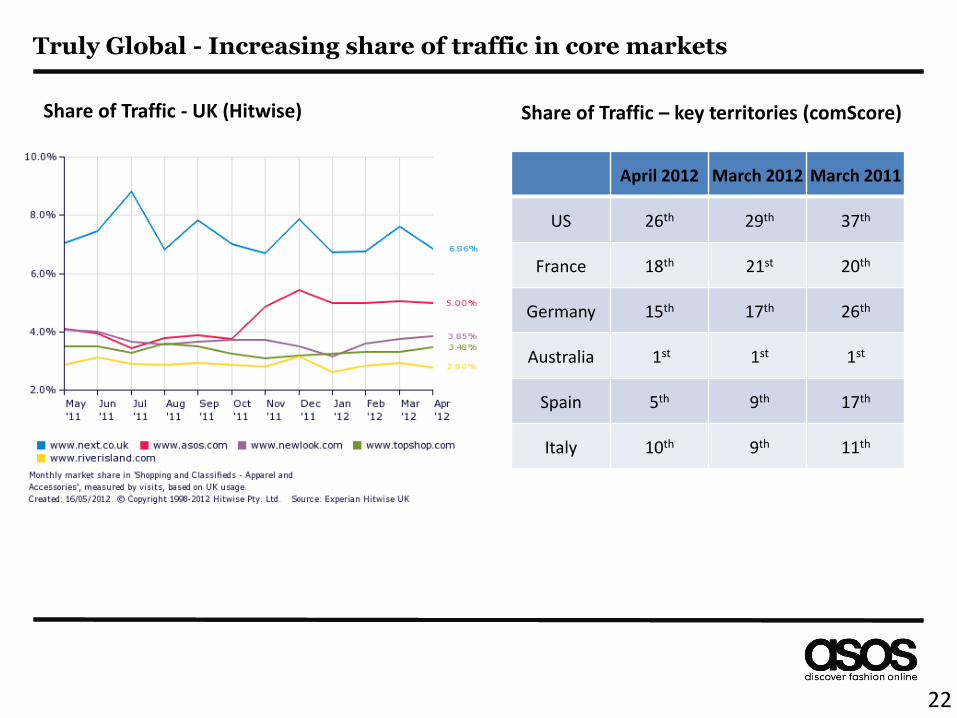
Share of Traffic - UK (Hitwise)
Truly Global - Increasing share of traffic in core markets
22
April 2012 March 2012 March 2011
US 26th 29th 37th
France 18th 21st 20th
Germany 15th 17th 26th
Australia 1st 1st 1st
Spain 5th 9th 17th
Italy 10th 9th 11th
Share of Traffic – key territories (comScore)

Truly Global - On track to 1 : 5 : 5
• Half way there
• 11 languages reach 90% of the worlds GDP
- ASOS is in 5 languages already (ENG, ES, DE, IT, FR)
• There are 2.3 billion 15-34 year olds globally
• Size of online apparel market is estimated at £76bn by 2015*
• £1bn = 1.3%
23
* Euromonitor International
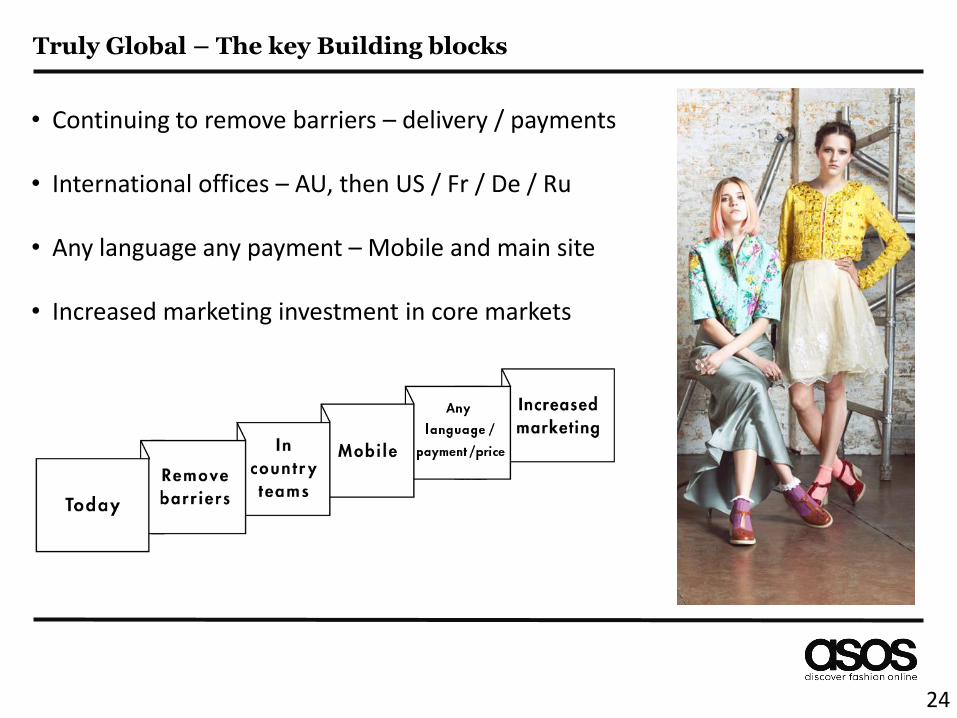
Truly Global – The key Building blocks
• Continuing to remove barriers – delivery / payments • International offices – AU, then US / Fr / De / Ru • Any language any payment – Mobile and main site • Increased marketing investment in core markets
24
25
Ambition and strategy
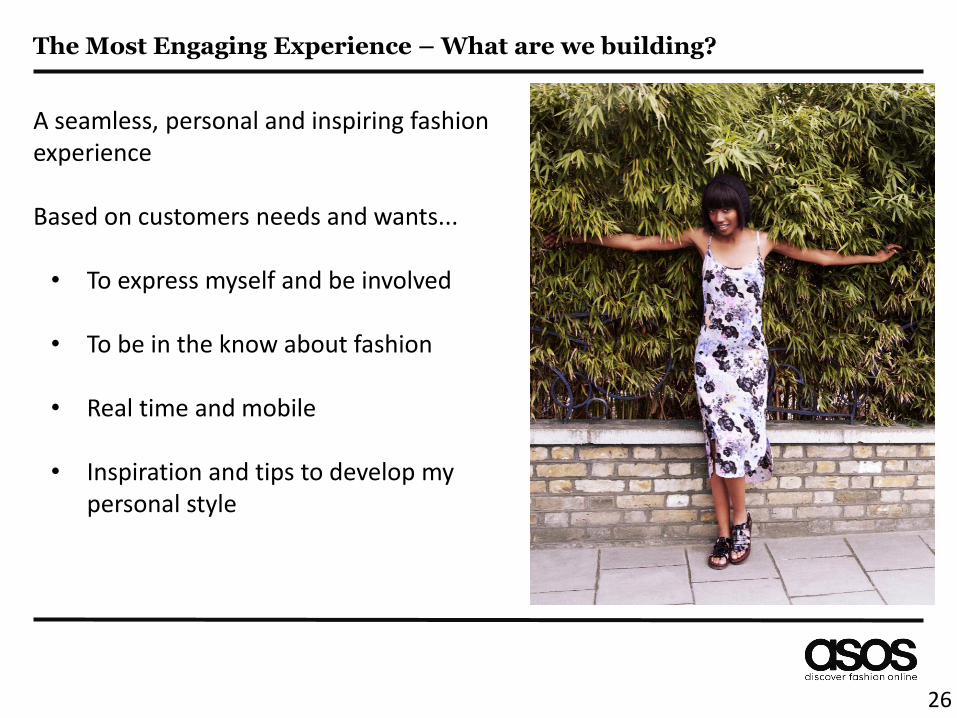
The Most Engaging Experience – What are we building?
A seamless, personal and inspiring fashion experience Based on customers needs and wants... • To express myself and be involved
• To be in the know about fashion
• Real time and mobile
• Inspiration and tips to develop my
personal style
26
27
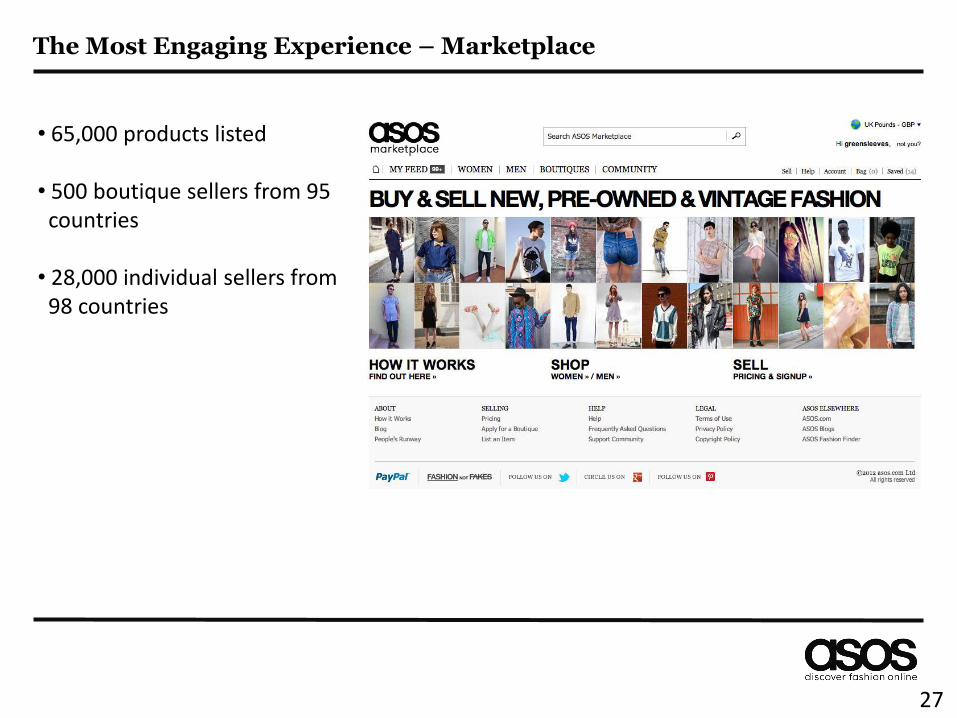
• 65,000 products listed • 500 boutique sellers from 95 countries • 28,000 individual sellers from 98 countries
The Most Engaging Experience – Marketplace
28
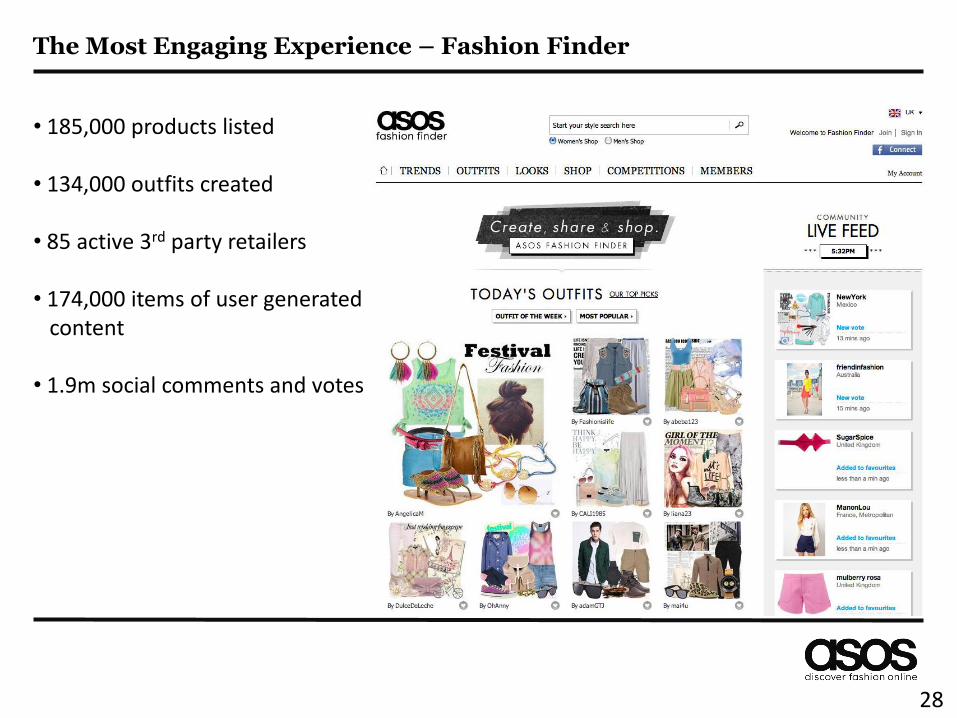
• 185,000 products listed • 134,000 outfits created • 85 active 3rd party retailers • 174,000 items of user generated content • 1.9m social comments and votes
The Most Engaging Experience – Fashion Finder
29
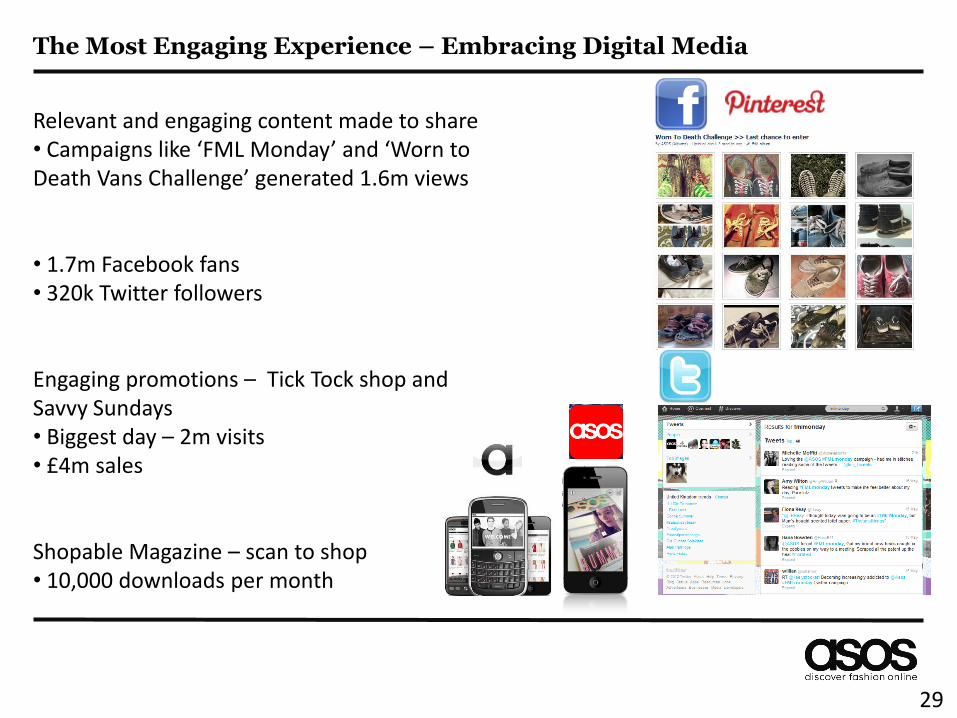
Relevant and engaging content made to share • Campaigns like ‘FML Monday’ and ‘Worn to Death Vans Challenge’ generated 1.6m views • 1.7m Facebook fans • 320k Twitter followers Engaging promotions – Tick Tock shop and Savvy Sundays • Biggest day – 2m visits • £4m sales Shopable Magazine – scan to shop • 10,000 downloads per month
The Most Engaging Experience – Embracing Digital Media
30
Ambition and strategy
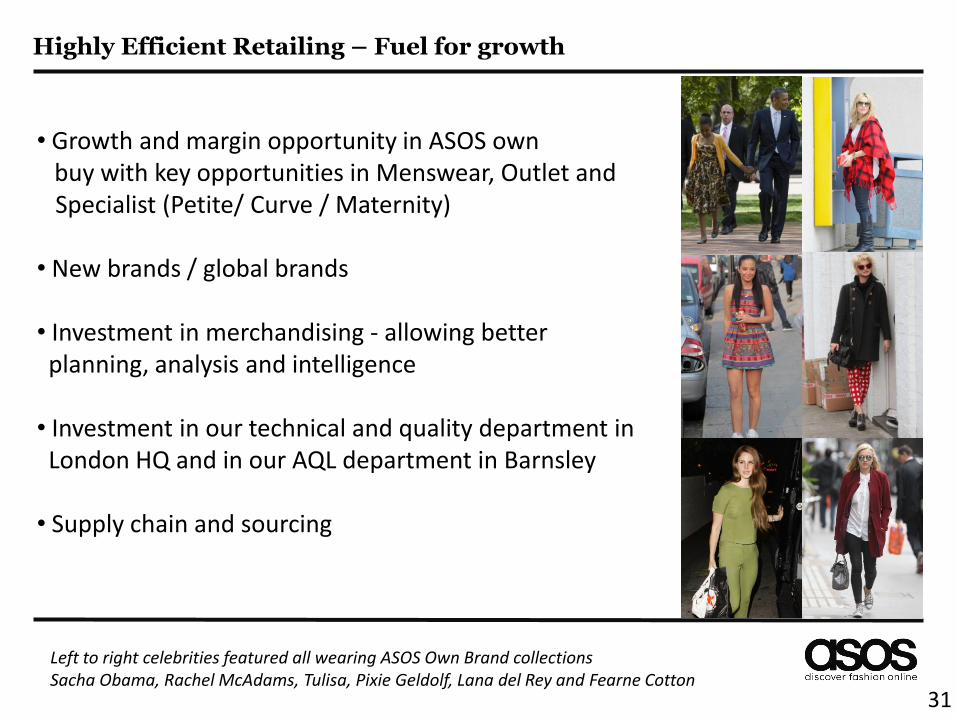
• Growth and margin opportunity in ASOS own buy with key opportunities in Menswear, Outlet and
Specialist (Petite/ Curve / Maternity) • New brands / global brands • Investment in merchandising - allowing better planning, analysis and intelligence • Investment in our technical and quality department in London HQ and in our AQL department in Barnsley • Supply chain and sourcing
31
Highly Efficient Retailing – Fuel for growth
Left to right celebrities featured all wearing ASOS Own Brand collections Sacha Obama, Rachel McAdams, Tulisa, Pixie Geldolf, Lana del Rey and Fearne Cotton
To become the world’s number 1 fashion destination for twenty-somethings • The Most Engaging Experience • Truly Global • Highly Efficient Retailing
On track for 1:5:5 Our opportunity - To define fashion online
Summary
32
Appendices
33
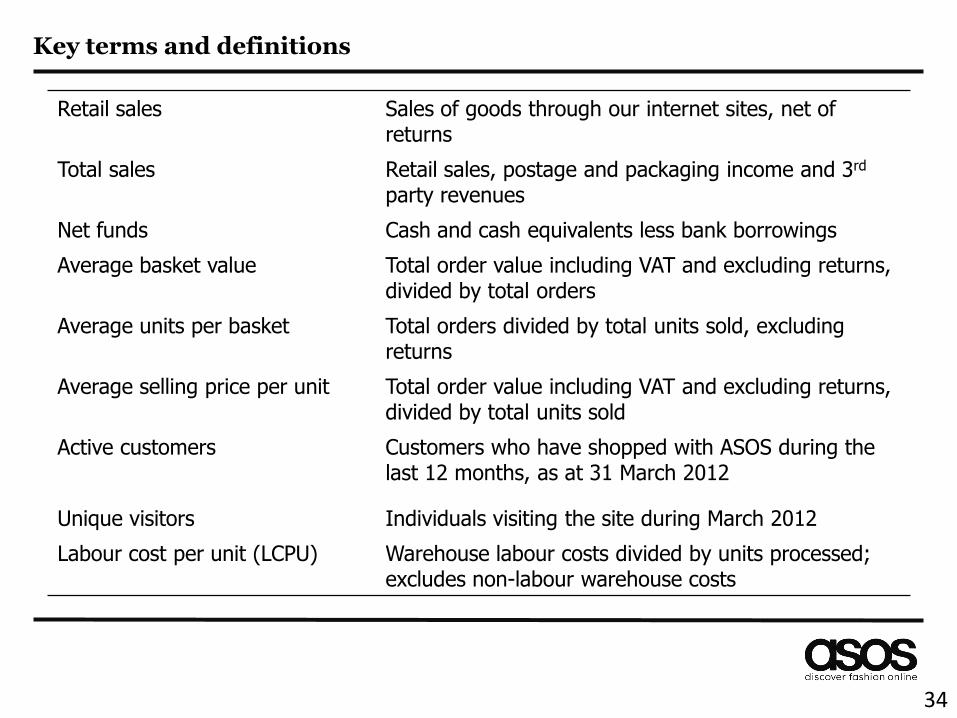
Key terms and definitions
Retail sales Sales of goods through our internet sites, net of returns
Total sales Retail sales, postage and packaging income and 3rd party revenues
Net funds Cash and cash equivalents less bank borrowings
Average basket value Total order value including VAT and excluding returns, divided by total orders
Average units per basket Total orders divided by total units sold, excluding returns
Average selling price per unit Total order value including VAT and excluding returns, divided by total units sold
Active customers
Customers who have shopped with ASOS during the last 12 months, as at 31 March 2012
Unique visitors Individuals visiting the site during March 2012
Labour cost per unit (LCPU) Warehouse labour costs divided by units processed; excludes non-labour warehouse costs
34
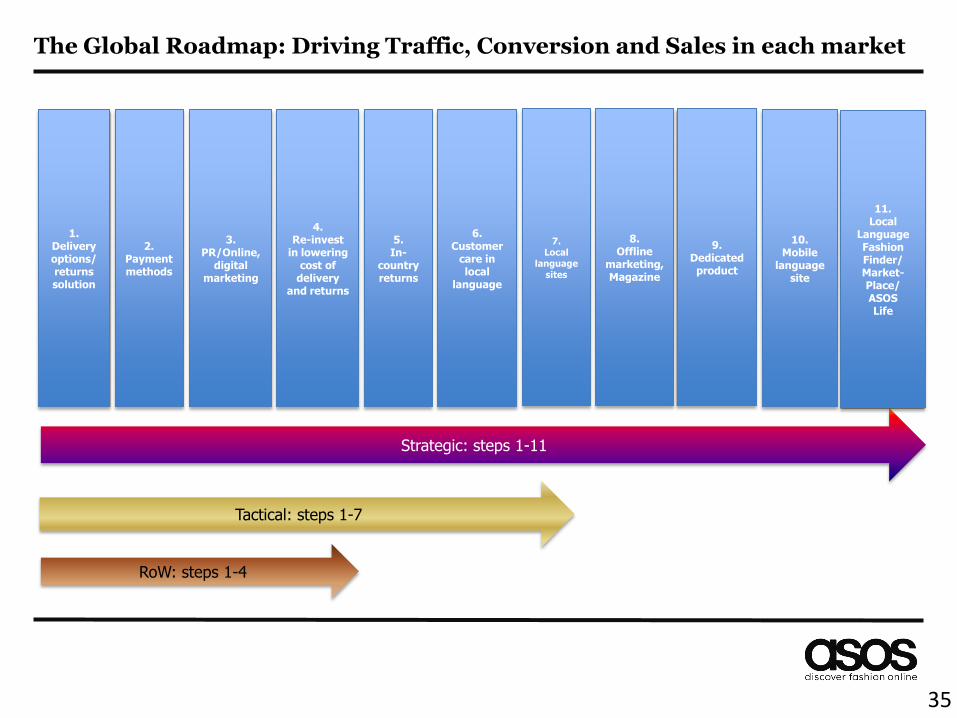
The Global Roadmap: Driving Traffic, Conversion and Sales in each market
Strategic: steps 1-11
Tactical: steps 1-7
RoW: steps 1-4
11. Local
Language Fashion Finder/ Market- Place/ ASOS Life
10. Mobile
language site
9. Dedicated product
8. Offline
marketing, Magazine
7. Local
language sites
6. Customer
care in local
language
1. Delivery options/ returns solution
5. In-
country returns
2. Payment methods
3. PR/Online,
digital marketing
4. Re-invest
in lowering cost of
delivery and returns
35
0
10
20
30
40
50
60
70
80
April May June July Aug Sep Oct Nov Dec Jan Feb Mar
2009/10 2010/11 2011/12
10%
15%
20%
25%
30%
35%
40%
April May June July Aug Sep Oct Nov Dec Jan Feb Mar
2009/10 2010/11 2011/12
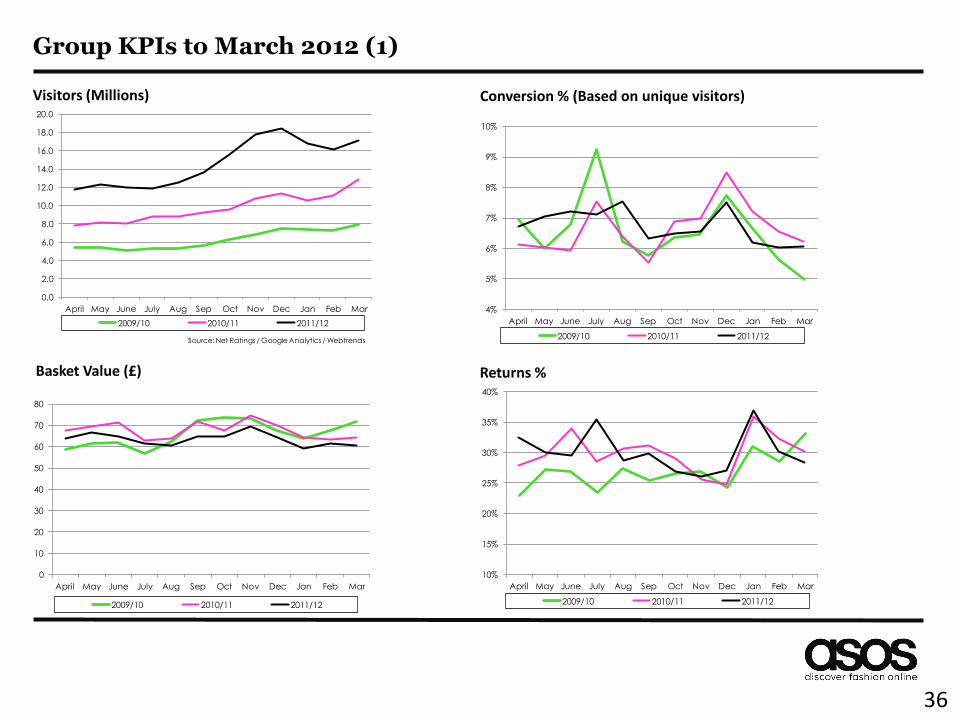
Group KPIs to March 2012 (1)
4%
5%
6%
7%
8%
9%
10%
April May June July Aug Sep Oct Nov Dec Jan Feb Mar
2009/10 2010/11 2011/12
0.0
2.0
4.0
6.0
8.0
10.0
12.0
14.0
16.0
18.0
20.0
April May June July Aug Sep Oct Nov Dec Jan Feb Mar
2009/10 2010/11 2011/12
Source: Net Ratings / Google Analytics / Webtrends
Visitors (Millions) Conversion % (Based on unique visitors)
Basket Value (£) Returns %
36
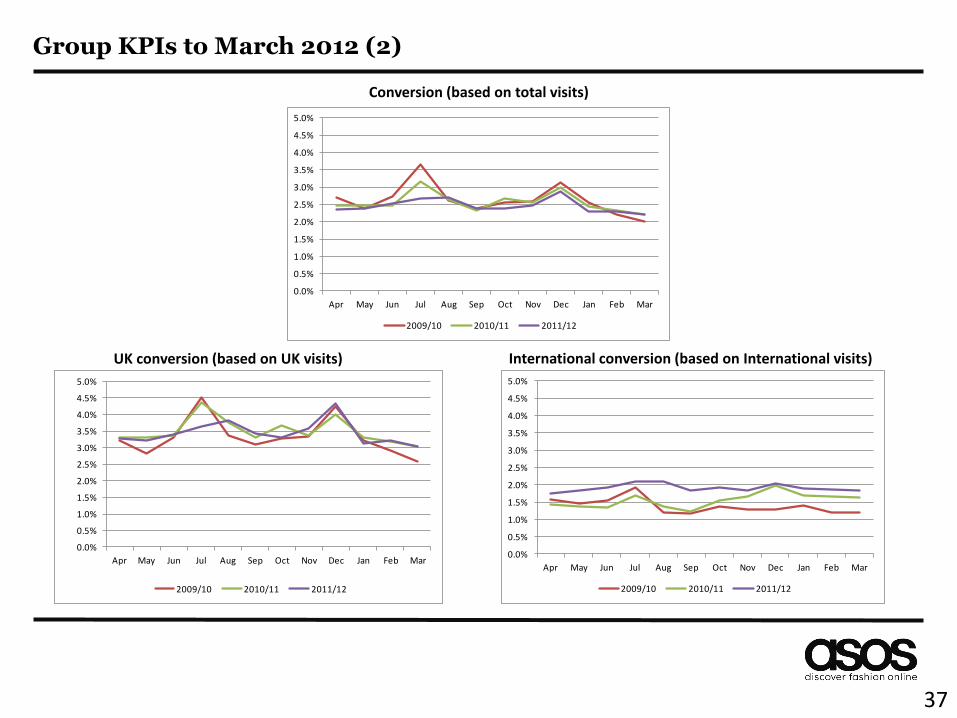
Group KPIs to March 2012 (2)
Conversion (based on total visits)
UK conversion (based on UK visits) International conversion (based on International visits)
0.0%
0.5%
1.0%
1.5%
2.0%
2.5%
3.0%
3.5%
4.0%
4.5%
5.0%
Apr May Jun Jul Aug Sep Oct Nov Dec Jan Feb Mar
2009/10 2010/11 2011/12
0.0%
0.5%
1.0%
1.5%
2.0%
2.5%
3.0%
3.5%
4.0%
4.5%
5.0%
Apr May Jun Jul Aug Sep Oct Nov Dec Jan Feb Mar
2009/10 2010/11 2011/12
0.0%
0.5%
1.0%
1.5%
2.0%
2.5%
3.0%
3.5%
4.0%
4.5%
5.0%
Apr May Jun Jul Aug Sep Oct Nov Dec Jan Feb Mar
2009/10 2010/11 2011/12
37
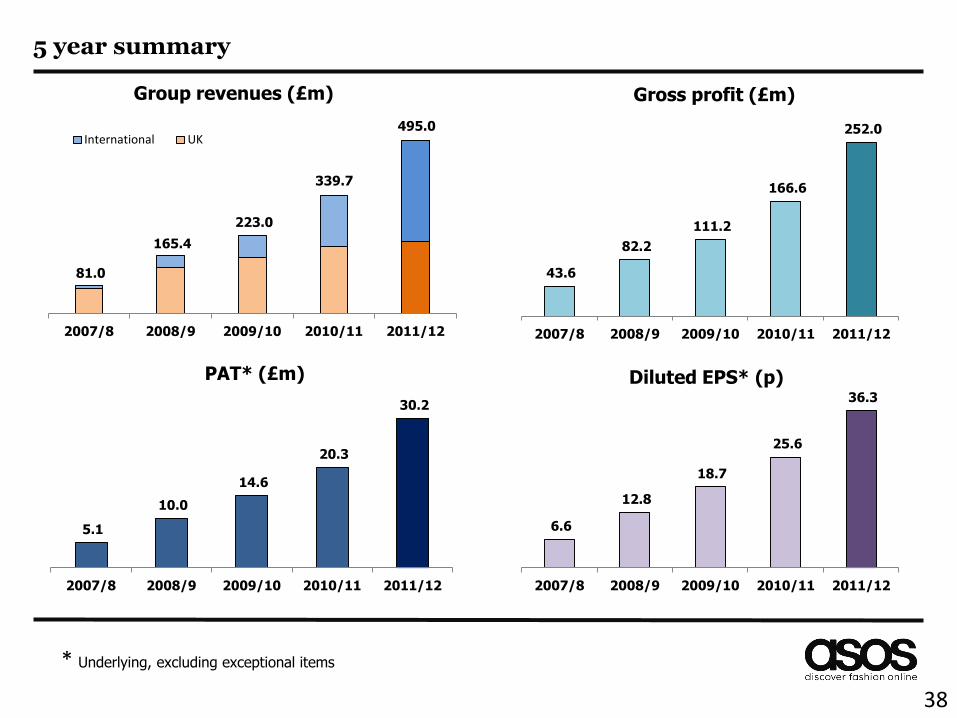
5 year summary
81.0
165.4
223.0
339.7
495.0
2007/8 2008/9 2009/10 2010/11 2011/12
Group revenues (£m)
International UK
43.6
82.2
111.2
166.6
252.0
2007/8 2008/9 2009/10 2010/11 2011/12
Gross profit (£m)
5.1
10.0
14.6
20.3
30.2
2007/8 2008/9 2009/10 2010/11 2011/12
PAT* (£m)
* Underlying, excluding exceptional items
38
6.6
12.8
18.7
25.6
36.3
2007/8 2008/9 2009/10 2010/11 2011/12
Diluted EPS* (p)
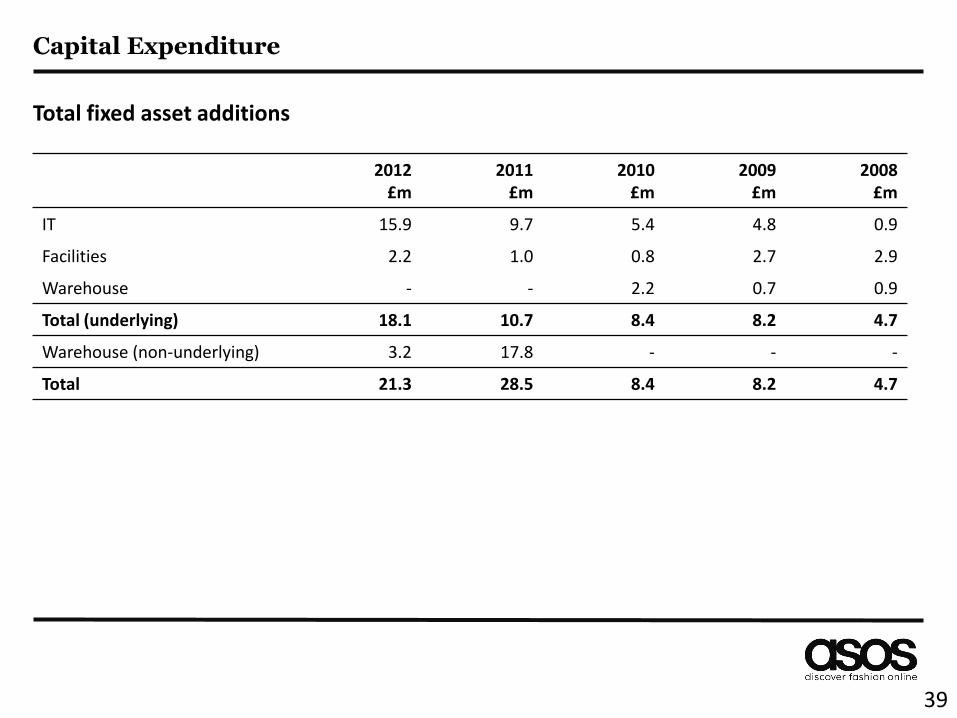
Capital Expenditure
2012 £m
2011 £m
2010 £m
2009 £m
2008 £m
IT 15.9 9.7 5.4 4.8 0.9
Facilities 2.2 1.0 0.8 2.7 2.9
Warehouse - - 2.2 0.7 0.9
Total (underlying) 18.1 10.7 8.4 8.2 4.7
Warehouse (non-underlying) 3.2 17.8 - - -
Total 21.3 28.5 8.4 8.2 4.7
Total fixed asset additions
39
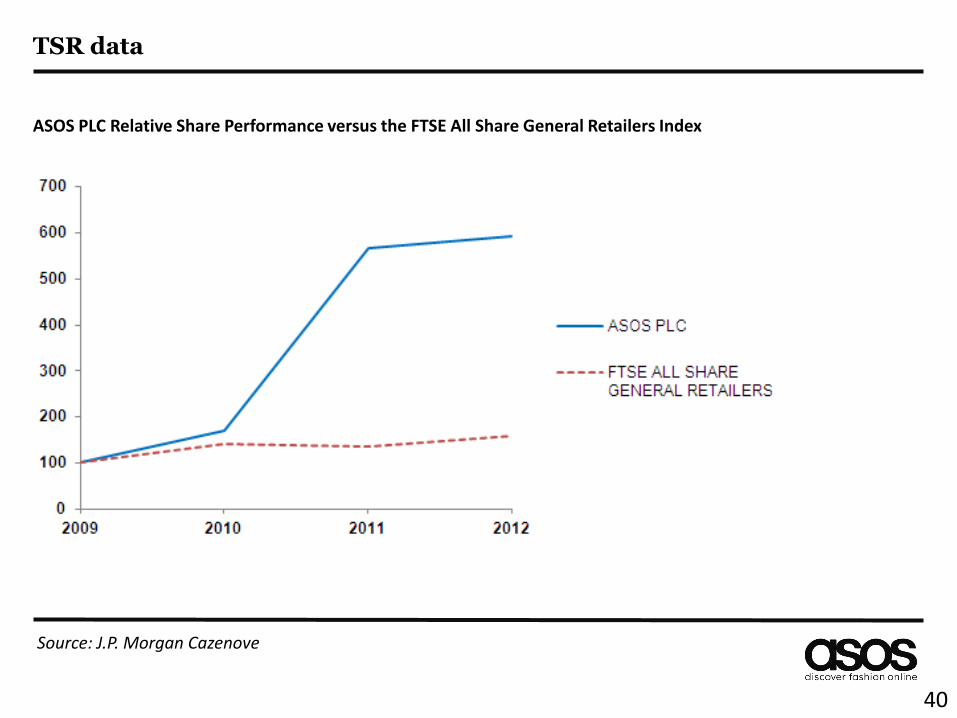
TSR data
ASOS PLC Relative Share Performance versus the FTSE All Share General Retailers Index
40
Source: J.P. Morgan Cazenove
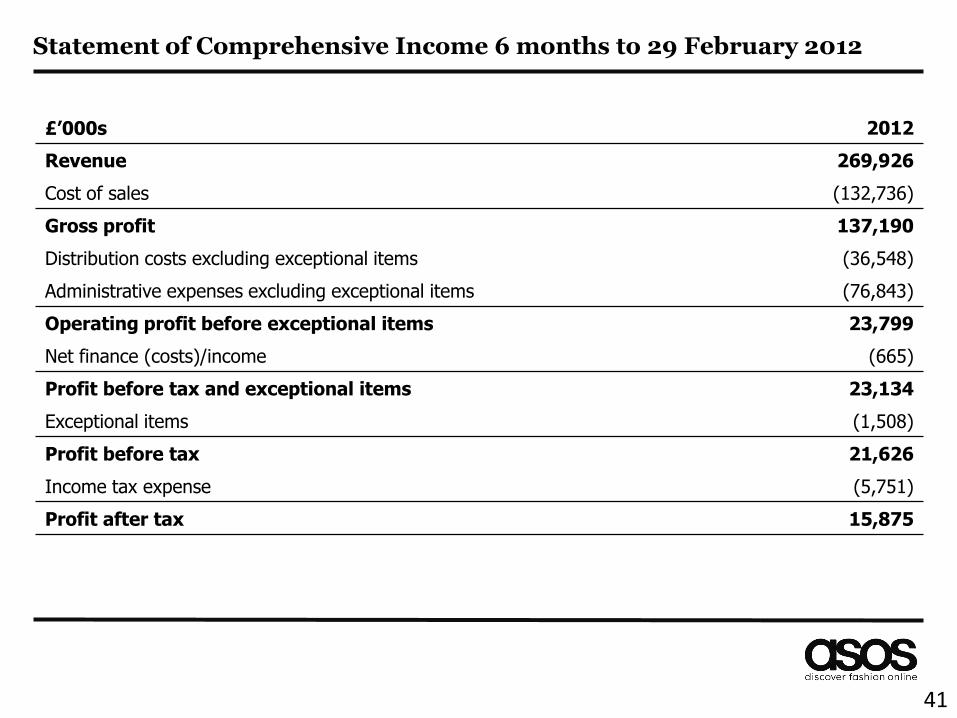
Statement of Comprehensive Income 6 months to 29 February 2012
£’000s 2012
Revenue 269,926
Cost of sales (132,736)
Gross profit 137,190
Distribution costs excluding exceptional items (36,548)
Administrative expenses excluding exceptional items (76,843)
Operating profit before exceptional items 23,799
Net finance (costs)/income (665)
Profit before tax and exceptional items 23,134
Exceptional items (1,508)
Profit before tax 21,626
Income tax expense (5,751)
Profit after tax 15,875
41
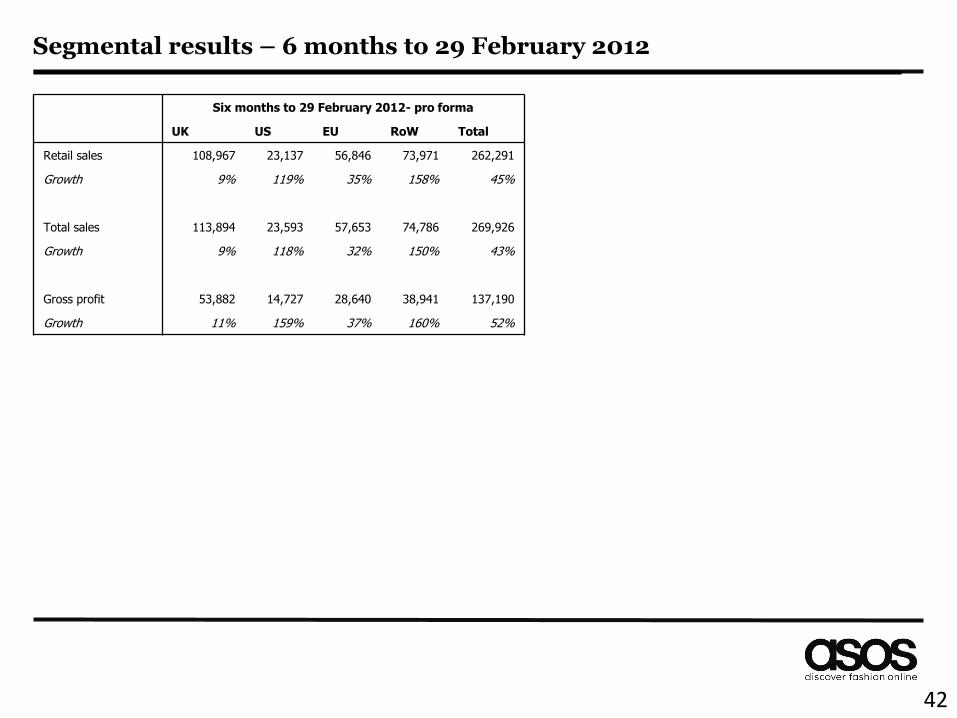
Segmental results – 6 months to 29 February 2012
42
Six months to 29 February 2012- pro forma
UK US EU RoW Total
Retail sales 108,967 23,137 56,846 73,971 262,291
Growth 9% 119% 35% 158% 45%
Total sales 113,894 23,593 57,653 74,786 269,926
Growth 9% 118% 32% 150% 43%
Gross profit 53,882 14,727 28,640 38,941 137,190
Growth 11% 159% 37% 160% 52%
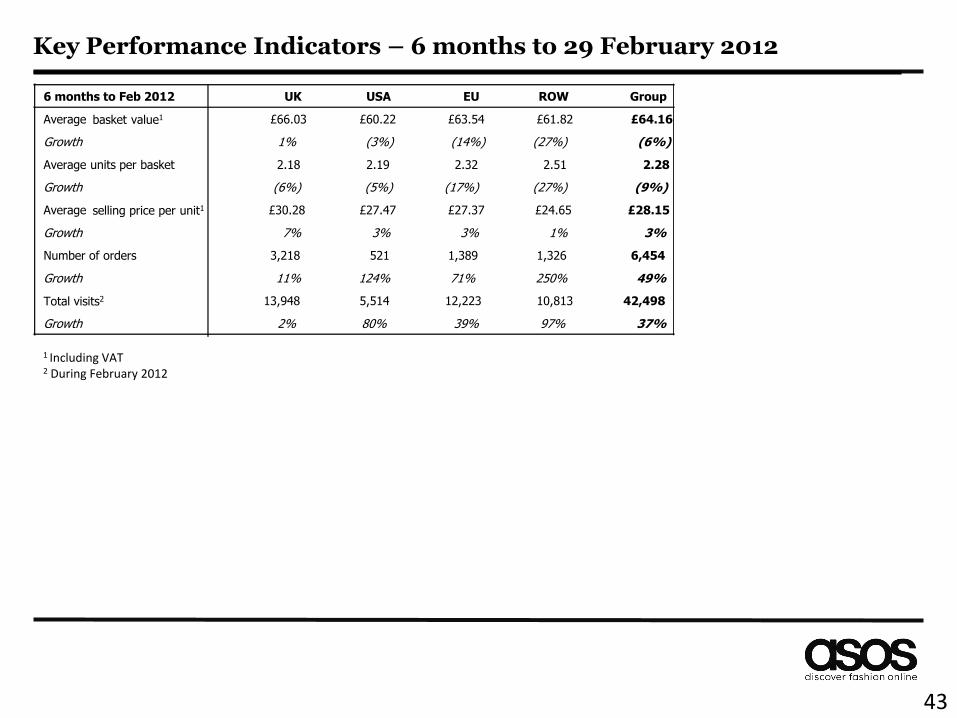
Key Performance Indicators – 6 months to 29 February 2012
43
6 months to Feb 2012 UK USA EU ROW Group
Average basket value1 £66.03 £60.22 £63.54 £61.82 £64.16
Growth 1% (3%) (14%) (27%) (6%)
Average units per basket 2.18 2.19 2.32 2.51 2.28
Growth (6%) (5%) (17%) (27%) (9%)
Average selling price per unit1 £30.28 £27.47 £27.37 £24.65 £28.15
Growth 7% 3% 3% 1% 3%
Number of orders 3,218 521 1,389 1,326 6,454
Growth 11% 124% 71% 250% 49%
Total visits2 13,948 5,514 12,223 10,813 42,498
Growth 2% 80% 39% 97% 37%
1 Including VAT 2 During February 2012
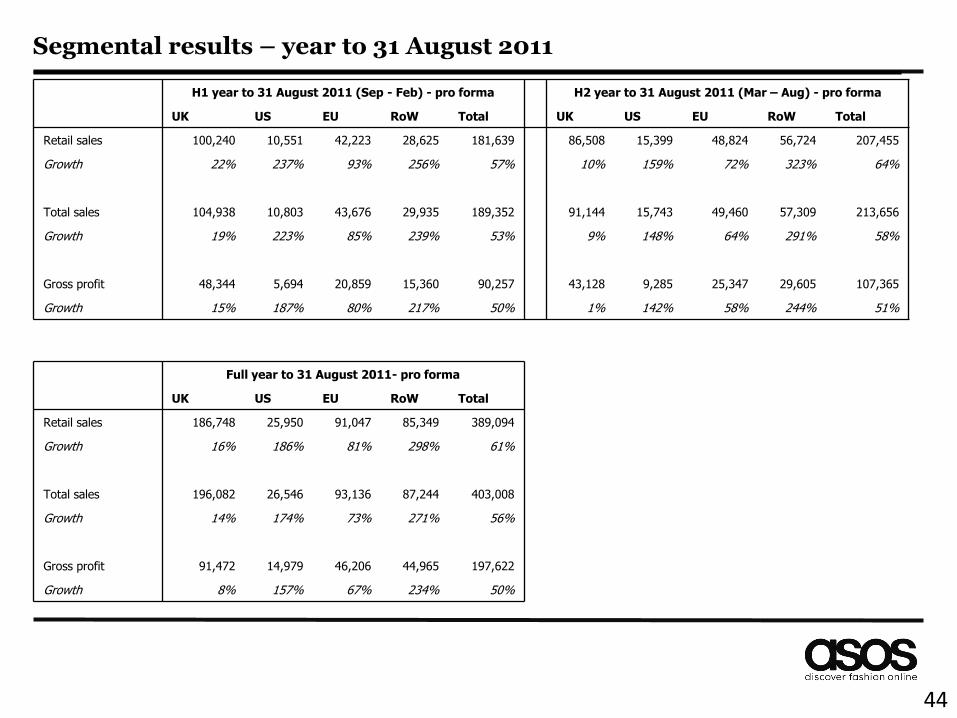
Segmental results – year to 31 August 2011
H1 year to 31 August 2011 (Sep - Feb) - pro forma H2 year to 31 August 2011 (Mar – Aug) - pro forma
UK US EU RoW Total UK US EU RoW Total
Retail sales 100,240 10,551 42,223 28,625 181,639 86,508 15,399 48,824 56,724 207,455
Growth 22% 237% 93% 256% 57% 10% 159% 72% 323% 64%
Total sales 104,938 10,803 43,676 29,935 189,352 91,144 15,743 49,460 57,309 213,656
Growth 19% 223% 85% 239% 53% 9% 148% 64% 291% 58%
Gross profit 48,344 5,694 20,859 15,360 90,257 43,128 9,285 25,347 29,605 107,365
Growth 15% 187% 80% 217% 50% 1% 142% 58% 244% 51%
Full year to 31 August 2011- pro forma
UK US EU RoW Total
Retail sales 186,748 25,950 91,047 85,349 389,094
Growth 16% 186% 81% 298% 61%
Total sales 196,082 26,546 93,136 87,244 403,008
Growth 14% 174% 73% 271% 56%
Gross profit 91,472 14,979 46,206 44,965 197,622
Growth 8% 157% 67% 234% 50%
44
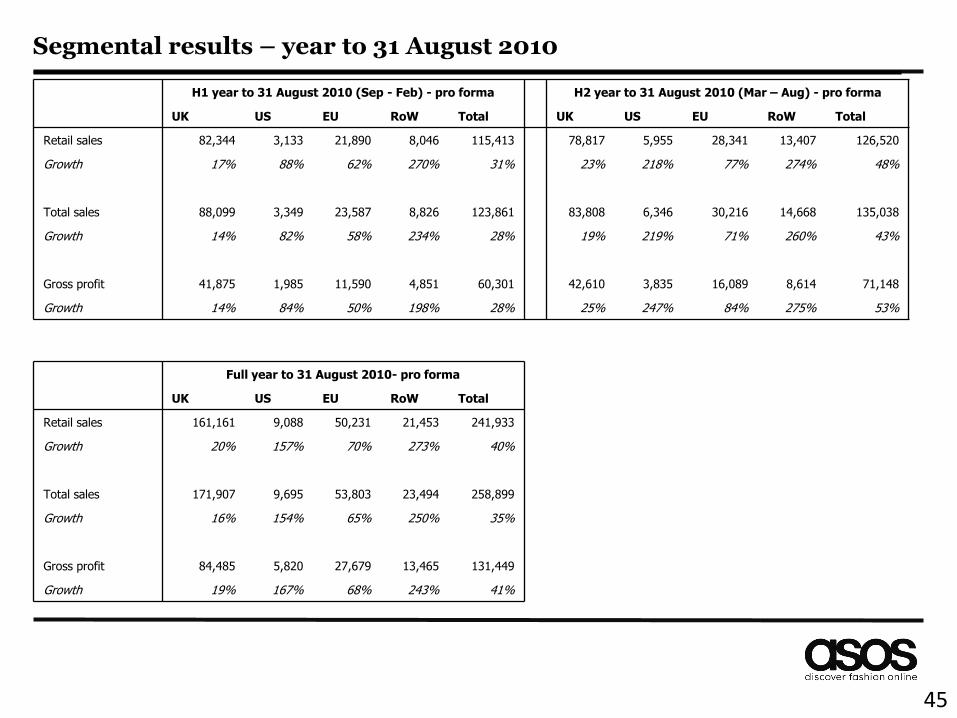
Segmental results – year to 31 August 2010
H1 year to 31 August 2010 (Sep - Feb) - pro forma H2 year to 31 August 2010 (Mar – Aug) - pro forma
UK US EU RoW Total UK US EU RoW Total
Retail sales 82,344 3,133 21,890 8,046 115,413 78,817 5,955 28,341 13,407 126,520
Growth 17% 88% 62% 270% 31% 23% 218% 77% 274% 48%
Total sales 88,099 3,349 23,587 8,826 123,861 83,808 6,346 30,216 14,668 135,038
Growth 14% 82% 58% 234% 28% 19% 219% 71% 260% 43%
Gross profit 41,875 1,985 11,590 4,851 60,301 42,610 3,835 16,089 8,614 71,148
Growth 14% 84% 50% 198% 28% 25% 247% 84% 275% 53%
Full year to 31 August 2010- pro forma
UK US EU RoW Total
Retail sales 161,161 9,088 50,231 21,453 241,933
Growth 20% 157% 70% 273% 40%
Total sales 171,907 9,695 53,803 23,494 258,899
Growth 16% 154% 65% 250% 35%
Gross profit 84,485 5,820 27,679 13,465 131,449
Growth 19% 167% 68% 243% 41%
45
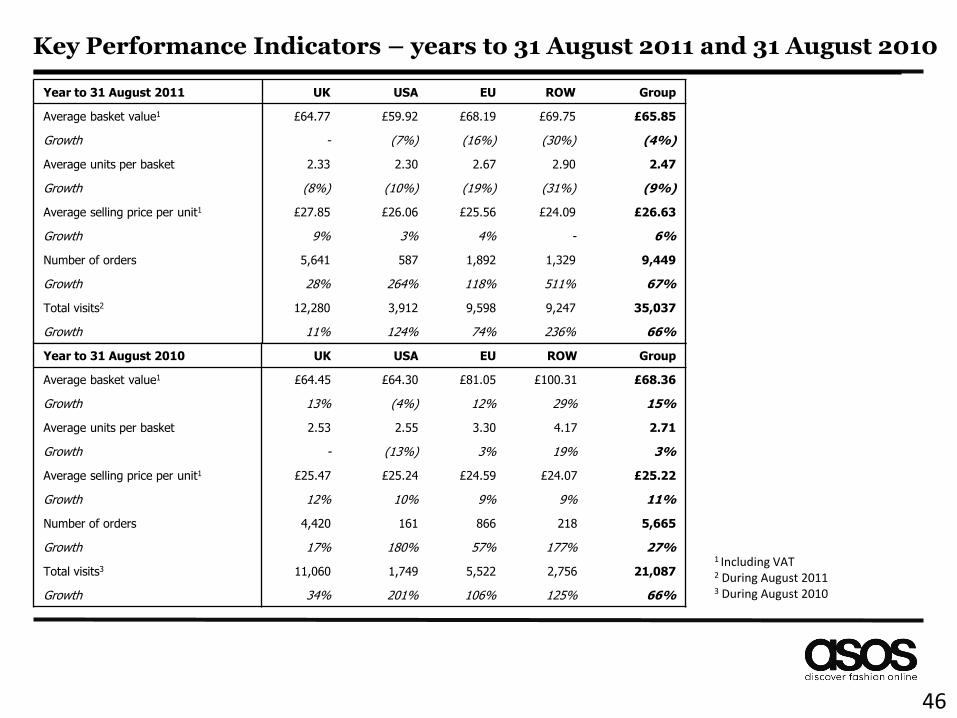
Key Performance Indicators – years to 31 August 2011 and 31 August 2010
46
1 Including VAT 2 During August 2011 3 During August 2010
Year to 31 August 2011 UK USA EU ROW Group
Average basket value1 £64.77 £59.92 £68.19 £69.75 £65.85
Growth - (7%) (16%) (30%) (4%)
Average units per basket 2.33 2.30 2.67 2.90 2.47
Growth (8%) (10%) (19%) (31%) (9%)
Average selling price per unit1 £27.85 £26.06 £25.56 £24.09 £26.63
Growth 9% 3% 4% - 6%
Number of orders 5,641 587 1,892 1,329 9,449
Growth 28% 264% 118% 511% 67%
Total visits2 12,280 3,912 9,598 9,247 35,037
Growth 11% 124% 74% 236% 66%
Year to 31 August 2010 UK USA EU ROW Group
Average basket value1 £64.45 £64.30 £81.05 £100.31 £68.36
Growth 13% (4%) 12% 29% 15%
Average units per basket 2.53 2.55 3.30 4.17 2.71
Growth - (13%) 3% 19% 3%
Average selling price per unit1 £25.47 £25.24 £24.59 £24.07 £25.22
Growth 12% 10% 9% 9% 11%
Number of orders 4,420 161 866 218 5,665
Growth 17% 180% 57% 177% 27%
Total visits3 11,060 1,749 5,522 2,756 21,087
Growth 34% 201% 106% 125% 66%
This presentation and information communicated verbally to you may contain certain projections and other forward-looking statements with respect to the financial condition, results of operations, businesses and prospects of ASOS plc (“ASOS”). These statements are based on current expectations and involve risk and uncertainty because they relate to events and depend upon circumstances that may or may not occur in the future. There are a number of factors which could cause actual results or developments to differ materially from those expressed or implied by these forward-looking statements. Any of the assumptions underlying these forward-looking statements could prove inaccurate or incorrect and therefore any results contemplated in the forward-looking statements may not actually be achieved. Nothing contained in this presentation or communicated verbally should be construed as a profit forecast or profit estimate. Investors or other recipients are cautioned not to place undue reliance on any forward-looking statements contained herein. ASOS undertakes no obligation to update or revise (publicly or otherwise) any forward-looking statement, whether as a result of new information, future events or other circumstances. Neither this presentation nor any verbal communication shall constitute an invitation or inducement to any person to subscribe for or otherwise acquire securities in ASOS.
47
Disclaimer