ASIST - Data workshop 2007
49
ASIS&T IA Summit Pre-Conference Designing with structured data Margaret Hanley 23 rd March 2007 ASIS&T, 1320 Fenwick Lane, Suite 510 Silver Spring, MD 20910, USA Phone (301) 495-0900 Email: [email protected]
-
Upload
margaret-hanley -
Category
Documents
-
view
118 -
download
0
description
Presentation from the ASIST Data workshop 2007
Transcript of ASIST - Data workshop 2007
ASIS&T IA Summit Pre-Conference
Designing with structured data
Margaret Hanley
23rd March 2007ASIS&T, 1320 Fenwick Lane, Suite 510
Silver Spring, MD 20910, USA
Phone (301) 495-0900 Email: [email protected]
Introductions
Margaret Hanley
• Independent IA consultant
• Worked as an IA for the last 12 years
• Worked on three continents – Australia, • Worked on three continents – Australia, USA and UK
• Been both a consultant and internal staff to companies like Sensis (Yellow Pages in Australia), Argus Associates (US), Ingenta (UK), BBC (UK) and DNA Consulting (UK)

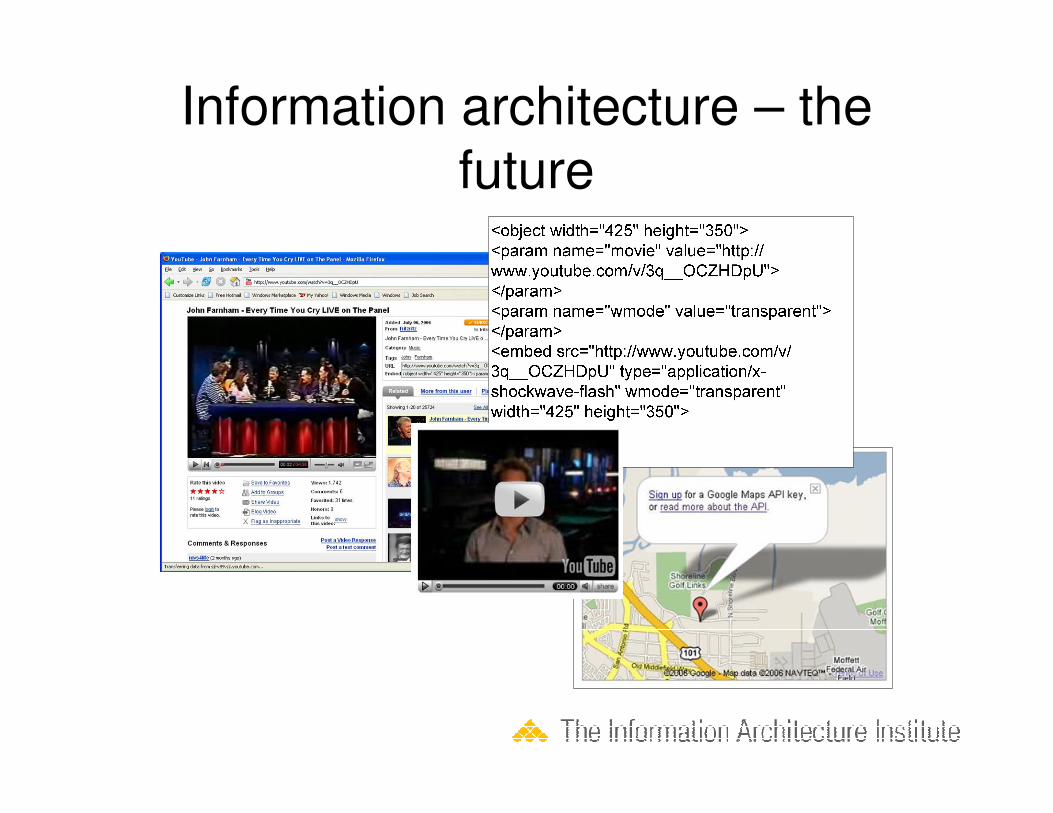
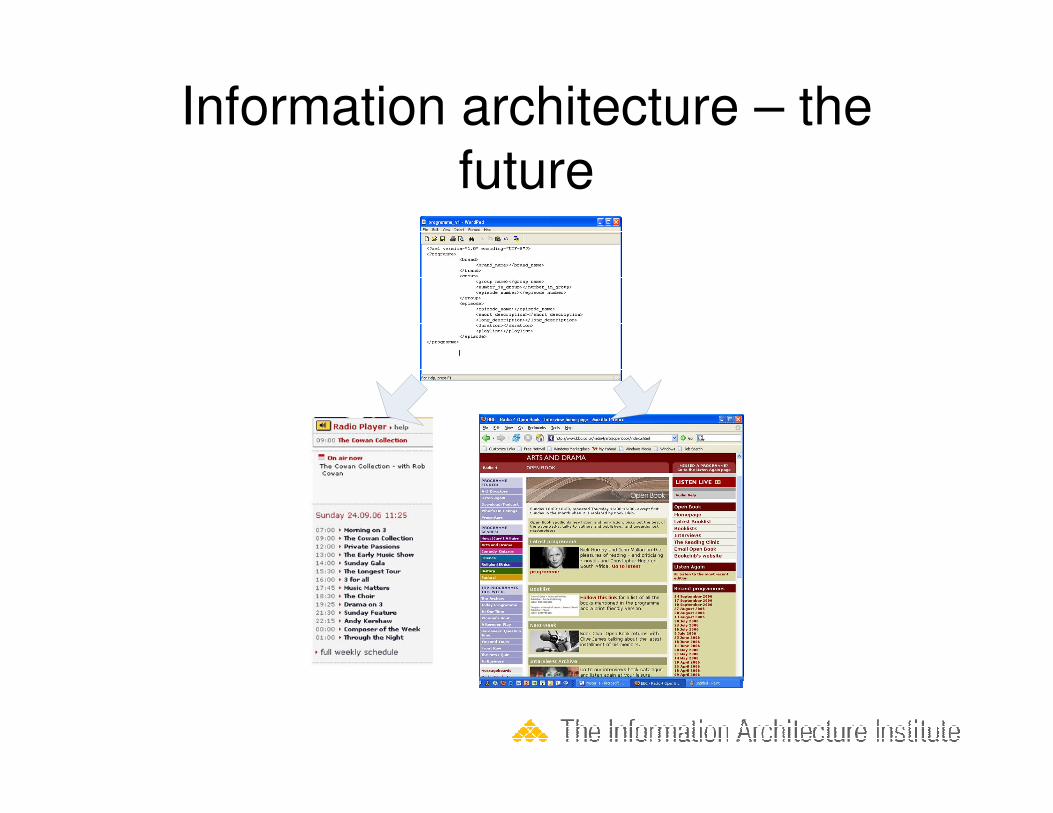
Information architecture – the
future
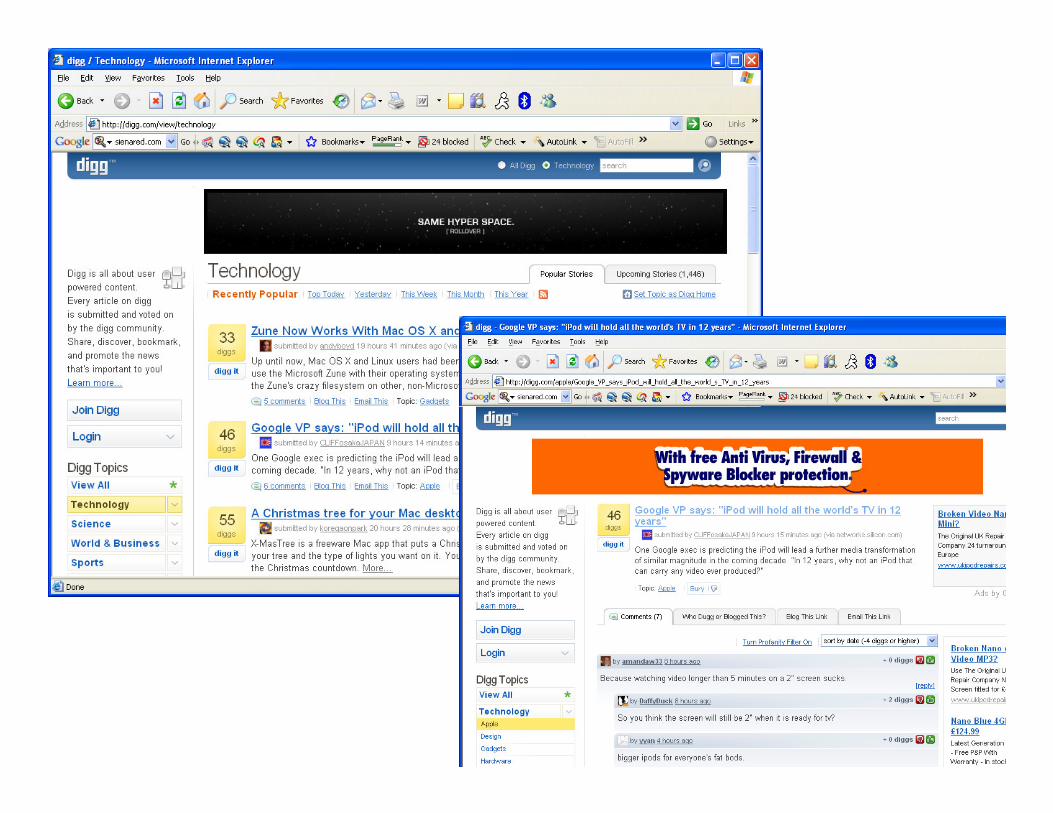
What do there examples have in
common?
Data at the core of the applications
realised:
In interfaces
As APIsAs APIs
Mash-ups
Progression
We are moving from architecting for one site to...
A web of data
A web of data sources, services for exploring and manipulating data and ways
that users can connect them together*
* Tom Coates My 'Future of Web Apps' slides
Posted February 13, 2006 1:10 AM.
http://www.plasticbag.org/archives/2006/02/my_future_of_web_apps_slides/
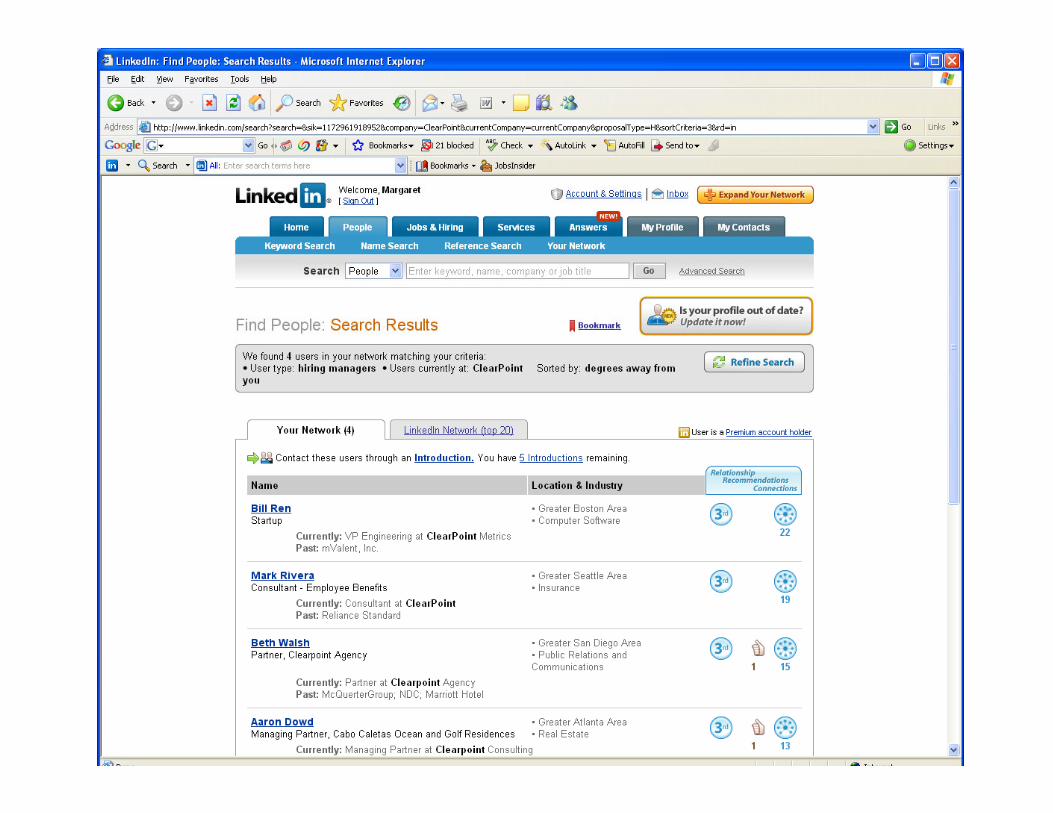
By understanding the data as IAs we have:
• the ability to use data in our sites
– Understanding the data well enough to be
able to use it
– Think about different interfaces that allow
people to manipulate it
• The opportunity to create the data in our organisations
– To set it free
– Extend the brand
– Re-use across an organisation
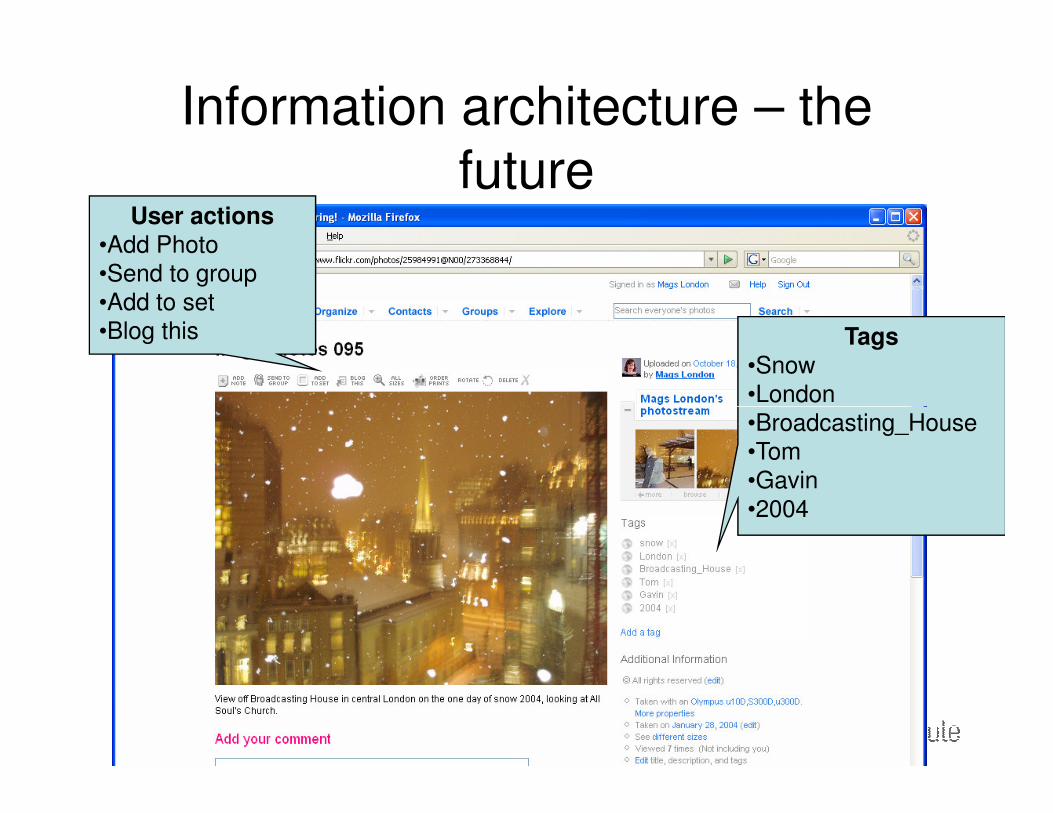
Information architecture – the
future
Information architecture – the
future
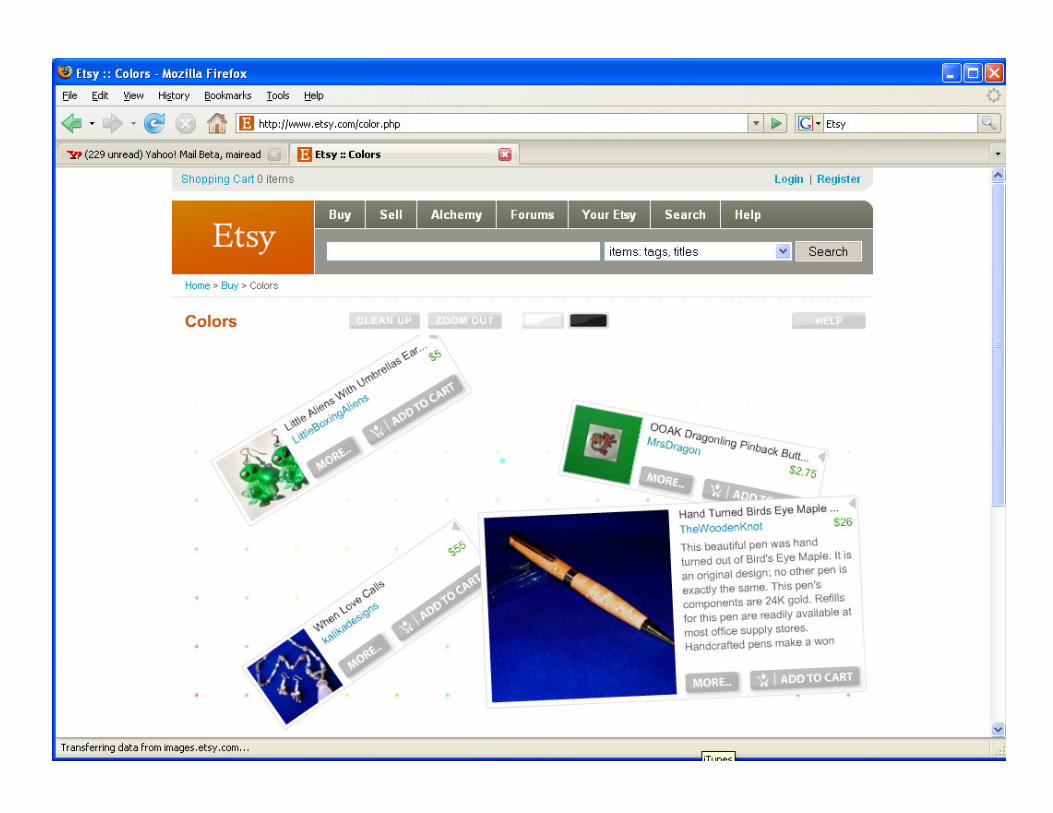
Tags
•Snow
•London
User actions
•Add Photo
•Send to group
•Add to set
•Blog this
•London
•Broadcasting_House
•Tom
•Gavin
•2004
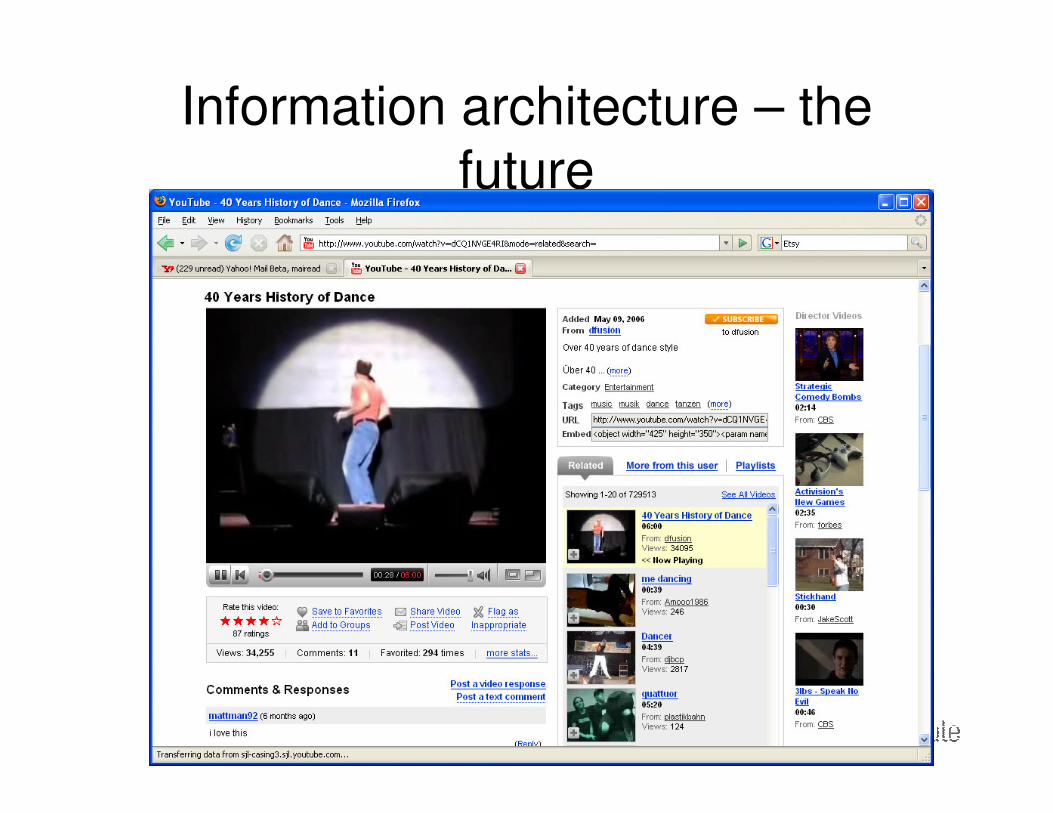
Information architecture – the
future
Information architecture – the
future
Creating the data to start with
• We are used to creating a feed for one purpose (filling in a sales order)
• Do we architect the content from the • Do we architect the content from the beginning without knowing what interface that will be created from it?
Information architecture – the
future
Additional skills – combining data with presentation
• How does the API work?
• How will a layer of data over the top be • How will a layer of data over the top be represented in the interface?
• Can we design the layers of interface and data – pretending we are the end-users who build on top of content?
• What guidelines will we give them?
Information architecture – the
future
• Focusing not on a progression of pages, but interaction between data and the user in the application
• Showing states and feedback within the • Showing states and feedback within the application
Information architecture – the
future
• Identifying that user involvement and participation “in” the site is as important as the authoritative content
• This could range from • This could range from
– Tagging
– Creating the content itself
– Creating a social network
Why we should care• We can create more engaging interfaces
• We can create more complex applications
• Rather than content sites, we are presenting sites to interact with; this is a combination of interface design and data combination of interface design and data design
• It takes CMS implementations to the next level, rather than designing pages we are designing objects as Karen described earlier today
Two components
• Data that is well structured and described
• Interfaces that are clear and have controls for interaction
Data
Data that is:
• Well structured
• Available to users either as human or machine readable formatsmachine readable formats
• Can be used on a web page for display or combined to create a new interface or data
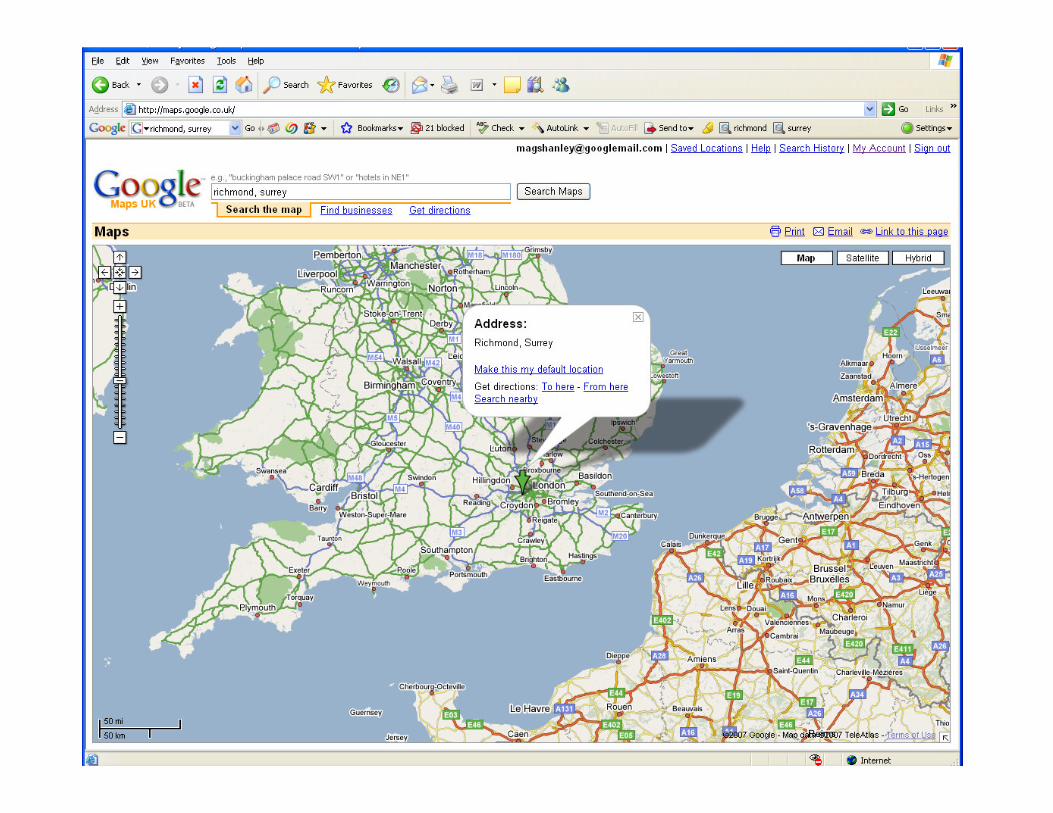
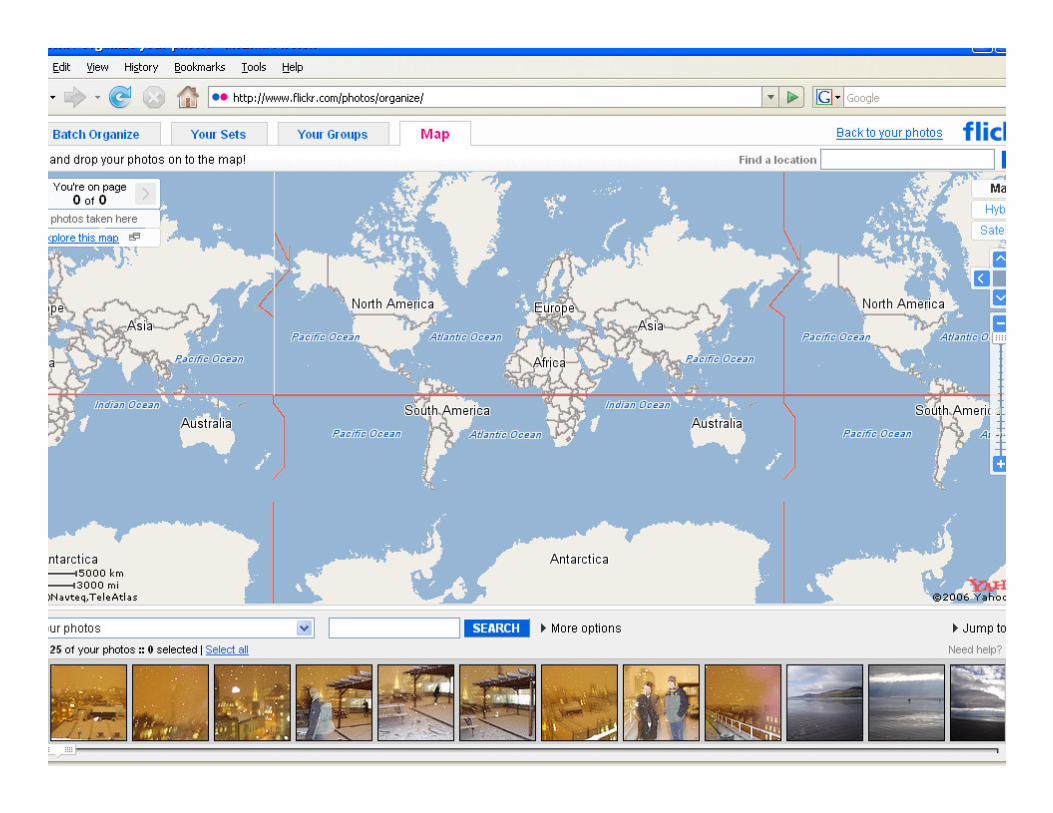
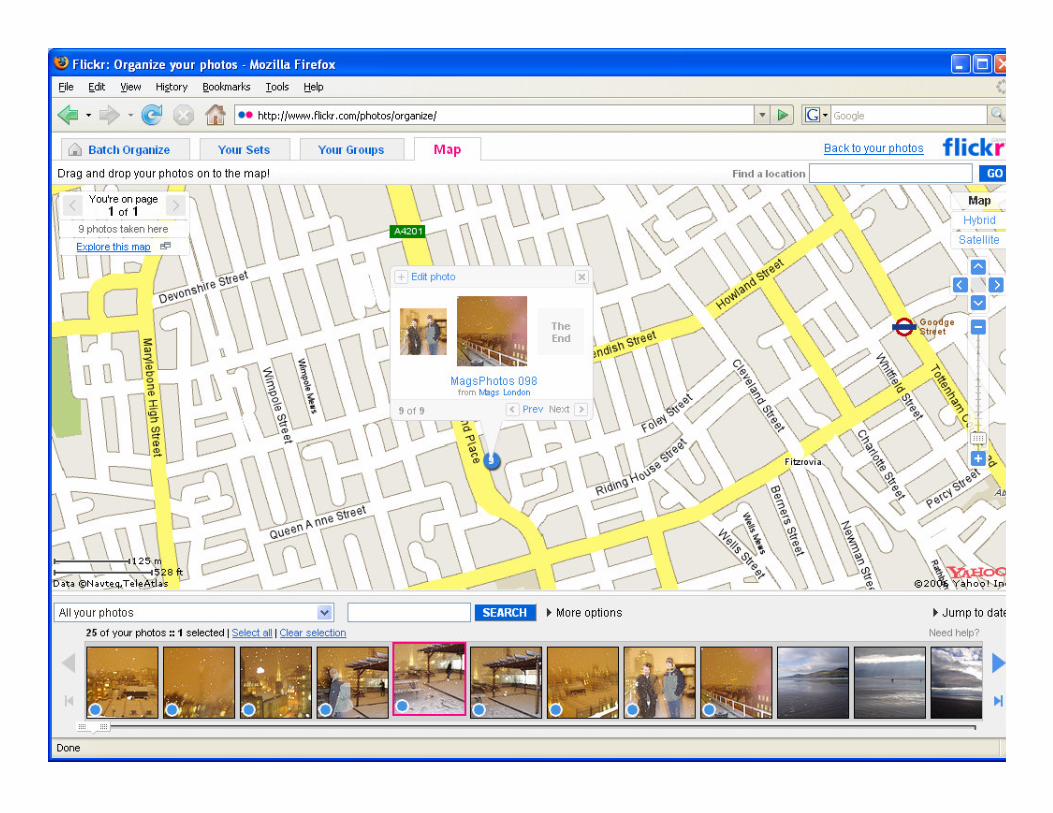
Data
• Is not necessarily complex info like GPS
• Needs the hook – the ability to map to something else either by explicit user action or by the properties of the content action or by the properties of the content
• Example – Flickr photos and maps – Explicit action of the user to place it on the
map and therefore tag it with location
– Property would be the putting into your camera the place when you were taking the photo
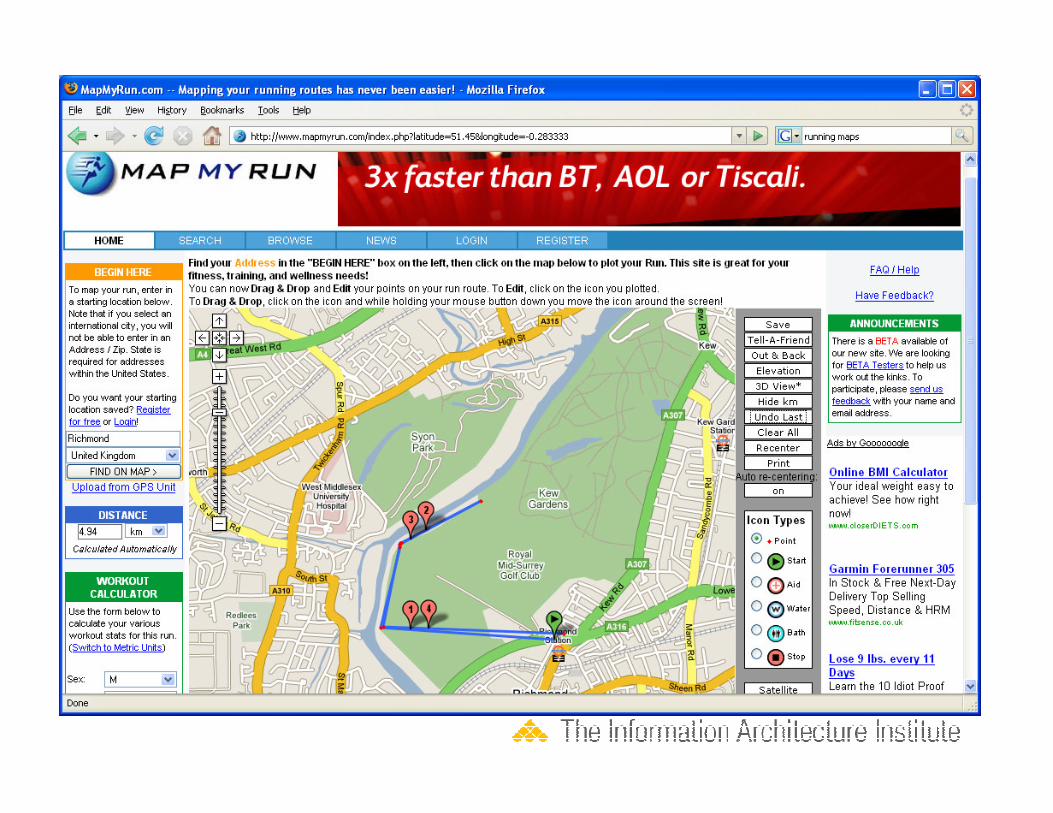
InterfacesTwo types
1. Mash-up interface (Map my run)– Clarity of interface
– Usually a base interface that allows the data to be layered and manipulated
– Controls for the user– Controls for the user
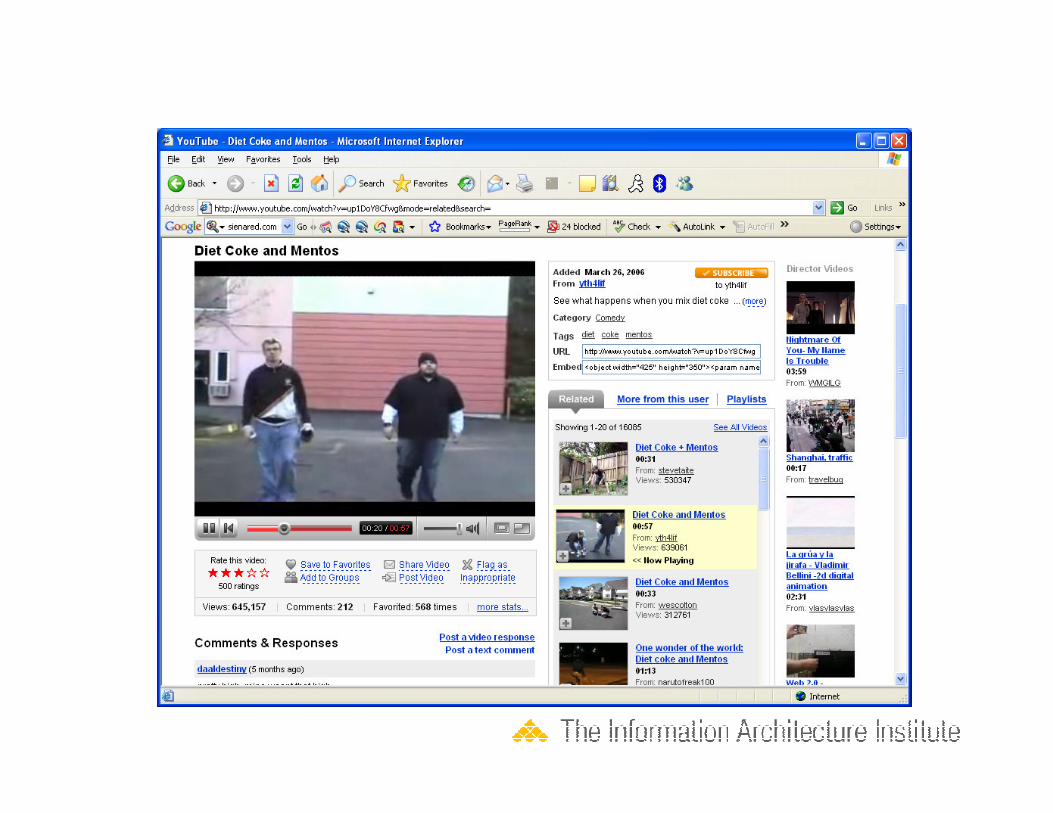
2. Original interface (YouTube)– Designing the interface of your components for
mash-up or manipulation
– Ease of use
– Creating an interface that continues the brand, even though a mash-up

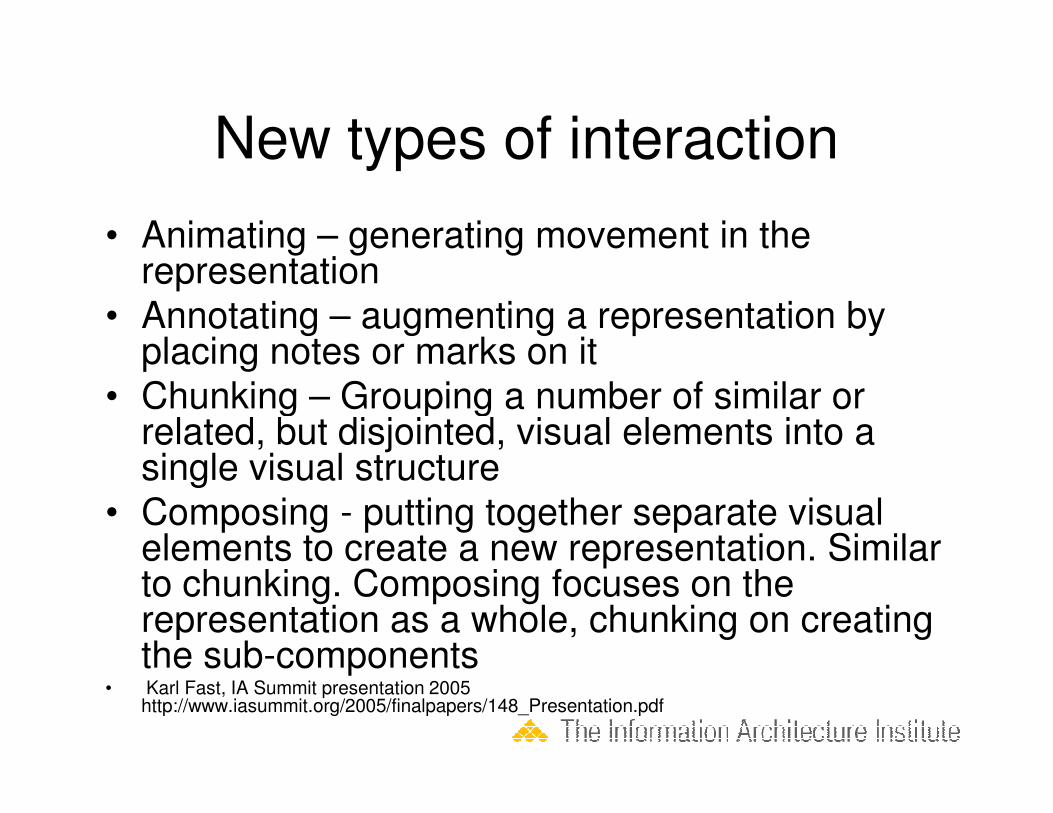
New types of interaction
• Animating – generating movement in the representation
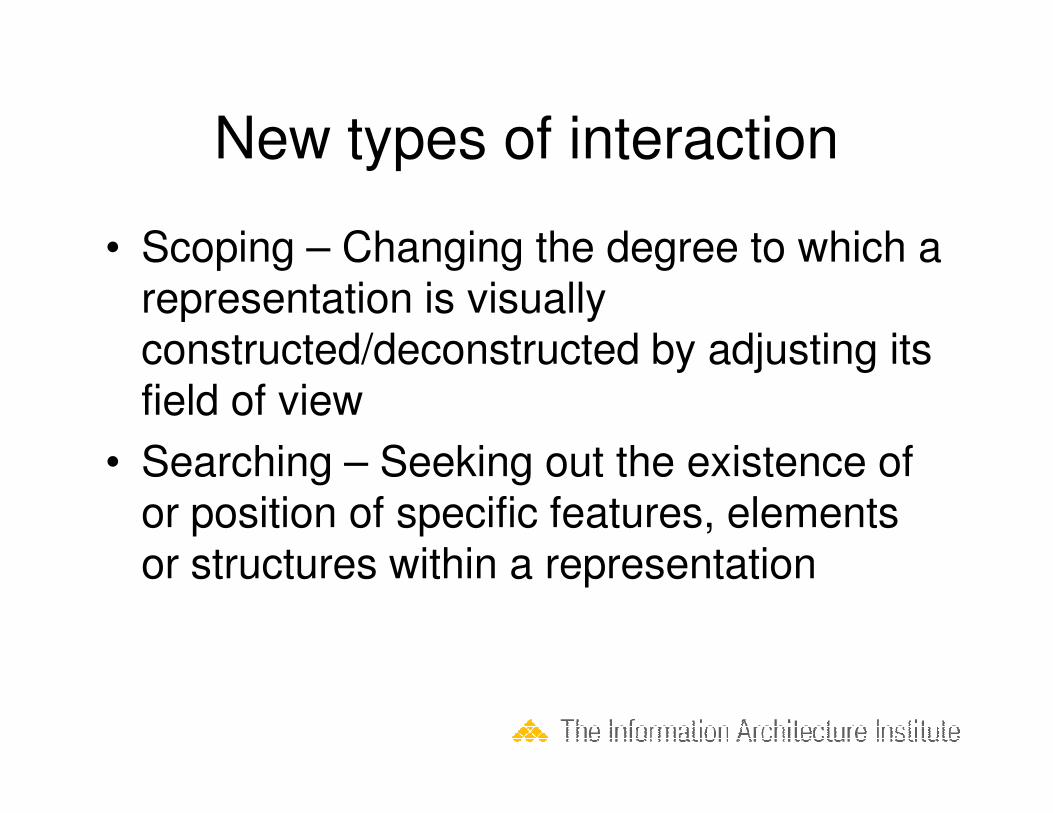
• Annotating – augmenting a representation by placing notes or marks on it
• Chunking – Grouping a number of similar or • Chunking – Grouping a number of similar or related, but disjointed, visual elements into a single visual structure
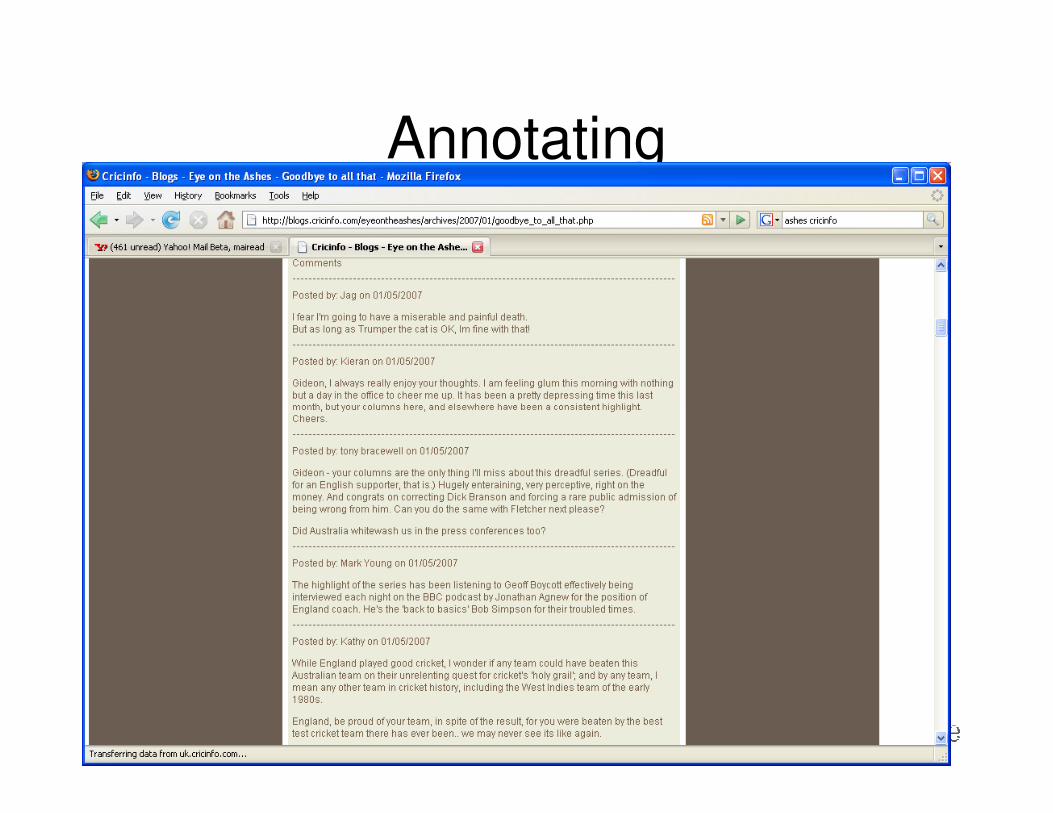
• Composing - putting together separate visual elements to create a new representation. Similar to chunking. Composing focuses on the representation as a whole, chunking on creating the sub-components
• Karl Fast, IA Summit presentation 2005 http://www.iasummit.org/2005/finalpapers/148_Presentation.pdf
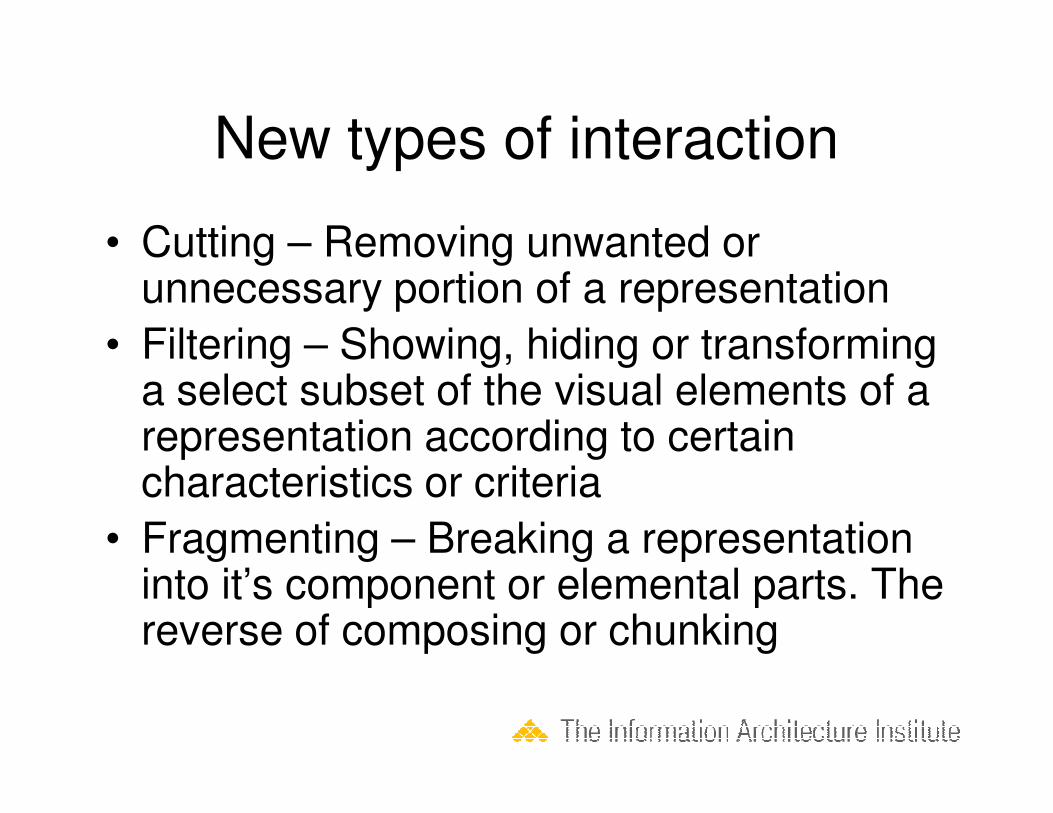
New types of interaction
• Cutting – Removing unwanted or unnecessary portion of a representation
• Filtering – Showing, hiding or transforming a select subset of the visual elements of a a select subset of the visual elements of a representation according to certain characteristics or criteria
• Fragmenting – Breaking a representation into it’s component or elemental parts. The reverse of composing or chunking
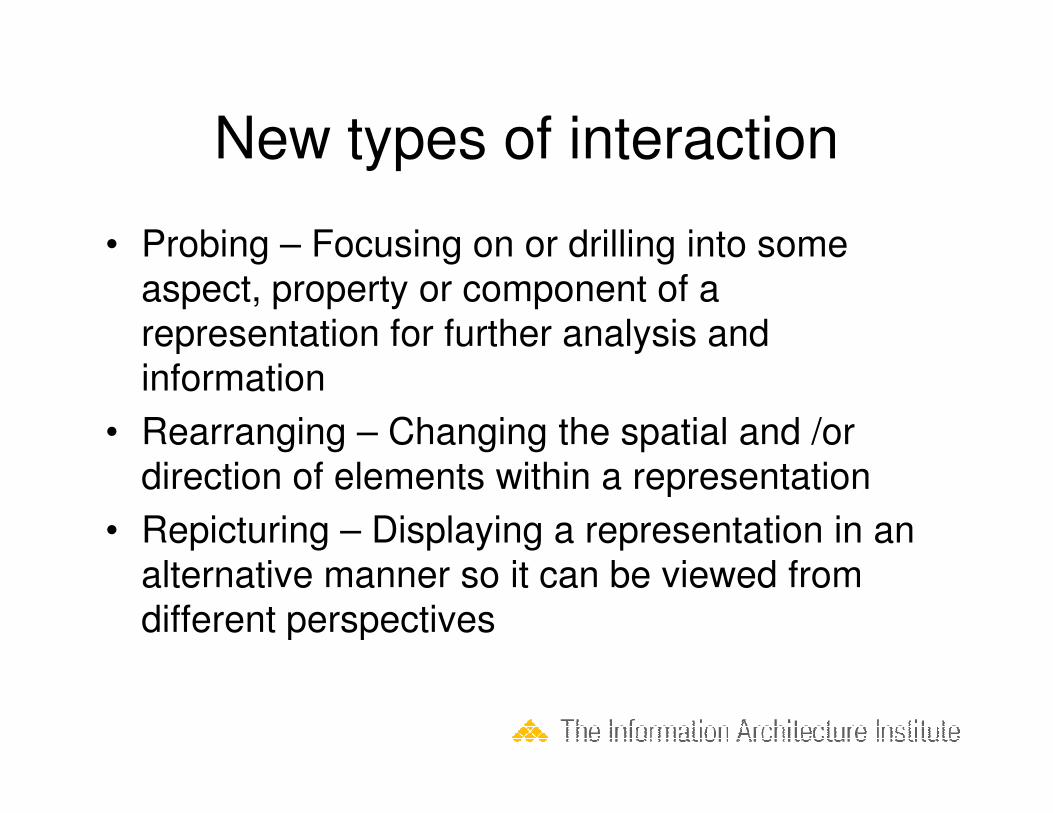
New types of interaction
• Probing – Focusing on or drilling into some
aspect, property or component of a
representation for further analysis and
information
• Rearranging – Changing the spatial and /or
direction of elements within a representation
• Repicturing – Displaying a representation in an
alternative manner so it can be viewed from
different perspectives
New types of interaction
• Scoping – Changing the degree to which a representation is visually constructed/deconstructed by adjusting its field of viewfield of view
• Searching – Seeking out the existence of or position of specific features, elements or structures within a representation
Annotating
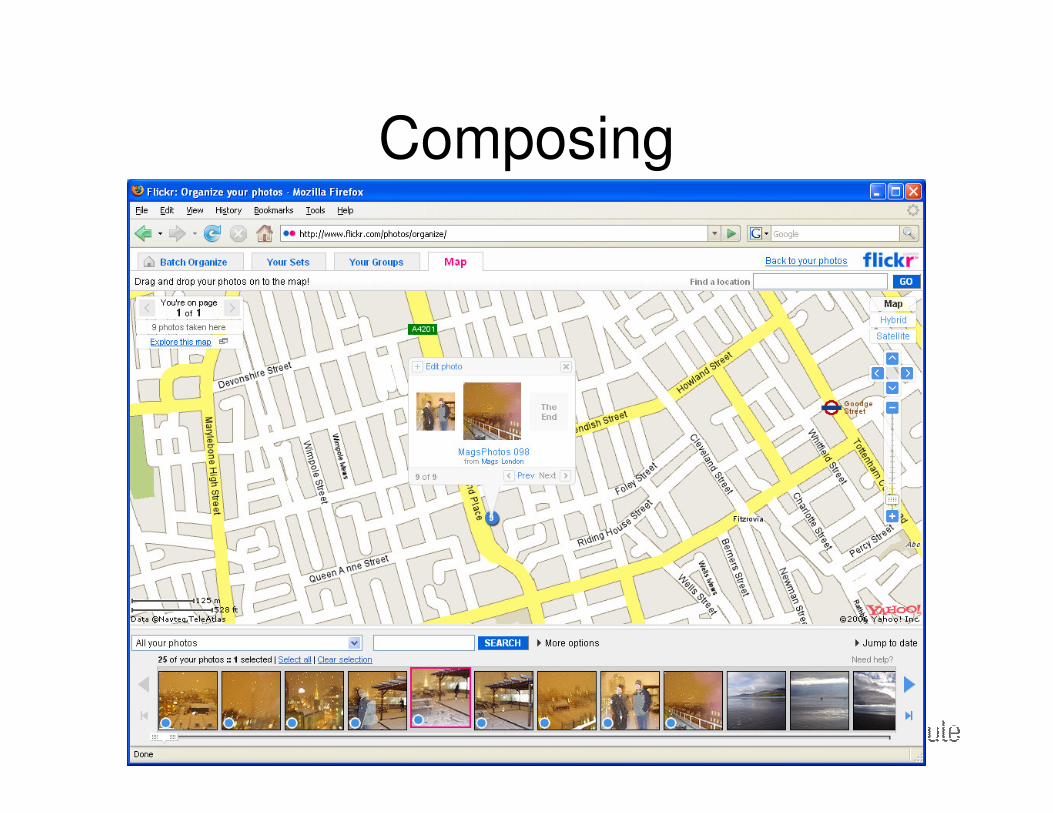
Composing
Composing
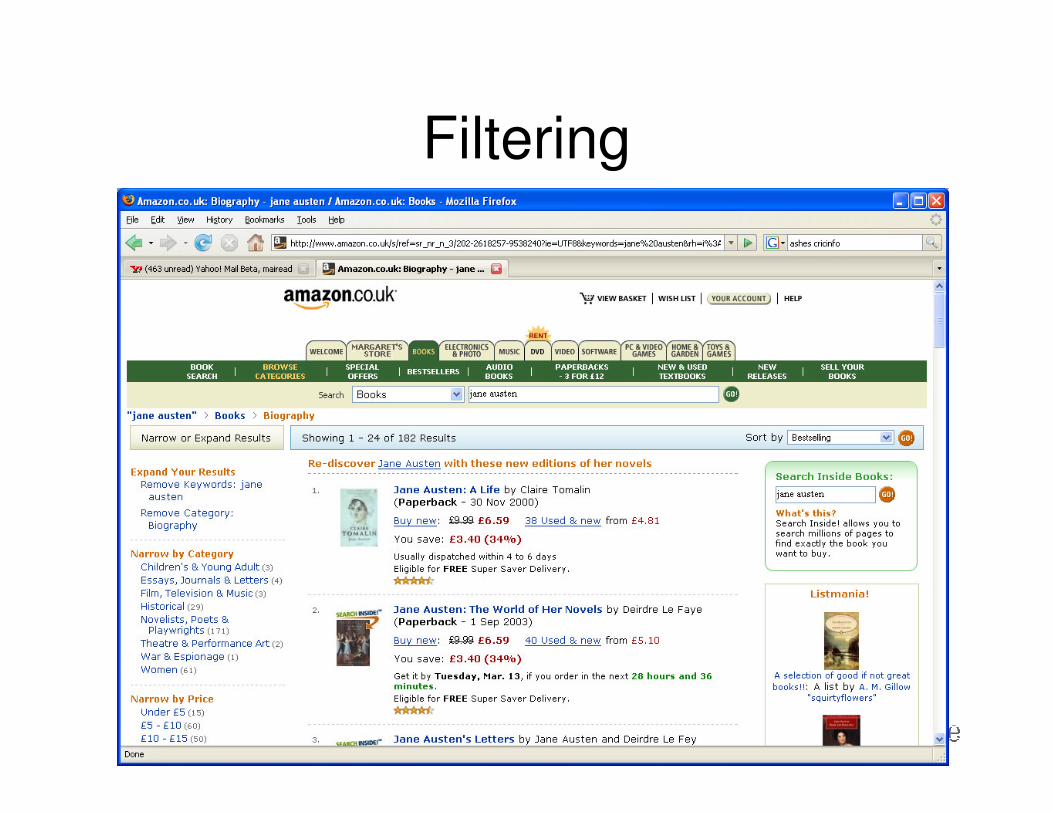
Filtering
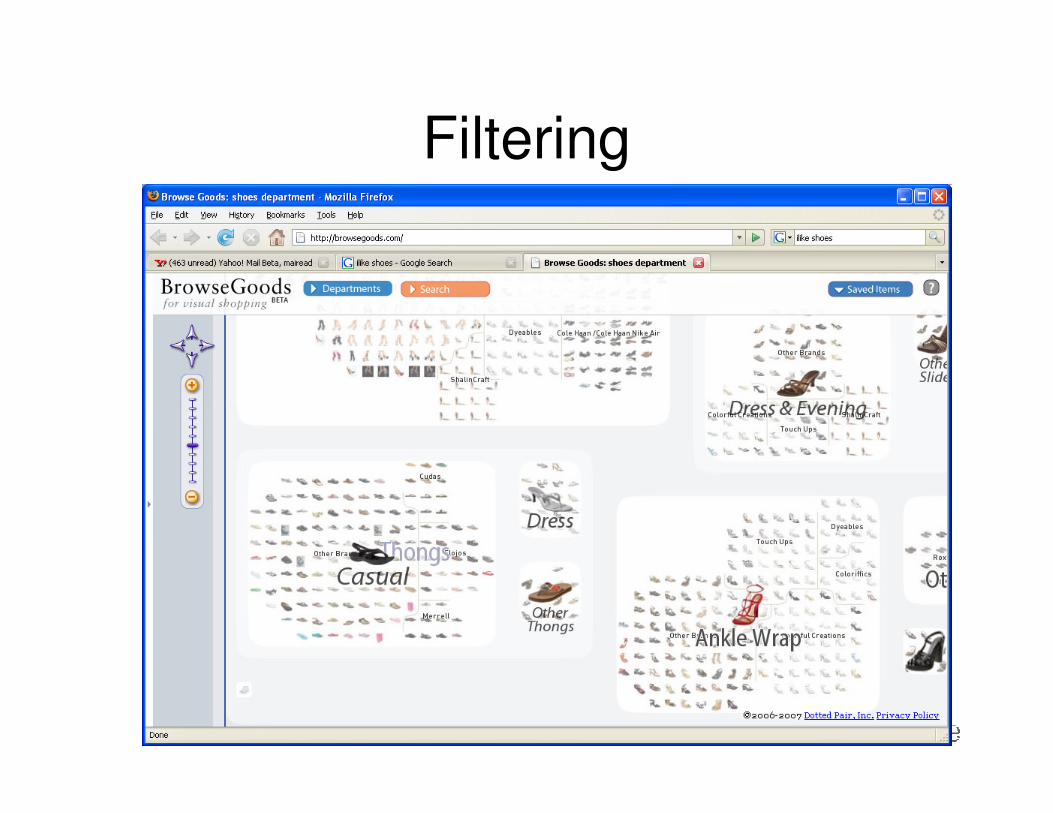
Filtering
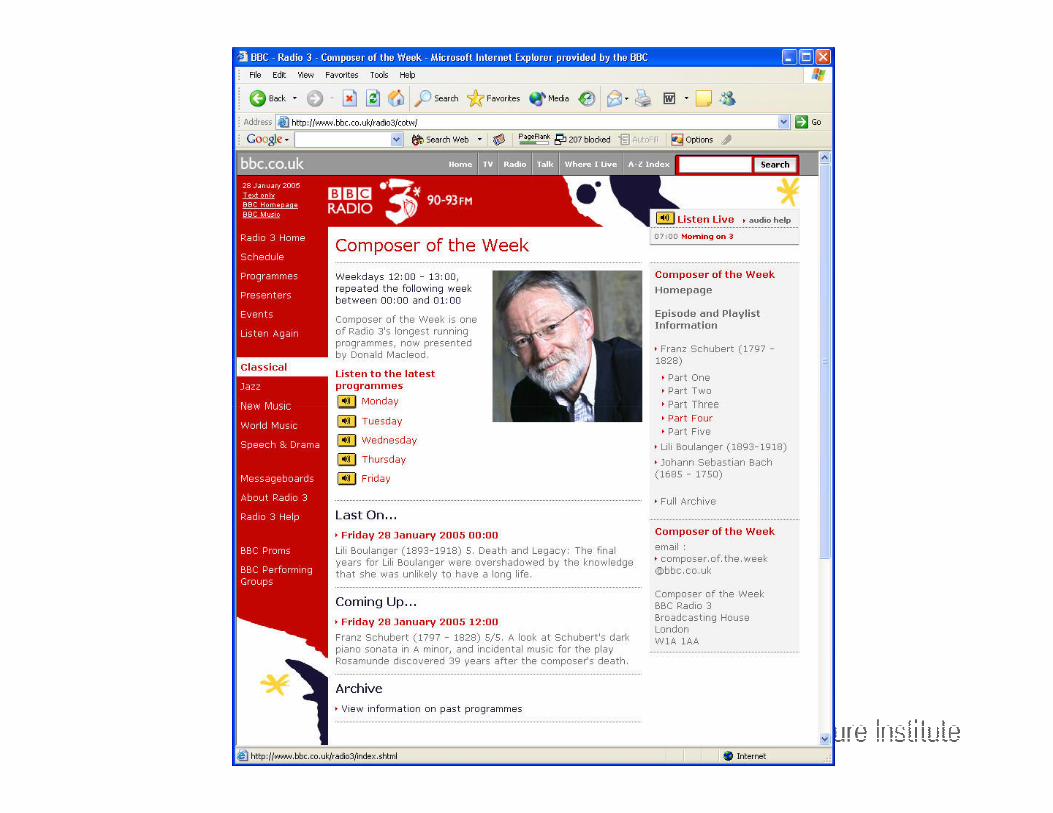
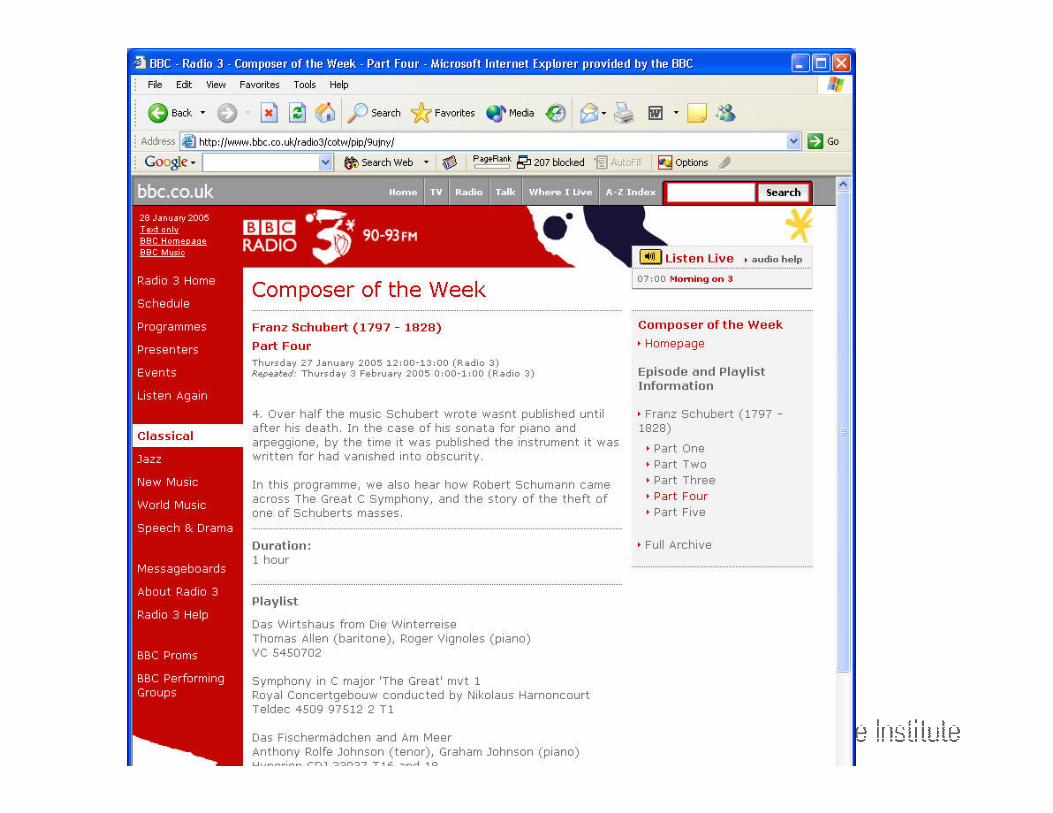
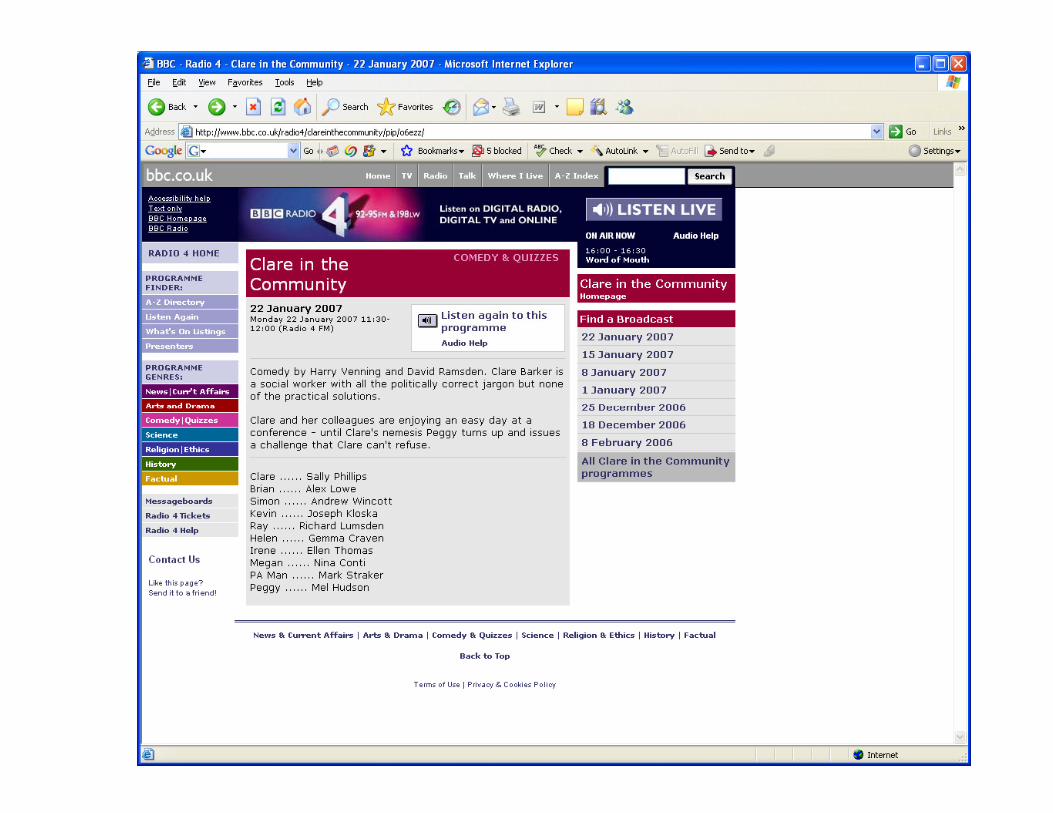
PIPs
• Programme information pages – a page for every programme episode, broadcast on BBC
• Cross-divisional project• Cross-divisional project
– Radio and Music interactive and New Media
Central
– Now being used to supply information to the
iPlayer
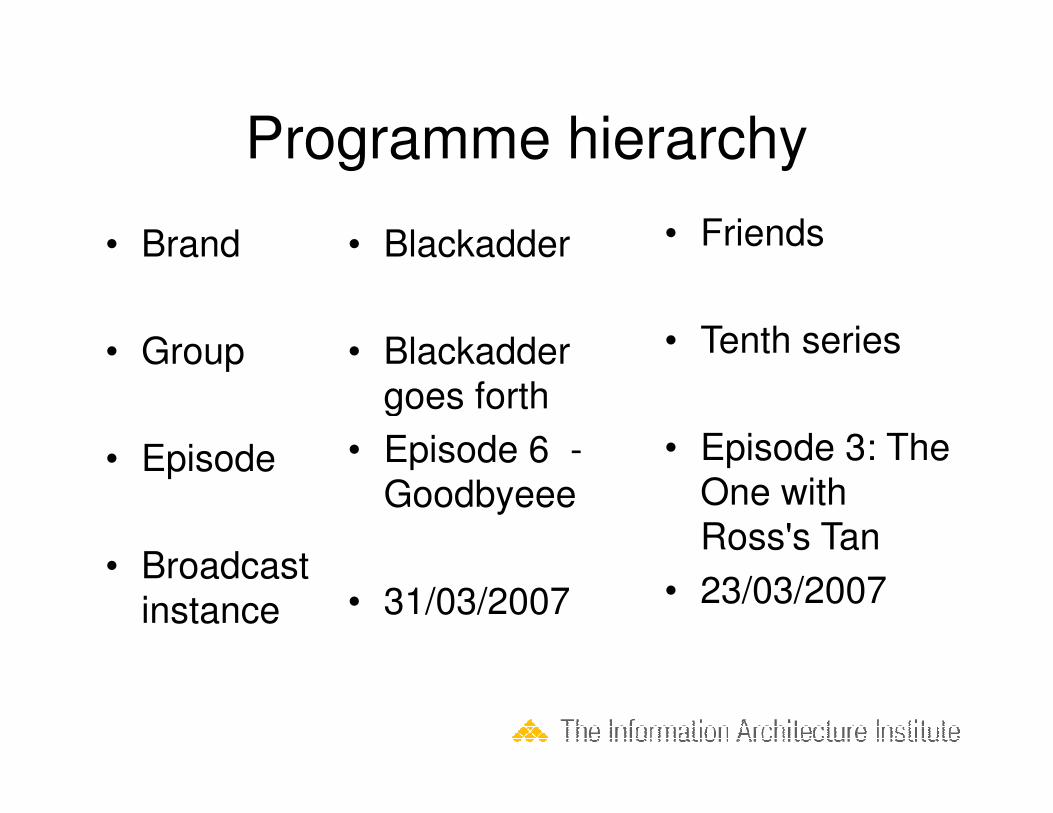
Programme hierarchy
• Brand
• Group
• Blackadder
• Blackadder
goes forth
• Friends
• Tenth series
• Episode
• Broadcast
instance
goes forth
• Episode 6 -
Goodbyeee
• 31/03/2007
• Episode 3: The
One with
Ross's Tan
• 23/03/2007
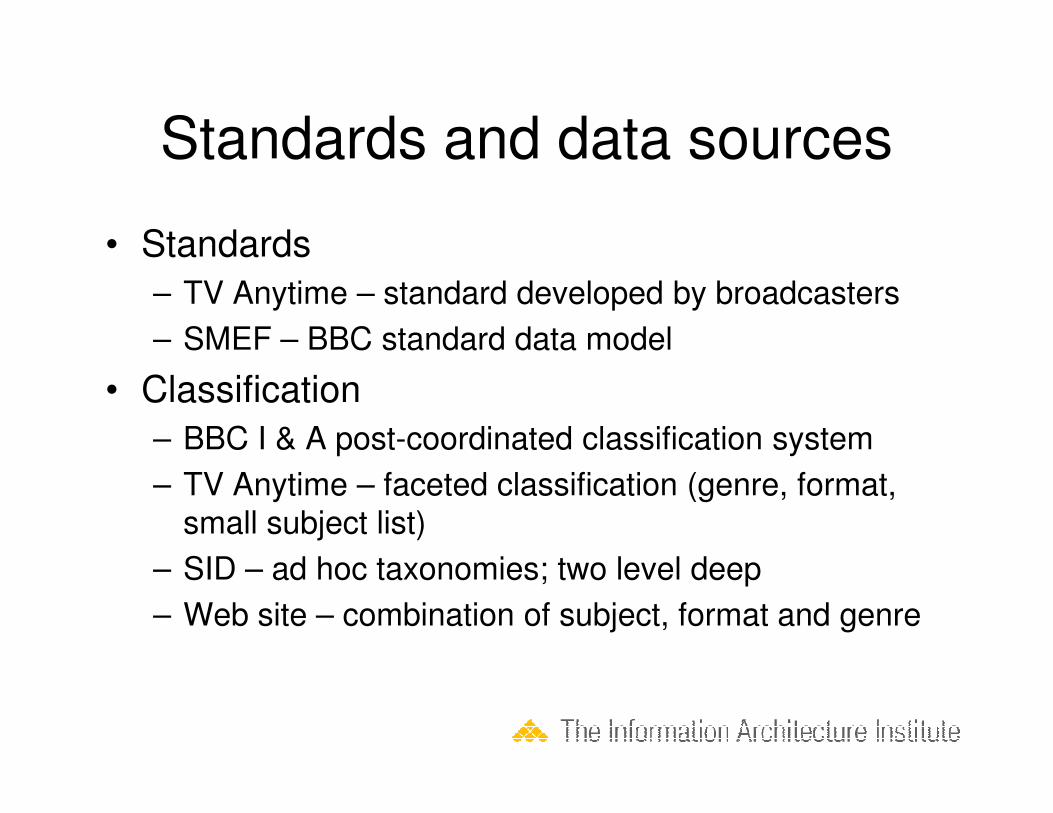
Standards and data sources
• Standards
– TV Anytime – standard developed by broadcasters
– SMEF – BBC standard data model
• Classification• Classification
– BBC I & A post-coordinated classification system
– TV Anytime – faceted classification (genre, format,
small subject list)
– SID – ad hoc taxonomies; two level deep
– Web site – combination of subject, format and genre
PIPs
• Creating the data – I sat down with database architect and he and I came up with PIP XML
• The core aspect to PIP XML was the • The core aspect to PIP XML was the factual information about a programme; the programme hierarchy, short and long descriptions, genres
• Non-core information was added as content objects by the CMS
PIPs
• What came first- the interface or the data?
• We had a really strong idea about how we could use the programme information, even if we didn’t have the interfaces even if we didn’t have the interfaces developed - schedules, pages, snippets
• So it was a bit of both ☺
Information architecture – the
future
Exercise
• We have about ½ hour to start to create an interface using data.
• Please get into groups of about 5-6 to do this exercise. this exercise.
• Your exercise sheet has the instructions.


![Asist Bulletin No. 4 - ASIST · MART initiative Book Reviews Diary Pinboard Project News TES [Back]TOCNext Asist Bulletin No. 4 - ASIST ... Labour engaged on LB sites will then warrant](https://static.fdocuments.in/doc/165x107/5f70df4e3aa4af5aa72c7a6e/asist-bulletin-no-4-mart-initiative-book-reviews-diary-pinboard-project-news.jpg)