Asia Pacific Watch December 2016 - CBRE Global · PDF fileASIA PACIFIC WATCH DECEMBER 2016...
2
ASIA PACIFIC WATCH DECEMBER 2016 18,308.5 Nikkei 225 22,789.8 Hang Seng 3,250.0 Shanghai Composite 112.5 Yen/Dollar Note: Forecast trends are based on ‘base scenario as of September 2016’ forecasted by Oxford Economics Source: Oxford Economics 5.1% 1.8% 4.8% -7.6% Data points through end of November 2016. Change represents month-over-month change. Expanding on our coverage of Singapore in our November Watch, we now cover the major emerging markets of Southeast Asia (SEA). The large economic and population base of SEA is already translating into significant opportunities through increased inter- and intra-regional trade, regional and domestic tourism, expanded financial and insurance services, and higher demand for logistics services. Although currently accounting for only 2% of the total investable global property market (CBRE Global Investors, 2016), the region’s economic growth will support the development and expansion of it’s real estate market. Additionally, there are several underlying domestic trends that are supporting the property markets in SEA. The powerful phenomenon of urbanization, supported by a young, educated population and growing middle class, coupled with competitive labour costs, are likely to continue to be an important set of demand drivers for the property markets of SEA. From an investment perspective, SEA may be an increasingly attractive destination for investors, particularly those seeking opportunistic returns through development projects. WELL ABOVE GLOBAL AVERAGE GDP GROWTH OUTLOOK The macro-economic fundamentals for SEA are variable although the major economies are forecast to enjoy five-year average annual growth broadly similar to their five- year historic average. Malaysia is expected to undergo the most notable deceleration of its growth rate relative to its recent past, albeit still posting growth of just over 4% annually for the next five years, according to the latest Oxford Economics base case forecasts. Thailand, alone among the major SEA economies, is likely to grow below the APAC regional average of 4.1% in the coming five years. Vietnam is poised to be the outperformer in SEA, with growth accelerating in the next five years to average 6.4%, compared to its five year historic average of 5.9%. PRINCIPAL CONTRIBUTORS: Shane Taylor • Juliet Cha 16:003-12 EMERGING SEA GDP GROWTH AND FORECASTS 0% 1% 2% 3% 4% 5% 6% 7% 8% Indonesia Malaysia Philippines Thailand Vietnam Asia Pacific (Change pa, %) 2015 2016F 2017F 2018F 2011-2015 ave 2017-2021 ave
Transcript of Asia Pacific Watch December 2016 - CBRE Global · PDF fileASIA PACIFIC WATCH DECEMBER 2016...
ASIA PACIFIC WATCH DECEMBER 2016
18,308.5Nikkei 225
22,789.8Hang Seng
3,250.0Shanghai Composite
112.5Yen/Dollar
Note: Forecast trends are based on ‘base scenario as of September 2016’ forecasted by Oxford EconomicsSource: Oxford Economics
5.1%
1.8%
4.8%
-7.6%
Data points through end of November 2016.Change represents month-over-month change.
Expanding on our coverage of Singapore in our November Watch, we now cover the major emerging markets of Southeast Asia (SEA). The large economic and population base of SEA is already translating into signifi cant opportunities through increased inter- and intra-regional trade, regional and domestic tourism, expanded fi nancial and insurance services, and higher demand for logistics services. Although currently accounting for only 2% of the total investable global property market (CBRE Global Investors, 2016), the region’s economic growth will support the development and expansion of it’s real estate market. Additionally, there are several underlying domestic trends that are supporting the property markets in SEA. The powerful phenomenon of urbanization, supported by a young, educated population and growing middle class, coupled with competitive labour costs, are likely to continue to be an important set of demand drivers for the property markets of SEA. From an investment perspective, SEA may be an increasingly attractive destination for investors, particularly those seeking opportunistic returns through development projects.
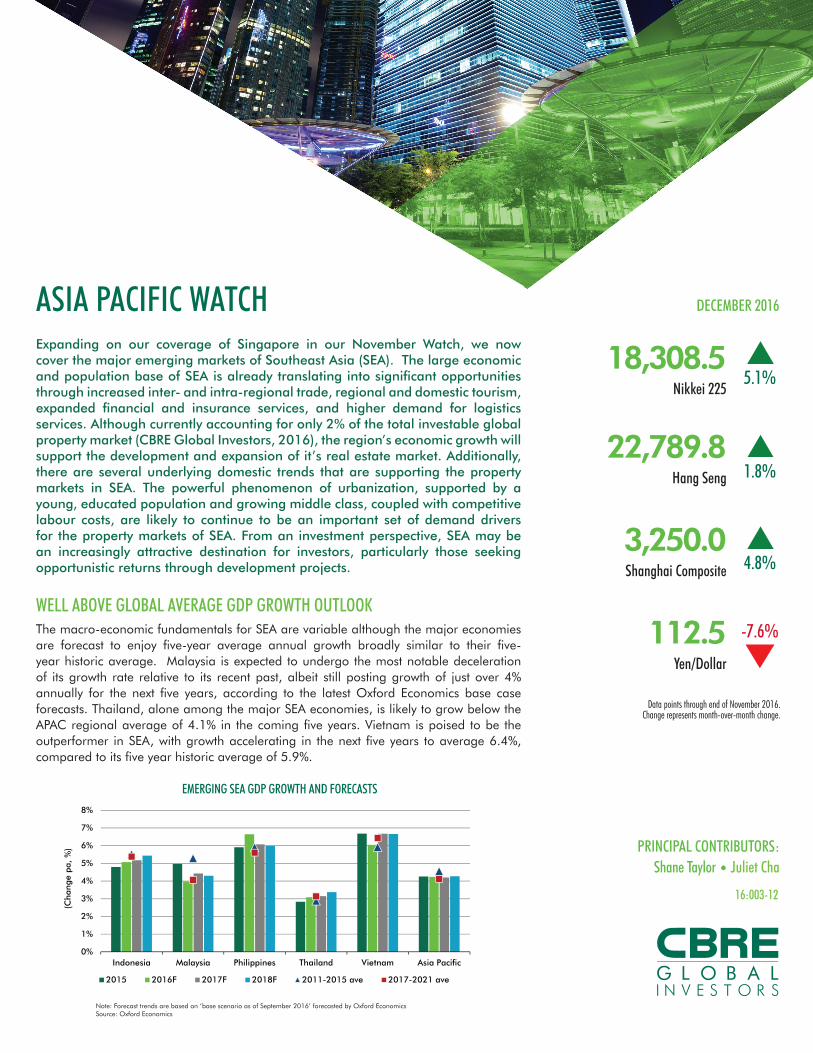
WELL ABOVE GLOBAL AVERAGE GDP GROWTH OUTLOOK The macro-economic fundamentals for SEA are variable although the major economies are forecast to enjoy fi ve-year average annual growth broadly similar to their fi ve-year historic average. Malaysia is expected to undergo the most notable deceleration of its growth rate relative to its recent past, albeit still posting growth of just over 4% annually for the next fi ve years, according to the latest Oxford Economics base case forecasts. Thailand, alone among the major SEA economies, is likely to grow below the APAC regional average of 4.1% in the coming fi ve years. Vietnam is poised to be the outperformer in SEA, with growth accelerating in the next fi ve years to average 6.4%, compared to its fi ve year historic average of 5.9%.
PRINCIPAL CONTRIBUTORS:Shane Taylor • Juliet Cha
16:003-12
EMERGING SEA GDP GROWTH AND FORECASTS
0%
1%
2%
3%
4%
5%
6%
7%
8%
Indonesia Malaysia Philippines Thailand Vietnam Asia Pacific
(Cha
nge
pa,
%)
2015 2016F 2017F 2018F 2011-2015 ave 2017-2021 ave

TRANSACTION VOLUME OF SEA EXCLUDING SINGAPORE RETAIL SUPPLY IN SELECTED SEA CITIES, 2016-2018
Note: Transactions include properties and portfolios USD 10 million and greater in the offi ce, industrial, retail, apartment and hotel. Southeast Asia ex-Singapore includes Combodia, Guam, Indonesia, Laos, Malaysia, Myanmar, Northern Mariana Islands, Philippines, Thailand and Vietnam.Source: Real Capital Analytics
Note: Annual percentage of population at mid-year residing in urban areas by region and country.Source: United Nations, World Urbanization Prospects: The 2014 Revision, June 2014.
Note: 2016 full year development pipeline and 1Q2016 vacancy rate is used for Manila market.Source: ERIX (as of 3Q16)
Note: Data relates to shopping centres. HCMC market is as of 3Q16; Hanoi is as of 2Q16 and Manila and Bangkok are as of 1Q16.Source: ERIX (as of 3Q16)
OFFICE VACANCY RATE AND DEVELOPMENT PIPELINES
% OF POPULATION RESIDING IN URBAN AREAS
INCREASING URBANISATIONUrbanisation rates across SEA vary signifi cantly; Singapore is the quintessential “city-state” with its entire population classifi ed as urban and it being a wealthy, advanced and highly investable outlier within SEA. But the large emerging markets of SEA are catching up fast and by 2025, the UN projects that 80% of Malaysians and 60% of Indonesians and Thais will live in cities. Half of all Southeast Asians will live in cities by 2020. Hand in hand with increasing urbanization will be the growth of the service sector. The economies of Singapore, Malaysia and the Philippines are already largely driven by the service sector.
TRANSACTION VOLUME TRENDING DOWNTotal transaction volume across all commercial property sectors in SEA reached USD 8.6 billion in 2015, higher than the USD 6.4 billion of 2014, yet lower than the all-time peak of USD 9.6 billion in 2013. Thus, the core property markets of SEA are not large and liquid – stock tends to be tightly held and in spite of the huge size of several of its cities, not a lot of real estate changes ownership. Malaysia witnessed a majority of total transaction vol-ume in SEA, with 54% of the total volume in SEA in 2015. Aside from investments of stand-alone assets, Malaysia has also seen a huge volume of development site transactions – some USD 6.1 billion in 2016 YTD alone.
OFFICE PERFORMANCES VARYThe emerging nature of the main offi ce markets in the region is also evident with some strong supply pipelines currently under development. Manila presently enjoys among the lowest offi ce vacancy rates in world at just 2% and although signifi cant new supply additions will continue through the end of 2017, absorption is expected to also be strong. Somewhat more concerning are the Vietnamese offi ce markets, especially Hanoi, which has a current offi ce vacancy rate of 17.0% and is expecting new stock of 13.8% of the size of its current prime market. HCMC will see a sizable 20% increase in additional stock to its market by the end of 2017. The Bangkok offi ce market remained broadly stable in 2016; the current modest vacancy rate (8.7% in 3Q2016) and rising rents are expected to continue given the muted supply pipeline and expected continued demand through the next year.
RETAIL LANDSCAPE TRANSFORMING RAPIDLY BUT UNEVENLYStrong macroeconomic and demographic fundamentals provide a solid base for retailers to expand footprints across SEA. The retail landscape in SEA is transforming rapidly as more modern retail developments are built. Previously, retailers interested in opening in SEA were faced with limited supply of existing space that was not always ideal for their brands. But newer developments are more accommodative to retailers’ different needs and space requirements. Perhaps due to its long history of strong American infl uence, Filipinos love the shopping center format and arguably some of the largest and best malls in the region are found in Manila. It’s fortunate that demographic and economic fundamentals are strong in Manila and retailers are expanding, as new supply this year was considerable.
This information is for our clients and investors only. Please note that the content of this report is for informational purposes only and should not be viewed as investment advice or an offer or solicitation. Any opinions are solely those of the Strategy & Research Team of CBRE Global Investors and are subject to change without notice, and may not be consistent with market trends or future events. This research is based on current public information that we consider reliable, but we do not represent it as accurate, updated or complete, and it should not be relied on as such.
Copyright © 2016, CBRE Global Investors, LLC. All rights reserved.
0% 20% 40% 60% 80% 100%
South East Asia
Singapore
Indonesia
Malaysia
Philippines
Thailand
Vietnam
2005 2015 2020 2025
$-
$2
$4
$6
$8
$10
$12
2007 2008 2009 2010 2011 2012 2013 2014 2015 3Q2016
(USD
, Bi
llion
s)
0%
5%
10%
15%
20%
25%
30%
35%
Hanoi Ho Chi Minh City Manila BangkokV
acan
cy &
Dev
elop
men
t Pi
pelin
eas
% o
f T
otal
Sto
ck
Current Vacancy Rate (3Q16) Development Pipeline 3Q16 to end of 2017
0
100
200
300
400
500
600
700
800
900
1000
Manila Ho Chi Minh City Bangkok Hanoi
('000 s
qm)
2016F 2017F 2018F