Asia Pacific Oils and Fats Situation...
38
Asia Pacific Oils and Fats Situation Overview Mohammad Hafezh bin Abdul Rahman Market Analyst, Asia Pacific Region
Transcript of Asia Pacific Oils and Fats Situation...

Asia Pacific Oils and Fats Situation Overview
Mohammad Hafezh bin Abdul Rahman
Market Analyst, Asia Pacific Region

Executive Summary
Oils and Fats Overview
Oils and fats situation in the Asia Pacific Region
Palm oil situation in the region
Economics
Macro views
Potentials in the Region
Conclusions
PART I: OILS AND FATS OVERVIEW Oils and fats situation in the Asia Pacific region
('000 T) 2009 2010 2011 2012 2013E 2014F
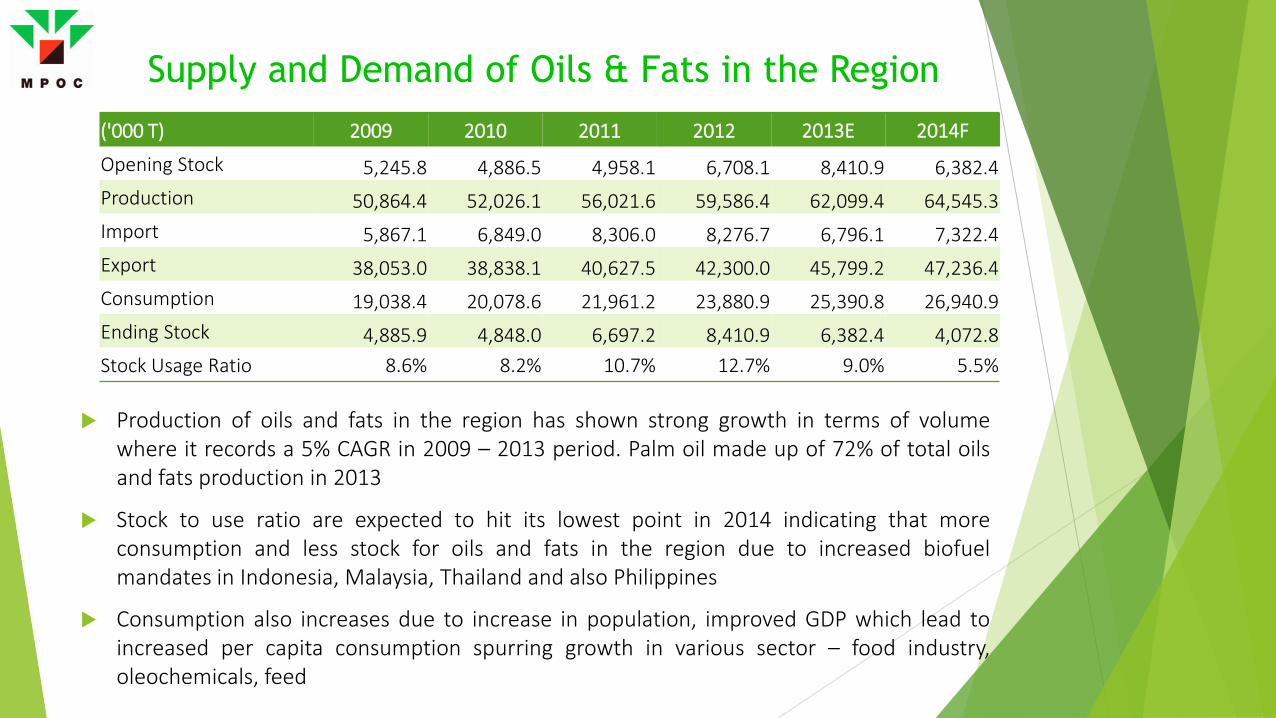
Opening Stock 5,245.8 4,886.5 4,958.1 6,708.1 8,410.9 6,382.4 Production 50,864.4 52,026.1 56,021.6 59,586.4 62,099.4 64,545.3 Import 5,867.1 6,849.0 8,306.0 8,276.7 6,796.1 7,322.4 Export 38,053.0 38,838.1 40,627.5 42,300.0 45,799.2 47,236.4 Consumption 19,038.4 20,078.6 21,961.2 23,880.9 25,390.8 26,940.9 Ending Stock 4,885.9 4,848.0 6,697.2 8,410.9 6,382.4 4,072.8 Stock Usage Ratio 8.6% 8.2% 10.7% 12.7% 9.0% 5.5%
Production of oils and fats in the region has shown strong growth in terms of volume where it records a 5% CAGR in 2009 – 2013 period. Palm oil made up of 72% of total oils and fats production in 2013
Stock to use ratio are expected to hit its lowest point in 2014 indicating that more consumption and less stock for oils and fats in the region due to increased biofuel mandates in Indonesia, Malaysia, Thailand and also Philippines
Consumption also increases due to increase in population, improved GDP which lead to increased per capita consumption spurring growth in various sector – food industry, oleochemicals, feed
Supply and Demand of Oils & Fats in the Region
Taking Palm Oil Out of the Asia Pacific Oils and Fats Supply
ASIA PACIFIC (‘000 MT) CAGR (2007-2013)
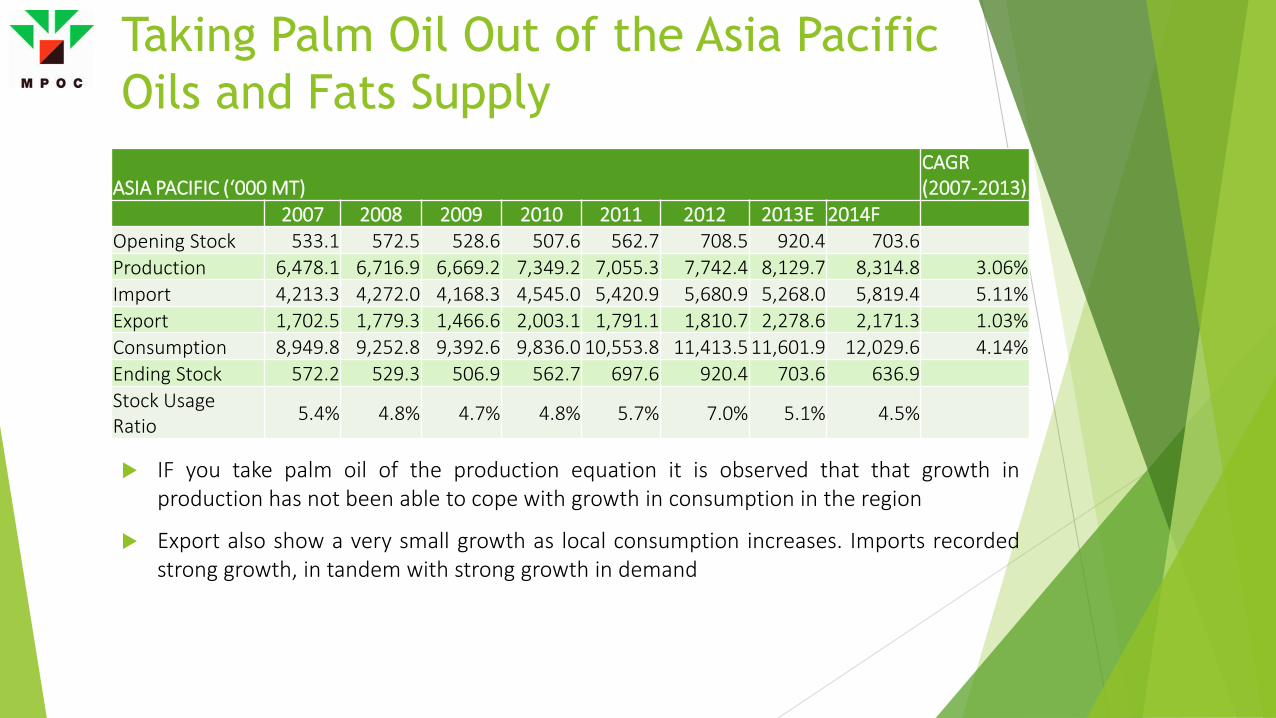
2007 2008 2009 2010 2011 2012 2013E 2014F Opening Stock 533.1 572.5 528.6 507.6 562.7 708.5 920.4 703.6 Production 6,478.1 6,716.9 6,669.2 7,349.2 7,055.3 7,742.4 8,129.7 8,314.8 3.06% Import 4,213.3 4,272.0 4,168.3 4,545.0 5,420.9 5,680.9 5,268.0 5,819.4 5.11% Export 1,702.5 1,779.3 1,466.6 2,003.1 1,791.1 1,810.7 2,278.6 2,171.3 1.03% Consumption 8,949.8 9,252.8 9,392.6 9,836.0 10,553.8 11,413.5 11,601.9 12,029.6 4.14% Ending Stock 572.2 529.3 506.9 562.7 697.6 920.4 703.6 636.9 Stock Usage Ratio 5.4% 4.8% 4.7% 4.8% 5.7% 7.0% 5.1% 4.5%
IF you take palm oil of the production equation it is observed that that growth in production has not been able to cope with growth in consumption in the region
Export also show a very small growth as local consumption increases. Imports recorded strong growth, in tandem with strong growth in demand

Imports of oils and fats in the region consist of 12.01% of the global oils and fats import. That is a decrease from the 2012 where total imports are 13.44% of global oils and fats imports
This could be due to drop in consumption growth due to weakness in the global economy as production growth is on the decline
10.71% 11.94%
14.07% 13.44%
12.01%
0.00% 2.00% 4.00% 6.00% 8.00% 10.00% 12.00% 14.00% 16.00%
0 10,000 20,000 30,000 40,000 50,000 60,000 70,000 80,000
2009 2010 2011 2012 2013
Oils and Fats Import ('000 MT)
Global O&F Imports Asia Pacific O&F Imports AP - Global Ratio
Imports of Oils and Fats in the Region
50,994 52,293 56,345
59,679 62,192
19,468 20,555 22,494 24,334 25,933
0
10,000
20,000
30,000
40,000
50,000
60,000
70,000
2009 2010 2011 2012 2013
Production Consumption Diff
Production – Consumption Gap
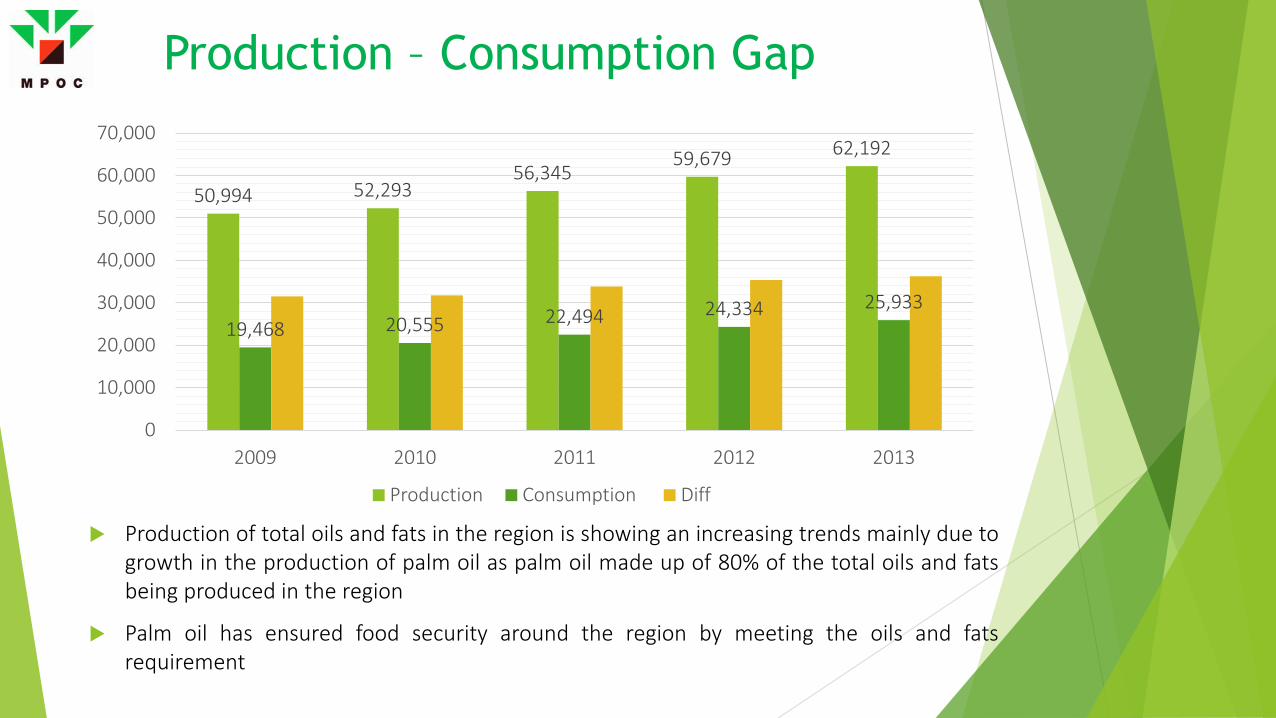
Production of total oils and fats in the region is showing an increasing trends mainly due to growth in the production of palm oil as palm oil made up of 80% of the total oils and fats being produced in the region
Palm oil has ensured food security around the region by meeting the oils and fats requirement
31,526 31,738 33,851 35,345 36,259
0
10,000
20,000
30,000
40,000
50,000
60,000
70,000
2009 2010 2011 2012 2013
Production Consumption Diff
Production – Consumption Gap
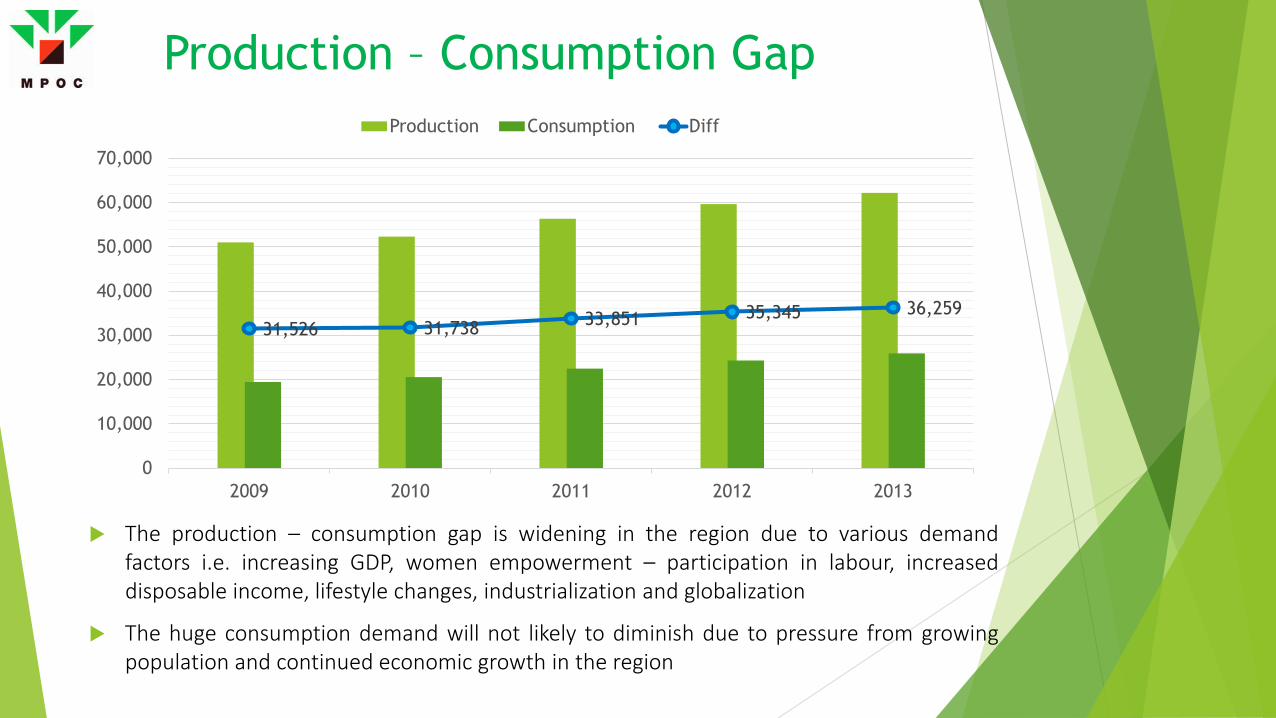
The production – consumption gap is widening in the region due to various demand factors i.e. increasing GDP, women empowerment – participation in labour, increased disposable income, lifestyle changes, industrialization and globalization
The huge consumption demand will not likely to diminish due to pressure from growing population and continued economic growth in the region

PART I: OILS AND FATS OVERVIEW Palm oil situation in the region
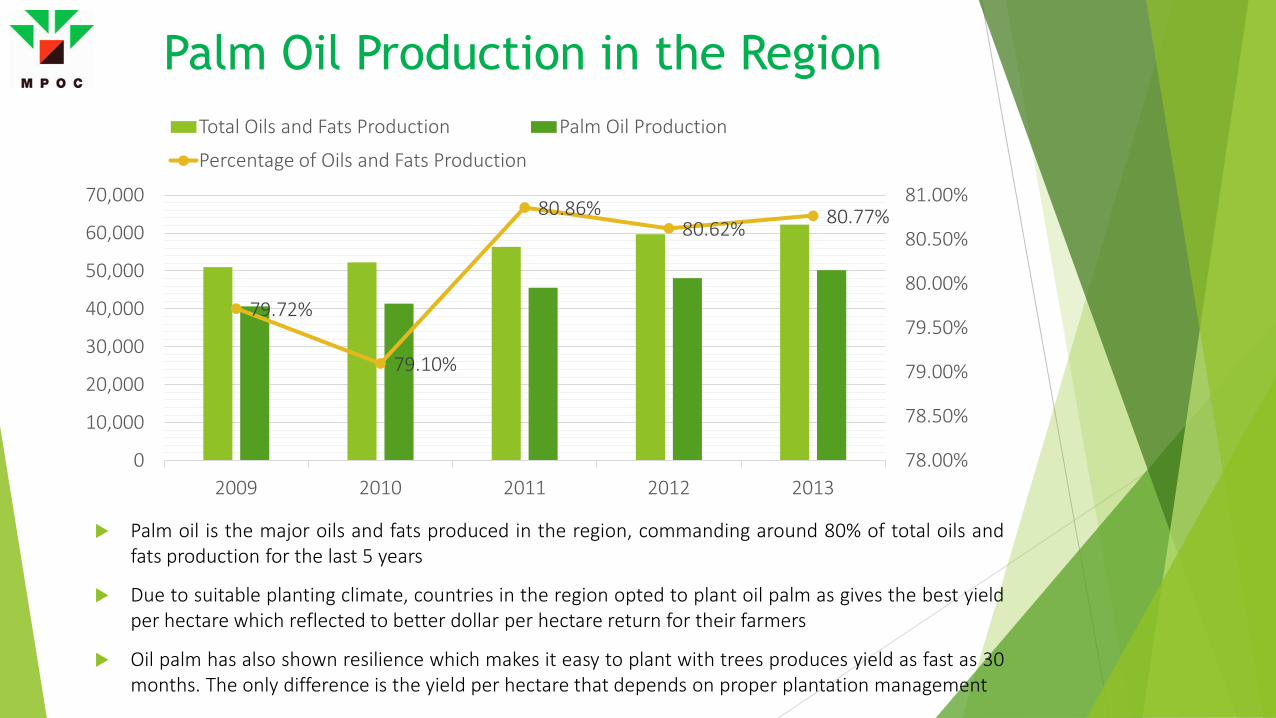
79.72%
79.10%
80.86% 80.62% 80.77%
78.00%
78.50%
79.00%
79.50%
80.00%
80.50%
81.00%
0
10,000
20,000
30,000
40,000
50,000
60,000
70,000
2009 2010 2011 2012 2013
Total Oils and Fats Production Palm Oil Production
Percentage of Oils and Fats Production
Palm Oil Production in the Region
Palm oil is the major oils and fats produced in the region, commanding around 80% of total oils and fats production for the last 5 years
Due to suitable planting climate, countries in the region opted to plant oil palm as gives the best yield per hectare which reflected to better dollar per hectare return for their farmers
Oil palm has also shown resilience which makes it easy to plant with trees produces yield as fast as 30 months. The only difference is the yield per hectare that depends on proper plantation management

Palm Oil Producing Countries
Palm Oil Production 2009 2010 2011 2012 2013 Indonesia 21,200 22,400 24,300 26,900 28,400
Malaysia 17,566 16,993 18,912 18,785 19,217
Philippines 90 92 87 98 106
Thailand 1,310 1,360 1,650 1,780 1,970
Solomon Isl 25 29 32 33 37
Papua/NGuinea 460 488 580 520 500
TOTAL 40,651 41,362 45,561 48,116 50,230
Palm oil’s main producer in the region is Indonesia, Malaysia and Thailand which are also the world’s top 3 palm oil producers
Growth in palm oil production correlates with the growth of oils and fats production and import in the region
Palm oil will continue to record strong growth in production which is shown in the 4.32% CAGR in the last 5 years. While Indonesia’s growth record a growth of 6.2%, Thailand showed the strongest growth with 8.1%. Production of palm oil in AP region made up of 90% of global palm oil production

Palm Oil Exports VS Global Oils and Fats Exports
41 38 36 34 34
64 67 68 73 75
63.67%
56.38% 53.08%
46.34% 44.67%
0.00%
10.00%
20.00%
30.00%
40.00%
50.00%
60.00%
70.00%
0
10
20
30
40
50
60
70
80
2009 2010 2011 2012 2013
Palm Oil Exports in Asia Pacific Global Oils and Fats Exports Percentage
In 2009, palm oil export in the region made up of 63.67% of the total global oils and fats export. This is due to strong demand from outside the region especially from India, Pakistan and EU
However, the trend showed a decline in percentage of total oils and fats exported as export of palm oil has slowly been reduced due to increased local consumptions over the years through population demand for food coupled with government’s policy for biofuel blends
Mil
MT

Malaysian Palm Oil Export in Asia Pacific
Malaysian palm oil export in the Asia Pacific region showed consistent growth trends for the last 5 years recording a 2.5% yearly growth average
Imports dropped in 2012 and 2013 due to dropped in import of total palm oil imports into the country
1,66
4,17
0
1,92
6,73
1
2,47
9,94
4
2,36
3,46
5
2,22
1,75
5
2009 2010 2011 2012 2013
Import Volume Linear (Import Volume)
Imports of Oils and Fats and Palm Oil in the Region
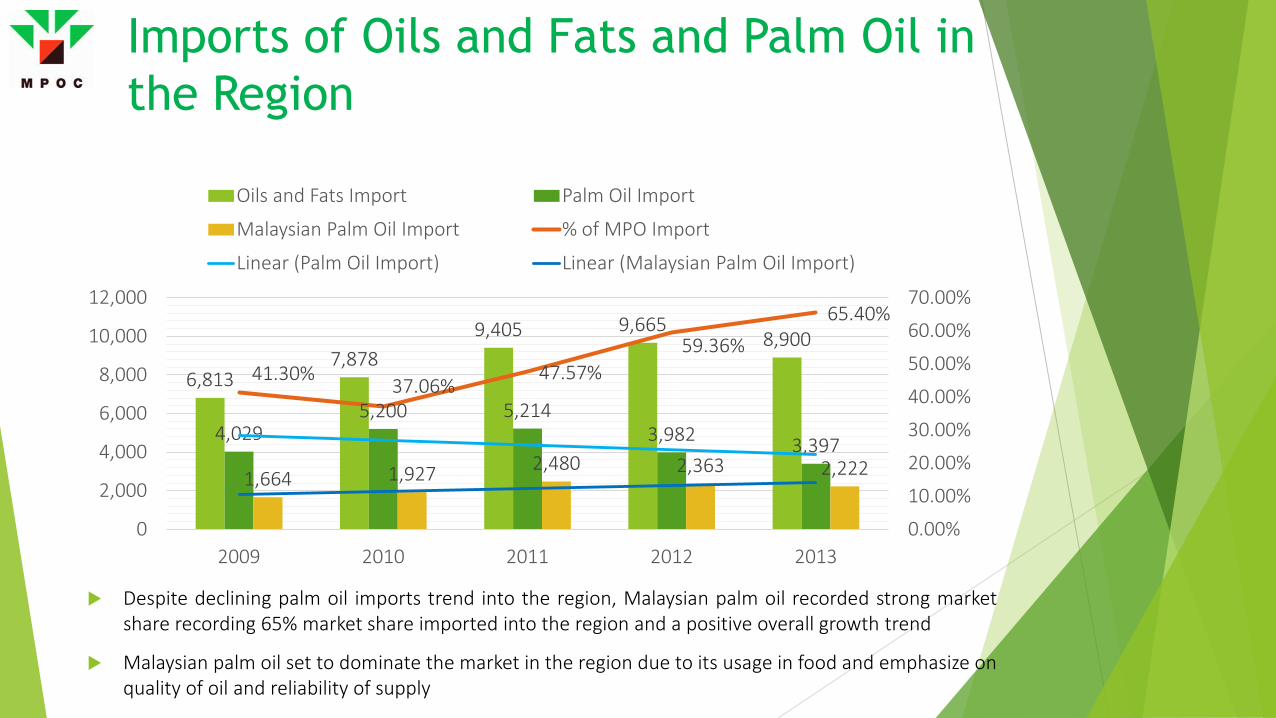
6,813 7,878
9,405 9,665 8,900
4,029 5,200 5,214
3,982 3,397
1,664 1,927 2,480 2,363 2,222
41.30% 37.06% 47.57%
59.36% 65.40%
0.00%
10.00%
20.00%
30.00%
40.00%
50.00%
60.00%
70.00%
0
2,000
4,000
6,000
8,000
10,000
12,000
2009 2010 2011 2012 2013
Oils and Fats Import Palm Oil Import
Malaysian Palm Oil Import % of MPO Import
Linear (Palm Oil Import) Linear (Malaysian Palm Oil Import)
Despite declining palm oil imports trend into the region, Malaysian palm oil recorded strong market share recording 65% market share imported into the region and a positive overall growth trend
Malaysian palm oil set to dominate the market in the region due to its usage in food and emphasize on quality of oil and reliability of supply

Products 2009 2010 2011 2012 2013
RBD PL 918,369 1,102,588 1,481,403 1,252,465 1,104,818
RBD PO 444,442 478,740 439,117 565,984 498,569
CPO 64,505 142,794 221,057 241,081 163,987
RBD PS 123,833 108,678 168,510 204,014 215,945
PFAD 58,726 81,115 124,253 111,622 208,693
Palm olein has been the leading palm products in the region, reaching 1.1 million MT in 2013. Palm olein recorded a healthy 3.8% CAGR from 2009 – 2013 period. The next palm products will be RBD Palm Oil at 498,569 MT followed by palm stearin at 215,945 MT with 2.3% and 20.2% CAGR respectively
This suggests the importance of food sector being the main driver for palm oil imports in the region
Palm Products Imported into the Region

PART II: ECONOMICS Macro views of the region that affect supply and demand of oils and fats

11.4%
27.3%
0
2E+13
4E+13
6E+13
8E+13
1E+14
1.2E+14
0.0%
5.0%
10.0%
15.0%
20.0%
25.0%
30.0%
Asia Pacific VS World GDP (Current Value – US$)
GDP EAP GDP World % of EAP to Global Linear (% of EAP to Global)
Gross Domestic Product (GDP)
Asia Pacific region has jumped from 11.4% in 1960 to 27.3% in 2013 attributed to China’s economic growth and higher costs for raw materials and commodities i.e. timber, mining products Analysts expects that Asia Pacific will slowly shift to the center of world economic development and contribution lead by China, supported by strong internal demand through growth in population, per capita income as business especially in the manufacturing and services will continue to grow in the region
Source: World Bank
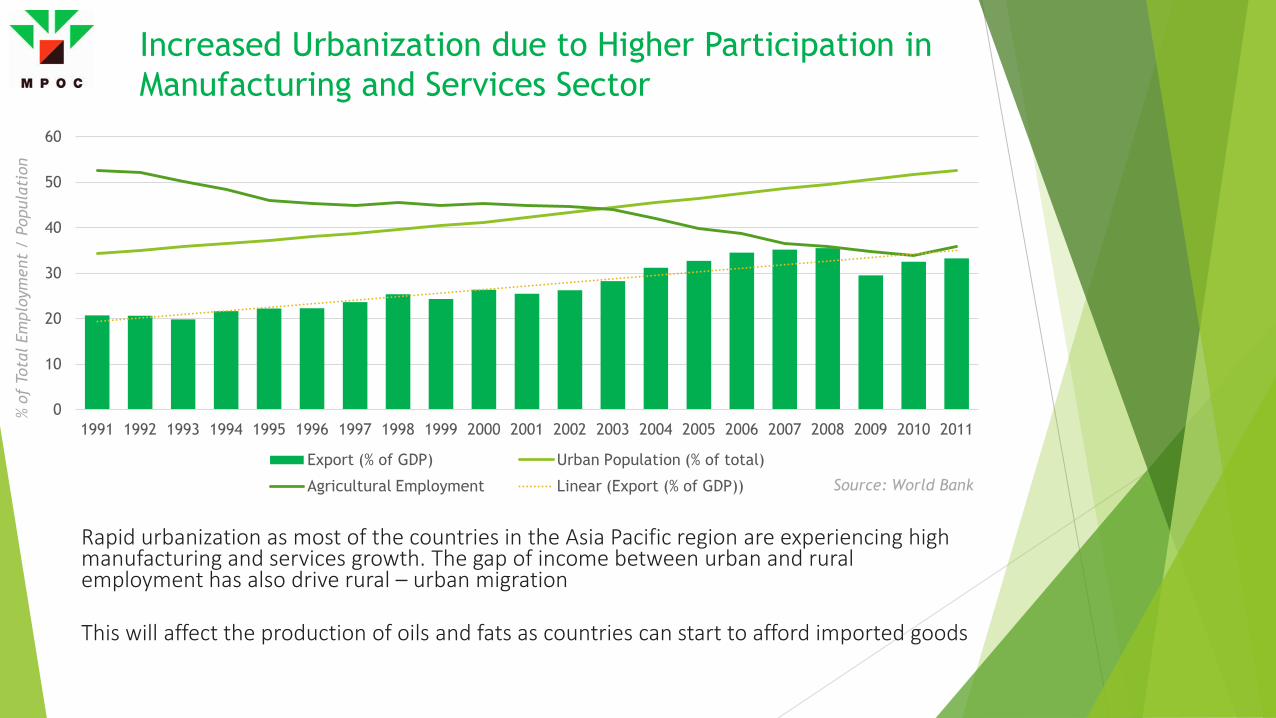
Rapid urbanization as most of the countries in the Asia Pacific region are experiencing high manufacturing and services growth. The gap of income between urban and rural employment has also drive rural – urban migration This will affect the production of oils and fats as countries can start to afford imported goods
Increased Urbanization due to Higher Participation in Manufacturing and Services Sector
0
10
20
30
40
50
60
1991 1992 1993 1994 1995 1996 1997 1998 1999 2000 2001 2002 2003 2004 2005 2006 2007 2008 2009 2010 2011
Export (% of GDP) Urban Population (% of total)
Agricultural Employment Linear (Export (% of GDP)) Source: World Bank
% of
Tot
al E
mpl
oym
ent
/ Po
pula
tion

Rapid urbanization as most of the countries in the Asia Pacific region are experiencing high manufacturing and services growth. So does the ratio of women in manufacturing and services industry has increased. In line with the UN Millennium Development Goals no 3 – to promote gender equality and empower women. World Bank also reported that as of 2012, 68% of the total female population are now participating in labour force
Increased Female Participation in the Services and Manufacturing Sector
0
10
20
30
40
50
60
1991 1992 1993 1994 1995 1996 1997 1998 1999 2000 2001 2002 2003 2004 2005 2006 2007 2008 2009 2010 2011
Urban Population (% of total) Agricultural Employment Source: World Bank
% of
Tot
al E
mpl
oym
ent
/ Po
pula
tion

-2.5%
-2.0%
-1.5%
-1.0%
-0.5%
0.0%
0.5%
1.0%
1.5%
2.0%
38
40
42
44
46
48
50
52
54
Total Agriculture Land Annual Changes Linear (Annual Changes)
Agricultural land in Asia Pacific region is showing a declining growth trend. This could due to various reasons i.e. drop in percentage of agricultural workforce due to rural – urban migration, explained by increased of urban population
Agricultural Land Availability
Source: World Bank
% of
Tot
al A
vail
able
Lan
d

Changes in Agricultural Land Growth and Production of Oils and Fats
48.3
48.4
48.5
48.6
48.7
48.8
48.9
49
49.1
49.2
0.00%
2.00%
4.00%
6.00%
8.00%
10.00%
12.00%
2008 2009 2010 2011 2012
Agricultural Land O&F Production Growth Linear (Agricultural Land)
There is a direct relationship between agricultural land availability and growth of oils and fats production.
Source: World Bank

PART III: POTENTIALS IN THE REGION Areas that are available for increased oils & fats uptake through Malaysian palm oil

434.46 445.66 471.66 509.31 547.06 583.13 664.61
969.50
0.00
200.00
400.00
600.00
800.00
1,000.00
1,200.00
2008 2009 2010 2011 2012 2013 2015F 2020F
Billi
on (U
S$)
Opportunities in Hotels and Restaurant
Hotels and restaurant sector has shown strong growth over the last 5 years with 5 % CAGR (2008 – 2013). Expenditure on hotels and restaurant has reached US$583 billion in 2013.
Growth is set to take place as the industry is forecasted to reach US$637 billion in 2015 and US$908.6 billion by 2020
Opportunities for olein and shortening in food preparation and as ingredient is high in this area.
Countries that showed strong growth in this sector other than China is Japan, South Korea, Indonesia, Taiwan
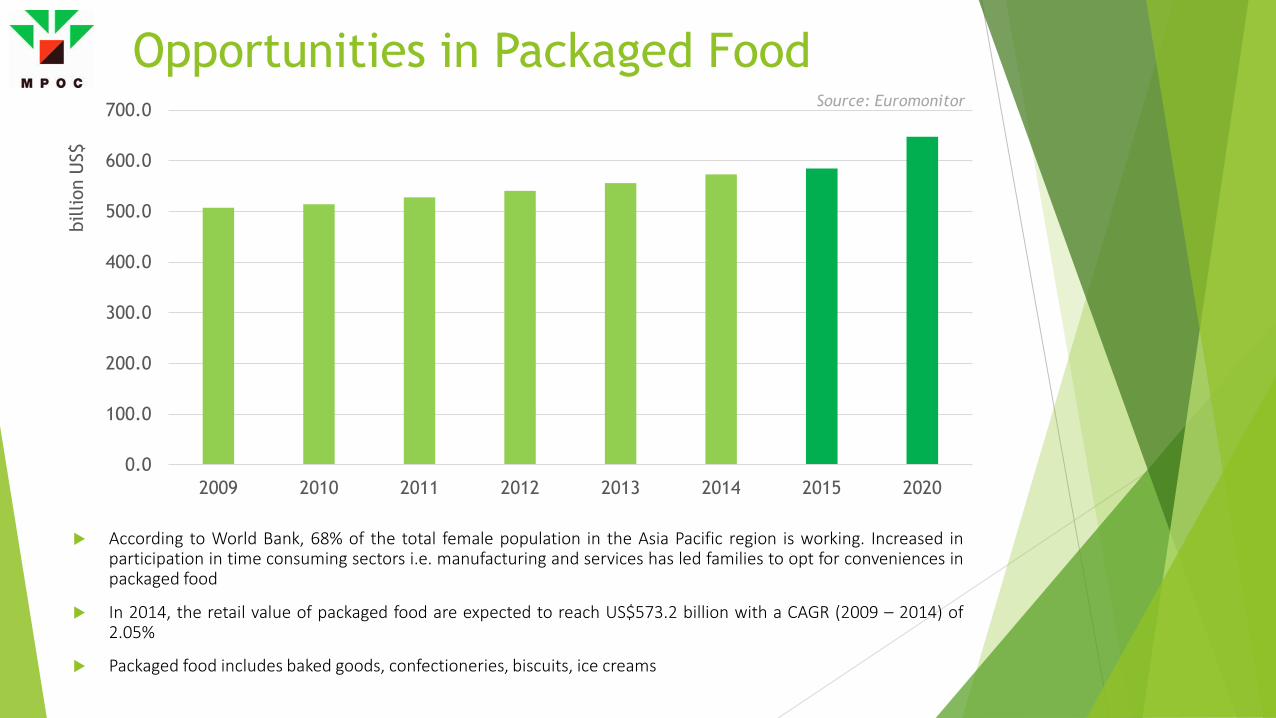
Opportunities in Packaged Food
According to World Bank, 68% of the total female population in the Asia Pacific region is working. Increased in participation in time consuming sectors i.e. manufacturing and services has led families to opt for conveniences in packaged food
In 2014, the retail value of packaged food are expected to reach US$573.2 billion with a CAGR (2009 – 2014) of 2.05%
Packaged food includes baked goods, confectioneries, biscuits, ice creams
0.0
100.0
200.0
300.0
400.0
500.0
600.0
700.0
2009 2010 2011 2012 2013 2014 2015 2020
billi
on U
S$
Source: Euromonitor

Opportunities in Bakery Sector
-5
0
5
10
15
20
25
30
35
0.00
20.00
40.00
60.00
80.00
100.00
120.00
140.00
2009 2010 2011 2012 2013 2014 2015 2020
Billi
on U
S$
Bakery Market Size Y-o-Y Growth Linear (Bakery Market Size)
Bakery sector showed strong growth after a slight decline in 2012/13, it has rebounded and is now stronger with projected growth of more than 30 percent from now until 2020.
Assuming growth patterns are the same from the last 5 years, market size is expected to reach 83.4 billion in 2015 and close to US$115 billion dollars by the year 2020
Solid fats i.e. palm shortening will continue to flourish in the region through growth in the bakery sector
Source: Euromonitor

0.00
20.00
40.00
60.00
80.00
100.00
120.00
140.00
160.00
180.00
200.00
2008 2009 2010 2011 2012 2013 2015 2020
Billi
on U
S$
Opportunities in Confectionery
Confectionery are seen as luxury food hence showing a slight drop in total consumer spending in the region as income is spent more on basic food due to unfavourable global economic effect in the region
However, it is believed that consumer spending on confectionery in the region will rebound and is expected to reach US$140 billion in 2015 potentially leading to US$187 billion by 2020
Palm specialty fats will be highly sought as manufacturers will struggle to look for an economical alternatives while trying to maintain cost and margin in a very challenging market
Source: Euromonitor

Increased birth rate and mortality rate per 1000 births were reduced significantly to just 15.4 in 2013
This has encourage growth for baby products (formula milk, food, etc)
Oils and fats accounts for up to 20% of ingredients in most baby products and this will definitely a window of opportunity for palm oil to leverage
0.0
5.0
10.0
15.0
20.0
25.0
2009 2010 2011 2012 2013 2014 0
1,000
2,000
3,000
4,000
5,000
6,000
7,000
8,000
9,000
Formula Milk Market Size Market Size Baby Food Infant Mortality Rate
Source: Euromonitor, Worldbank
Mil U
S$
Mor
talit
y pe
r 10
00 b
irth
s
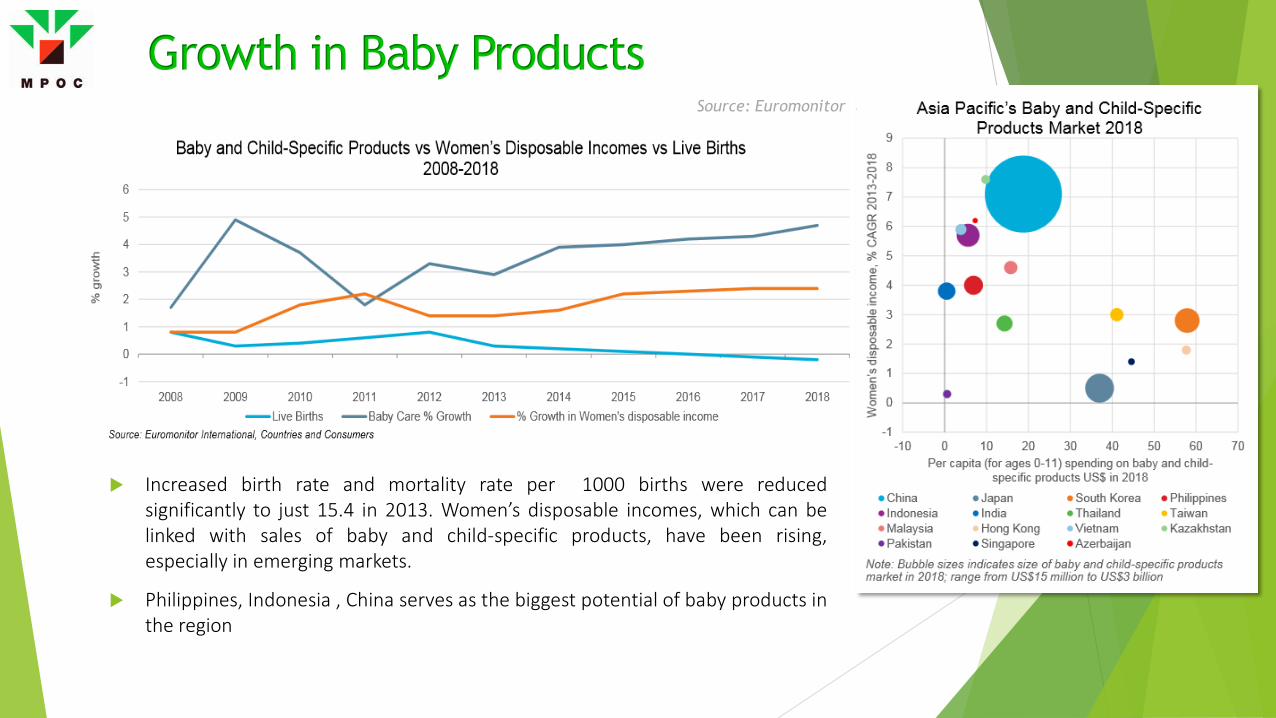
Increased birth rate and mortality rate per 1000 births were reduced significantly to just 15.4 in 2013. Women’s disposable incomes, which can be linked with sales of baby and child-specific products, have been rising, especially in emerging markets.
Philippines, Indonesia , China serves as the biggest potential of baby products in the region
Source: Euromonitor
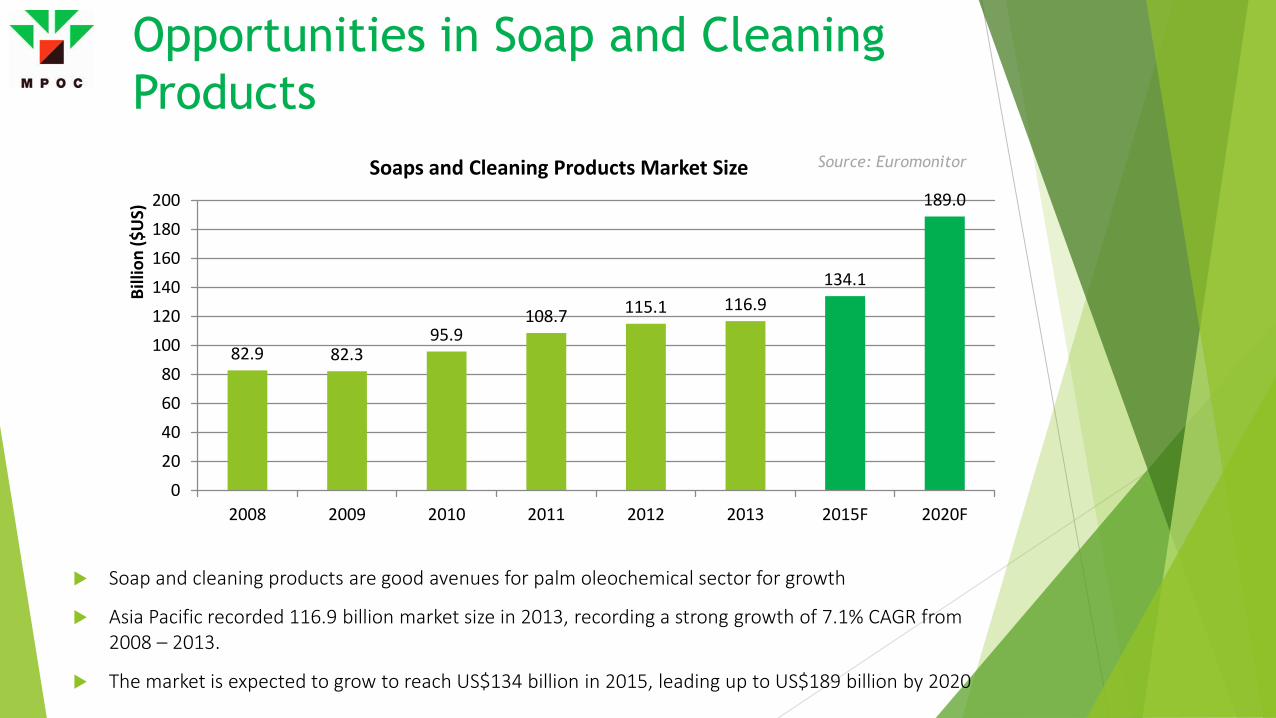
Opportunities in Soap and Cleaning Products
Soap and cleaning products are good avenues for palm oleochemical sector for growth
Asia Pacific recorded 116.9 billion market size in 2013, recording a strong growth of 7.1% CAGR from 2008 – 2013.
The market is expected to grow to reach US$134 billion in 2015, leading up to US$189 billion by 2020
82.9 82.3 95.9
108.7 115.1 116.9 134.1
189.0
0 20 40 60 80
100 120 140 160 180 200
2008 2009 2010 2011 2012 2013 2015F 2020F
Billi
on ($
US)
Soaps and Cleaning Products Market Size Source: Euromonitor

Growth in Animal Farming and Opportunity for Palm Feeds
In 2012, Asia holds 52.9% of the total global production of livestock
Rapid growth of cattle and poultry for the last 10 years is a clear indicator of increased demand through population drive but more importantly increased GDP per capita that affect the lifestyle and consequently eating habits
Holds great opportunity for palm feed as various studies found that palm based feed increase the LWG in a shorter period of time for broiler chickens, increased milk production in cows, increased egg production
0
2,000,000
4,000,000
6,000,000
8,000,000
10,000,000
12,000,000
14,000,000
16,000,000
1993 1995 1997 1999 2001 2003 2005 2007 2009 2011 2013 0
100
200
300
400
500
600
Mill
ions
hea
ds
Cattles Poultry Source: FAO
OBSERVATIONS Asia Pacific is the main producer for most commodities
Demand growth is getting bigger in the region as compared
to other region due to population growth and anticipated stronger economic condition
Asia Pacific countries should look to trade among each other as there are many incentives through joint economic efforts i.e. ASEAN + 3, APEC, and lower transportation costs
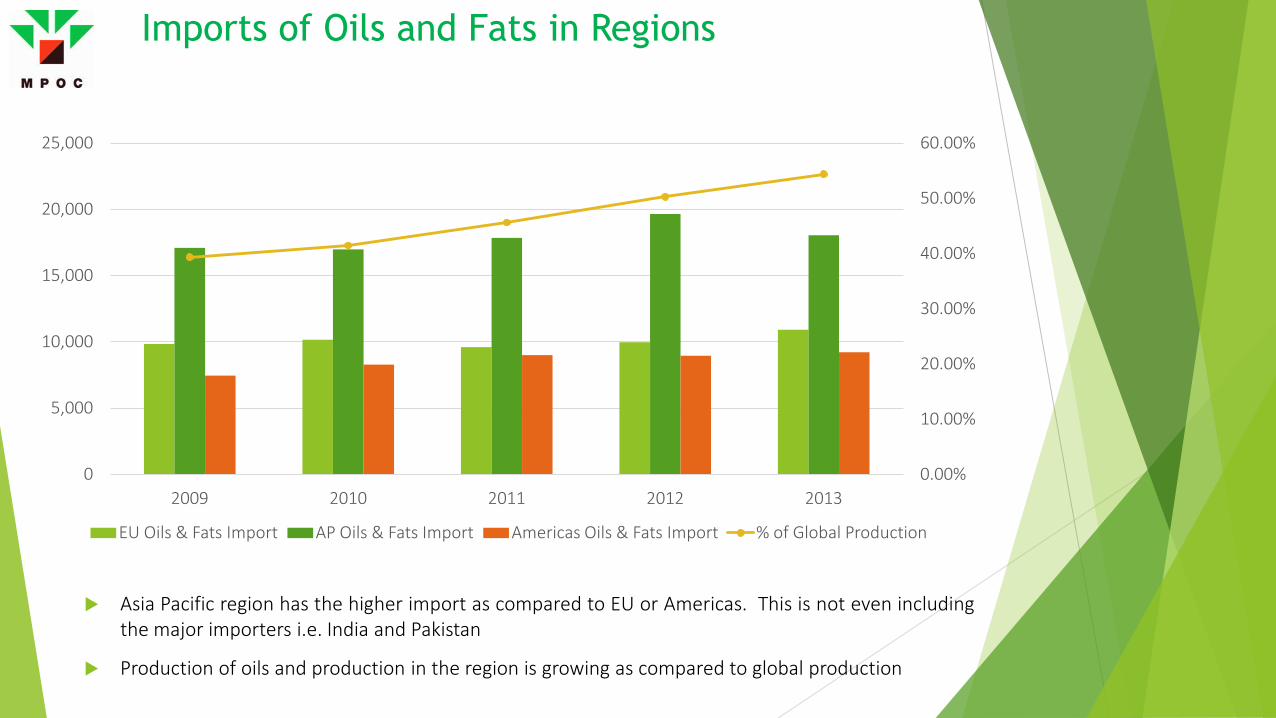
Imports of Oils and Fats in Regions
Asia Pacific region has the higher import as compared to EU or Americas. This is not even including the major importers i.e. India and Pakistan
Production of oils and production in the region is growing as compared to global production
0.00%
10.00%
20.00%
30.00%
40.00%
50.00%
60.00%
0
5,000
10,000
15,000
20,000
25,000
2009 2010 2011 2012 2013
EU Oils & Fats Import AP Oils & Fats Import Americas Oils & Fats Import % of Global Production
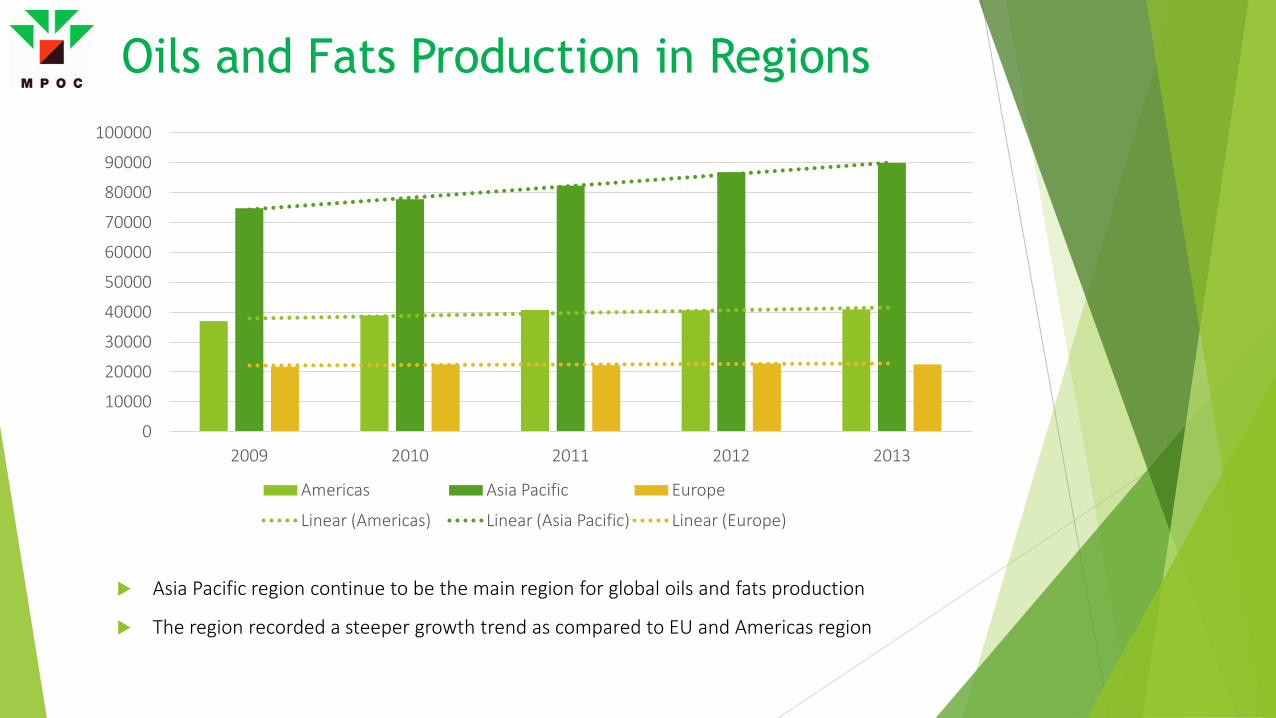
Oils and Fats Production in Regions
0
10000
20000
30000
40000
50000
60000
70000
80000
90000
100000
2009 2010 2011 2012 2013
Americas Asia Pacific Europe
Linear (Americas) Linear (Asia Pacific) Linear (Europe)
Asia Pacific region continue to be the main region for global oils and fats production
The region recorded a steeper growth trend as compared to EU and Americas region

CONCLUSIONS Asia Pacific as the growth driver destination and Malaysian palm oil is the viable solution – technically and economically

Conclusions
Global food security has been the main topic for most workgroups at the international, regional and national level. As the world is expected to reach 9 billion by 2050, the scarcity in critical resources such as food should be the focus
Oils and fats in one of the main sectors in food that is important as deficiency in fats has been known to caused various diseases due to inability to absorb important fat soluble vitamins
The Asia Pacific region is one of the important region due to its population and economic growth. The region’s oils and fats needs is not seen to be diminishing in the future and will continue to grow
Decreasing growth in agricultural land is making it increasingly critical to secure food production including in the oils and fats sector. There is a positive correlation between growth in agricultural land and production of oils and fats in the region. A high yielding plant that can optimize the tonnes per hectare is needed
Palm oil fits the description well for high yielding, maximum tonnes per hectares crop
With 80% of total production of oils & fats in the region, the palm oil supply seems to have a critical role in the region. This serves as a great potential for businesses with Malaysian palm oil in the region
This is of course due to palm oil’s nutritional and economical advantages. The trans fat issue that is now a major concern in most developing countries will require most food manufacturers to switch to feedstock that can avoid trans fat at the lowest cost
Again, palm oil will give food manufacturers the advantage due to its naturally semi solid attributes that won’t require partial hydrogenation or interesterification that will increase the cost
Malaysian palm oil has shown increasing imports in the region – quality and reliability
Conclusions

Malaysian palm oil industry can also cater not only in oils segment. Due to better economic position, it’s proven that increased income will increase consumption in meat and poultry. The high livestock production in the region will need food. Feed for food. Palm kernel meal will be a good blend with the current feed formulation as various studies has shown that the appropriate blend of palm kernel meal has been proven to increase meat and milk production in cow, increased LWG within shorter periods of time and increased egg weight for poultries
Oleochemical sectors are also blooming in the region. Soap and detergent sector, baby products are all showing strong growth due to increased disposable income among the female population
Many more opportunities for everyone involved in the supply chain of Malaysian palm oil industry
Conclusions

THANK YOU Email: [email protected]