Asia Pacific Oilfield Chemicals Market 2014 - 2019
15
ASIA PACIFIC OILFIELD CHEMICALS MARKET Market Shares, Forecasts & Trends 2014 - 2019 mordorintelligence.com
-
Upload
mordor-intelligence -
Category
Documents
-
view
233 -
download
2
description
Asia Pacific prospect of posting a compounded annual rate of nearly 10% over 2014-2020.
Transcript of Asia Pacific Oilfield Chemicals Market 2014 - 2019

ASIA PACIFICOILFIELDCHEMICALS MARKET
Market Shares, Forecasts& Trends
2014 - 2019
mordorintelligence.com

Asia Pacific Oilfield Chemicals Market | Sample
TABLE OF CONTENTS
1. Introduction
1.1 Description
1.2 Research Methodology
1.3 Report Outline
2. Executive Summary
3. Market Overview
3.1 Current Market Scenario
3.2 Factors Driving the Oilfield Chemicals Market
3.2.1 Demand for Oilfield Chemicals Bolstered through Growing Crude Oil Production
3.2.2 Oilfield Chemicals Being Driven by Shale Gas Exploration and Production
3.2.3 Environment-Friendly Chemicals Being Developed Due to Stringent Regulations
3.3 Factors Restraining the Oilfield Chemicals Market
3.3.1 Environmental Sustainability in Shale Gas Extraction
3.4 Opportunities for the Oilfield Chemicals Market
3.4.1 New Horizons Opened Up Due to Deep Water Drilling Operations
3.4.2 Nanotechnology’s Prospects Bright in Cementing Applications
3.4.3 Productive Opportunities Provided by Developing Regions
3.5 Porter’s Five Forces
3.5.1 Bargaining Power of Suppliers
3.5.2 Bargaining Power of Consumers
3.5.3 Threat of New Entrants
gtjg
Typewriter
VIEW THIS REPORT ON OUR WEBSITE

Asia Pacific Oilfield Chemicals Market | Sample
3.5.4 Threat of Substitute Products and Services
3.6 Industry Value Chain Analysis
4. Market Segmentation
4.1 By Chemical Type
4.1.1 Biocides
4.1.2 Corrosion & Scale Inhibitors
4.1.3 Demulsifiers
4.1.4 Polymers
4.1.5 Pour-Point Depressants
4.1.6 Surfactants
4.1.7 Other Chemicals
4.2 By Application
4.2.1 Cementing
4.2.2 Drilling
4.2.3 Enhanced Oil Recovery
4.2.4 Production
4.2.5 Well Stimulation
4.2.6 Workover & Completion
5. Asia-Pacific Market Analysis
5.1 China
5.2 India
5.3 Others
gtjg
Typewriter
VIEW THIS REPORT ON OUR WEBSITE

Asia Pacific Oilfield Chemicals Market | Sample
6. Policies and Regulations
7. Competitor Analysis
7.1 Market Shares of Leading Global Players
7.2 Strategies Adopted by Leading Global Players
8. Company Profiles
8.1 AkzoNobel NV
8.2 Albemarle Corp
8.3 Ashland Inc
8.4 Baker Hughes Inc
8.5 Canadian Energy Services & Technology Corp
8.6 Clariant AG
8.7 Croda International Plc
8.8 Dow Chemical Company
8.9 E.I. DuPont De Nemours & Company
8.10 Elementis Plc
8.11 Flotek Industries Inc
8.12 Halliburton
8.13 Kemira Oyj
8.14 Lamberti Group
8.15 Messina Inc
8.16 Nalco Champion Technologies Inc
8.17 Newpark Resources Inc
8.18 Schlumberger Limited
gtjg
Typewriter
VIEW THIS REPORT ON OUR WEBSITE

Asia Pacific Oilfield Chemicals Market | Sample
8.19 M-I SWACO
8.20 Solvay SA
8.21 Stepan Company
8.22 The Lubrizol Corporation
8.23 Weatherford International Ltd
8.24 Zirax Limited
9. Appendix
gtjg
Typewriter
VIEW THIS REPORT ON OUR WEBSITE

Asia Pacific Oilfield Chemicals Market | Sample
RESEARCH METHODOLOGY
The research methodology can be put into the following sequence:
1) Secondary Research: Information was collected from a number of public and paid data sources.
Public sources involved Ministry of Oil and Natural Gas- India, ESDM, Malaysian Oil and Gas Service
Council, Department of Mines and Petroleum – Australia, company annual reports, white papers and
research publications by recognized industry experts. Paid data sources include authentic industry
databases.
2) Primary Research: After collecting data from secondary sources, primary interviews were conducted
with stakeholders at different points of the value chain like manufacturers, distributors, companies
producing chemicals, end-product users and key opinion leaders of the industry. Primary research was
used both to validate the data points obtained from secondary research and to fill the data gaps after
secondary research.
3) Market Engineering: The market engineering phase involves analysing the data collected, market
breakdown and forecasting. Macroeconomic indicators and bottom-up and top-down approaches are
used to arrive at a complete set of data points that give way to valuable qualitative and quantitative
insights. Each data point is verified by the process of data triangulation to validate the numbers and
arrive at close estimates.
4) Expert Validation: The market engineered data is verified and validated by a number of experts, both
in-house and external.
5) Report Writing: After the data is curated by the mentioned highly sophisticated process, the analysts
begin to write the report. Garnering insights from data and forecasts, insights are drawn to visualize the
entire ecosystem in a single report.
gtjg
Typewriter
VIEW THIS REPORT ON OUR WEBSITE

Asia Pacific Oilfield Chemicals Market | Sample
3. DRIVERS
3.2.2 OILFIELD CHEMICALS BEING DRIVEN BY SHALE GAS EXPLORATION AND PRODUCTION
Australia, China, India and Indonesia have taken tentative steps to explore their shale gas and oil
potential, including drilling wells. This increase in drilling and production has resulted in higher volumes
of drilling, stimulation, and cementing chemicals. The Asia-Pacific market is expected to show strong
growth of in the drilling, cementing, and stimulation markets, while production chemicals will grow more
slowly due to much of the new development coming from shale gas fields.
From producing 30 million cubic meters of natural gas from shale formations in 2012, China produced
200 million cubic meters in 2013, which was about 0.2 percent of China’s total natural gas production.
China's shale gas production in 2014 is expected to surpass 1.5 billion cubic meters, 7.5 times that of
2013. China has a goal of producing 6.5 billion cubic meters of shale gas in 2015, which would equal 5.5
percent of total 2013 gas production. By the end of July, 2014 the country had invested US$3.25 billion
on exploiting 54 possible shale gas fields,
According to estimates of the petroleum and natural gas ministry, by 2015-16, India’s demand for gas is
set to rise to 162 (billion cubic metres) bcm per year against a partial increase in the domestic supply to
43 bcm per year and higher imports of 60 bcm per year. Shale gas production would reduce the supply-
demand gap. Companies including Reliance Industries Limited (E&P), RNRL, Vikas WSP Limited have
expressed interest in exploring in India, which is estimated to hold 500 to 2000 trillion cubic meter of
recoverable shale gas. Six main basins have been identified that could be successfully exploited:
gtjg
Typewriter
VIEW THIS REPORT ON OUR WEBSITE
Asia Pacific Oilfield Chemicals Market | Sample
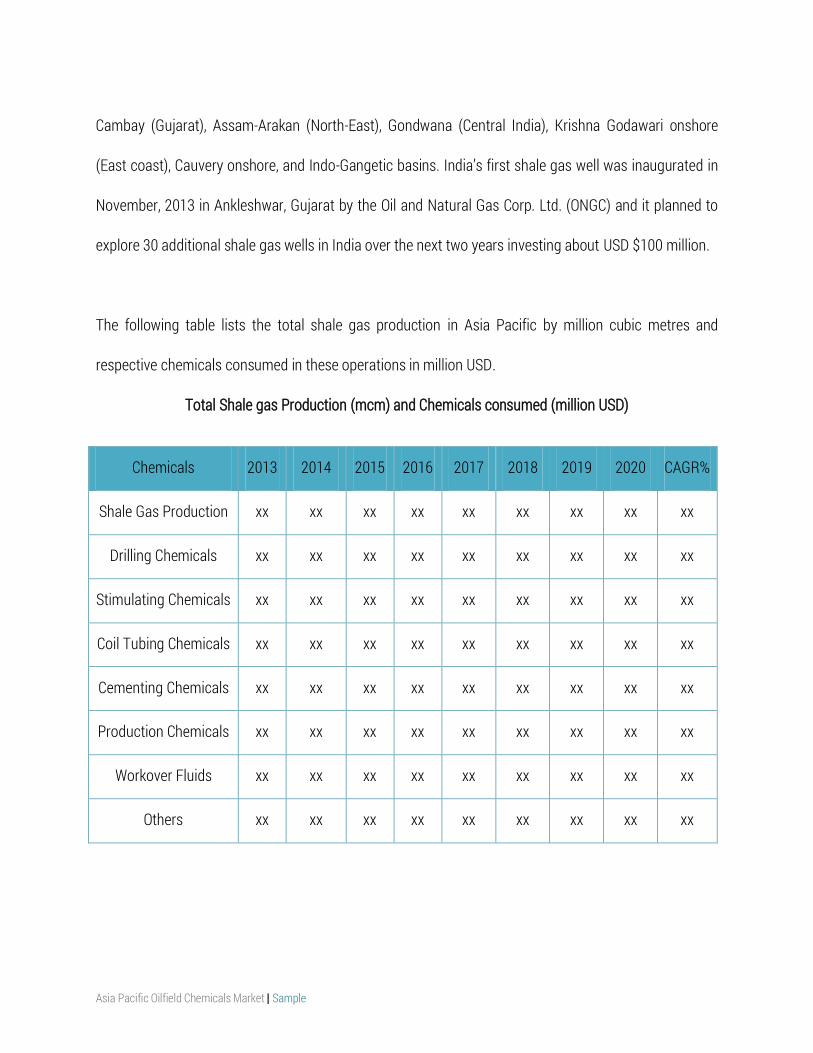
Cambay (Gujarat), Assam-Arakan (North-East), Gondwana (Central India), Krishna Godawari onshore
(East coast), Cauvery onshore, and Indo-Gangetic basins. India’s first shale gas well was inaugurated in
November, 2013 in Ankleshwar, Gujarat by the Oil and Natural Gas Corp. Ltd. (ONGC) and it planned to
explore 30 additional shale gas wells in India over the next two years investing about USD $100 million.
The following table lists the total shale gas production in Asia Pacific by million cubic metres and
respective chemicals consumed in these operations in million USD.
Total Shale gas Production (mcm) and Chemicals consumed (million USD)
Chemicals 2013 2014 2015 2016 2017 2018 2019 2020 CAGR%
Shale Gas Production xx xx xx xx xx xx xx xx xx
Drilling Chemicals xx xx xx xx xx xx xx xx xx
Stimulating Chemicals xx xx xx xx xx xx xx xx xx
Coil Tubing Chemicals xx xx xx xx xx xx xx xx xx
Cementing Chemicals xx xx xx xx xx xx xx xx xx
Production Chemicals xx xx xx xx xx xx xx xx xx
Workover Fluids xx xx xx xx xx xx xx xx xx
Others xx xx xx xx xx xx xx xx xx
gtjg
Typewriter
VIEW THIS REPORT ON OUR WEBSITE

Asia Pacific Oilfield Chemicals Market | Sample
8.12 HALLIBURTON
3000 North Sam Houston Parkway East
Houston, TX 77072
Phone: 281-871-2699
Website: http://www.halliburton.com
COMPANY OVERVIEW
Founded in 1919, Halliburton Halliburton is the second largest player in the oilfield services segment
after world leader Schlumberger providing a range of services and products for the exploration,
development, and production of oil and natural gas to worldwide oil and gas companies. With more than
80,000 employees, representing 140 nationalities in approximately 80 countries, the company serves the
upstream oil and gas industry throughout the lifecycle of the reservoir – from locating hydrocarbons
and managing geological data, to drilling and formation evaluation, well construction and completion,
and optimizing production through the life of the field.
Halliburton comprises 13 product service lines (PSLs). The PSLs operate in two divisions: Drilling and
Evaluation, and Completion and Production. PSLs are primarily responsible and accountable for
strategy, technology development, process development, people development and capital allocation.
The Completion and Production segment offers production enhancement services, including stimulation
services and sand control services; and cementing services comprising bonding the well and well
casing, and casing equipment. It also offers completion tools that provide downhole solutions and
services, including well completion products and services, intelligent well completions, liner hanger
systems, sand control systems, and service tools. This segment also provides well intervention services,
pressure control, equipment rental tools and services, and pipeline and process services; and oilfield
production and completion chemicals and services that address production, processing, and
transportation operations.
gtjg
Typewriter
VIEW THIS REPORT ON OUR WEBSITE

Asia Pacific Oilfield Chemicals Market | Sample
The Drilling and Evaluation segment offers drill bits and services, including roller cone rock bits, fixed
cutter bits, hole enlargement, and related downhole tools and services, as well as coring equipment and
services; wireline and perforating services, such as open-hole logging, cased-hole and slickline, borehole
seismic, and formation and reservoir solutions; and testing and subsea services comprising acquisition
and analysis of reservoir information and optimization solutions. This segment also provides drilling
fluid systems, performance additives, completion fluids, solids control, specialized testing equipment,
and waste management services; drilling systems and services; integrated exploration, drilling, and
production software, as well as related professional and data management services; and oilfield project
management and integrated solutions.
A slowdown in shale gas exploration activity in the U.S. forced by low gas prices in North America is
hastening the company to push for markets outside the country. In Asia-Pacific, an important market for
the oil field services industry, Halliburton meets the market demand for the hydrocarbon industry
services sector. The recent development of significant reserves in deepwater and unconventional assets
in the region is key to expansion of investments in the region. Halliburton already has close to 5,500
employees in the Asia Pacific region and is looking to capitalise on the future efforts to explore
unconventionals in countries like Indonesia, Malaysia and Australia. This is expected to boost rig counts
in the region over the next few years.
KEY FINANCIALS
The total revenue of the company was USD $29,402 in 2013.
The total revenue in Asia, in 2013 was USD $5056 million, up from USD $4295 million in 2012, an
increase of 18%. The revenue from Completion and Production segment was USD $2112 million
compared to $1709 in 2012, increasing by 24%. The revenue from Drilling and Evaluation segment was
USD $2944 million compared to $2586 in 2012, increasing by 14%. The total revenue from Asia, in 2013
was 17.2 % of the global revenue in 2013, up from 15% of the global revenue in 2012. The total
operating income from Asia in 2013 was USD $865 million, up from USD $687 million in 2012, an
gtjg
Typewriter
VIEW THIS REPORT ON OUR WEBSITE

Asia Pacific Oilfield Chemicals Market | Sample
increase of 26%. Asia Pacific contributed to 27.5% of the global operating income, thus proving to be
one of the most profitable and fastest growing regional segments for the company.
Revenue in Asia improved by 18% due to higher drilling activity and higher wireline activity in Australia,
Indonesia, and China, strong demand in Indonesia, increased completion tools sales in Malaysia and
higher demand for cementing services in Thailand. Operating income in Asia increased by 26% due to
higher direct sales in China, improved profitability and stronger demand in Indonesia, region, higher
drilling activity and higher wireline activity throughout the Asia Pacific region.
Table: Halliburton Financial Performance by Region
Completion and Production Revenue by Region
2013 2012
Total XX XX
North America 11,417 12,157
Latin America XX XX
Europe/Africa/CIS 2,391 2,099
Middle East/Asia XX XX
Drilling and Evaluation Revenue by Region
Total XX XX
North America 3,795 3,847
Latin America XX XX
Europe/Africa/CIS 2,834 2,411
Middle East/Asia XX XX
gtjg
Typewriter
VIEW THIS REPORT ON OUR WEBSITE

Asia Pacific Oilfield Chemicals Market | Sample
Table: Halliburton Operating Income by Region
Completion and Production Operating Income by Region
2013 2012
Total XX XX
North America 1,916 2,260
Latin America XX XX
Europe/Africa/CIS 356 347
Middle East/Asia XX XX
Drilling and Evaluation Operating Income by Region
2013 2012
Total XX XX
North America 656 680
Latin America XX XX
Europe/Africa/CIS 334 346
Middle East/Asia XX XX
Table: Halliburton Total Revenue
Revenue by Segment 2013 2012
Completion and Production XX XX
Drilling and Evaluation 11,896 11,123
Total Revenue XX XX
gtjg
Typewriter
VIEW THIS REPORT ON OUR WEBSITE

Asia Pacific Oilfield Chemicals Market | Sample
Figure: Halliburton Revenue Share by Region
Halliburton Revenue Share by Region (%)
North America
gtjg
Typewriter
VIEW THIS REPORT ON OUR WEBSITE
DISCLAIMER
Mordor Intelligence Reports and their contents, including all the analysis and research containing
valuable market information, are provided to a select group of customers in response to orders. Our
customers acknowledge when ordering that Mordor Intelligence strategic analysis services are for our
customers’ internal use and not for general publication or disclosure to third parties.
Quantitative market information is based primarily on interviews and therefore, is subject to fluctuation.
Mordor Intelligence takes no responsibility for any incorrect information supplied to us by
manufacturers or users.
No part of this strategic analysis service may be given, lent, resold or disclosed to non-customers
without written permission. Reproduction and/or transmission in any form and by any means including
photocopying, mechanical, electronic, recording or otherwise, without the permission of the publisher is
prohibited.
ABOUT US
Mordor Intelligence is a global market research and consulting firm. Our singular focus is to provide
research insights for business success.
Our research team has expertise in diverse fields like Agriculture, Healthcare, ICT, Chemicals,
Manufacturing, Logistics, Electronics and Automotive. However diverse the expertise maybe, everyone
in our team shares one common trait - we love data and we love providing solutions to clients using that
data even more. Seeing your business flourish based on our solutions and strategy is what we love the
most.
For information regarding permissions and sales, please contact: [email protected]
gtjg
Typewriter
VIEW THIS REPORT ON OUR WEBSITE

!
!
!
!
!
!
!
!
!
!
!
!
!
!
!
!
!Copyright © 2014 Mordor Intelligence LLP
All Rights Reserved. This document contains highly confidential information and is the sole property of Mordor Intelligence LLP. No part of it may be circulated, copied, quoted, or otherwise reproduced without the approval of Mordor Intelligence LLP.
Mordor Intelligence LLP No. 30, Padma Nilaya, Chola Nagar Bangalore, Karnataka, India 560032 +1 781 881 1110 | [email protected] !