Asia: Automobiles — Charging the future: Asia leads … · September 27, 2016 Asia: Automobiles...
59
September 27, 2016 Asia: Automobiles Charging the future: Asia leads drive to next-generation EV battery market Equity Research Pushing the limits of lithium-ion batteries and investing in all-solid-state batteries Battery market to grow 6X by 2025E We believe the rapid adoption of electric vehicles and hybrids over the next decade will spur an enormous increase in the market for EV batteries and heightened demand for advances in battery technology. We forecast a six-fold increase in the market for EV batteries to US$24 billion by 2025, fueled by increases in energy density to lower prices. In this report, we outline where we see Asian companies leading this growth and pioneering efforts to find the next-generation battery technology to replace lithium-ion. Powering the transition to EVs Our battery market forecasts rest on our expectations for a 30% CAGR in sales of electric vehicles (EVs) to 2025, along with a 36% CAGR in sales of plug-in hybrid electric vehicles (PHEVs) to reduce CO2 emissions. We expect that over that span, the gravimetric energy density of EV batteries will climb to over 500 Wh/kg from 200 Wh/kg in 2015, likely requiring transition to a post-lithium technology. Investing with eye to lithium’s limits Our approach is to look for companies that will benefit from expansion and innovation in the lithium-ion battery (LIB) market, as well as those invested in the development of potential successor technologies. We believe the post- lithium transition could start from 2020. Among a range of alternatives we focus on all-solid-state batteries that would do away with the liquid electrolyte found in most lithium-ion batteries and offer advantages in size and cost. Asian at heart of battery ecosystem LG Chem (CL-Buy), Korea’s leading battery manufacturer, has supply contracts with multiple automakers, and in our view has an edge over rivals from both a technical and cost perspective BYD (Buy), China’s leading EV manufacturer, is mass-producing its own inexpensive batteries. In addition, we highly value Toyota’s long-term strategy to focus on all-solid-state batteries, but remain Neutral due to US auto slowdown concerns in the near term. Kota Yuzawa +81(3)6437-9863 [email protected] Goldman Sachs Japan Co., Ltd. Yipeng Yang +86(10)6627-3189 [email protected] Beijing Gao Hua Securities Company Limited Nikhil Bhandari +65-6889-2867 [email protected] Goldman Sachs (Singapore) Pte Masaru Sugiyama +81(3)6437-4691 [email protected] Goldman Sachs Japan Co., Ltd. Shuhei Nakamura +81(3)6437-9932 [email protected] Goldman Sachs Japan Co., Ltd. Goldman Sachs does and seeks to do business with companies covered in its research reports. As a result, investors should be aware that the firm may have a conflict of interest that could affect the objectivity of this report. Investors should consider this report as only a single factor in making their investment decision. For Reg AC certification and other important disclosures, see the Disclosure Appendix, or go to www.gs.com/research/hedge.html. Analysts employed by non-US affiliates are not registered/qualified as research analysts with FINRA in the U.S. The Goldman Sachs Group, Inc. Global Investment Research
Transcript of Asia: Automobiles — Charging the future: Asia leads … · September 27, 2016 Asia: Automobiles...

September 27, 2016
Asia: Automobiles
Charging the future: Asia leads drive to
next-generation EV battery market Equity Research
Pushing the limits of lithium-ion batteries and investing in all-solid-state batteries
Battery market to grow 6X by 2025E
We believe the rapid adoption of electric vehicles
and hybrids over the next decade will spur an
enormous increase in the market for EV batteries
and heightened demand for advances in battery
technology. We forecast a six-fold increase in the
market for EV batteries to US$24 billion by 2025,
fueled by increases in energy density to lower
prices. In this report, we outline where we see
Asian companies leading this growth and
pioneering efforts to find the next-generation
battery technology to replace lithium-ion.
Powering the transition to EVs
Our battery market forecasts rest on our
expectations for a 30% CAGR in sales of electric
vehicles (EVs) to 2025, along with a 36% CAGR in
sales of plug-in hybrid electric vehicles (PHEVs) to
reduce CO2 emissions. We expect that over that
span, the gravimetric energy density of EV
batteries will climb to over 500 Wh/kg from 200
Wh/kg in 2015, likely requiring transition to a
post-lithium technology.
Investing with eye to lithium’s limits
Our approach is to look for companies that will
benefit from expansion and innovation in the
lithium-ion battery (LIB) market, as well as those
invested in the development of potential
successor technologies. We believe the post-
lithium transition could start from 2020. Among a
range of alternatives we focus on all-solid-state
batteries that would do away with the liquid
electrolyte found in most lithium-ion batteries and
offer advantages in size and cost.
Asian at heart of battery ecosystem
LG Chem (CL-Buy), Korea’s leading battery
manufacturer, has supply contracts with multiple
automakers, and in our view has an edge over
rivals from both a technical and cost perspective
BYD (Buy), China’s leading EV manufacturer, is
mass-producing its own inexpensive batteries. In
addition, we highly value Toyota’s long-term
strategy to focus on all-solid-state batteries, but
remain Neutral due to US auto slowdown
concerns in the near term.
Kota Yuzawa
+81(3)6437-9863 [email protected] Goldman Sachs Japan Co., Ltd.
Yipeng Yang
+86(10)6627-3189 [email protected] Beijing Gao Hua Securities Company Limited
Nikhil Bhandari
+65-6889-2867 [email protected] Goldman Sachs (Singapore) Pte
Masaru Sugiyama
+81(3)6437-4691 [email protected] Goldman Sachs Japan Co., Ltd.
Shuhei Nakamura
+81(3)6437-9932 [email protected] Goldman Sachs Japan Co., Ltd.
Goldman Sachs does and seeks to do business with companies covered in its research reports. As a result, investors should be aware that the firm may have a conflict of interest that could affect the objectivity of this report. Investors should consider this report as only a single factor in making their investment decision.For Reg AC certification and other important disclosures, see the Disclosure Appendix, or go to www.gs.com/research/hedge.html. Analysts employed by non-US affiliates are not registered/qualified as research analysts with FINRA in the U.S.
The Goldman Sachs Group, Inc. Global Investment Research
September 27, 2016 Asia: Automobiles
Goldman Sachs Global Investment Research 2
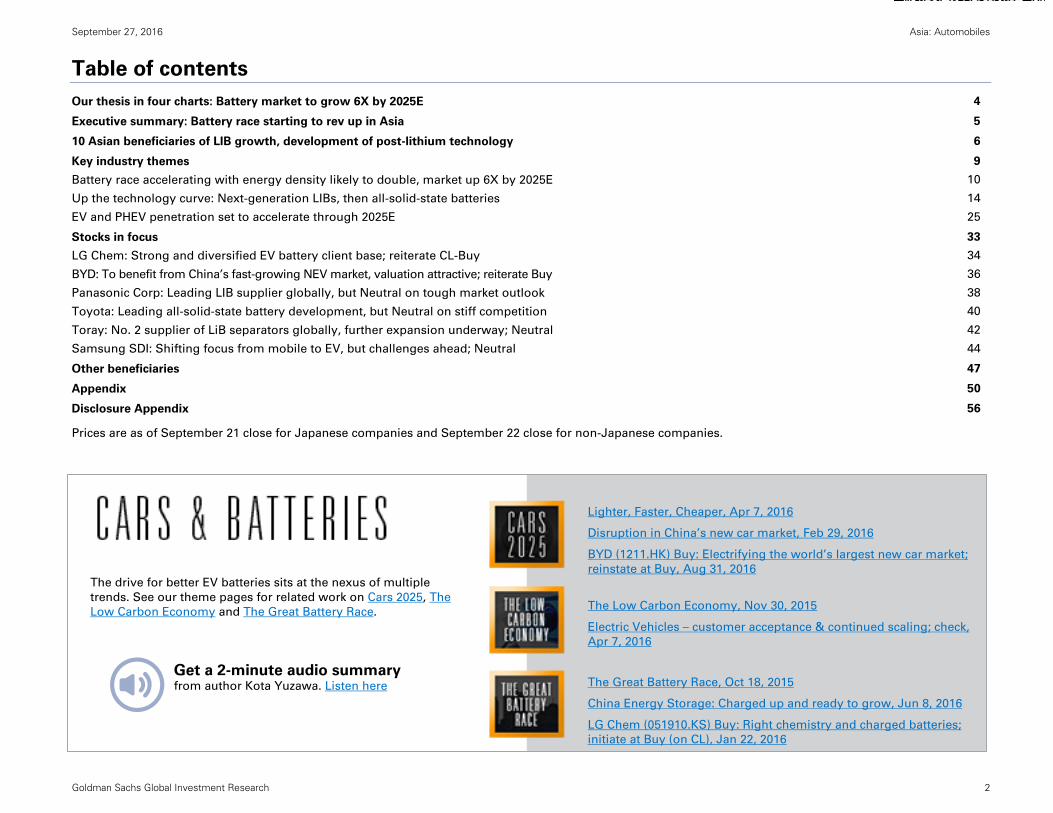
Table of contents Our thesis in four charts: Battery market to grow 6X by 2025E
Executive summary: Battery race starting to rev up in Asia
10 Asian beneficiaries of LIB growth, development of post-lithium technology
Key industry themes
Battery race accelerating with energy density likely to double, market up 6X by 2025E
Up the technology curve: Next-generation LIBs, then all-solid-state batteries
EV and PHEV penetration set to accelerate through 2025E
Stocks in focus
LG Chem: Strong and diversified EV battery client base; reiterate CL-Buy
BYD: To benefit from China’s fast-growing NEV market, valuation attractive; reiterate Buy
Panasonic Corp: Leading LIB supplier globally, but Neutral on tough market outlook
Toyota: Leading all-solid-state battery development, but Neutral on stiff competition
Toray: No. 2 supplier of LiB separators globally, further expansion underway; Neutral
Samsung SDI: Shifting focus from mobile to EV, but challenges ahead; Neutral
Other beneficiaries
Appendix
Disclosure Appendix
Prices are as of September 21 close for Japanese companies and September 22 close for non-Japanese companies. The Future in
numbers
The drive for better EV batteries sits at the nexus of multiple trends. See our theme pages for related work on Cars 2025, The Low Carbon Economy and The Great Battery Race.
Lighter, Faster, Cheaper, Apr 7, 2016
Disruption in China’s new car market, Feb 29, 2016
BYD (1211.HK) Buy: Electrifying the world’s largest new car market; reinstate at Buy, Aug 31, 2016
The Low Carbon Economy, Nov 30, 2015
Electric Vehicles – customer acceptance & continued scaling; check, Apr 7, 2016
The Great Battery Race, Oct 18, 2015
China Energy Storage: Charged up and ready to grow, Jun 8, 2016
LG Chem (051910.KS) Buy: Right chemistry and charged batteries; initiate at Buy (on CL), Jan 22, 2016
Get a 2-minute audio summary from author Kota Yuzawa. Listen here
4
5
6
9
10
14
25
33
34
36
38
40
42
44
47
50
56

September 27, 2016 Asia: Automobiles
Goldman Sachs Global Investment Research 3
Charging The Future in numbersSATISFYING THIRST FOR RANGEBATTERY BOOM ON THE WAY
GREATER DEMAND, GREATER DENSITYCOST TO COME DOWN
THE LARGEST MARKET - CHINAASIA TAKING THE LEAD
Increase in lithium-ion battery (LiB) demand expected between 2015 and 2025, rising from 58 GWh to 387 GWh. Demand for automotive batteries is slated to rise from 15 GWhto 279 GWh during the same period. (p. 12)
6x
2x Increase in energy density expected between 2015 and 2025, from 200 Wh/kg to 550 Wh/kg. (p. 10)
60 kWhBattery capacity needed to achieve a driving distance comparable with that of a gasoline-powered vehicle (around 300 km/200 miles). (p. 11)
US$272 to US$100 per kWhCost for auto batteries from 2015 to 2025E. Improvement in energy density should help drive this decline. (p. 10)
300,000 New Energy Vehicle sales (excluding hybrids) in China (2015). (p. 29)Percentage of global output from Asian battery makers. (p. 6) 50%+
3,000+ Patents for all-solid-state batteries filed in 2002-2011, far higher than other post-LiB technologies. 71% of these applications were filed by Japan, Korea and China. (p. 19)
The All-Solid-State Batteries Future
What is an all-solid-state battery?An orthodox LiB has a separator and liquid electrolyte between the cathode and the anode. An all-solid-state battery, on the other hand, has only a solid electrolyte between the cathode and the anode, and contains no liquid. There is no need for a separator, as the solid electrolyte also takes on that function. These batteries are known as all-solid-state batteries as they contain absolutely no liquid.
Why are all-solid-state batteries needed?All-solid-state batteries have advantages in terms of safety, and they also offer stable performance through a wide range of temperatures, which is why they are being developed for automotive applications. As they eliminate the need for liquid electrolytes and separators, all-solid-state batteries could in theory have much higher energy density. Competition to develop solid electrolytes will be the key.
Is the production method different?A mass production technique for all-solid-state batteries has yet to be established. However, in many cases the production of relatively large-capacity all-solid-state batteries for automotive applications involves a pressurized process, which means that facilities will differ from those used to make conventional LiBs. Solid electrolytes are generally less conductive than liquid electrolytes, but a number of companies, including Toyota, are vying with each other to develop solid electrolytes that have ionic conductivity on a par with, or even exceeding, that of liquid electrolytes.
Negative current collector Positive current collector
Separator
Li+
Li-
Li-
Li-
Li-
Li-
Li+
Li+Li+
Li+
Li+
Anode CathodeLiquid
Negative current collector Positive current collector
Li+
Li-
Li-
Li-
Li-
Li-
Li+
Li+Li+
Li+
Li+
Anode CathodeSolid
Lithium-ion battery All-solid-state battery
Source: Goldman Sachs Global Investment Research.

September 27, 2016 Asia: Automobiles
Goldman Sachs Global Investment Research 4
Our thesis in four charts: Battery market to grow 6X by 2025E
Exhibit 1: Bullish on demand outlook for EVs, PHEVs Outlook for EV/PHEV sales, 2015-2025E CAGR
Exhibit 2: Forecast rapid increase in energy density, battery costs halving Outlook for energy density, battery costs
Note: Excluding low speed EV in China.
Source: IHS, Goldman Sachs Global Investment Research.
Source: Goldman Sachs Global Investment Research.
Exhibit 3: At battery cost of US$100 per kWh, EVs could represent cheapest
solution for reducing CO2 Additional cost to reduce CO2 by 1g
Exhibit 4: We project six-fold growth in automotive battery market LIB market outlook, by application
Source: Goldman Sachs Global Investment Research.
Source: Goldman Sachs Global Investment Research.
(Thous.) 2015 2020E 2025E CAGR
PHEV 397 1,272 2,787 22%
China 60 518 1,339 36%
Non-China 337 753 1,448 16%
EV 251 1,322 4,014 32%
China 140 864 1,890 30%
Non-China 111 458 2,123 34%
PHEV+EV 648 2,594 6,801 27%
Global auto demand 88,384 101,730 111,494 2%
683
272
197
100150
200
300
500
0
100
200
300
400
500
600
700
0
100
200
300
400
500
600
700
Cost(USD/Wh, RHS)
Energy density(Wh/kg, LHS)
Current LIB
Next generation LIB
Post LIB(All-solid-state battery)
Needtechnologicalbreakthrough
Li-ion battery All-solid-state battery
2010 2015 2020E 2025-2030E
10 9 7 215 1517
9 113
86
302710 17
4
279
49
0
50
100
150
200
250
300
Mobile phone PC Tablet Machine tool Automotive Others
2015 2020 2025
(GWh)
2015$ 4bn
2025$ 24bn
Automotivebattery market (USD)

September 27, 2016 Asia: Automobiles
Goldman Sachs Global Investment Research 5
Executive summary: Battery race starting to rev up in Asia
PHEV, EV penetration set to pick up pace; EVs key to CO2 reduction Almost two decades have passed since Toyota launched the world’s first mass-produced hybrid vehicle (HV) in 1997. By 2015, the
hybrid vehicle market had grown to 2 mn units, making an enormous contribution to CO2 reduction. Over the coming 10 years, we
think electric vehicles (EVs) and plug-in hybrid vehicles (PHEVs) will demonstrate remarkable growth. In recent years, environmental
regulations have been strengthened and tightened, forcing automakers to review their powertrain strategies. In addition, we see
significant support for EV growth from stepped-up new energy vehicle (NEV) subsidies in China. Moreover, advances in lithium-ion
battery (LIB) technology (huge leaps in energy density) could result in an increase in battery capacity per vehicle. We see the EV
market expanding from 250,000 units in 2015 to 4.01 mn units in 2025 (CAGR of 30%) and look for PHEV sales to rise from 400,000
units to 2.78 mn units (CAGR of 36%). Over the same period, we expect the HV market to grow from 2.16 mn units to 13.94 mn units
(CAGR of 20%).
The lower the cost for batteries, the more sense it will make to adopt an EV-based business model. We calculate that in PHEVs, the
additional cost to lower CO2 by 1 gram is US$139. Based on a battery cost of US$272 per kWh in 2015, we calculate that in EVs, the
additional cost to lower CO2 by 1 gram would be US$124, similar to that for PHEVs. That cost would shrink to US$31, though, in the
case of a battery cost as low as US$100 per kWh. This would make EVs an inexpensive solution for reducing CO2 emissions, on a
par with vehicle light weighting and downsizing turbo engines. From the automakers’ perspective, we see grounds to continue
investing heavily in EVs through 2030.
Turning point ahead for batteries; six-fold growth in automotive battery market by 2025E We look for the automotive battery market to expand considerably, in tandem with growth in the EV and PHEV markets. We expect a
roughly six-fold increase in LIB demand between 2015 and 2025, from 58 GWh to 387 GWh, with demand for automotive batteries
rising from 15 GWh to 279 GWh over the same period. Thus far, mobile phones and PCs have been the main source of demand for
LIBs, but over the next decade we think rapid growth in automotive applications will bring battery operations to a major turning
point. Even allowing for an average annual decrease of about 5% in battery prices—to encourage greater uptake—we think the
market for automotive LIBs could grow sharply in size between 2015 and 2025, from US$4 bn to a massive US$24 bn. For further
details on LIB demand, see our October 18, 2015 report Global: Clean Energy: The Great Battery Race.
Rapid improvement in energy density; focus on all-solid-state batteries The history of automotive LIBs is one of unstinting efforts to improve energy density (gravimetric or volumetric). In 2007–08, Nissan
announced plans for large-scale investment in pouch-type batteries with manganese spinel as the cathode material, going on to
launch the Leaf EV. At the time, we estimate that gravimetric energy density was 100-150 Wh/kg, but by 2015, batteries with ternary
cathode materials were achieving gravimetric energy density of over 200 Wh/kg. Looking ahead, further technical advances will
likely lift this figure to 300 Wh/kg by 2020, and over 500 Wh/kg in 2025 and beyond. Similarly, the aim is to boost volumetric energy
density from 500 Wh/l in 2015 to 700 Wh/l in 2020 and 1,100 Wh/l in 2025 and beyond. We note this will likely require a transition to
so-called “post-lithium ion” technology. Among the many next-generation battery technologies, we focus on all-solid-state batteries.

September 27, 2016 Asia: Automobiles
Goldman Sachs Global Investment Research 6
10 Asian beneficiaries of LIB growth, development of post-lithium technology
While innovation in battery technologies is proceeding at a rapid pace worldwide, battery development is booming in Asia in
particular. Asian battery makers currently have around 50 GWh of production capacity, equivalent to 50% or more of global output
(consumer electronics/automotive battery capacity combined), and have monopolistic shares of 50%-80% of core component
materials, such as cathode materials and separators. Asian producers have also taken the lead in the development of next-
generation batteries. Japan accounted for 53% of patent applications filed in 2002-2011, followed by the US at 13%, Europe at 12%,
Korea at 10% and China at 8%. We reiterate our Buy ratings on LG Chem (CL) and BYD on the back of rapid LIB business expansion.
We remain Neutral on Toyota over short-term US auto market slowdown concerns, but highly value its long term strategy to focus
on all-solid-state batteries. We also spotlight seven other battery and related product makers from among the many Asian names in
this space.
• LG Chem (battery manufacturer, Korea, CL-Buy): A major battery manufacturer with total production capacity of 13 GWh
(our estimate, consumer electronics/automotive battery capacity combined), for a 13% share of the global market. It has well-
established automotive battery supply agreements with Hyundai, General Motors, Ford, and other major automakers. LG Chem
also has an edge in terms of technological development, having successfully developed ternary (nickel, cobalt, manganese
composite) batteries with energy density of more than 200 Wh/kg.
• BYD (automaker, China, Buy): Sales have been growing rapidly on the back of China’s NEV policies. BYD currently mass
produces batteries using lithium ferrophosphate as a cathode material, but also plans to develop batteries with improved
energy density, mainly through the use of ternary (nickel, cobalt, manganese composite) technologies. We see advantages in
terms of cost competitiveness for automakers producing batteries in-house under a vertically integrated business model.
• Toyota (automaker, Japan, Neutral): Toyota is the world’s largest producer of nickel-metal hydride batteries for hybrid
vehicles, but has made no major investments in LIBs. We believe the company considers all-solid-state batteries essential to
growth in EV uptake. We see appeal in Toyota’s accumulating expertise in the field of all-solid-state batteries, including the
development of (solid) electrolytes with high ionic conductivity, but think any real-world applications are unlikely to become a
reality before 2020.
• Panasonic (battery manufacturer, Japan, Neutral): A major battery manufacturer with total production capacity of 10 GWh
(our estimate, consumer electronics/automotive battery capacity combined), for a 10% share of the global market. Sales of
automotive batteries in FY3/16 stood at around ¥150 bn, but we expect this figure to rise sharply to ¥350 bn by FY3/19.
Panasonic is also responsible for supplying nickel cobalt aluminum batteries to Tesla, and has decided to invest around ¥150-
¥200 bn in the US automaker’s Gigafactory project.
• Toray Industries (separator maker, Japan, Neutral): A hybrid chemical maker that makes wet separators, with a 20% market
share in separators, second to Asahi Kasei, which has a 45% share (including its Celgard acquisition). Despite the fact that the
separator business accounts for only 1.2% of sales, the company is planning aggressive capacity additions in coming years.
• Samsung SDI (battery manufacturer, Korea, Neutral): SDI has built a solid track record with increasing market shares in
consumer/mobile battery business. However, we do not expect SDI’s success in mobile battery will directly translate into EV
battery industry given diverging industry dynamics and customer base. We foresee three major challenges for SDI’s EV battery
business including limited customer base, slower cost reduction, and regulation risks in China.

September 27, 2016 Asia: Automobiles
Goldman Sachs Global Investment Research 7
• Asahi Kasei (separator maker, Japan, Not Covered): The only maker of both dry and wet separators, the company has a
dominant, 45% separator market share (Asahi Kasei acquired rival Celgard, which makes dry separators, in 2015). The
separator business accounts for 6% of sales. According to Asahi Kasei, the business is expected to make ¥2.5 bn in operating
losses in 2016 due to goodwill amortization from the Celgard acquisition.
• Tanaka Chemical (cathode materials maker, Japan, Not Covered): A pure play that mainly makes positive electrode
precursors. On August 31, 2016, Tanaka Chemical announced plans to raise capital by issuing new shares via a private
placement to Sumitomo Chemical. This would take Sumitomo Chemical’s stake in Tanaka Chemical to 50.1%. The two have
been collaborating already on development of next-generation nickel-cobalt-manganese (NCM) cathode materials with a nickel
weighting as high as 90%, which should contribute to further increasing batteries’ energy density.
• W-Scope (separator maker, Japan, Not Covered): A wet separator pure play, with a 5% separator market share. It currently
has a 65% consumer electronics separator weighting and a 35% automotive separator weighting, but is targeting market share
growth in automotive separators with the shift from wet to dry separators. Its head offices are in Japan, and it is listed in Japan,
but all of its production bases are in Korea.
• Hitachi Zosen (all-solid-state battery maker, Japan, Not Covered): A machinery maker engaged in the ship engine and
environmental plant businesses that is devoting energy to the development of all-solid-state batteries that make use of
machine stamping technology. With all-solid-state batteries, the process of applying pressure is important in order to boost
electrolyte and positive/negative electrode conductivity, and Hitachi Zosen’s press technology is used for this. The company
has already succeeded in 200 Wh/kg aluminum laminate trial production.
September 27, 2016 Asia: Automobiles
Goldman Sachs Global Investment Research 8
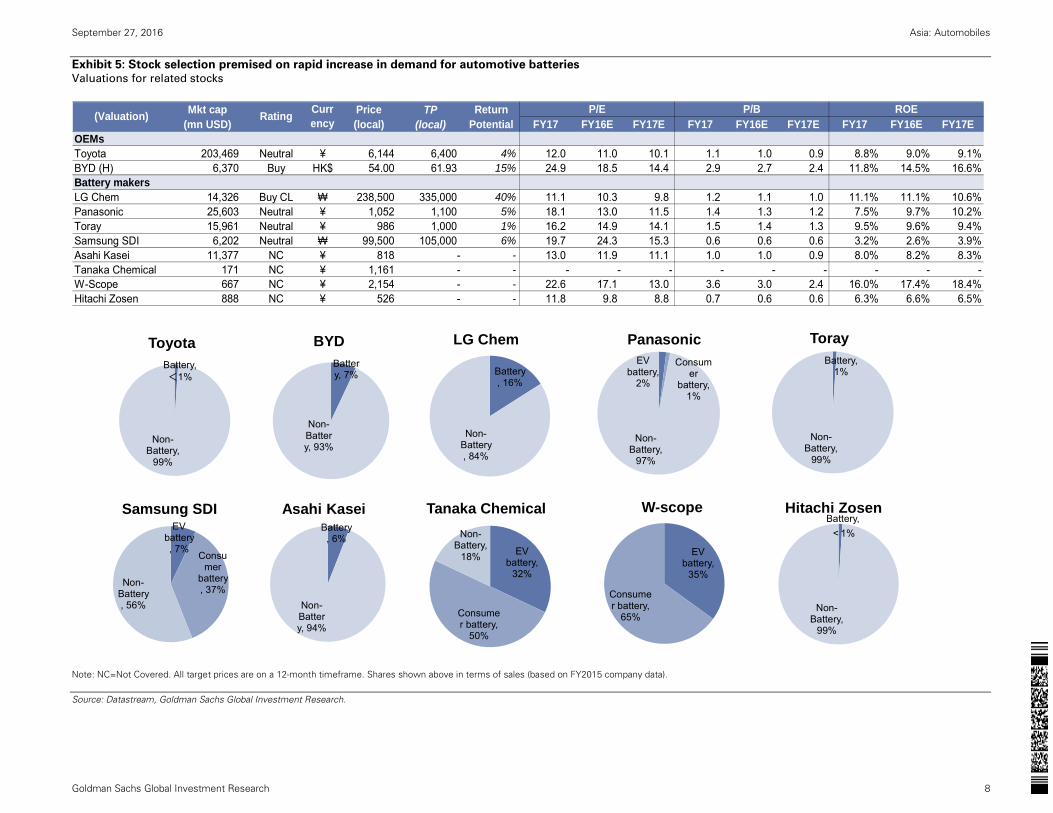
Exhibit 5: Stock selection premised on rapid increase in demand for automotive batteries Valuations for related stocks
Note: NC=Not Covered. All target prices are on a 12-month timeframe. Shares shown above in terms of sales (based on FY2015 company data).
Source: Datastream, Goldman Sachs Global Investment Research.
Mkt cap Price TP Return(mn USD) (local) (local) Potential FY17 FY16E FY17E FY17 FY16E FY17E FY17 FY16E FY17E
OEMsToyota 203,469 Neutral ¥ 6,144 6,400 4% 12.0 11.0 10.1 1.1 1.0 0.9 8.8% 9.0% 9.1%BYD (H) 6,370 Buy HK$ 54.00 61.93 15% 24.9 18.5 14.4 2.9 2.7 2.4 11.8% 14.5% 16.6%Battery makersLG Chem 14,326 Buy CL ₩ 238,500 335,000 40% 11.1 10.3 9.8 1.2 1.1 1.0 11.1% 11.1% 10.6%Panasonic 25,603 Neutral ¥ 1,052 1,100 5% 18.1 13.0 11.5 1.4 1.3 1.2 7.5% 9.7% 10.2%Toray 15,961 Neutral ¥ 986 1,000 1% 16.2 14.9 14.1 1.5 1.4 1.3 9.5% 9.6% 9.4%Samsung SDI 6,202 Neutral ₩ 99,500 105,000 6% 19.7 24.3 15.3 0.6 0.6 0.6 3.2% 2.6% 3.9%Asahi Kasei 11,377 NC ¥ 818 - - 13.0 11.9 11.1 1.0 1.0 0.9 8.0% 8.2% 8.3%Tanaka Chemical 171 NC ¥ 1,161 - - - - - - - - - - -W-Scope 667 NC ¥ 2,154 - - 22.6 17.1 13.0 3.6 3.0 2.4 16.0% 17.4% 18.4%Hitachi Zosen 888 NC ¥ 526 - - 11.8 9.8 8.8 0.7 0.6 0.6 6.3% 6.6% 6.5%
(Valuation) ROERating P/E P/BCurrency
EV battery, 7%
Consumer
battery, 37%
Non-Battery, 56%
Samsung SDI
EV battery,
2%
Consumer
battery, 1%
Non-Battery,
97%
PanasonicBattery, <1%
Non-Battery,
99%
ToyotaBattery,
1%
Non-Battery,
99%
Toray
Battery, 16%
Non-Battery, 84%
LG ChemBattery, 7%
Non-Battery, 93%
BYD
EV battery,
32%
Consumer battery,
50%
Non-Battery,
18%
Tanaka ChemicalBattery, 6%
Non-Battery, 94%
Asahi Kasei
EV battery,
35%
Consumer battery,
65%
W-scopeBattery, <1%
Non-Battery,
99%
Hitachi Zosen
September 27, 2016 Asia: Automobiles
Goldman Sachs Global Investment Research 9
Key industry themes
Key industry themes

September 27, 2016 Asia: Automobiles
Goldman Sachs Global Investment Research 10
Battery race accelerating with energy density likely to double, market up 6X by 2025E
Battery history one of tackling energy density
The history of automotive LIBs is one of unstinting efforts to improve energy density (by gravimetric or volumetric). In 2007–08,
Nissan announced plans for large-scale investment in pouch-type batteries with manganese spinel as the cathode material, going
on to launch the Leaf EV. At the time, we estimate that gravimetric energy density was 100-150 Wh/kg, but by 2015, batteries with
ternary cathode materials were achieving gravimetric energy density of over 200 Wh/kg. Looking ahead, further technical advances
likely will lift this figure to 300 Wh/kg by 2020, and over 500 Wh/kg in 2025 and beyond. Similarly, the aim is to boost volumetric
energy density from 500 Wh/l in 2015 to 700 Wh/l in 2020 and 1,100 Wh/l in 2025 and beyond.
Improvement in energy density to reduce battery cost
Improving energy density on per unit gravimetric /volumetric basis is expected to contribute significantly to the reduction in battery
costs. We estimate the cost of automotive batteries was around US$272 per kWh in 2015, and we forecast it will decline to US$197
per kWh by 2020 and US$100 per kWh by 2025. This is because the improvement in energy density should not only reduce materials
costs but also increase economies of scale through greater automotive battery penetration. We note, though, that achieving a
twofold increase in gravimetric/volumetric energy density by 2025 likely will require a transition to so-called “post-lithium ion”
technology. Among the many next-generation battery technologies, we focus in particular on all-solid-state batteries.
Exhibit 6: Energy density likely to take off over the next 10 years Energy efficiency per unit weight and volume forecasts
Exhibit 7: Battery costs could halve kWh cost forecasts (US$)
Source: Company data, Goldman Sachs Global Investment Research.
Source: Company data, Goldman Sachs Global Investment Research.
500
800
1,100
200
350
550
0
200
400
600
800
1,000
1,200
2010 2015 2020E 2025E 2030-E
Current Wh/L
Future(All solid) Wh/L
Current Wh/kg
Future(All solid) Wh/kg
LiB All Solid Battery etc.
683
272
197
100
0
100
200
300
400
500
600
700
2010 2015 2020E 2025E 2030-E
Current LiB
Future LiB
Post-LiB
LiB All Solid Battery etc.
September 27, 2016 Asia: Automobiles
Goldman Sachs Global Investment Research 11
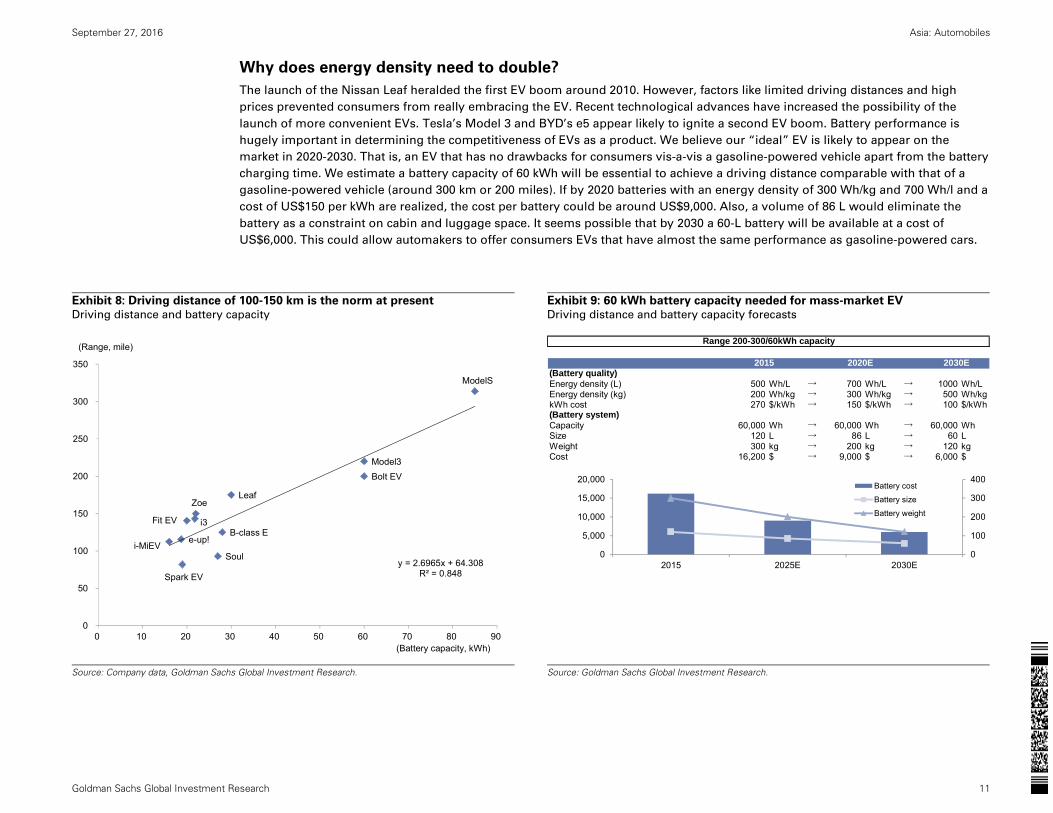
Why does energy density need to double?
The launch of the Nissan Leaf heralded the first EV boom around 2010. However, factors like limited driving distances and high
prices prevented consumers from really embracing the EV. Recent technological advances have increased the possibility of the
launch of more convenient EVs. Tesla’s Model 3 and BYD’s e5 appear likely to ignite a second EV boom. Battery performance is
hugely important in determining the competitiveness of EVs as a product. We believe our “ideal” EV is likely to appear on the
market in 2020-2030. That is, an EV that has no drawbacks for consumers vis-a-vis a gasoline-powered vehicle apart from the battery
charging time. We estimate a battery capacity of 60 kWh will be essential to achieve a driving distance comparable with that of a
gasoline-powered vehicle (around 300 km or 200 miles). If by 2020 batteries with an energy density of 300 Wh/kg and 700 Wh/l and a
cost of US$150 per kWh are realized, the cost per battery could be around US$9,000. Also, a volume of 86 L would eliminate the
battery as a constraint on cabin and luggage space. It seems possible that by 2030 a 60-L battery will be available at a cost of
US$6,000. This could allow automakers to offer consumers EVs that have almost the same performance as gasoline-powered cars.
Exhibit 8: Driving distance of 100-150 km is the norm at present
Driving distance and battery capacity
Exhibit 9: 60 kWh battery capacity needed for mass-market EV
Driving distance and battery capacity forecasts
Source: Company data, Goldman Sachs Global Investment Research.
Source: Goldman Sachs Global Investment Research.
ModelS
Model3
Leaf
i-MiEV
Zoe
Spark EV
e-up!
i3
Soul
Fit EVB-class E
Bolt EV
y = 2.6965x + 64.308R² = 0.848
0
50
100
150
200
250
300
350
0 10 20 30 40 50 60 70 80 90
(Range, mile)
(Battery capacity, kWh)
(Battery quality) Energy density (L) 500 Wh/L → 700 Wh/L → 1000 Wh/LEnergy density (kg) 200 Wh/kg → 300 Wh/kg → 500 Wh/kgkWh cost 270 $/kWh → 150 $/kWh → 100 $/kWh(Battery system)Capacity 60,000 Wh → 60,000 Wh → 60,000 WhSize 120 L → 86 L → 60 LWeight 300 kg → 200 kg → 120 kg Cost 16,200 $ → 9,000 $ → 6,000 $
Range 200-300/60kWh capacity
2020E2015 2030E
0
100
200
300
400
0
5,000
10,000
15,000
20,000
2015 2025E 2030E
Battery cost
Battery size
Battery weight
September 27, 2016 Asia: Automobiles
Goldman Sachs Global Investment Research 12
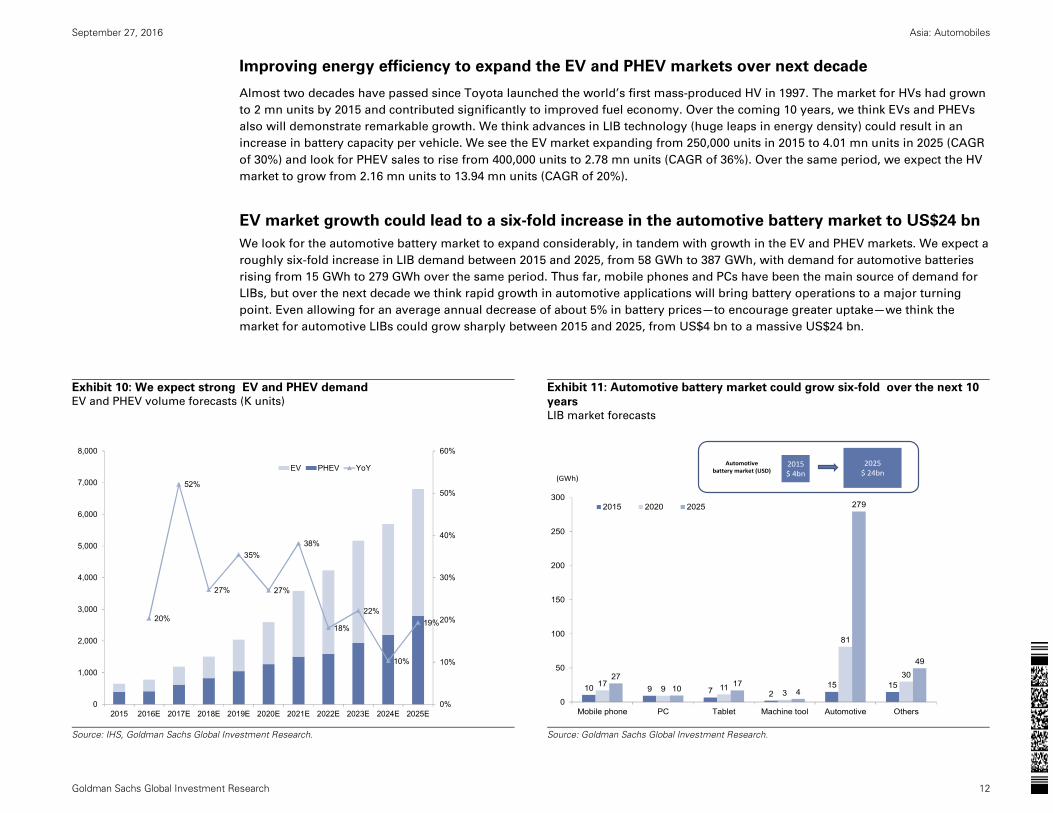
Improving energy efficiency to expand the EV and PHEV markets over next decade
Almost two decades have passed since Toyota launched the world’s first mass-produced HV in 1997. The market for HVs had grown
to 2 mn units by 2015 and contributed significantly to improved fuel economy. Over the coming 10 years, we think EVs and PHEVs
also will demonstrate remarkable growth. We think advances in LIB technology (huge leaps in energy density) could result in an
increase in battery capacity per vehicle. We see the EV market expanding from 250,000 units in 2015 to 4.01 mn units in 2025 (CAGR
of 30%) and look for PHEV sales to rise from 400,000 units to 2.78 mn units (CAGR of 36%). Over the same period, we expect the HV
market to grow from 2.16 mn units to 13.94 mn units (CAGR of 20%).
EV market growth could lead to a six-fold increase in the automotive battery market to US$24 bn
We look for the automotive battery market to expand considerably, in tandem with growth in the EV and PHEV markets. We expect a
roughly six-fold increase in LIB demand between 2015 and 2025, from 58 GWh to 387 GWh, with demand for automotive batteries
rising from 15 GWh to 279 GWh over the same period. Thus far, mobile phones and PCs have been the main source of demand for
LIBs, but over the next decade we think rapid growth in automotive applications will bring battery operations to a major turning
point. Even allowing for an average annual decrease of about 5% in battery prices—to encourage greater uptake—we think the
market for automotive LIBs could grow sharply between 2015 and 2025, from US$4 bn to a massive US$24 bn.
Exhibit 10: We expect strong EV and PHEV demand EV and PHEV volume forecasts (K units)
Exhibit 11: Automotive battery market could grow six-fold over the next 10
years LIB market forecasts
Source: IHS, Goldman Sachs Global Investment Research.
Source: Goldman Sachs Global Investment Research.
20%
52%
27%
35%
27%
38%
18%
22%
10%
19%
0%
10%
20%
30%
40%
50%
60%
0
1,000
2,000
3,000
4,000
5,000
6,000
7,000
8,000
2015 2016E 2017E 2018E 2019E 2020E 2021E 2022E 2023E 2024E 2025E
EV PHEV YoY
10 9 7 215 1517 9 11
3
81
302710 17
4
279
49
0
50
100
150
200
250
300
Mobile phone PC Tablet Machine tool Automotive Others
2015 2020 2025
(GWh)
2015$ 4bn
2025$ 24bn
Automotivebattery market (USD)
September 27, 2016 Asia: Automobiles
Goldman Sachs Global Investment Research 13
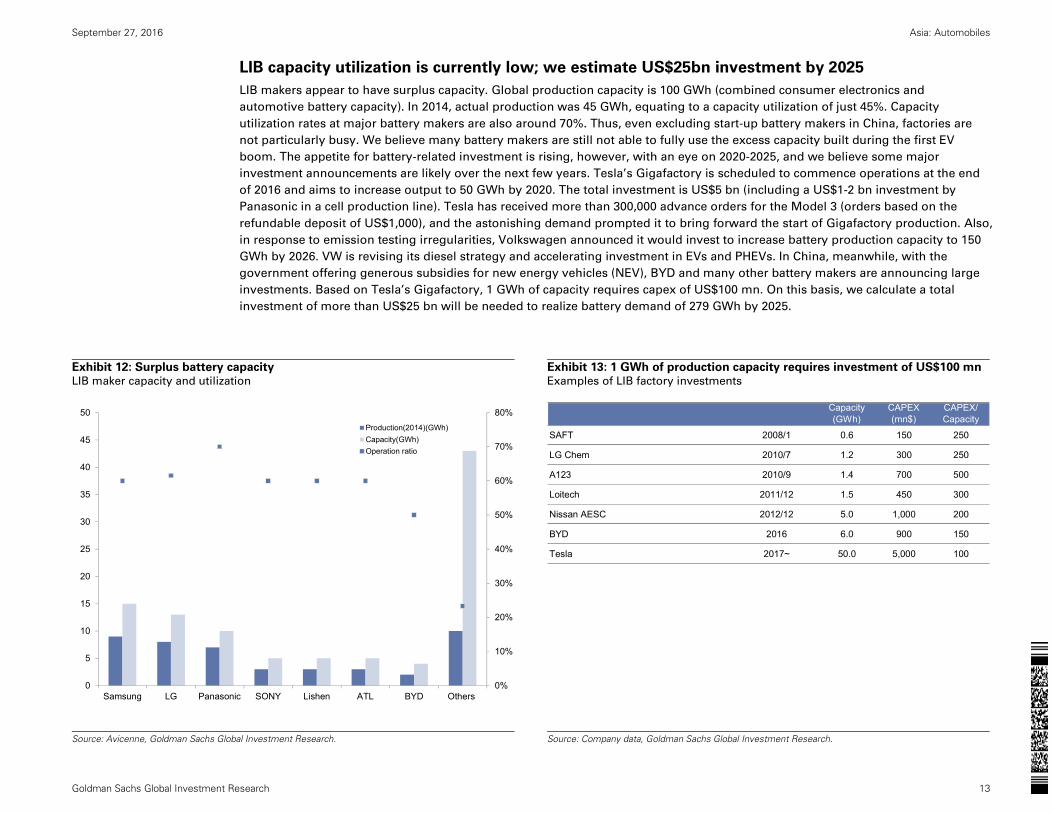
LIB capacity utilization is currently low; we estimate US$25bn investment by 2025
LIB makers appear to have surplus capacity. Global production capacity is 100 GWh (combined consumer electronics and
automotive battery capacity). In 2014, actual production was 45 GWh, equating to a capacity utilization of just 45%. Capacity
utilization rates at major battery makers are also around 70%. Thus, even excluding start-up battery makers in China, factories are
not particularly busy. We believe many battery makers are still not able to fully use the excess capacity built during the first EV
boom. The appetite for battery-related investment is rising, however, with an eye on 2020-2025, and we believe some major
investment announcements are likely over the next few years. Tesla’s Gigafactory is scheduled to commence operations at the end
of 2016 and aims to increase output to 50 GWh by 2020. The total investment is US$5 bn (including a US$1-2 bn investment by
Panasonic in a cell production line). Tesla has received more than 300,000 advance orders for the Model 3 (orders based on the
refundable deposit of US$1,000), and the astonishing demand prompted it to bring forward the start of Gigafactory production. Also,
in response to emission testing irregularities, Volkswagen announced it would invest to increase battery production capacity to 150
GWh by 2026. VW is revising its diesel strategy and accelerating investment in EVs and PHEVs. In China, meanwhile, with the
government offering generous subsidies for new energy vehicles (NEV), BYD and many other battery makers are announcing large
investments. Based on Tesla’s Gigafactory, 1 GWh of capacity requires capex of US$100 mn. On this basis, we calculate a total
investment of more than US$25 bn will be needed to realize battery demand of 279 GWh by 2025.
Exhibit 12: Surplus battery capacity LIB maker capacity and utilization
Exhibit 13: 1 GWh of production capacity requires investment of US$100 mn Examples of LIB factory investments
Source: Avicenne, Goldman Sachs Global Investment Research.
Source: Company data, Goldman Sachs Global Investment Research.
0%
10%
20%
30%
40%
50%
60%
70%
80%
0
5
10
15
20
25
30
35
40
45
50
Samsung LG Panasonic SONY Lishen ATL BYD Others
Production(2014)(GWh)Capacity(GWh)Operation ratio
Capacity(GWh)
CAPEX(mn$)
CAPEX/Capacity
SAFT 2008/1 0.6 150 250
LG Chem 2010/7 1.2 300 250
A123 2010/9 1.4 700 500
Loitech 2011/12 1.5 450 300
Nissan AESC 2012/12 5.0 1,000 200
BYD 2016 6.0 900 150
Tesla 2017~ 50.0 5,000 100

September 27, 2016 Asia: Automobiles
Goldman Sachs Global Investment Research 14
Up the technology curve: Next-generation LIBs, then all-solid-state batteries
Innovation for next-generation LIBs
Gravimetric energy density was just 30-50 Wh/kg when lead-acid batteries debuted in 1859, but this increased to 90-100 Wh/kg with
nickel-hydride batteries in 1990, and LIBs developed in 1991 achieved 200-250 Wh/kg while trying a variety of different materials.
Main LIB components include (1) cathode materials, (2) anode materials, (3) separators, and (4) liquid electrolytes. However, we
expect cathode materials and separators to change significantly in automotive batteries by 2020. Ternary materials (NCM) are
already the mainstream for cathode materials, but we expect the nickel ratio to rise to 80-90% from the current 30%. We also think
separators will change from dry-type separators to the wet-type separators widely used in consumer products. Each step is a
technological innovation to achieve even higher energy density.
Transition to post-LIB from 2020; all-solid-state in focus
We believe transition to post-LIBs could start from 2020 because the theoretical limits of LIBs are coming into view. We provide
further details later in this report, but think all-solid-state batteries are promising candidates for automotive batteries. All-solid-state
batteries replace liquid electrolytes with solid electrolytes to substantially increase energy density and make it easier to enhance
heat resistance and ensure safety. These batteries have properties that Toyota and other automakers regard as well-suited for
automotive batteries.
Battery and component makers also face changes
Nissan’s potential sale of its battery subsidiary Automotive Energy Supply Corporation (AESC; Nissan owns 51%, NEC owns 49%),
reported by the Nikkei on August 5, underscores the difficulty in establishing a business strategy in battery development amid rapid
technological innovation. Over the past 10-15 years, the positive electrode materials used in automobiles have evolved from iron
phosphate (mainly preferred by Chinese automakers) to manganese (used by Nissan), nickel acid (mainly Tesla), and ternary
materials (the current mainstream). With ternary materials set to become more nickel rich over 2017-18, we expect a further rise in
energy density. The accuracy of the Nikkei report is unknown, but we believe the competitiveness of the manganese materials that
Nissan has opted is gradually starting to wane. Both battery makers and component makers are struggling with the trends and pace
of technological innovation.

September 27, 2016 Asia: Automobiles
Goldman Sachs Global Investment Research 15
Exhibit 14: Major changes in battery materials Technological trends for the main four components of LIBs
Source: Goldman Sachs Global Investment Research.
Exhibit 15: Many components and materials makers are Japanese and Korean at present
Market shares for four main components and materials makers (2014)
Source: Company data, Goldman Sachs Global Investment Research.
2010s 2015-2020 2025 -
Cathode
$2.5bn
Anode
0.8bn
Separator
1.15bn
Electrolyte
0.68bn
LFP, LMO, NCA NCM(Nickel rich) LiCO
Graphite Graphite/Si Graphite/LTO
Dry Wet None
EC(Ethylene Carbonate) EC/PC (Propylenecarbonate) LGPS - Solid
Cathode Anode Separator Electrolyte
Nichia, 20%
L&F Material, 15%
Umicore, 15%
Toda Industrial, 10%
Nippon Chem,
5%
Tanaka Chem,
5%
Mitsubishi Chem,
5%
Nippon Denko,
3%Others,
22%Hitachi Chem, 30%
BTR, 20%
Mitsubishi
Chem, 15%
JFE Chem, 10%
Tokai Carbon,
10%
Nippon Carbon,
5%
Showa Denko,
5%
Kureha, 3%
Others, 2%
Asahi Kasei, 30%
Toray, 20%Celgard
, 15%
SK Innovation, 10%
Ube Industries, 5%
Sumitomo
Chem, 5%
Mitsubishi
Chem, 5%
Teijin, 3%
Others, 7%
Ube Industries, 20%
Mitsubishi
Chem, 20%
Panax, 15%
Chell Industries, 15%
LG Chem, 10%
Fuji Chem, 10%
Central Glass,
8%
Others, 2%

September 27, 2016 Asia: Automobiles
Goldman Sachs Global Investment Research 16
Rapid technological changes for cathode materials, cause for reluctance in large investments
Companies are competing hard to develop cathode materials in particular because these contribute directly to raising energy
density. The competitive environment is severe, and some industry reorganization has taken place during the past year, including
Toda Kogyo selling its entire cathode material business and Sumitomo Chemical increasing investment in Tanaka Chemical. For
automotive applications, LFP (iron phosphate) is the safest and lowest priced, and is being increasingly used by Chinese makers.
Despite the drawback of low energy density, we expect localized penetration to increase its presence to 15% in 2025, from 10% in
2014. LMO (manganese-based) is not well-suited for high energy density in automotive applications, as indicated by the reported
sale of AESC. We expect its presence to decrease to 9% in 2025, from 20% in 2014. Consequently, we expect NCA (nickel acid
lithium) material (used by Tesla) to expand with the Gigafactory startup, rising in presence to 14% in 2025, from 9% in 2014. We
expect NCM (ternary) to achieve high growth on a shift to nickel-rich material. However, we expect NCM adoption to gather pace in
the Chinese market amid efforts to increase energy density, resulting in a faster shift in demand to NCM from LFP.
Exhibit 16: NCA and NCM are main cathode materials, but LFP rising in China
Cathode material mix
Exhibit 17: Cathode makers have specialty areas
Cathode material market shares by manufacturer
Source: Avicenne, Goldman Sachs Global Investment Research.
Source: Avicenne, Goldman Sachs Global Investment Research.
36%26%
25%36%
9%14%
20% 9%
10%15%
0%
10%
20%
30%
40%
50%
60%
70%
80%
90%
100%
2014 2025E
LFPLMONCANCMLCO
LCO:Lithium cobalt oxide. Mainlyfor consumer electronic components.
LFP: Using phosphoric acid iron. Low energy density. Adopted by Chinese battery makers and we expect high volume growth.
LMO: Using manganese. Low energy density and expecting low volume growth.
NCA: Using Lithum nickelate. Adopted by Tesla and Panasonic in their 18,650 type battery.
NCM: Ternary system battery (cobalt, nickel, manganese). Aiming to improve energy density by increasing nickel composition from current 30% to 80-90% in the future.
CY2014 LCO CY2014 LMONichia 13% JGC 16%Umicore 17% Chinese local 26%B&M 7% Nippon Denko 8%Easpring 6% ShanShan 9%Reshine 11% Reshine 8%L&F 16% Nichia 7%Other China 14% Others 26%Others 16% CY2014 LFPCY2014 NCM Internal 29%Nichia 15% Cleriant 8%Umicore 31% Aleees 10%L&F 8% STL 11%ShanShan 11% Pulead 13%Reshine 4% Zhuoneng 6%Other China 8% BTR 2%Others 23% Others 21%CY2014 NCASumitomo Metal Mining 57%Toda 14%Nihon Kagaku Sangyo 13%Ecopro 5%Others 11%

September 27, 2016 Asia: Automobiles
Goldman Sachs Global Investment Research 17
Innovations in separators
Battery separators create a barrier between the positive (anode) and negative (cathode) electrodes to prevent electrical short-circuits
between internal battery components. While ionic conductivity is essential, separators also require a porous structure with
exceptional mechanical strength. A particularly important role of the separator is the so-called shutdown function. This function will
close (fill in) the pores on multilayer separators to prevent ionic transfer if the battery temperature rises abnormally for any reason
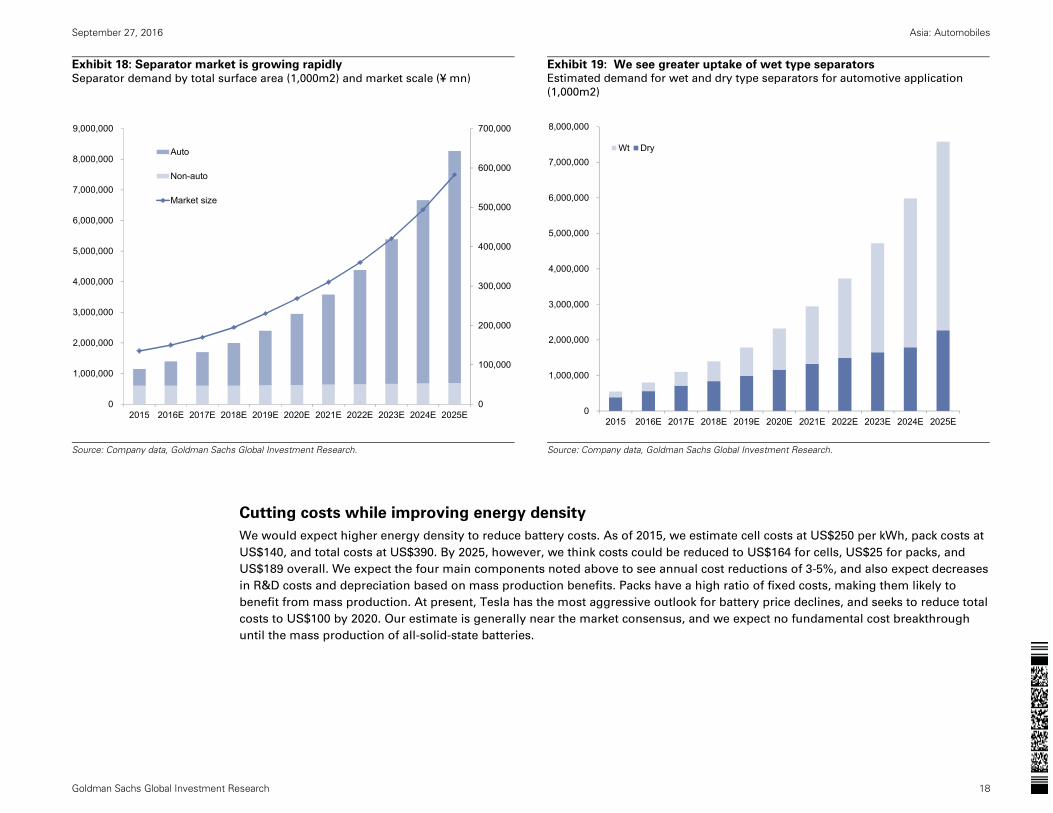
(overheats). We estimate that the automotive separator market was worth around US$600 mn in 2015 and totaled 0.5 bn m2 on a
surface-area basis. Separator usage is typically around 15-30 m2 per kWh, so as auto batteries rapidly increase to 279 GWh in 2025E
from 15 GWh in 2015, we expect the separator market to rapidly grow to 7 bn m2. Over the longer term, however, there is risk of the
market shrinking as separators would become unnecessary if all solid-state batteries emerge as the successor to lithium ion
batteries. Among major battery makers, Asahi Kasei has a global separator share of 30%, Celgard 15%, Toray Industries 20%, and
Sumitomo Chemical 5%.
Wet type separators may become a mainstream for auto
Separators come in two types: wet separators and dry separators. Wet separators have become the most widely used type in
consumer electronics applications, but dry separators remain the mainstream in automotive applications. Wet separators have the
advantage of being stronger than dry separators, which means they can be thinner. The main obstacle to the broader adoption of
EVs and PHEVs is range, and increasing the energy density of batteries has become a pressing issue. Dry separators generally
comprise three layers of polypropylene/polyethylene, but wet separators can be made using a single layer, which in theory means
thickness of just 6-7 microns is possible (compared with 16 microns for a dry separator). The disadvantages of wet separators are a
more expensive manufacturing process and greater difficulty in ensuring safety. Wet separator manufacturing production costs are
structurally higher because additional facilities are needed due to the use of solvents. That said, the price differential versus dry
separators has now shrunk to around 10%-20%, thanks to the increasing size of production lines and volume efficiencies. On the
safety front, there are issues associated with the use of high-nickel cathode materials. However, technology has now been
developed to increase heat resistance by adding a special ceramic coating to wet separators, and we expect to see an increase in the
number of manufacturers using wet separators for automotive applications.
September 27, 2016 Asia: Automobiles
Goldman Sachs Global Investment Research 18
Exhibit 18: Separator market is growing rapidly Separator demand by total surface area (1,000m2) and market scale (¥ mn)
Exhibit 19: We see greater uptake of wet type separators Estimated demand for wet and dry type separators for automotive application
(1,000m2)
Source: Company data, Goldman Sachs Global Investment Research.
Source: Company data, Goldman Sachs Global Investment Research.
Cutting costs while improving energy density
We would expect higher energy density to reduce battery costs. As of 2015, we estimate cell costs at US$250 per kWh, pack costs at
US$140, and total costs at US$390. By 2025, however, we think costs could be reduced to US$164 for cells, US$25 for packs, and
US$189 overall. We expect the four main components noted above to see annual cost reductions of 3-5%, and also expect decreases
in R&D costs and depreciation based on mass production benefits. Packs have a high ratio of fixed costs, making them likely to
benefit from mass production. At present, Tesla has the most aggressive outlook for battery price declines, and seeks to reduce total
costs to US$100 by 2020. Our estimate is generally near the market consensus, and we expect no fundamental cost breakthrough
until the mass production of all-solid-state batteries.
0
100,000
200,000
300,000
400,000
500,000
600,000
700,000
0
1,000,000
2,000,000
3,000,000
4,000,000
5,000,000
6,000,000
7,000,000
8,000,000
9,000,000
2015 2016E 2017E 2018E 2019E 2020E 2021E 2022E 2023E 2024E 2025E
Auto
Non-auto
Market size
0
1,000,000
2,000,000
3,000,000
4,000,000
5,000,000
6,000,000
7,000,000
8,000,000
2015 2016E 2017E 2018E 2019E 2020E 2021E 2022E 2023E 2024E 2025E
Wt Dry

September 27, 2016 Asia: Automobiles
Goldman Sachs Global Investment Research 19
Exhibit 20: We expect battery unit prices to decrease by half…
LIB cost breakdown (US$)
Exhibit 21: …with Tesla having the most optimistic cost outlook kWh unit price outlook (US$)
Source: Avicenne, Goldman Sachs Global Investment Research.
Source: Company data, Goldman Sachs Global Investment Research.
Search for suitable post-LIB technology: All-solid-state batteries in the lead
Post-LIB development competition is growing more severe as LIBs approach their theoretical limits. All-solid-state battery
technology has advanced noticeably in the past 5-10 years amid intensifying development competition with lithium-air batteries,
multivalent ion batteries, and sulfur-based batteries. More than 3,000 patents for all-solid-state batteries were filed in 2002-2011, far
higher than other post-LIB technologies. Toyota/Tokyo Institute of Technology, Hitachi Zosen, Ohara, and other companies have
announced technological innovations for all-solid-state batteries in 2016.
0
50
100
150
200
250
300
350
400
450
2015 2020E 2025E
Pack costCathodeAnodeElectrolyteSeparatorOthersDepreciationDirect laborEnergyR&DSales&AdmMargin
0
50
100
150
200
250
300
350
400
450
2015 2016E 2017E 2018E 2019E 2020E
High estimate Low estimate (Tesla)

September 27, 2016 Asia: Automobiles
Goldman Sachs Global Investment Research 20
Exhibit 22: Post-LIB development Features of next-generation batteries
Exhibit 23: All-solid-state battery development has picked up in recent years Number of patent filings in 2002-2011
Source: Goldman Sachs Global Investment Research.
Source: NEDO, Goldman Sachs Global Investment Research.
Strengths and weaknesses of all-solid-state batteries
All-solid-state batteries seek to increase energy density and reduce cost by replacing liquid electrolytes with solid electrolytes. These
batteries have high potential for quickly eliminating EV disadvantages in our view. In addition to raising energy density, they offer
prospects for improved safety and operating temperature flexibility. However, technological hurdles remain for mass production.
All-solid-state batteries require new production processes, including pressurization and calcination. There is also risk of producing
toxic hydrogen sulfide (sulfide-based solid-state electrolytes produce hydrogen sulfide in reaction to moisture). Companies are
examining various methods to address hydrogen sulfide, including the use of sturdy cases that are hard to break and use of
hydrogen sulfide gas detectors to quickly detect gas generation.
All-solid state battery
Lithium-air batteries
Sodium ion battery
Polyvalent ionbattery
Sulfur-based batteries
NAS
Battery using polyvalent cations with divalent or trivalent ion (Li +is monovalent). Research is ongoing for various ions such asMg 2+, Ca 2+ etc.
Replace electrolyte liquid to solid. High level of safety sinceinorganic solid electrolyte is noninflammable. Electrolyte issulfur.
Cathode material: sulfur, anode material: sodium, andelectrolytes: ceramic. Energy density is 110Wh/kg. Operationtemperature is high (300-350℃).
Uses oxygen as cathode active material. High energy densitybut need high level of technological innovation.
Replace cathode material from Li+ to Na+ . Sodium is rich as anatural resource and possibility of further cost reduction.
Sulfur-based batteries use a sulfur material for the positiveelectrode, but sulfur is water soluble, so sulfur-based solid arefrequently used for the electrolyte.
0
500
1,000
1,500
2,000
2,500
3,000
3,500
All Solid Battery Lithium-airBattery
Na ION Battery Polyvalent ionbattery
Sulfer-basedbattery
Organic Battery
OthersKoreaChinaEuropeUSJapan

September 27, 2016 Asia: Automobiles
Goldman Sachs Global Investment Research 21
Exhibit 24: All-solid-state batteries feature greater energy density and safety; need to overcome mass production challenges Advantages and disadvantages of all-solid-state batteries
Source: Goldman Sachs Global Investment Research.
Exhibit 25: LIB using liquid electrolyte between cathode and anode LIB diagram
Exhibit 26: All-solid-state battery using solid electrolytes rather than liquid
electrolytes All-solid-state battery diagram
Source: Goldman Sachs Global Investment Research.
Source: Goldman Sachs Global Investment Research.
Merits
SafeWide range of operating temp. High energy densityHigh volume energy densityDemerits
Low productivityLow power densityUnknown accidents
→ Conductivity of solid electrolyte is not very high.→ Some research warn against a generation of hydrogen sulfide.
→ Less risk of fire due to no liquid electrolyte.→ Especially in low temperature.→ It is possible by using sulfur for electrode material.→ Easy to form a layered structure.
→ Need pressurization or calcination to form a solid electrolyte.
Negative current collector Positive current collector
Separator
Lithium ion battery
Li+
Li-
Li-
Li-
Li-
Li-
Li+
Li+Li+
Li+
Li+
Anode CathodeLiquid
Negative current collector Positive current collector
All-solid-state battery
Li+
Li-
Li-
Li-
Li-
Li-
Li+
Li+Li+
Li+
Li+
Anode CathodeSolid

September 27, 2016 Asia: Automobiles
Goldman Sachs Global Investment Research 22
Multiple players in all-solid-state battery development
Toyota, Sekisui Chemical, and Hitachi Zosen are targeting mass production of all-solid-state batteries in 2020-2025. Samsung Elec.,
Daimler, and Sony have also announced R&D initiatives, but their mass production timeframes are unknown. BYD has launched a
special team and is conducting research into all-solid-state batteries. Leading auto parts maker Bosch acquired the all-solid-state
battery venture company Seeo. Consumer electronics maker Dyson also entered the battery business by acquiring Skit3. We think
expectations are rising for using all-solid-state batteries not only for automotive applications, but for consumer products as well.
All-solid-state battery production processes differ greatly from current LIBs
The production of all-solid-state batteries can be broadly separated into three main methods. (1) Hitachi Zosen and Toyota use a
powder pressing process that applies pressure to sulfide-based solid electrolytes and the cathode/anode. This method increases
ionic conductivity by making the contact state more adhesive through component interface movement. Ensuring ionic conductivity
within the solid state is the primary hurdle for replacing liquid electrolytes with solid electrolytes. (2) Bosch and Sekisui Chemical
are developing a coating-based process that performs roll-to-roll layering. Electrolytic materials often use semi-solid materials. (3)
Dyson and Applied Materials are developing a semiconductor process, but expansion to high-capacity automotive batteries is
difficult. We would expect this to be used mainly for consumer products.
Exhibit 27: Growing interest in all-solid-state batteries for both automobiles and consumer products
Leading manufacturers and technological features
Source: Nikkei Elec, Goldman Sachs Global Investment Research.
Powder and pressure Coating Semiconductor
Mass production Hitachi Zosen established a massproduction method.
Mass production is possible by roll-to-rollprocess. Under development
Energy densityHigh value from the research done byHigh Tokyo University and TokyoInstitute of Technology.
Average High theoretical value but unsuitable formass production.
Power densityHigh value from the the research doneby High Tokyo University and TokyoInstitute of Technology.
Average Challenge is how to make a separatorthinner.
Safety Risk: generation of hydrogen sulfidefrom sulfide-based electrolyte.
Sekisui Chemical is confident in thesafety of the battery. High level of safety
Toyota Sekisui Chemical (acquired Enax) Dyson (acquired Sakit3)Hitachi Zosen Bosch (acquired Seeo) Applied MaterialsSamsung Zeptor
Battery makers

September 27, 2016 Asia: Automobiles
Goldman Sachs Global Investment Research 23
Exhibit 28: All-solid-state batteries use special pressing process Comparison of production processes for all-solid-state batteries and LIBs
All-solid-state battery production process
LIB production process
Source: Goldman Sachs Global Investment Research.
Anode
Cathode
Separator
Coating Insert electrolyteLaminateDry
Liquid Electrolyte

September 27, 2016 Asia: Automobiles
Goldman Sachs Global Investment Research 24
Case study: Samsung’s exploding mobile phone batteries
1) What is happening inside the batteries?
At a press briefing on September 2, 2016, Samsung Electronics (SEC) announced that it will recall all Galaxy Note 7 (Note 7) that have been shipped, around 2.5mn units globally. SEC indicated that the problem stems from issues with the battery cell, while it declined to mention the supplier of the batteries that caused these problems. SEC explained that it mainly uses batteries from two different suppliers, and that an error in the manufacturing process at one supplier caused the cathode and anode of the battery to contact each other which resulted in the battery exploding.
2) Automotive batteries differ from consumer electronics ones, but further safety measures are inevitable
In the case of Note 7 explosion, the battery used is polymer-type while Samsung SDI supplies can-type for EV batteries. So they are different types of batteries, but the risk here is that there could be reputational risk as OEMs will be reluctant to use battery produced by a company that has seen problems even if that was for another application. Another potential implication is increase in entry barriers for EV battery suppliers given OEMs will likely raise safety measures for batteries.
3) Learning from past incidents of battery overheating
There have been several incidences of LIBs overheating in addition to the recent cases involving Samsung. We think there are generally two causes for such overheating (exact cause still unclear for Samsung). The first is a problem with the separator between the positive and negative electrodes. The battery’s safety becomes compromised if the separator is not strong enough or it is damaged by the presence of foreign materials. The second is the possibility of a problem in the battery pack. The battery includes a mechanism (known as a battery management system) that acts as a block when there is a large outflow of electric current. If this battery management system does not function properly for some reason, then it can become impossible to control a thermal runaway in the battery.

September 27, 2016 Asia: Automobiles
Goldman Sachs Global Investment Research 25
EV and PHEV penetration set to accelerate through 2025E
PHEVs could take off by 2020, followed by EVs thereafter
We forecast vehicles with an electric powertrain system will account for 25% of global auto sales in 2025, up from 5% in 2015. While
we expect hybrids to be the main type of electrified vehicle, electrification is gaining traction, driven by the aggressive adoption of
car purchase subsidies in Europe and China. In California and nine other US states, electrification is likely to accelerate from 2018,
spurred by zero-emission vehicle (ZEV) regulations (requiring the sale of a certain volume of PHEVs, EVs, and FCVs, according to
annual sales volume). We forecast global demand for EVs and PHEVs combined will increase sharply to 6.8 mn vehicles in 2025,
from 650,000 vehicles in 2015. In our view, PHEVs will lead the way through 2020 due to battery performance constraints, with the
EV market entering a sharp expansionary phase from 2020.
Even stricter CO2 environmental regulations, moves toward RDE
Fuel economy standards could tighten intermittently between 2020 and 2025, mainly in the US and Europe. The US corporate
average fuel economy (CAFE) target of 54.5 mpg for the 2025 model year and the possible European CO2 emission targets of 95
g/km by 2020 and of 72 g/km by 2025 (not officially decided yet) represent very challenging hurdles for automakers. China has
decided to tighten fuel efficiency standards in response to increasing environmental problems, a heavy reliance on overseas energy
(already more than 50%), and urban traffic congestion. We expect the VW emissions scandal that surfaced in October 2015 to have a
significant impact on emission/fuel economy regulations. In Europe, discussions are progressing ahead of the adoption of Euro 6c
emission standards in 2017, and automakers will need to pay increased attention to the difference between real-world and test-
mode fuel economy.
CO2 emissions: The Euro 6c CO2 emission measurements use the Worldwide harmonized Light vehicles Test Procedures (WLTP),
the unified testing mode for Japan, the US, and Europe. The difference between test-mode and real-world fuel economy is
calculated by comparing real driving emissions (RDE) conditions with WLTP results. New models tested from September 2017 will
need to conform to a permitted difference of 2.1x or less between RDE fuel economy and certified (catalog) fuel economy.
Discussions are also under way on narrowing this difference to 1.5x.
NOx and PN standards: The New European Driving Cycle (NEDC) is currently used to assess emission levels, but under Euro 6C
RDE tests will be adopted as the uniform testing method in Europe. RDE test procedure details are currently under discussion, with
technical adjustments being made to testing environments (test course, latitude, altitude, etc.).
ZEV regulations prompting action; hybrid vehicles to be excluded from ZEV category from 2018
Automakers are rushing to launch EVs and PHEVs in part because of the ZEV regulations announced by the state of California, US.
Major automakers need to generate ZEV credits equivalent to 4.5% of the vehicles they sell in California from 2018, but hybrid
vehicles will no longer be included in the ZEV category. Mid-tier automakers must also generate ZEV credits, like major automakers,
five years later, from 2023. As such, we think electrification is inevitable even at Mazda Motor and Fuji Heavy Industries.
September 27, 2016 Asia: Automobiles
Goldman Sachs Global Investment Research 26
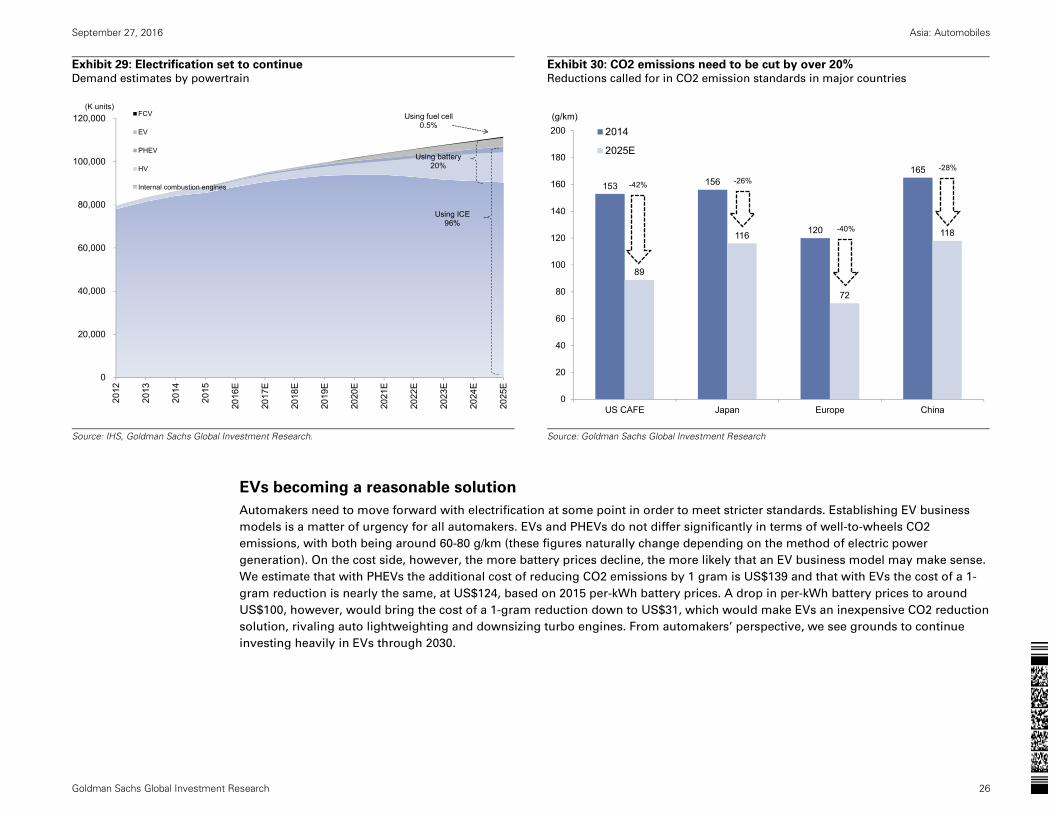
Exhibit 29: Electrification set to continue Demand estimates by powertrain
Exhibit 30: CO2 emissions need to be cut by over 20% Reductions called for in CO2 emission standards in major countries
Source: IHS, Goldman Sachs Global Investment Research.
Source: Goldman Sachs Global Investment Research
EVs becoming a reasonable solution
Automakers need to move forward with electrification at some point in order to meet stricter standards. Establishing EV business
models is a matter of urgency for all automakers. EVs and PHEVs do not differ significantly in terms of well-to-wheels CO2
emissions, with both being around 60-80 g/km (these figures naturally change depending on the method of electric power
generation). On the cost side, however, the more battery prices decline, the more likely that an EV business model may make sense.
We estimate that with PHEVs the additional cost of reducing CO2 emissions by 1 gram is US$139 and that with EVs the cost of a 1-
gram reduction is nearly the same, at US$124, based on 2015 per-kWh battery prices. A drop in per-kWh battery prices to around
US$100, however, would bring the cost of a 1-gram reduction down to US$31, which would make EVs an inexpensive CO2 reduction
solution, rivaling auto lightweighting and downsizing turbo engines. From automakers’ perspective, we see grounds to continue
investing heavily in EVs through 2030.
0
20,000
40,000
60,000
80,000
100,000
120,00020
12
2013
2014
2015
2016
E
2017
E
2018
E
2019
E
2020
E
2021
E
2022
E
2023
E
2024
E
2025
E
FCV
EV
PHEV
HV
Internal combustion engines
Using ICE96%
Using battery20%
Using fuel cell0.5%
(K units)
153 156
120
165
89
116
72
118
0
20
40
60
80
100
120
140
160
180
200
US CAFE Japan Europe China
2014
2025E
(g/km)
-42% -26%
-40%
-28%

September 27, 2016 Asia: Automobiles
Goldman Sachs Global Investment Research 27
Exhibit 31: EV and PHEV CO2 emissions do not differ significantly on a well-
to-wheels basis
CO2 emissions by powertrain (g/km)
Exhibit 32: EVs could become an inexpensive CO2 emissions reduction
solution in 2030
Estimated additional cost of a 1-gram reduction in CO2 emissions (US$)
Source: NEDO.
Source: Goldman Sachs Global Investment Research.
Price and driving range are the keys to EV penetration
The high price of EVs is the main obstacle to their penetration, as reflected in price concerns being cited by 50% of consumers who
participated in a 2016 Ministry of Economy, Trade and Industry survey in Japan. The next largest issues are driving range (cited by
13%) and a lack of charging facilities at home (10%). Improvements in energy density should dispel at least two of consumers’ major
concerns. Around 53% of the respondents said they would be satisfied with a driving range of 300 km/200 miles, and 80% said that
given a driving range of 500 km/300 miles, this factor would not be an obstacle to buying an EV. This is why we see 60 kWh as the
ideal battery capacity for EVs.
21.1
40.1
67.4
0 20 40 60 80 100 120 140 160
GasolineVehicle
PHEV
EV Well to TankTank to Wheel

September 27, 2016 Asia: Automobiles
Goldman Sachs Global Investment Research 28
Exhibit 33: Price is the main issue with EVs, followed by driving range Impediments to buying an EV (2016 survey)
Exhibit 34: Around 50% of consumers would be satisfied with a driving range
of 300 km
EV driving range survey, 2016
Source: METI.
Source:METI.
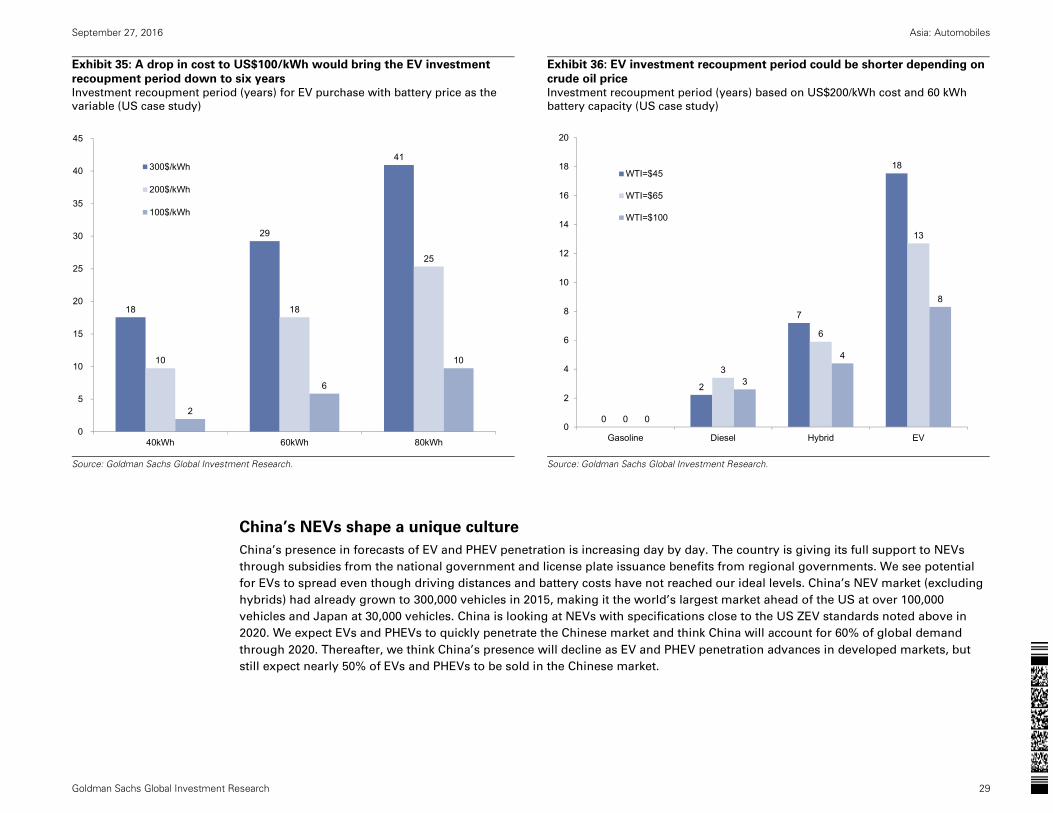
Investment recoupment period growing shorter every year
With price being the greatest concern when considering purchase of an EV, we see US$100 per kWh as a reasonable battery cost
target, based on lifecycle cost for the entire ownership period. Based on battery capacity of 60 kWh, car owners would recoup the
higher cost of purchasing an EV in six years. If we additionally factor in a rise in crude oil prices, the recoupment period would be
significantly reduced even if we assume a battery cost of US$200 per kWh in 2020. Assuming a WTI price of US$100/bbl, the
recoupment period for EVs would be eight years in 2020. We estimate that the recoupment period in the first half of 2000s was
around five years, and that this drove the sharp growth in hybrid cars then.
0% 10% 20% 30% 40% 50% 60%
Expensive
Short running distance
No EV charging facility at home
Few EV charging station
Spending long time for charging
Worse automobile performance
Not attractive
16% 15% 18% 20%
28% 26%27% 27%
44%41%
40% 36%
0%
10%
20%
30%
40%
50%
60%
70%
80%
90%
100%
2012 2013 2014 2015
80km160km320km480km640km
September 27, 2016 Asia: Automobiles
Goldman Sachs Global Investment Research 29
Exhibit 35: A drop in cost to US$100/kWh would bring the EV investment
recoupment period down to six years Investment recoupment period (years) for EV purchase with battery price as the
variable (US case study)
Exhibit 36: EV investment recoupment period could be shorter depending on
crude oil price Investment recoupment period (years) based on US$200/kWh cost and 60 kWh
battery capacity (US case study)
Source: Goldman Sachs Global Investment Research.
Source: Goldman Sachs Global Investment Research.
China’s NEVs shape a unique culture
China’s presence in forecasts of EV and PHEV penetration is increasing day by day. The country is giving its full support to NEVs
through subsidies from the national government and license plate issuance benefits from regional governments. We see potential
for EVs to spread even though driving distances and battery costs have not reached our ideal levels. China’s NEV market (excluding
hybrids) had already grown to 300,000 vehicles in 2015, making it the world’s largest market ahead of the US at over 100,000
vehicles and Japan at 30,000 vehicles. China is looking at NEVs with specifications close to the US ZEV standards noted above in
2020. We expect EVs and PHEVs to quickly penetrate the Chinese market and think China will account for 60% of global demand
through 2020. Thereafter, we think China’s presence will decline as EV and PHEV penetration advances in developed markets, but
still expect nearly 50% of EVs and PHEVs to be sold in the Chinese market.
18
29
41
10
18
25
2
6
10
0
5
10
15
20
25
30
35
40
45
40kWh 60kWh 80kWh
300$/kWh
200$/kWh
100$/kWh
0
2
7
18
0
3
6
13
0
3
4
8
0
2
4
6
8
10
12
14
16
18
20
Gasoline Diesel Hybrid EV
WTI=$45
WTI=$65
WTI=$100

September 27, 2016 Asia: Automobiles
Goldman Sachs Global Investment Research 30
Exhibit 37: China is already the world’s largest NEV market HV, PHEV, and EV sales in Japan, US, and China (Thous.)
Exhibit 38: Expect China to account for majority of global NEVs in 2020 China’s NEV market outlook (excluding commercial vehicles, K units)
Source: CAAM, Goldman Sachs Global Investment Research.
Source: Goldman Sachs Global Investment Research.
NEVs are supported by robust subsidies
NEV policies have been established with robust support from the Chinese government. China relies on overseas supplies for over
60% of its crude oil, making NEV policies increasingly important from the standpoint of energy security. Our China analyst Yipeng
Yang estimates that the NEV business of BYD, which sells the most NEVs in China, had an operating margin above 15% in 2015.
However, excluding subsidies, it may have had a negative operating margin in excess of 10% in real terms (this real profit margin is
roughly equal to Tesla). Automakers involved in NEVs in China have been able to save cash for reinvestment amid the worst period
for earnings due to business startup. However, the government has indicated that it intends to eliminate NEV purchase subsidies
from 2020. It will likely no longer be possible for all NEV makers to reap excess returns on an ongoing basis. We expect both Tesla
and BYD to achieve positive operating profits in real terms in 2018-2019 on lower battery costs and mass production benefits.
45
247
77 7617 17
30
84
48 53
13 13
189 209
857
1,013
0
200
400
600
800
1,000
1,200
CY2014 CY2015 CY2014 CY2015 FY2013 FY2014
HEVPHEVEV
China US Japan0%
10%
20%
30%
40%
50%
60%
70%
0
500
1,000
1,500
2,000
2,500
3,000
3,500
2015 2016E 2017E 2018E 2019E 2020E 2021E 2022E 2023E 2024E 2025E
EV
PHEV
EV/China

September 27, 2016 Asia: Automobiles
Goldman Sachs Global Investment Research 31
Exhibit 39: Top NEV makers have double-digit (%) op. margins after subsidiesComparison of margins at BYD and Tesla
Exhibit 40: China plans to annually reduce NEV purchase subsidies Overview of subsidies (Thous. RMB, R:ranges)
Note: Comparable OPM excludes subsidies.
Source: Company data, Goldman Sachs Global Investment Research.
Source: CAAM, Goldman Sachs Global Investment Research.
China to reduce purchase subsidies, but lays groundwork for NEVs to expand
Even if China eliminates NEV purchase subsidies in 2020, we believe it will still have policies to support NEV penetration. In
particular, many more cities are considering the adoption of license plate issuance regulations in response to more severe air
pollution and traffic congestion. Special measures for NEVs that are unique to China, such as the preferential issuance of license
plates and absence of travel restrictions, could support EV and PHEV penetration from 2020. We expect the government’s NEV-
related costs to stabilize at around 0.5% of national expenditures from 2020 vs. around 0.7% in 2015.
-4.0%
9.6%
16.5%
12.6%
-11.1%
8.8%
-12.6%
6.3%
-15%
-12%
-9%
-6%
-3%
0%
3%
6%
9%
12%
15%
18%
2015 2016E 2017E 2018E 2019E 2020E
BYD-NEV OPM
Tesla OPM
BYD-NEV comparable OPM
Tesla comparable OPM
0
10
20
30
40
50
60
70
2013 2014 2015 2016E 2017E 2018E 2019E 2020E
EV 80≤R<150 (100≤R<150 from 2016)EVEV 150≤R<250EV R≥250PHEV R≥50
(K Rmb)

September 27, 2016 Asia: Automobiles
Goldman Sachs Global Investment Research 32
Exhibit 41: China likely to expand support other than purchase subsidies from 2021 China’s support for NEVs
Source: Goldman Sachs Global Investment Research.
0.0%
0.1%
0.2%
0.3%
0.4%
0.5%
0.6%
0.7%
0.8%
0.9%
-
50,000
100,000
150,000
200,000
250,000
2015 2016E 2017E 2018E 2019E 2020E 2021E 2022E 2023E 2024E 2025E
Other incentivesNEV license plate fee benefitNEV purchase subsidyTotal NEV subsidy as % of govt. budget
(RMB mn)

September 27, 2016 Asia: Automobiles
Goldman Sachs Global Investment Research 33
Stocks in focus
Stocks in focus

September 27, 2016 Asia: Automobiles
Goldman Sachs Global Investment Research 34
LG Chem: Strong and diversified EV battery client base; reiterate CL-Buy
Source of opportunity
LG Chem is the third-largest producer of EV battery globally with: 1) a globally diversified customer base and
competitive cost structure; 2) capability to mass produce batteries with mainstream NCM (Nickel, Cobalt, Manganese)
technology. Its customer base includes global major automakers in US/Europe/Asia including General Motors,
Hyundai-Kia Motors, Renault, SAIC Motor and Geely. Many of these players expect major launches in 2H16 e.g., GM
Bolt, Renault (Zoe), Hyundai (Ioniq), in which case LG Chem could enjoy high volumes translating into lower fixed
costs per unit, likely improving profitability from 2H16. Also, we see potential upside for LG Chem in the Chinese
market assuming no further regulatory headwinds as its NCM batteries have significantly higher energy density and
require much advanced technology compared to LFP (Lithium Iron Phosphate) batteries that are currently prevalent in
China. While Chinese players are actively trying to catch up with EV battery technology, it will likely take time to build
track record in energy density/safety/cost, which supports why major automakers such as SAIC or Geely use LG
Chem’s batteries. We believe LG Chem’s EV battery revenue will grow on average 48% for 2016/17/18E, and expect its
EV battery business to pass breakeven point in 2017E. We see its risk-reward as attractive as Chemicals (92% of 2015
EBIT) should benefit from favorable product exposure while the share price already implies a negative value for EV-
battery. In line with this, and given its 40% upside to our 12m target price, we reiterate CL-Buy on LG Chem.
Catalysts
1. Launch of EVs with LG Chem batteries in 2H16 – We expect EV battery sales to pick up from 3Q given planned EV
launches from GM (Bolt), Renault (Zoe), Hyundai (Ioniq) and Chinese passenger car makers in 2H16. We expect
revenue recognition to start from August for GM/Renault (new car launch in October). Higher volumes also
translate to lower fixed costs per unit, likely improving profitability from 3Q16 for LG Chem’s(LGC) EV-battery
segment.
2. Strong core chemical earnings; gradual turnaround in other segments – We believe LG Chem’s core chemicals
earnings will stay strong in 3Q, despite some moderation from 2Q highs, as improving SAP profitability partly
offsets blended spreads decline. Combined with a turnaround in the non-chemicals business, (stronger EV-battery
performance, small battery expansion), we expect LG Chem to continue its strong earnings sequentially in 3Q16.
Valuation
Our 12-m SOTP-based target price of W335K is unchanged. Our calculations indicate that LGC’s SOTP valuation may
rise by 10% vs. our base case if the company’s guidance on EV battery revenues is achieved (54% sales CAGR in 2016-
20 vs. GSe base case 30%). However, market is pricing in a negative value for the EV battery business, implying a
favorable risk reward.
Key risks
Slower-than-expected turnaround of EV and small battery businesses, lower-than-expected chemical margins, CROCI-
dilutive M&A.
INVESTMENT LIST MEMBERSHIP
Asia Pacific Buy listAsia Pacific Conviction Buy list
Coverage View: Neutral
Growth
Returns *
Multiple
Volatility Volatility
Multiple
Returns *
Growth
Investment Profile
Low High
Percentile 20th 40th 60th 80th 100th
* Returns = Return on Capital For a complete description of the investment
profile measures please refer to the
disclosure section of this document.
LG Chem (051910.KS)
Asia Pacific Chemicals Peer Group Average
Key data Current
Price (W) 238,500
12 month price target (W) 335,000
Market cap (W bn / US$ mn) 17,538.0 / 15,896.7
Foreign ownership (%) --
12/15 12/16E 12/17E 12/18E
EPS (W) 18,410 21,431 23,254 24,317
EPS growth (%) 40.8 16.4 8.5 4.6
EPS (diluted) (W) 15,679 21,431 23,254 24,317
EPS (basic pre-ex) (W) 18,410 21,431 23,254 24,317
P/E (X) 14.0 11.1 10.3 9.8
P/B (X) 1.5 1.2 1.1 1.0
EV/EBITDA (X) 6.5 5.3 4.6 4.1
Dividend yield (%) 1.7 2.2 2.4 2.5
ROE (%) 9.2 11.6 11.5 11.1
CROCI (%) 11.8 12.1 12.2 12.1
1,800
1,850
1,900
1,950
2,000
2,050
2,100
2,150
220,000
240,000
260,000
280,000
300,000
320,000
340,000
360,000
Sep-15 Dec-15 Apr-16 Jul-16
Price performance chart
LG Chem (L) Korea SE Composite (KOSPI) (R)
Share price performance (%) 3 month 6 month 12 month
Absolute (6.7) (23.9) (7.6)
Rel. to Korea SE Composite (KOSPI) (9.3) (25.9) (10.6)
Source: Company data, Goldman Sachs Research estimates, FactSet. Price as of 9/22/2016 close.

September 27, 2016 Asia: Automobiles
Goldman Sachs Global Investment Research 35
LG Chem: Summary financials
Profit model (W bn) 12/15 12/16E 12/17E 12/18E Balance sheet (W bn) 12/15 12/16E 12/17E 12/18E
Total revenue 20,206.6 21,931.7 24,135.0 25,034.6 Cash & equivalents 1,704.9 1,350.2 1,990.8 2,679.6
Cost of goods sold (16,540.5) (17,914.2) (19,752.7) (20,498.8) Accounts receivable 3,398.9 3,304.8 3,636.8 3,772.3
SG&A (1,842.5) (1,999.8) (2,200.7) (2,282.7) Inventory 2,338.6 2,355.8 2,597.6 2,695.7
R&D -- -- -- -- Other current assets 1,213.2 1,213.2 1,213.2 1,213.2
Other operating profit/(expense) 0.0 0.0 0.0 0.0 Total current assets 8,655.6 8,224.0 9,438.4 10,360.9
EBITDA 3,079.7 3,342.6 3,613.9 3,811.6 Net PP&E 8,867.2 9,142.2 9,309.9 9,351.4
Depreciation & amortization (1,256.1) (1,325.0) (1,432.3) (1,558.6) Net intangibles 501.9 501.9 501.9 501.9
EBIT 1,823.6 2,017.7 2,181.6 2,253.0 Total investments 330.8 1,055.3 1,055.3 1,055.3
Interest income 37.5 64.4 50.1 73.9 Other long-term assets 223.2 223.2 223.2 223.2
Interest expense (58.1) (40.7) (24.6) (17.2) Total assets 18,578.7 19,146.7 20,528.7 21,492.7
Income/(loss) from uncons. subs. (128.9) 25.0 35.0 35.0
Others 76.3 0.0 0.0 0.0 Accounts payable 2,243.1 2,974.3 3,273.1 3,395.1
Pretax profits 1,750.4 2,066.4 2,242.2 2,344.7 Short-term debt 2,145.9 800.0 800.0 500.0
Income tax (401.1) (495.9) (538.1) (562.7) Other current liabilities 409.9 409.9 409.9 409.9
Minorities (4.5) 5.5 5.9 6.2 Total current liabilities 4,799.0 4,184.2 4,483.0 4,305.0
Long-term debt 474.1 474.1 274.1 74.1
Net income pre-preferred dividends 1,353.8 1,575.9 1,710.0 1,788.2 Other long-term liabilities 202.2 202.2 202.2 202.2
Preferred dividends 0.0 0.0 0.0 0.0 Total long-term liabilities 676.2 676.2 476.2 276.2
Net income (pre-exceptionals) 1,353.8 1,575.9 1,710.0 1,788.2 Total liabilities 5,475.2 4,860.4 4,959.2 4,581.2
Post-tax exceptionals (200.8) 0.0 0.0 0.0
Net income 1,153.0 1,575.9 1,710.0 1,788.2 Preferred shares 0.0 0.0 0.0 0.0
Total common equity 12,991.5 14,174.2 15,457.5 16,799.4
EPS (basic, pre-except) (W) 18,410 21,431 23,254 24,317 Minority interest 112.1 112.1 112.1 112.1
EPS (basic, post-except) (W) 15,679 21,431 23,254 24,317
EPS (diluted, post-except) (W) 15,679 21,431 23,254 24,317 Total liabilities & equity 18,578.7 19,146.7 20,528.7 21,492.7
DPS (W) 4,505 5,358 5,814 6,079
Dividend payout ratio (%) 28.7 25.0 25.0 25.0 BVPS (W) 176,671 192,755 210,206 228,455
Free cash flow yield (%) 8.0 12.0 7.2 9.3
Growth & margins (%) 12/15 12/16E 12/17E 12/18E Ratios 12/15 12/16E 12/17E 12/18E
Sales growth (10.5) 8.5 10.0 3.7 CROCI (%) 11.8 12.1 12.2 12.1
EBITDA growth 25.1 8.5 8.1 5.5 ROE (%) 9.2 11.6 11.5 11.1
EBIT growth 39.1 10.6 8.1 3.3 ROA (%) 6.3 8.4 8.6 8.5
Net income growth 32.8 36.7 8.5 4.6 ROACE (%) 9.7 11.0 11.7 11.8
EPS growth 32.8 36.7 8.5 4.6 Inventory days 55.7 47.8 45.8 47.1
Gross margin 18.1 18.3 18.2 18.1 Receivables days 61.2 55.8 52.5 54.0
EBITDA margin 15.2 15.2 15.0 15.2 Payable days 51.8 53.2 57.7 59.4
EBIT margin 9.0 9.2 9.0 9.0 Net debt/equity (%) 7.0 (0.5) (5.9) (12.5)
Interest cover - EBIT (X) 88.9 NM NM NM
Cash flow statement (W bn) 12/15 12/16E 12/17E 12/18E Valuation 12/15 12/16E 12/17E 12/18E
Net income pre-preferred dividends 1,353.8 1,575.9 1,710.0 1,788.2
D&A add-back 1,256.1 1,325.0 1,432.3 1,558.6 P/E (analyst) (X) 14.0 11.1 10.3 9.8
Minorities interests add-back 4.5 5.5 5.9 6.2 P/B (X) 1.5 1.2 1.1 1.0
Net (inc)/dec working capital 257.9 808.0 (275.0) (111.7) EV/EBITDA (X) 6.5 5.3 4.6 4.1
Other operating cash flow 0.0 0.0 0.0 0.0 EV/GCI (X) 0.9 0.7 0.6 0.6
Cash flow from operations 2,942.3 3,714.3 2,873.3 3,241.3 Dividend yield (%) 1.7 2.2 2.4 2.5
Capital expenditures (1,423.8) (1,600.0) (1,600.0) (1,600.0)
Acquisitions 225.4 (724.5) 0.0 0.0
Divestitures 0.0 0.0 0.0 0.0
Others (270.9) 0.0 0.0 0.0
Cash flow from investments (1,469.3) (2,324.5) (1,600.0) (1,600.0)
Dividends paid (common & pref) (331.3) (394.0) (427.5) (447.0)
Inc/(dec) in debt (314.2) (1,345.9) (200.0) (500.0)
Common stock issuance (repurchase) 29.8 0.8 0.8 0.8
Other financing cash flows (140.5) (5.5) (5.9) (6.2)
Cash flow from financing (756.1) (1,744.6) (632.7) (952.5)
Total cash flow 716.9 (354.8) 640.6 688.8 Note: Last actual year may include reported and estimated data.
Source: Company data, Goldman Sachs Research estimates.

September 27, 2016 Asia: Automobiles
Goldman Sachs Global Investment Research 36
BYD: To benefit from China’s fast-growing NEV market, valuation attractive; reiterate Buy
Source of opportunity
Electrification is set to reshape China’s auto market and we expect BYD to lead this trend given its strong product
portfolio, vertically integrated model and high OPM vs. peers. A comparative analysis with Tesla shows many
strategic similarities but BYD’s new energy vehicle business trades at a sizable discount, which we see as
unjustified given its large cost savings, capacity utilization, and front-loaded investment. China’s new energy
vehicle market is poised to deliver c.30% CAGR (vs. c.4% for overall car market) over the next decade. We
maintain our Buy rating on the strong NEV growth story in China.
Catalysts
1) More cities in China are likely to announce local preferential policies in the new energy vehicle (NEV) segment
once the result of the subsidy fraud probe is announced; 2) BYD plans to launch PHEV versions of the Song/Yuan
SUVs and its e-logistic product this year; 3) Increased battery capacity should remove the bottleneck of recent
years; 4) Our 2016E-18E EPS are up to 41% above Bloomberg consensus (we believe the street has not
sufficiently factored in BYD’s unique competitive edge in new energy vehicles), and strong FY2016 earnings could
be a positive catalyst; 5) Potential introduction of fuel consumption & NEV credit trading system in China.
Valuation
Our 12-month target price of HK$61.93 is based on a sum-of-the-parts valuation, with the lion’s share contributed
by BYD’s NEV business (using a 10-year DCF). We see BYD’s current valuations as attractive given: 1) its 20X 12-
month fwd. P/E is below historical median -1std; 2) the NEV business (incl. EV battery) trades at 1.1X 2020E P/S
and 11.0X 2020E P/E, well below Tesla’s 1.4X and 20.0X respectively, and we expect this gap to narrow given the
strong medium-term revenue/earnings growth outlook for BYD’s business; 3) completion of its recent private
placement has improved balance sheet/cash flow metrics.
Key risks
Scaling down of purchase subsidy for NEV; lower market share/OPM as competition increases; disruptive battery
technologies impacting competitive edge.
INVESTMENT LIST MEMBERSHIP
Asia Pacific Buy list
Coverage View: Neutral
Growth
Returns *
Multiple
Volatility Volatility
Multiple
Returns *
Growth
Investment Profile
Low High
Percentile 20th 40th 60th 80th 100th
* Returns = Return on Capital For a complete description of the investment
profile measures please refer to the
disclosure section of this document.
BYD Co. (1211.HK)
Asia Pacific Autos & Autoparts Peer Group Average
Key data Current
Price (HK$) 54.00
12 month price target (HK$) 61.93
Market cap (HK$ mn / US$ mn) 110,705.4 / 14,273.2
Foreign ownership (%) --
12/15 12/16E 12/17E 12/18E
EPS (Rmb) 1.14 1.87 2.51 3.23
EPS growth (%) 537.9 63.7 34.7 28.4
EPS (diluted) (Rmb) 1.14 1.87 2.51 3.23
EPS (basic pre-ex) (Rmb) 1.14 1.87 2.51 3.23
P/E (X) 28.7 24.9 18.5 14.4
P/B (X) 2.5 2.5 2.3 2.1
EV/EBITDA (X) 12.9 10.1 9.2 8.0
Dividend yield (%) 0.0 1.3 1.4 1.7
ROE (%) 9.8 11.7 13.1 15.1
CROCI (%) 14.1 12.8 13.7 13.7
7,500
8,500
9,500
10,500
11,500
12,500
13,500
30
35
40
45
50
55
60
Sep-15 Dec-15 Apr-16 Jul-16
Price performance chart
BYD Co. (L) Hang Seng China Ent. Index (R)
Share price performance (%) 3 month 6 month 12 month
Absolute 16.5 27.5 45.6
Rel. to Hang Seng China Ent. Index 3.2 14.7 44.7
Source: Company data, Goldman Sachs Research estimates, FactSet. Price as of 9/22/2016 close.

September 27, 2016 Asia: Automobiles
Goldman Sachs Global Investment Research 37
BYD Co.: Summary financials
Profit model (Rmb mn) 12/15 12/16E 12/17E 12/18E Balance sheet (Rmb mn) 12/15 12/16E 12/17E 12/18E
Total revenue 77,612.0 103,214.1 132,373.6 159,351.5 Cash & equivalents 6,010.9 15,318.1 11,321.1 7,591.1
Cost of goods sold (60,439.1) (77,538.0) (100,105.5) (120,666.5) Accounts receivable 27,164.7 35,277.3 44,155.7 53,154.7
SG&A (8,659.2) (11,773.7) (15,761.8) (19,133.4) Inventory 15,750.6 20,206.5 26,087.7 31,445.9
R&D -- -- -- -- Other current assets 5,592.9 6,152.2 6,459.8 6,782.8
Other operating profit/(expense) 499.7 664.6 720.0 675.5 Total current assets 54,519.1 76,954.1 88,024.3 98,974.5
EBITDA 9,013.4 14,567.0 17,226.3 20,227.1 Net PP&E 39,039.0 43,599.3 48,475.2 53,078.0
Depreciation & amortization (5,313.6) (6,492.1) (7,005.9) (7,499.9) Net intangibles 7,168.7 5,927.7 4,686.8 3,445.8
EBIT 3,699.8 8,074.9 10,220.5 12,727.3 Total investments 4,960.1 4,834.3 4,720.2 4,643.0
Interest income 53.4 120.2 306.4 226.4 Other long-term assets 9,798.8 10,778.7 11,317.7 11,883.5
Interest expense (1,517.0) (1,591.8) (1,407.6) (1,284.5) Total assets 115,485.8 142,094.2 157,224.1 172,024.7
Income/(loss) from uncons. subs. 3.0 0.0 0.0 0.0
Others 1,555.8 (267.5) (139.4) (102.6) Accounts payable 30,655.8 36,142.2 45,290.1 52,939.4
Pretax profits 3,795.0 6,335.8 8,979.8 11,566.6 Short-term debt 26,412.9 27,412.9 27,212.9 26,512.9
Income tax (656.8) (1,110.1) (1,663.1) (2,257.9) Other current liabilities 9,041.4 10,684.0 10,756.0 11,242.5
Minorities (314.8) (400.6) (458.3) (504.3) Total current liabilities 66,110.1 74,239.1 83,259.0 90,694.8
Long-term debt 11,229.9 11,229.9 11,229.9 11,029.9
Net income pre-preferred dividends 2,823.4 4,825.1 6,858.4 8,804.4 Other long-term liabilities 2,116.5 2,539.8 3,047.7 3,504.9
Preferred dividends 0.0 0.0 0.0 0.0 Total long-term liabilities 13,346.4 13,769.7 14,277.6 14,534.8
Net income (pre-exceptionals) 2,823.4 4,825.1 6,858.4 8,804.4 Total liabilities 79,456.5 88,008.8 97,536.6 105,229.6
Post-tax exceptionals 0.0 0.0 0.0 0.0
Net income 2,823.4 4,825.1 6,858.4 8,804.4 Preferred shares 0.0 0.0 0.0 0.0
Total common equity 32,294.4 49,950.0 55,093.7 61,697.0
EPS (basic, pre-except) (Rmb) 1.14 1.87 2.51 3.23 Minority interest 3,734.8 4,135.4 4,593.8 5,098.1
EPS (basic, post-except) (Rmb) 1.14 1.87 2.51 3.23
EPS (diluted, post-except) (Rmb) 1.14 1.87 2.51 3.23 Total liabilities & equity 115,485.8 142,094.2 157,224.1 172,024.7
DPS (Rmb) 0.00 0.60 0.63 0.81
Dividend payout ratio (%) 0.0 32.3 25.0 25.0 BVPS (Rmb) 13.04 18.31 20.19 22.62
Free cash flow yield (%) (2.6) (5.3) (1.5) (0.4)
Growth & margins (%) 12/15 12/16E 12/17E 12/18E Ratios 12/15 12/16E 12/17E 12/18E
Sales growth 40.2 33.0 28.3 20.4 CROCI (%) 14.1 12.8 13.7 13.7
EBITDA growth 46.8 61.6 18.3 17.4 ROE (%) 9.8 11.7 13.1 15.1
EBIT growth 91.8 118.3 26.6 24.5 ROA (%) 2.7 3.7 4.6 5.3
Net income growth 551.3 70.9 42.1 28.4 ROACE (%) 7.1 8.9 10.0 11.1
EPS growth 537.9 63.7 34.7 28.4 Inventory days 77.7 84.6 84.4 87.0
Gross margin 22.1 24.9 24.4 24.3 Receivables days 117.3 110.4 109.5 111.4
EBITDA margin 11.6 14.1 13.0 12.7 Payable days 170.6 157.2 148.5 148.6
EBIT margin 4.8 7.8 7.7 8.0 Net debt/equity (%) 87.8 43.1 45.4 44.8
Interest cover - EBIT (X) 2.5 5.5 9.3 12.0
Cash flow statement (Rmb mn) 12/15 12/16E 12/17E 12/18E Valuation 12/15 12/16E 12/17E 12/18E
Net income pre-preferred dividends 2,823.4 4,825.1 6,858.4 8,804.4
D&A add-back 5,313.6 6,492.1 7,005.9 7,499.9 P/E (analyst) (X) 28.7 24.9 18.5 14.4
Minorities interests add-back 314.8 400.6 458.3 504.3 P/B (X) 2.5 2.5 2.3 2.1
Net (inc)/dec working capital (5,915.3) (7,082.2) (5,611.6) (6,707.9) EV/EBITDA (X) 12.9 10.1 9.2 8.0
Other operating cash flow 1,305.6 (864.7) (99.2) (229.1) EV/GCI (X) 1.3 1.4 1.3 1.2
Cash flow from operations 3,842.1 3,770.9 8,611.8 9,871.6 Dividend yield (%) 0.0 1.3 1.4 1.7
Capital expenditures (6,072.5) (10,321.4) (10,589.9) (10,357.8)
Acquisitions 0.0 0.0 0.0 0.0
Divestitures 1,808.6 904.3 452.1 0.0
Others (6,472.5) (519.7) (628.3) (629.2)
Cash flow from investments (10,736.5) (9,936.8) (10,766.1) (10,987.1)
Dividends paid (common & pref) 0.0 0.0 (1,642.6) (1,714.6)
Inc/(dec) in debt 10,465.6 1,000.0 (200.0) (900.0)
Common stock issuance (repurchase) 0.0 14,473.0 0.0 0.0
Other financing cash flows (1,510.7) 0.0 0.0 0.0
Cash flow from financing 8,954.9 15,473.0 (1,842.6) (2,614.6)
Total cash flow 2,060.5 9,307.1 (3,996.9) (3,730.1) Note: Last actual year may include reported and estimated data.
Source: Company data, Goldman Sachs Research estimates.

September 27, 2016 Asia: Automobiles
Goldman Sachs Global Investment Research 38
Panasonic Corp: Leading LIB supplier globally, but Neutral on tough market outlook
What's changed
Panasonic is a leading supplier of lithium-ion and automotive batteries, and has around 20% market share in
automotive lithium-ion batteries globally. We believe greater uptake of EV/ PHEVs will be a tailwind to its
businesses. Sales of automotive batteries in FY3/16 stood at around ¥150 bn (2% of consolidated sales), but we
expect this figure to rise sharply to ¥350 bn by FY3/19. Panasonic is the sole supplier of lithium-ion batteries to
Tesla, and is contracted to supply two billion battery cells between 2014 and 2017. Panasonic is also planning to
invest in Tesla’s Gigafactory – the large battery factory that Tesla is building in Nevada (US), and will contribute
around 30%-40% of the investment in the factory to build an LIB cell production line. The goal is to produce 50
GWh of battery packs each year, beginning in 2H2016, of which 35 GWh will be for automotive use. Much of the
plant’s output will be used in Tesla’s next-generation vehicle, known for now as the Model 3, due to be launched
in 2017. We believe Gigafactory start-up should deliver cost reductions of around 40% for manufacturing
batteries for Panasonic, which will permeate to Tesla’s lower accrual cost.
Implications
The Automotive & Industrial Systems (AIS) company has seen a sharp drop in sales of batteries for ICT
applications, and the rechargeable battery business produced a loss. We believe Panasonic is looking to generate
stable profits on fixed-cost savings. Longer term, we see fewer growth businesses boosting overall sales/profits,
making profit growth largely a function of forex moves and streamlining. We maintain our Neutral rating in the
absence of any positive catalysts in the near term.
Valuation
Our 12-month target price is ¥1,100, based on FY16E average EV/DACF for Asia tech firms (6.88X). Our target
price implies 5% upside.
Key risks
Downside: AC/housing sales shortfalls, sharp rise in auto-related fixed costs; Upside: unexpected white goods
growth, wider battery margins.
INVESTMENT LIST MEMBERSHIP
Neutral
Coverage View: Neutral
Growth
Returns *
Multiple
Volatility Volatility
Multiple
Returns *
Growth
Investment Profile
Low High
Percentile 20th 40th 60th 80th 100th
* Returns = Return on Capital For a complete description of the investment
profile measures please refer to the
disclosure section of this document.
Panasonic Corp. (6752.T)
Japan Internet, Games & Consumer Electronics Peer Group Average
Key data Current
Price (¥) 1,052
12 month price target (¥) 1,100
Market cap (¥bn) 2,441.6
SEC (¥bn) 3/16 3/17E 3/18E 3/19E
Revenue 7,553.7 7,460.1 7,999.7 8,512.7
yoy % chg. (2.1) (1.2) 7.2 6.4
Revenue CoE -- 7,600.0 -- --
Op. profit 415.7 343.7 408.9 434.8
Op. profit CoE -- 310.0 -- --
EPS (¥) 83.4 58.2 80.8 91.2
yoy % chg. 7.4 (30.2) 38.7 12.8
EPS CoE (¥) -- 62.5 -- --
P/E (X) 16.4 18.1 13.0 11.5
P/B (X) 1.9 1.4 1.3 1.2
EV/EBITDA (X) 3.3 3.6 3.1 2.9
CROCI (%) 5.2 8.7 10.0 10.4
EV/GCI (X) 0.6 0.4 0.4 0.4
1,150
1,250
1,350
1,450
1,550
1,650
1,750
1,850
800
900
1,000
1,100
1,200
1,300
1,400
1,500
Sep-15 Dec-15 Apr-16 Jul-16
Price performance chart
Panasonic Corp. (L) TOPIX (R)
Share price performance (%) 3 month 6 month 12 month
Absolute 12.0 2.7 (20.7)
Rel. to TOPIX 7.1 2.2 (14.3)
Source: Company data, Goldman Sachs Research estimates, FactSet. Price as of 9/21/2016 close.

September 27, 2016 Asia: Automobiles
Goldman Sachs Global Investment Research 39
Panasonic Corp.: Summary financials
Profit model (¥bn) 3/16 3/17E 3/18E 3/19E Balance sheet (¥bn) 3/16 3/17E 3/18E 3/19E
Revenue 7,553.7 7,460.1 7,999.7 8,512.7 Cash & equivalents 1,014.3 1,231.5 1,161.5 1,167.2
Cost of goods sold (5,340.0) (5,346.5) (5,820.8) (6,307.8) Accounts receivable 845.7 835.3 895.7 953.1
Gross profit 2,213.7 2,113.7 2,178.9 2,204.8 Inventory 756.4 747.1 801.1 852.5
SG&A and other (1,798.0) (1,770.0) (1,770.0) (1,770.0) Other current assets 437.9 437.9 437.9 437.9
Operating profit 415.7 343.7 408.9 434.8 Total current assets 3,054.4 3,251.8 3,296.2 3,410.7
Net interest income/(expense) 3.5 1.9 2.0 2.0 Net PP&E 1,301.2 1,359.3 1,405.8 1,443.0
Equity in earnings of affiliates 12.6 12.6 10.0 10.0 Net intangibles 630.0 630.0 630.0 630.0
Net other nonoperating inc/(exp) (202.2) (78.0) (80.0) (80.0) Total investments 179.5 192.0 202.0 212.0
Recurring profit -- -- -- -- Other long-term assets 432.0 432.0 432.0 432.0
Extraordinary income 0.0 0.0 0.0 0.0 Total assets 5,597.0 5,865.1 5,966.0 6,127.7
Extraordinary expense 0.0 0.0 0.0 0.0
Pretax profit 229.6 280.1 340.9 366.8 Accounts payable 942.2 943.4 1,027.1 1,113.0
Income tax (14.5) (114.6) (118.3) (120.2) Short-term debt 21.7 262.2 170.7 120.2
Minority interest (21.8) (30.4) (35.0) (35.0) Other current liabilities 1,416.9 1,416.9 1,416.9 1,416.9
Net income 193.3 135.2 187.5 211.6 Total current liabilities 2,380.9 2,622.5 2,614.7 2,650.1
Long-term debt 704.2 604.5 546.4 488.8
Capital expenditures (excl. leases) (241.8) (341.0) (341.0) (341.0) Other long-term liabilities 657.6 657.6 657.6 657.6
Capital expenditures (incl. leases) (241.8) (341.0) (341.0) (341.0) Total long-term liabilities 1,361.8 1,262.1 1,204.0 1,146.4
Depreciation & amortization (286.5) (282.9) (294.5) (303.8) Total liabilities 3,742.7 3,884.7 3,818.7 3,796.5
EPS (basic) (¥) 83.4 58.2 80.8 91.2 Minority interest 149.3 179.6 214.6 249.6
EPS (fully diluted) (¥) 83.4 58.2 80.8 91.1 Total common equity 1,705.1 1,800.8 1,932.6 2,081.5
Total liabilities & equity 5,597.0 5,865.1 5,966.0 6,127.7
BVPS (¥) 735.8 775.9 832.7 896.9
DPS (¥) 15.0 17.0 24.0 27.0 Net debt (288.3) (364.8) (444.3) (558.2)
Dividend payout ratio (%) 18.0 29.2 29.7 29.6
Ratios 3/16 3/17E 3/18E 3/19E
Year-on-year change (%) 3/16 3/17E 3/18E 3/19E
Revenue (2.1) (1.2) 7.2 6.4 CROCI (%) 5.2 8.7 10.0 10.4
Operating profit 8.8 (17.3) 19.0 6.3 ROE (%) 11.0 7.7 10.0 10.5
Recurring profit -- -- -- -- ROA (%) 3.3 2.4 3.2 3.5
Net income 7.7 (30.1) 38.7 12.8 Net debt/equity (%) (16.9) (20.3) (23.0) (26.8)
EPS (basic) 7.4 (30.2) 38.7 12.8 Interest coverage ratio (X) 24.4 NM NM NM
EPS (fully diluted) 7.4 (30.2) 38.7 12.8
Valuation 3/16 3/17E 3/18E 3/19E
Margins (%) 3/16 3/17E 3/18E 3/19E
Operating profit 5.5 4.6 5.1 5.1 P/E (X) 16.4 18.1 13.0 11.5
EBITDA 9.3 8.4 8.8 8.7 EV/EBITDA (X) 3.3 3.6 3.1 2.9
Recurring profit NM NM NM NM EV/GCI (X) 0.6 0.4 0.4 0.4
Net income 2.6 1.8 2.3 2.5 P/B (X) 1.9 1.4 1.3 1.2
Dividend yield (%) 1.1 1.6 2.3 2.6
Cash flow statement (¥bn) 3/16 3/17E 3/18E 3/19E FCF yield (%) 4.7 4.4 5.1 6.6
Net income 193.3 135.2 187.5 211.6
D&A add-back 286.5 282.9 294.5 303.8
Minority interest add-back 21.8 30.4 35.0 35.0
Net (inc)/dec in working capital 136.5 21.0 (30.7) (22.9)
Other operating cash flow (239.4) (12.6) (10.0) (10.0)
Cash flow from operations 398.7 456.9 476.3 517.5
Capital expenditures (incl. leases) (241.8) (341.0) (341.0) (341.0)
Purchases of long-term securities (30.7) 0.0 0.0 0.0
Sales of long-term securities 0.0 0.0 0.0 0.0
Other investing cash flow (1.7) 0.0 0.0 0.0
Cash flow from investments (274.3) (341.0) (341.0) (341.0)
Dividends paid (common & preferred) (34.8) (39.5) (55.7) (62.7)
Incr./(decr.) in debt (247.0) 140.8 (149.6) (108.1)
Common stock issuance (0.1) 0.0 0.0 0.0
Other financing cash flow (108.7) 0.0 0.0 0.0
Cash flow from financing (390.6) 101.4 (205.3) (170.8) Note: Last actual year may include reported and estimated data.
Total cash flow (266.1) 217.3 (70.1) 5.7 Source: Company data, Goldman Sachs Research estimates.

September 27, 2016 Asia: Automobiles
Goldman Sachs Global Investment Research 40
Toyota: Leading all-solid-state battery development, but Neutral on stiff competition
What's changed
Toyota, which pioneered the shift to hybrid technology in 1997 with the launch of the Prius, the world’s first
mass-produced hybrid vehicle, is the dominant market leader in nickel-metal hydride (Ni-MH) batteries for
automotive applications. Primearth EV Energy (PEVE), a joint venture between Toyota (80%) and Panasonic
(20%), is a core supplier of Ni-MH batteries, but also produces some lithium-ion batteries (LIBs), albeit on a very
small scale (we estimate production capacity of 1 GWh or less). We believe Toyota’s view on existing LIBs is that
they do not provide customers with sufficient product value, and that it is now focusing on all-solid-state
batteries as a next-generation replacement. In short, we believe the company considers investing significant
amounts in existing LIB technologies as a risk. In March 2016, Toyota and the Tokyo Institute of Technology
jointly announced the successful development of an all-solid-state battery with a high energy density, achieved
through the use of a new electrolyte (with high ionic conductivity). The announcement also trumpeted a major
reduction in battery charging time, hinting at the significant potential of all-solid-state battery technologies.
Implications
We stay Neutral. Near term, we see signs of a peak-out in the North American market, a key earnings source, and
downward pressure on margins from stiffer competition, even for Toyota. In the medium term, however, we
believe Toyota is one of few automakers able to invest actively in next-generation technologies due to its strong
funding position (we estimate Toyota will have c.¥9tn in funds available for investment over the medium term).
We believe Toyota could gain a technological advantage in the battery field, assuming it can achieve a
breakthrough in all-solid-state battery development.
Valuation
Our 12-month target price of ¥6,400 is based on FY3/18E P/B vs. ROE correlation. Our P/B vs. ROE-implied P/B
multiple is 1.0x in FY3/18E.
Key risks
Risks include forex swings, and stiffer competition in the US market. In the battery business, a key risk is weaker
competitiveness if all-solid-state battery development proves difficult, or prices of existing LIBs decline rapidly.
INVESTMENT LIST MEMBERSHIP
Neutral
Coverage View: Neutral
Growth
Returns *
Multiple
Volatility Volatility
Multiple
Returns *
Growth
Investment Profile
Low High
Percentile 20th 40th 60th 80th 100th
* Returns = Return on Capital For a complete description of the investment
profile measures please refer to the
disclosure section of this document.
Toyota Motor (7203.T)
Japan Automobiles Peer Group Average
Key data Current
Price (¥) 6,144
12 month price target (¥) 6,400
Market cap (¥bn) 19,457.3
SEC (¥bn) 3/16 3/17E 3/18E 3/19E
Revenue 28,403.1 26,470.0 26,700.0 27,100.0
yoy % chg. 4.3 (6.8) 0.9 1.5
Revenue CoE -- 26,000.0 -- --
Op. profit 2,854.0 1,850.0 2,000.0 2,150.0
Op. profit CoE -- 1,600.0 -- --
EPS (¥) 741.4 511.5 557.1 607.6
yoy % chg. 7.8 (31.0) 8.9 9.1
EPS CoE (¥) -- 474.2 -- --
P/E (X) 10.1 12.0 11.0 10.1
P/B (X) 1.4 1.1 1.0 0.9
EV/EBITDA (X) 3.3 3.9 2.9 2.0
CROCI (%) 14.1 11.4 10.8 10.7
EV/GCI (X) 0.5 0.3 0.2 0.1
1,150
1,250
1,350
1,450
1,550
1,650
1,750
1,850
4,500
5,000
5,500
6,000
6,500
7,000
7,500
8,000
Sep-15 Dec-15 Apr-16 Jul-16
Price performance chart
Toyota Motor (L) TOPIX (R)
Share price performance (%) 3 month 6 month 12 month
Absolute 9.0 4.3 (15.1)
Rel. to TOPIX 4.3 3.8 (8.2)
Source: Company data, Goldman Sachs Research estimates, FactSet. Price as of 9/21/2016 close.

September 27, 2016 Asia: Automobiles
Goldman Sachs Global Investment Research 41
Toyota Motor: Summary financials
Profit model (¥bn) 3/16 3/17E 3/18E 3/19E Balance sheet (¥bn) 3/16 3/17E 3/18E 3/19E
Revenue 28,403.1 26,470.0 26,700.0 27,100.0 Cash & equivalents 5,482.9 6,402.5 7,886.5 9,455.0
Cost of goods sold (21,456.1) (20,694.1) (20,753.6) (20,968.1) Accounts receivable 2,000.1 1,860.0 1,880.0 1,910.0
Gross profit 6,947.0 5,775.9 5,946.4 6,131.9 Inventory 2,061.5 1,920.0 1,940.0 1,970.0
SG&A and other (4,093.1) (3,925.9) (3,946.4) (3,981.9) Other current assets 8,665.0 9,051.4 9,344.1 9,113.7
Operating profit 2,854.0 1,850.0 2,000.0 2,150.0 Total current assets 18,209.6 19,233.9 21,050.6 22,448.7
Net interest income/(expense) 122.5 111.0 111.0 115.0 Net PP&E 9,740.4 9,901.2 9,848.2 9,850.5
Equity in earnings of affiliates 329.1 340.0 340.0 350.0 Net intangibles 0.0 0.0 0.0 0.0
Net other nonoperating inc/(exp) 7.0 13.0 13.0 13.0 Total investments 10,071.4 10,815.4 11,633.8 12,534.0
Recurring profit -- -- -- -- Other long-term assets 9,406.2 7,930.2 6,698.6 4,624.7
Extraordinary income 0.0 0.0 0.0 0.0 Total assets 47,427.6 47,880.7 49,231.2 49,457.9
Extraordinary expense 0.0 0.0 0.0 0.0
Pretax profit 2,983.4 1,974.0 2,124.0 2,278.0 Accounts payable 2,389.5 2,226.9 2,246.2 2,279.9
Income tax (878.3) (674.0) (718.0) (766.0) Short-term debt 704.2 714.2 724.2 734.2
Minority interest (121.5) (127.0) (131.0) (136.0) Other current liabilities 13,030.8 13,284.8 13,447.4 13,087.0
Net income 2,312.7 1,513.0 1,615.0 1,726.0 Total current liabilities 16,124.5 16,225.8 16,417.8 16,101.0
Long-term debt 584.8 589.8 594.8 599.8
Capital expenditures (excl. leases) (1,292.5) (1,340.0) (1,200.0) (1,300.0) Other long-term liabilities 12,630.2 13,077.3 13,379.1 12,948.6
Capital expenditures (incl. leases) (1,292.5) (1,340.0) (1,200.0) (1,300.0) Total long-term liabilities 13,215.0 13,667.1 13,973.9 13,548.4
Depreciation & amortization (885.1) (920.0) (990.0) (1,040.0) Total liabilities 29,339.4 29,893.0 30,391.7 29,649.5
EPS (basic) (¥) 741.4 511.5 557.1 607.6 Minority interest 861.5 802.8 809.8 821.9
EPS (fully diluted) (¥) 741.4 511.5 557.1 607.6 Total common equity 16,746.9 17,184.9 18,029.6 18,986.5
Total liabilities & equity 47,427.6 47,880.7 49,231.2 49,457.9
BVPS (¥) 5,368.4 5,809.8 6,219.8 6,683.6
DPS (¥) 210.0 210.0 210.0 210.0 Net debt (2,239.6) (3,144.0) (4,613.0) (6,166.0)
Dividend payout ratio (%) 28.3 41.1 37.7 34.6
Ratios 3/16 3/17E 3/18E 3/19E
Year-on-year change (%) 3/16 3/17E 3/18E 3/19E
Revenue 4.3 (6.8) 0.9 1.5 CROCI (%) 14.1 11.4 10.8 10.7
Operating profit 3.8 (35.2) 8.1 7.5 ROE (%) 12.9 8.4 8.8 8.9
Recurring profit -- -- -- -- ROA (%) 4.9 3.2 3.3 3.5
Net income 6.4 (34.6) 6.7 6.9 Net debt/equity (%) (12.4) (17.5) (24.5) (31.1)
EPS (basic) 7.8 (31.0) 8.9 9.1 Interest coverage ratio (X) 80.6 50.0 52.6 59.7
EPS (fully diluted) 7.8 (31.0) 8.9 9.1
Valuation 3/16 3/17E 3/18E 3/19E
Margins (%) 3/16 3/17E 3/18E 3/19E
Operating profit 10.0 7.0 7.5 7.9 P/E (X) 10.1 12.0 11.0 10.1
EBITDA 13.2 10.5 11.2 11.8 EV/EBITDA (X) 3.3 3.9 2.9 2.0
Recurring profit NM NM NM NM EV/GCI (X) 0.5 0.3 0.2 0.1
Net income 8.1 5.7 6.0 6.4 P/B (X) 1.4 1.1 1.0 0.9
Dividend yield (%) 2.8 3.4 3.4 3.4
Cash flow statement (¥bn) 3/16 3/17E 3/18E 3/19E FCF yield (%) 13.1 12.5 12.4 12.6
Net income 2,312.7 1,513.0 1,615.0 1,726.0
D&A add-back 885.1 920.0 990.0 1,040.0
Minority interest add-back 121.5 127.0 131.0 136.0
Net (inc)/dec in working capital 163.5 119.0 (20.7) (26.3)
Other operating cash flow 978.0 1,027.5 785.1 730.8
Cash flow from operations 4,460.9 3,706.5 3,500.4 3,606.5
Capital expenditures (incl. leases) (1,292.5) (1,340.0) (1,200.0) (1,300.0)
Purchases of long-term securities 0.0 0.0 0.0 0.0
Sales of long-term securities 0.0 0.0 0.0 0.0
Other investing cash flow (1,890.0) (1,067.1) (977.8) (1,293.2)
Cash flow from investments (3,182.5) (2,407.1) (2,177.8) (2,593.2)
Dividends paid (common & preferred) (779.1) (621.2) (608.7) (596.6)
Incr./(decr.) in debt 658.8 454.3 574.2 1,024.8
Common stock issuance (778.2) (450.0) (160.0) (170.0)
Other financing cash flow 474.9 237.0 356.0 297.0
Cash flow from financing (423.6) (379.8) 161.5 555.2 Note: Last actual year may include reported and estimated data.
Total cash flow 854.7 919.6 1,484.1 1,568.5 Source: Company data, Goldman Sachs Research estimates.

September 27, 2016 Asia: Automobiles
Goldman Sachs Global Investment Research 42
Toray: No. 2 supplier of LiB separators globally, further expansion underway; Neutral
What's changed
Toray Industries’ wholly-owned subsidiary, Toray Battery Separator Film, is the world’s No. 2 supplier of lithium-
ion battery (LiB) separators after Asahi Kasei Group. Back in 1984, TonenGeneral Group’s predecessor Toa
Nenryo Kogyo commenced research into separators. In 2010, TonenGeneral formed a 50:50 joint venture with
Toray, which became a wholly owned subsidiary of the latter in January 2012. The JV has two manufacturing
bases, one in Japan (Nasu) and one in Korea, which account for 0.27bn m2 capacity (GS estimate). The company
already announced a plan to expand its Korea production by 30% by the end of 2017 and we expect total capacity
will reach over 0.3bn m2 by 2017.
Toray Battery Separator Film’s Setela separators are manufactured using the wet-type biaxial stretching method,
and at present most sales are for consumer electronics applications. Although the company itself does not
disclose detailed sales figures, based on rival manufacturers’ data, we surmise that separator sales came to about
¥25.0 bn in FY3/16 (about 1.2% of Toray’s consolidated sales). Converting Toray Battery Separator Film into a
wholly-owned subsidiary resulted in goodwill of ¥31.0 bn, which is being amortized over ten years under the
straight-line method, eroding profit by ¥3.1 bn annually. However, according to Toray, the separator business is
profitable even after goodwill amortization. Apparently, both sales and profit continued to grow in 1Q FY3/17.
Although there also has been no disclosure in terms of its customer base, the Nikkei (Sept 9) reported that Toray
has begun supplying Sumitomo Chemical with separator substrates.
Implications
The absence of any signs of a slowdown in demand for aircraft-use carbon fiber is a positive, but the outlook is
highly uncertain for a number of other businesses, including overseas apparel-use fibers, LCD materials, and
carbon fiber for non-aviation applications. We continue to regard full-year guidance as somewhat aggressive, and
we stay Neutral.
Valuation
Our 12-month target price of ¥1,000 is based on FY16E materials’ sector average EV/GCI vs. CROCI/WACC
(implies P/B of 1.6X, P/E of 16X).
Key risks
Key risks include oil price and forex fluctuations, and Boeing 787 production trends.
INVESTMENT LIST MEMBERSHIP
Neutral
Coverage View: Neutral
Growth
Returns *
Multiple
Volatility Volatility
Multiple
Returns *
Growth
Investment Profile
Low High
Percentile 20th 40th 60th 80th 100th
* Returns = Return on Capital For a complete description of the investment
profile measures please refer to the
disclosure section of this document.
Toray Industries (3402.T)
Japan Chemicals & Fibers Peer Group Average
Key data Current
Price (¥) 986
12 month price target (¥) 1,000
Market cap (¥bn) 1,576.9
Local GAAP (¥bn) 3/16 3/17E 3/18E 3/19E
Revenue 2,104.4 2,154.8 2,201.4 2,243.1
yoy % chg. 4.7 2.4 2.2 1.9
Revenue CoE -- 2,160.0 -- --
Op. profit 154.5 160.0 170.0 179.0
Op. profit CoE -- 170.0 -- --
EPS (¥) 56.4 61.0 66.0 69.8
yoy % chg. 26.9 8.1 8.2 5.8
EPS CoE (¥) -- 65.7 -- --
P/E (X) 18.2 16.2 14.9 14.1
P/B (X) 1.7 1.5 1.4 1.3
EV/EBITDA (X) 9.3 9.0 8.5 8.0
CROCI (%) 6.7 5.3 5.3 5.4
EV/GCI (X) 0.7 0.6 0.6 0.6
1,150
1,250
1,350
1,450
1,550
1,650
1,750
850
900
950
1,000
1,050
1,100
1,150
Sep-15 Dec-15 Apr-16 Jul-16
Price performance chart
Toray Industries (L) TOPIX (R)
Share price performance (%) 3 month 6 month 12 month
Absolute 6.7 5.5 (3.2)
Rel. to TOPIX 2.0 4.9 4.6
Source: Company data, Goldman Sachs Research estimates, FactSet. Price as of 9/21/2016 close.

September 27, 2016 Asia: Automobiles
Goldman Sachs Global Investment Research 43
Toray Industries: Summary financials
Profit model (¥bn) 3/16 3/17E 3/18E 3/19E Balance sheet (¥bn) 3/16 3/17E 3/18E 3/19E
Revenue 2,104.4 2,154.8 2,201.4 2,243.1 Cash & equivalents 120.2 99.7 75.6 84.3
Cost of goods sold (1,662.6) (1,700.5) (1,730.7) (1,757.7) Accounts receivable 402.2 411.8 420.8 428.7
Gross profit 441.9 454.3 470.7 485.4 Inventory 394.0 403.0 410.2 416.6
SG&A and other (287.4) (294.3) (300.7) (306.4) Other current assets 93.1 93.1 93.1 93.1
Operating profit 154.5 160.0 170.0 179.0 Total current assets 1,009.6 1,007.7 999.7 1,022.7
Net interest income/(expense) (3.8) (5.7) (5.2) (4.9) Net PP&E 830.6 913.6 949.7 982.5
Equity in earnings of affiliates 5.0 8.7 10.0 10.0 Net intangibles 87.2 87.2 87.2 87.2
Net other nonoperating inc/(exp) -- -- -- -- Total investments 256.0 264.7 274.7 284.7
Recurring profit 150.2 160.0 171.9 181.4 Other long-term assets 95.0 95.0 95.0 95.0
Extraordinary income 0.0 0.0 0.0 0.0 Total assets 2,278.4 2,368.2 2,406.3 2,472.1
Extraordinary expense 0.0 0.0 0.0 0.0
Pretax profit 137.8 150.0 161.9 171.4 Accounts payable 213.1 218.0 221.9 225.3
Income tax (40.6) (45.2) (48.6) (51.6) Short-term debt 190.5 247.3 174.1 144.3
Minority interest (7.1) (7.3) (7.8) (8.2) Other current liabilities 167.7 167.7 167.7 167.7
Net income 90.1 97.5 105.5 111.6 Total current liabilities 571.3 633.1 563.7 537.4
Long-term debt 510.3 456.0 474.2 472.1
Capital expenditures (excl. leases) -- -- -- -- Other long-term liabilities 171.8 171.8 171.8 171.8
Capital expenditures (incl. leases) (129.2) (175.0) (130.0) (130.0) Total long-term liabilities 682.1 627.8 646.0 643.9
Depreciation & amortization (86.8) (92.0) (93.9) (97.2) Total liabilities 1,253.5 1,260.9 1,209.7 1,181.3
EPS (basic) (¥) 56.4 61.0 66.0 69.8 Minority interest 78.2 85.5 93.3 101.5
EPS (fully diluted) (¥) 56.4 61.0 66.0 69.8 Total common equity 946.7 1,021.9 1,103.4 1,189.4
Total liabilities & equity 2,278.4 2,368.2 2,406.3 2,472.1
BVPS (¥) 592.2 639.0 690.0 743.8
DPS (¥) 13.0 14.0 15.0 16.0 Net debt 580.6 603.7 572.7 532.2
Dividend payout ratio (%) 23.1 23.0 22.7 22.9
Ratios 3/16 3/17E 3/18E 3/19E
Year-on-year change (%) 3/16 3/17E 3/18E 3/19E
Revenue 4.7 2.4 2.2 1.9 CROCI (%) 6.7 5.3 5.3 5.4
Operating profit 25.1 3.6 6.3 5.3 ROE (%) 8.6 9.1 9.2 9.0
Recurring profit 16.8 6.5 7.4 5.5 ROA (%) 3.9 4.2 4.4 4.6
Net income 26.9 8.2 8.2 5.8 Net debt/equity (%) 56.7 54.5 47.9 41.2
EPS (basic) 26.9 8.1 8.2 5.8 Interest coverage ratio (X) 28.9 22.9 26.2 28.9
EPS (fully diluted) 26.9 8.1 8.2 5.8
Valuation 3/16 3/17E 3/18E 3/19E
Margins (%) 3/16 3/17E 3/18E 3/19E
Operating profit 7.3 7.4 7.7 8.0 P/E (X) 18.2 16.2 14.9 14.1
EBITDA 11.5 11.7 12.0 12.3 EV/EBITDA (X) 9.3 9.0 8.5 8.0
Recurring profit 7.1 7.4 7.8 8.1 EV/GCI (X) 0.7 0.6 0.6 0.6
Net income 4.3 4.5 4.8 5.0 P/B (X) 1.7 1.5 1.4 1.3
Dividend yield (%) 1.3 1.4 1.5 1.6
Cash flow statement (¥bn) 3/16 3/17E 3/18E 3/19E FCF yield (%) 3.9 0.0 3.3 3.9
Net income 90.1 97.5 105.5 111.6
D&A add-back 86.8 92.0 93.9 97.2
Minority interest add-back 7.1 7.3 7.8 8.2
Net (inc)/dec in working capital (36.5) (13.8) (12.2) (10.9)
Other operating cash flow 48.6 (8.7) (10.0) (10.0)
Cash flow from operations 196.1 174.3 185.0 196.1
Capital expenditures (incl. leases) (129.2) (175.0) (130.0) (130.0)
Purchases of long-term securities 0.0 0.0 0.0 0.0
Sales of long-term securities 0.0 0.0 0.0 0.0
Other investing cash flow (25.2) 0.0 0.0 0.0
Cash flow from investments (154.4) (175.0) (130.0) (130.0)
Dividends paid (common & preferred) (20.8) (22.4) (24.0) (25.6)
Incr./(decr.) in debt (22.0) 2.5 (55.1) (31.8)
Common stock issuance 0.2 0.0 0.0 0.0
Other financing cash flow 4.8 0.0 0.0 0.0
Cash flow from financing (37.8) (19.8) (79.1) (57.4) Note: Last actual year may include reported and estimated data.
Total cash flow 4.0 (20.5) (24.1) 8.7 Source: Company data, Goldman Sachs Research estimates.
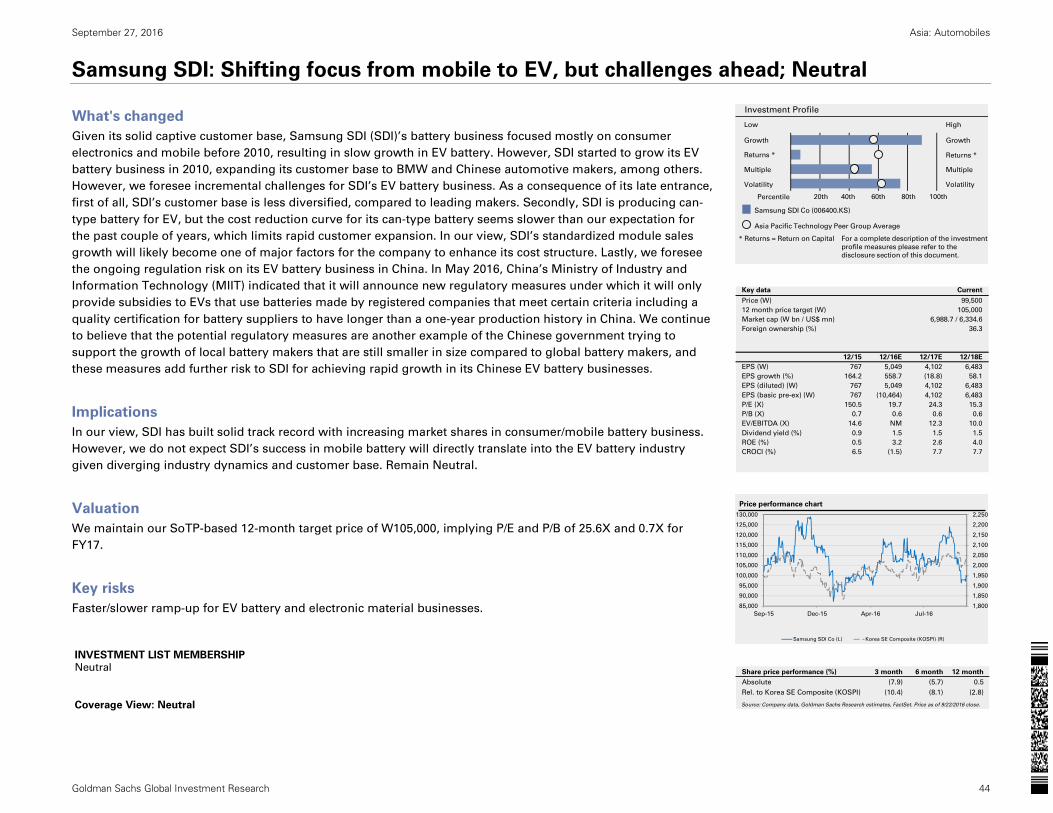
September 27, 2016 Asia: Automobiles
Goldman Sachs Global Investment Research 44
Samsung SDI: Shifting focus from mobile to EV, but challenges ahead; Neutral
What's changed
Given its solid captive customer base, Samsung SDI (SDI)’s battery business focused mostly on consumer
electronics and mobile before 2010, resulting in slow growth in EV battery. However, SDI started to grow its EV
battery business in 2010, expanding its customer base to BMW and Chinese automotive makers, among others.
However, we foresee incremental challenges for SDI’s EV battery business. As a consequence of its late entrance,
first of all, SDI’s customer base is less diversified, compared to leading makers. Secondly, SDI is producing can-
type battery for EV, but the cost reduction curve for its can-type battery seems slower than our expectation for
the past couple of years, which limits rapid customer expansion. In our view, SDI’s standardized module sales
growth will likely become one of major factors for the company to enhance its cost structure. Lastly, we foresee
the ongoing regulation risk on its EV battery business in China. In May 2016, China’s Ministry of Industry and
Information Technology (MIIT) indicated that it will announce new regulatory measures under which it will only
provide subsidies to EVs that use batteries made by registered companies that meet certain criteria including a
quality certification for battery suppliers to have longer than a one-year production history in China. We continue
to believe that the potential regulatory measures are another example of the Chinese government trying to
support the growth of local battery makers that are still smaller in size compared to global battery makers, and
these measures add further risk to SDI for achieving rapid growth in its Chinese EV battery businesses.
Implications
In our view, SDI has built solid track record with increasing market shares in consumer/mobile battery business.
However, we do not expect SDI’s success in mobile battery will directly translate into the EV battery industry
given diverging industry dynamics and customer base. Remain Neutral.
Valuation
We maintain our SoTP-based 12-month target price of W105,000, implying P/E and P/B of 25.6X and 0.7X for
FY17.
Key risks
Faster/slower ramp-up for EV battery and electronic material businesses.
INVESTMENT LIST MEMBERSHIP
Neutral
Coverage View: Neutral
Growth
Returns *
Multiple
Volatility Volatility
Multiple
Returns *
Growth
Investment Profile
Low High
Percentile 20th 40th 60th 80th 100th
* Returns = Return on Capital For a complete description of the investment
profile measures please refer to the
disclosure section of this document.
Samsung SDI Co (006400.KS)
Asia Pacific Technology Peer Group Average
Key data Current
Price (W) 99,500
12 month price target (W) 105,000
Market cap (W bn / US$ mn) 6,988.7 / 6,334.6
Foreign ownership (%) 36.3
12/15 12/16E 12/17E 12/18E
EPS (W) 767 5,049 4,102 6,483
EPS growth (%) 164.2 558.7 (18.8) 58.1
EPS (diluted) (W) 767 5,049 4,102 6,483
EPS (basic pre-ex) (W) 767 (10,464) 4,102 6,483
P/E (X) 150.5 19.7 24.3 15.3
P/B (X) 0.7 0.6 0.6 0.6
EV/EBITDA (X) 14.6 NM 12.3 10.0
Dividend yield (%) 0.9 1.5 1.5 1.5
ROE (%) 0.5 3.2 2.6 4.0
CROCI (%) 6.5 (1.5) 7.7 7.7
1,800
1,850
1,900
1,950
2,000
2,050
2,100
2,150
2,200
2,250
85,000
90,000
95,000
100,000
105,000
110,000
115,000
120,000
125,000
130,000
Sep-15 Dec-15 Apr-16 Jul-16
Price performance chart
Samsung SDI Co (L) Korea SE Composite (KOSPI) (R)
Share price performance (%) 3 month 6 month 12 month
Absolute (7.9) (5.7) 0.5
Rel. to Korea SE Composite (KOSPI) (10.4) (8.1) (2.8)
Source: Company data, Goldman Sachs Research estimates, FactSet. Price as of 9/22/2016 close.

September 27, 2016 Asia: Automobiles
Goldman Sachs Global Investment Research 45
Samsung SDI Co: Summary financials
Profit model (W bn) 12/15 12/16E 12/17E 12/18E Balance sheet (W bn) 12/15 12/16E 12/17E 12/18E
Total revenue 7,569.3 5,383.0 6,264.4 7,098.5 Cash & equivalents 1,288.0 1,383.1 1,082.8 802.7
Cost of goods sold (6,186.2) (4,524.9) (5,021.5) (5,578.5) Accounts receivable 921.7 684.2 752.3 858.5
SG&A (872.0) (1,066.0) (530.1) (631.0) Inventory 750.0 553.9 603.8 677.5
R&D (571.0) (567.5) (597.5) (646.8) Other current assets 1,814.3 2,356.9 1,818.7 1,193.3
Other operating profit/(expense) 0.0 0.0 0.0 0.0 Total current assets 4,773.9 4,978.1 4,257.6 3,532.0
EBITDA 603.6 (309.7) 604.2 764.9 Net PP&E 3,229.0 2,823.1 3,533.4 4,218.2
Depreciation & amortization (663.4) (465.7) (488.9) (522.6) Net intangibles 1,277.6 978.6 1,037.0 1,097.7
EBIT (59.8) (775.4) 115.3 242.3 Total investments 5,172.9 5,351.7 5,656.3 6,121.0
Interest income 33.0 42.0 45.7 36.8 Other long-term assets 1,771.9 1,978.3 1,900.4 1,825.5
Interest expense (46.8) (44.4) (42.3) (41.3) Total assets 16,225.3 16,109.8 16,384.7 16,794.4
Income/(loss) from uncons. subs. 279.9 144.8 304.7 464.7
Others (167.2) (153.4) (71.3) (127.3) Accounts payable 378.1 415.4 452.9 508.1
Pretax profits 39.1 (786.5) 352.1 575.1 Short-term debt 1,047.2 711.0 681.0 651.0
Income tax (13.4) 32.1 (88.0) (143.8) Other current liabilities 1,776.0 1,733.5 1,733.5 1,733.5
Minorities 28.2 19.4 24.0 24.0 Total current liabilities 3,201.3 2,859.9 2,867.4 2,892.7
Long-term debt 702.5 623.3 623.3 623.3
Net income pre-preferred dividends 53.8 (735.0) 288.1 455.3 Other long-term liabilities 1,068.3 1,328.5 1,437.2 1,495.6
Preferred dividends 0.0 0.0 0.0 0.0 Total long-term liabilities 1,770.8 1,951.9 2,060.6 2,118.9
Net income (pre-exceptionals) 53.8 (735.0) 288.1 455.3 Total liabilities 4,972.1 4,811.8 4,928.0 5,011.6
Post-tax exceptionals 0.0 1,089.6 0.0 0.0
Net income 53.8 354.7 288.1 455.3 Preferred shares 8.2 8.2 8.2 8.2
Total common equity 11,003.8 11,050.0 11,232.7 11,582.7
EPS (basic, pre-except) (W) 767 (10,464) 4,102 6,483 Minority interest 241.2 239.8 215.8 191.8
EPS (basic, post-except) (W) 767 5,049 4,102 6,483
EPS (diluted, post-except) (W) 767 5,049 4,102 6,483 Total liabilities & equity 16,225.3 16,109.8 16,384.7 16,794.4
DPS (W) 1,000 1,500 1,500 1,500
Dividend payout ratio (%) 130.4 29.7 36.6 23.1 BVPS (W) 156,664 157,322 159,924 164,907
Free cash flow yield (%) 2.1 (12.2) (0.1) 0.3
Growth & margins (%) 12/15 12/16E 12/17E 12/18E Ratios 12/15 12/16E 12/17E 12/18E
Sales growth 38.3 (28.9) 16.4 13.3 CROCI (%) 6.5 (1.5) 7.7 7.7
EBITDA growth 0.0 (151.3) 295.1 26.6 ROE (%) 0.5 3.2 2.6 4.0
EBIT growth (184.5) NM 114.9 110.1 ROA (%) 0.3 2.2 1.8 2.7
Net income growth 164.2 558.7 (18.8) 58.1 ROACE (%) 0.3 (6.5) 2.3 3.6
EPS growth 164.2 558.7 (18.8) 58.1 Inventory days 44.8 52.6 42.1 41.9
Gross margin 18.3 15.9 19.8 21.4 Receivables days 42.5 54.4 41.8 41.4
EBITDA margin 8.0 (5.8) 9.6 10.8 Payable days 22.5 32.0 31.6 31.4
EBIT margin (0.8) (14.4) 1.8 3.4 Net debt/equity (%) 4.1 (0.4) 1.9 4.0
Interest cover - EBIT (X) NM NM NM 53.9
Cash flow statement (W bn) 12/15 12/16E 12/17E 12/18E Valuation 12/15 12/16E 12/17E 12/18E
Net income pre-preferred dividends 53.8 (735.0) 288.1 455.3
D&A add-back 663.4 465.7 488.9 522.6 P/E (analyst) (X) 150.5 19.7 24.3 15.3
Minorities interests add-back (28.2) (19.4) (24.0) (24.0) P/B (X) 0.7 0.6 0.6 0.6
Net (inc)/dec working capital (68.9) 470.8 (80.5) (124.7) EV/EBITDA (X) 14.6 NM 12.3 10.0
Other operating cash flow 260.8 (1,024.4) 420.2 294.0 EV/GCI (X) 0.6 0.5 0.5 0.5
Cash flow from operations 881.1 247.4 1,092.7 1,123.3 Dividend yield (%) 0.9 1.5 1.5 1.5
Capital expenditures (705.4) (1,132.5) (1,100.0) (1,100.0)
Acquisitions 0.0 (1,194.5) 0.0 0.0
Divestitures 638.6 0.0 0.0 0.0
Others 182.2 2,627.9 (157.6) (168.1)
Cash flow from investments 115.3 300.9 (1,257.6) (1,268.1)
Dividends paid (common & pref) (70.3) (70.2) (105.4) (105.4)
Inc/(dec) in debt (28.2) (415.3) (30.0) (30.0)
Common stock issuance (repurchase) 0.0 0.0 0.0 0.0
Other financing cash flows (237.5) 32.3 0.0 0.0
Cash flow from financing (336.0) (453.2) (135.4) (135.4)
Total cash flow 660.4 95.1 (300.3) (280.1) Note: Last actual year may include reported and estimated data.
Source: Company data, Goldman Sachs Research estimates.

September 27, 2016 Asia: Automobiles
Goldman Sachs Global Investment Research 46

September 27, 2016 Asia: Automobiles
Goldman Sachs Global Investment Research 47
Other beneficiaries
Other beneficiaries
Other beneficiaries

September 27, 2016 Asia: Automobiles
Goldman Sachs Global Investment Research 48
Asahi Kasei (3407.T, Not Covered): Expertise in both dry-type and wet-type separators
Asahi Kasei is a diversified chemicals maker established in 1922. It reported sales of ¥1,940.9 bn, operating profit of ¥165.2 bn, and
an operating margin of 8.5% in FY15. Sales weightings were 52% for the material group, 33% for homes and 15% for health care,
with the separator business forming part of the material group’s electronics segment. In FY15, the electronics segment generated
sales of ¥121.6 bn, operating profit of ¥4.4 bn, and an operating margin of 3.6%, while FY16 guidance is for sales of ¥137.0 bn and an
operating loss of ¥2.5 bn (including goodwill amortization associated with an acquisition). Previously, Asahi Kasei mainly developed
wet-type separators, but with the August 2015 acquisition of Polypore, it now also offers the Celgard dry-type separator. As of 2015,
Asahi Kasei dominated rivals, with a global market share of 45% in wet-type separators. The company aims to cater to diverse
customer needs given it is one of the few companies with both wet-type and dry-type technologies. According to Asahi Kasei, wet-
type and dry-type separators will each account for about 50% of overall demand in the medium term.
Tanaka Chemical (4080.T, Not Covered): Specialist cathode precursor manufacturer
Tanaka Chemical is a specialist manufacturer of cathode precursors for lithium-ion and nickel-metal hydride (NiMH) batteries. In
FY15, it had sales of ¥15.3 bn and an operating loss of ¥0.3 bn. Just under 10% of unit sales were for use in NiMH batteries for
consumer electronics applications and just over 10% were for use in NiMH batteries for automotive applications. Precursors for
lithium-ion batteries used in consumer electronics account for roughly 50% of unit sales, and those for automotive lithium-ion
batteries make up the remaining 30% or so. In recent years, the sales weighting for automotive lithium-ion battery cathode
precursors has been rising. Tanaka Chemical sees the lithium-ion battery market expanding from 60GWh in 2015 to 210GWh in 2025,
in line with which it looks for the cathode material market to grow from 80,000t to 260,000t. The company’s balance sheet
deteriorated somewhat after some large-scale capex in 2011 and a subsequent fall in the market, however on 31 August 2016, it
announced plans to raise capital by issuing new shares via a private placement to Sumitomo Chemical. This would take Sumitomo
Chemical’s stake in Tanaka Chemical to 50.1%. The two have been collaborating already for development of next-generation nickel-
cobalt-manganese (NCM) cathode materials with a nickel weighting as high as 90%, which should contribute to further increasing
batteries’ energy density.
W Scope (6619.T, Not Covered): Dedicated wet-type separator manufacturer
W Scope is a dedicated manufacturer of wet-type separators for lithium-ion batteries. It reported sales of ¥7.5 bn, operating profit of
¥1.9 bn, and an operating margin of 26% in FY15. At present 65% of sales are for use in consumer electronics, with automotive
applications making up the remaining 35%; however, over the next three to five years, W Scope aims for automotive applications to
have a larger sales weighting. Of the company’s sales, 58% are to Chinese companies, with Korea’s LG Group accounting for a
further 22%, A123 for 10%, and Xalt for 6%. W Scope uses a sequential stretching method to manufacture its polymer film, as
opposed to the simultaneous stretching method commonly used. According to its latest medium-term plan unveiled on 9 August
2016, the company is targeting sales of ¥10 bn in FY16, ¥13 bn in FY17, and ¥17 bn in FY18. Management has also expressed
confidence in achieving an operating margin of 20% or greater by 2025. Furthermore, W Scope seeks to attain a global market share
of 8% or higher in 2016, 15% in 2020, and 20% in 2026.

September 27, 2016 Asia: Automobiles
Goldman Sachs Global Investment Research 49
Hitachi Zosen (7004.T, Not Covered): Focused on all-solid-state batteries
Hitachi Zosen is a machinery manufacturer whose core business is environmental systems. In FY15, the company had sales of
¥387.0 bn, operating profit of ¥15.1 bn, and an operating margin of 3.9%. While the environmental systems & industrial plants
segment generated sales of ¥241.6 bn and the machinery segment ¥104.5 bn, the former delivered operating profit of ¥14.8 bn,
accounting for the majority of consolidated earnings. Hitachi Zosen is focusing on solid-state batteries as a potential application for
the mechanical press technologies it has built up over the years. It already has developed a sample product with energy density of
200Wh/kg, with a lithium transition-metal oxide cathode and sulfur solid electrolyte. As yet, solid-state batteries make almost no
contribution to sales. To enable mass production, Hitachi Zosen believes it needs to establish a low-cost manufacturing process, and
it plans to persist with its efforts to develop the technology for pressure-forming machinery for this purpose.

September 27, 2016 Asia: Automobiles
Goldman Sachs Global Investment Research 50
Appendix
Appendix

September 27, 2016 Asia: Automobiles
Goldman Sachs Global Investment Research 51
1. Glossary of terms
Electric vehicle (EV): EV is an automobile that runs on a motor with electric power charged from an external source. It is free of
CO2 emissions as it does not use gasoline or other petroleum derivatives. Lithium ion batteries are the mainstream power source
for EVs.
Hybrid vehicle (HV): An HV is an automobile that runs on two power sources: Engine and electric motor(s). HVs largely break down
into three categories based on their drivetrain, namely series, parallel, and power-split. The motor’s support leads to fuel efficiency
improvement during the drive.
Plug-in hybrid vehicle (PHV): PHV is a type of HV that allows one to charge electricity directly to a storage battery from a
residential power plug. Similar to HVs, PHVs have series and parallel drivetrains. A PHV’s battery volume is larger compared to that
of a HV, but smaller compared to that of an EV. Driving distance for PHVs depends on the battery size.
Anode: The electrode that releases electrons on discharge, the positive side.
Cathode: The electrode that receives electrons through the discharge process, the negative side
Separator: Battery separators create a barrier between the positive (anode) and negative (cathode) electrodes to prevent electrical
short-circuits between internal battery components.
Electrolyte: The material that separates anodes and cathodes and acts as a medium for charge transfer inside the cell.
Energy density: The amount of energy (Wh) that a battery can deliver per unit of volume, similar to specific energy.
kWh: kilowatt-hour; if energy is being transmitted or used at a constant rate (power) over a period of time, the total energy in
kilowatt-hours is the power in kilowatts multiplied by the time in hours. It is the measure of energy use or discharge over a specific
period of time.
kW: kilowatt; the measure of energy use or discharge at a moment of time.
Real Driving Emissions (RDE) testing: Method of regulating exhaust gas emissions based on data obtained during on-road
testing. This involves installing a portable emission measurement system (PEMS) on the vehicle, and measuring nitrous oxide (Nox)
and particle number (PN) emissions when driving along a predetermined route. Europe is now mulling the introduction of RDE.
Zero emission vehicle (ZEV) regulations: The emission regulatory framework at the state level in the United States. Regulations
announced by California will exclude hybrids from the ZEV category from 2018 and only include PHEVs, EVs, and FCVs.

September 27, 2016 Asia: Automobiles
Goldman Sachs Global Investment Research 52
2. Lithium supply/demand outlook
Adequate supplies of lithium at present
Lithium is the key material used in LIBs, and for a rare metal it is in quite plentiful supply. Global lithium reserves amount to 14 mn
tons, according to the US Geological Survey as of January 2016. Based on output of 30,000 tons in 2015, a simple calculation
suggests that current reserves of lithium will suffice for over 400 years. The near-term supply/demand balance is by no means tight,
as our global commodities team estimates the world’s lithium mines are operating at only around 70% of capacity at present. The
reality is, though, that much of the lithium is produced in Australia and Chile. Swings in lithium price could well see China, which
has relatively high mining costs, assume a greater presence.
Rapidly expanding EV market likely dictates that production be ramped up quickly
Automotive LIBs contain 60 kg of lithium (assuming a battery storage capacity of 40-60 kWh), far greater than the equivalent figures
of 6 grams for mobile phones and 40 grams for notebook PCs. Based on our forecasts for growth in EV and PHEV sales, we calculate
that 360,000 tons of lithium will be required annually by 2025. As of 2015, batteries accounted for 37% of lithium consumption,
followed by ceramics/glass at 30% and other uses at 33%. By 2025, though, we expect the battery weighting to exceed 80%, at which
point batteries would be the key to lithium supply/demand.
Lithium supply/demand likely to gradually tighten from 2020 onward
Obtaining an accurate picture of lithium supply/demand is difficult, as China’s production capacity is not entirely clear. Given
increasing demand for lithium as a component of automotive batteries, however, our commodities team thinks it’s possible that
lithium supply/demand will tighten from 2020 onward. Although there is no benchmark trading price for lithium, a rise in the price of
lithium is also conceivable. As outlined above, though, there are quite plentiful reserves of lithium, and it is likely that China would
increase production as it becomes better able to meet mining costs. Also, battery makers are undertaking research into lithium
recycling (recycling is physically possible, but cost is the main sticking point). Thus it seems unlikely that a shortage of lithium will
hinder further expansion in the EV and PHEV markets.
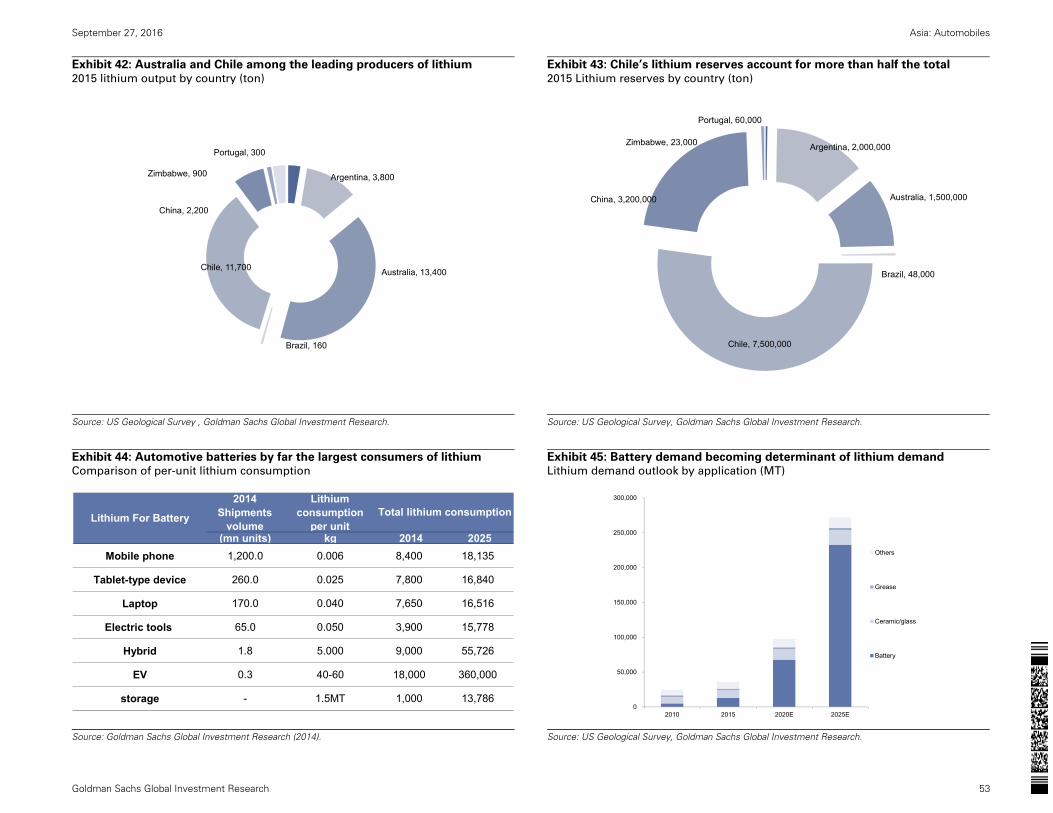
September 27, 2016 Asia: Automobiles
Goldman Sachs Global Investment Research 53
Exhibit 42: Australia and Chile among the leading producers of lithium 2015 lithium output by country (ton)
Exhibit 43: Chile’s lithium reserves account for more than half the total 2015 Lithium reserves by country (ton)
Source: US Geological Survey , Goldman Sachs Global Investment Research.
Source: US Geological Survey, Goldman Sachs Global Investment Research.
Exhibit 44: Automotive batteries by far the largest consumers of lithium Comparison of per-unit lithium consumption
Exhibit 45: Battery demand becoming determinant of lithium demand Lithium demand outlook by application (MT)
Source: Goldman Sachs Global Investment Research (2014).
Source: US Geological Survey, Goldman Sachs Global Investment Research.
Argentina, 3,800
Australia, 13,400
Brazil, 160
Chile, 11,700
China, 2,200
Portugal, 300
Zimbabwe, 900
Argentina, 2,000,000
Australia, 1,500,000
Brazil, 48,000
Chile, 7,500,000
China, 3,200,000
Portugal, 60,000
Zimbabwe, 23,000
2014Shipments
volume
Lithiumconsumption
per unit(mn units) kg 2014 2025
Mobile phone 1,200.0 0.006 8,400 18,135
Tablet-type device 260.0 0.025 7,800 16,840
Laptop 170.0 0.040 7,650 16,516
Electric tools 65.0 0.050 3,900 15,778
Hybrid 1.8 5.000 9,000 55,726
EV 0.3 40-60 18,000 360,000
storage - 1.5MT 1,000 13,786
Lithium For Battery Total lithium consumption
0
50,000
100,000
150,000
200,000
250,000
300,000
2010 2015 2020E 2025E
Others
Grease
Ceramic/glass
Battery
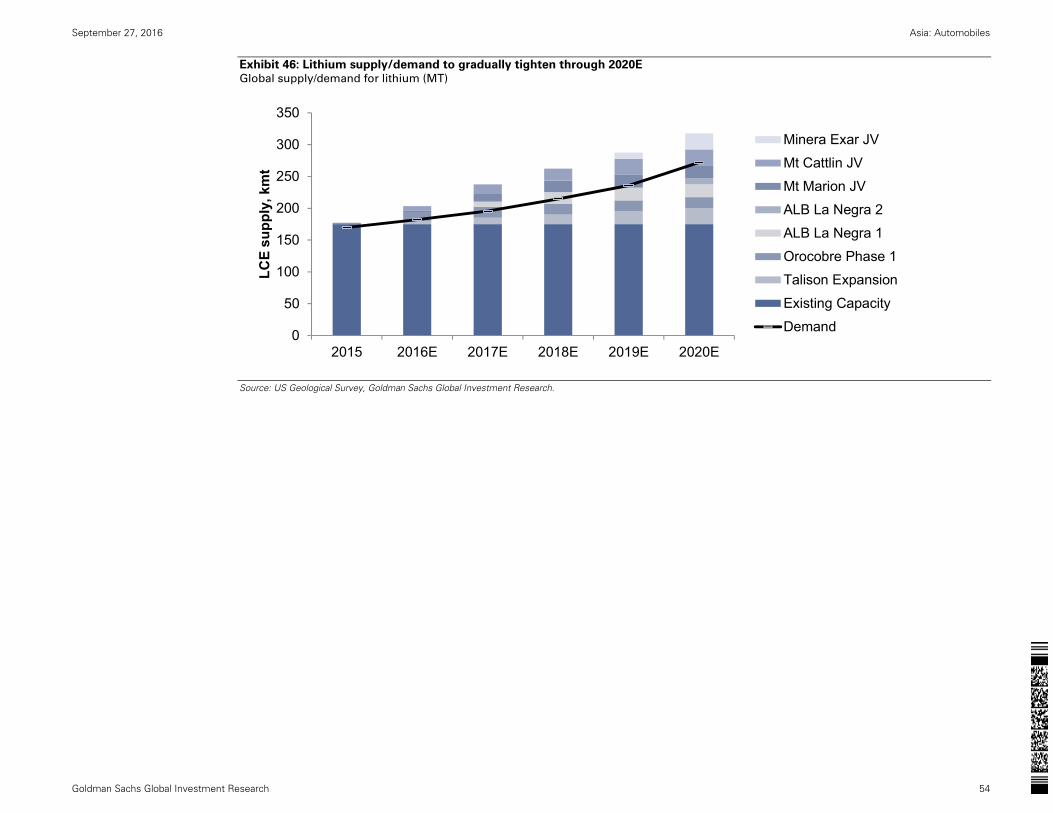
September 27, 2016 Asia: Automobiles
Goldman Sachs Global Investment Research 54
Exhibit 46: Lithium supply/demand to gradually tighten through 2020E Global supply/demand for lithium (MT)
Source: US Geological Survey, Goldman Sachs Global Investment Research.
0
50
100
150
200
250
300
350
2015 2016E 2017E 2018E 2019E 2020E
LCE
supp
ly, k
mt
Minera Exar JV
Mt Cattlin JV
Mt Marion JV
ALB La Negra 2
ALB La Negra 1
Orocobre Phase 1
Talison Expansion
Existing Capacity
Demand

September 27, 2016 Asia: Automobiles
Goldman Sachs Global Investment Research 55
3. Supply chain
Exhibit 47: Strong presence for Asian battery players
Source: Avicenne, Goldman Sachs Global Investment Research.
HEV PEVE AESC BEC (Yuasa) Hitachi LG Panasonic SDI JCI Toshiba A123Toyota ✔Honda ✔Nissan ✔ ✔GM ✔ ✔Ford ✔Hyundai ✔VW-Audi ✔BMW ✔ ✔Daimler ✔Fiat ✔MMC ✔ ✔
PHEV PEVE AESC BEC (Yuasa) LEJ (GS) LG Panasonic SDI JCI Litec SKToyota ✔ ✔Honda ✔ PEVE: Primearth EV Energy
Nissan ✔ AESC: Automotive Energy Supply Corporation
MMC ✔ BEC: Blue Energy (GS Yuasa Gr.)
GM ✔ SDI: Samsung SDI
Ford ✔ ✔ JCI: Johnson Controls
Hyundai ✔ A123: A123 Systems
VW-Audi ✔ LEJ: Lithium Energy Japan
BMW ✔ SK: SK Energy
Daimler ✔ ✔ ✔ SKI: SK Innovataion
Volvo ✔
EV AESC BEC (GS) LEJ (GS) LG Panasonic SDI Toshiba Liotec Tesla A123 SKI ENER1 BYDToyota ✔Honda ✔ ✔Nissan ✔MMC ✔GM ✔ ✔Ford ✔Hyundai ✔ ✔VW-Audi ✔BMW ✔Daimler ✔ ✔ ✔Volvo ✔PSA ✔Renault ✔ ✔Fiat ✔
September 27, 2016 Asia: Automobiles
Goldman Sachs Global Investment Research 56
Disclosure Appendix
Reg AC
We, Kota Yuzawa, Yipeng Yang, Nikhil Bhandari, Masaru Sugiyama, Shuhei Nakamura, Stefan Burgstaller, David Tamberrino, CFA and Marcus Shin, hereby certify that all of the views expressed in
this report accurately reflect our personal views about the subject company or companies and its or their securities. We also certify that no part of our compensation was, is or will be, directly or
indirectly, related to the specific recommendations or views expressed in this report.
Unless otherwise stated, the individuals listed on the cover page of this report are analysts in Goldman Sachs' Global Investment Research division.
Investment Profile
The Goldman Sachs Investment Profile provides investment context for a security by comparing key attributes of that security to its peer group and market. The four key attributes depicted are: growth,
returns, multiple and volatility. Growth, returns and multiple are indexed based on composites of several methodologies to determine the stocks percentile ranking within the region's coverage
universe.
The precise calculation of each metric may vary depending on the fiscal year, industry and region but the standard approach is as follows:
Growth is a composite of next year's estimate over current year's estimate, e.g. EPS, EBITDA, Revenue. Return is a year one prospective aggregate of various return on capital measures, e.g. CROCI,
ROACE, and ROE. Multiple is a composite of one-year forward valuation ratios, e.g. P/E, dividend yield, EV/FCF, EV/EBITDA, EV/DACF, Price/Book. Volatility is measured as trailing twelve-month
volatility adjusted for dividends.
Quantum
Quantum is Goldman Sachs' proprietary database providing access to detailed financial statement histories, forecasts and ratios. It can be used for in-depth analysis of a single company, or to make
comparisons between companies in different sectors and markets.
GS SUSTAIN
GS SUSTAIN is a global investment strategy aimed at long-term, long-only performance with a low turnover of ideas. The GS SUSTAIN focus list includes leaders our analysis shows to be well
positioned to deliver long term outperformance through sustained competitive advantage and superior returns on capital relative to their global industry peers. Leaders are identified based on
quantifiable analysis of three aspects of corporate performance: cash return on cash invested, industry positioning and management quality (the effectiveness of companies' management of the
environmental, social and governance issues facing their industry).
Disclosures
Coverage group(s) of stocks by primary analyst(s)
Kota Yuzawa: Japan-Automobiles. Yipeng Yang: China Autos. Nikhil Bhandari: ASEAN Plantations and Energy, Asia Pacific Energy, Korea Energy and Chemicals. Masaru Sugiyama: Japan Internet and
Games, Japan-Consumer Electronics, Japan-Media. Shuhei Nakamura: Japan-Advanced Materials sector. Stefan Burgstaller: Europe-Autos & Auto Parts. David Tamberrino, CFA: America-Autos &
Auto Parts, America-Autos Dealers, America-Tires. Marcus Shin: Korea Technology.
ASEAN Plantations and Energy: Bangchak Petroleum PCL, First Resources, Golden Agri-Resources Ltd., IRPC PCL, Perusahaan Gas, Petronas Chemicals Group, PTT Exploration and Production PCL,
PTT Global Chemical, PTT Public Co., Thai Oil, Wilmar International.
America-Autos & Auto Parts: BorgWarner Inc., Cooper-Standard Holdings, Delphi Automotive Plc, Ford Motor Co., General Motors Co., Harman International Industries Inc., Lear Corp., Magna
International Inc., Magna International Inc., Nemak, Tesla Motors Inc..
America-Autos Dealers: AutoNation Inc., Group 1 Automotive Inc..
America-Tires: Goodyear Tire & Rubber Co..
Asia Pacific Energy: Bharat Petroleum, Cairn India Ltd., China Petroleum & Chemical (A), China Petroleum & Chemical (ADS), China Petroleum & Chemical (H), CNOOC, CNOOC (ADR), Gas Authority of
India, Gujarat State Petronet, Hindustan Petroleum, Indian Oil Corp., Indraprastha Gas Ltd., Oil & Natural Gas Corp., Oil India, PetroChina (A), PetroChina (ADR), PetroChina (H), Petronet LNG, Reliance
Industries, Reliance Industries (GDR).
China Autos: Anhui Jianghuai Automobile Co., Baoxin Auto Group, Brilliance China Automotive, BYD Co., China Harmony New Energy Auto, Chongqing Changan Auto (A), Dongfeng Motor, FAW Car,
Fuyao Glass Industry Group (A), Fuyao Glass Industry Group (H), Geely Automobile Holdings, Great Wall Motor Co. (H), Great Wall Motor Co.(A), Guangzhou Automobile Group, Huayu Automotive
Systems, Minth Group, Nexteer Automotive Group, SAIC Motor, Sinotruk (Hong Kong), Weichai Power (A), Weichai Power (H), Weifu High-Technology Group (A), Zhengtong Auto Services Holdings,
Zhongsheng Group.
Europe-Autos & Auto Parts: Autoliv Inc., BMW, CNH Industrial, CNH Industrial, Continental, Daimler AG, Faurecia, Fiat Chrysler Automobiles NV, Fiat Chrysler Automobiles NV, GKN, Hella KGaA Hueck,
Michelin, Nokian Renkaat, Peugeot, Porsche, Renault, Valeo, Volkswagen, Volvo.
Japan Internet and Games: Bandai Namco Holdings, Capcom, CyberAgent, DeNA Co., Gree, Kakaku.com, Konami, LINE Corp., mixi, Nexon, Nintendo, Rakuten, Sega Sammy Holdings, Square Enix
Holdings, Yahoo Japan.
September 27, 2016 Asia: Automobiles
Goldman Sachs Global Investment Research 57
Japan-Advanced Materials sector: Daicel, Daido Steel, Hitachi Metals, JFE Holdings, Kansai Paint, Kobe Steel, Kuraray, Nippon Carbon, Nippon Paint Holdings, Nippon Shokubai, Nippon Steel &
Sumitomo Metal, Tokyo Steel Manufacturing, Toray Industries, UACJ.
Japan-Automobiles: Aisin Seiki, Bridgestone, Denso, Fuji Heavy Industries, Hino Motors, Honda Motor, Isuzu Motors, Mazda Motor, Mitsubishi Motors, Nissan Motor, Sumitomo Rubber Industries,
Suzuki Motor, Toyota Boshoku, Toyota Motor, Yamaha Motor.
Japan-Consumer Electronics: Panasonic Corp., Sony.
Japan-Media: Dentsu, Hakuhodo DY Holdings.
Korea Energy and Chemicals: GS Holdings, Hanwha Chemical, Kumho Petro Chemical Co., LG Chem, Lotte Chemical, S-Oil Corp., SK Innovation.
Korea Technology: Samsung Electro-Mechanics, Samsung Electronics, Samsung SDI Co., Samsung SDS Co., Seoul Semiconductor, SK Hynix Inc..
Company-specific regulatory disclosures
Compendium report: please see disclosures at http://www.gs.com/research/hedge.html. Disclosures applicable to the companies included in this compendium can be found in the latest relevant
published research
Distribution of ratings/investment banking relationships
Goldman Sachs Investment Research global Equity coverage universe
Rating Distribution Investment Banking Relationships
Buy Hold Sell Buy Hold Sell
Global 31% 54% 15% 66% 60% 50%
As of July 1, 2016, Goldman Sachs Global Investment Research had investment ratings on 2,963 equity securities. Goldman Sachs assigns stocks as Buys and Sells on various regional Investment
Lists; stocks not so assigned are deemed Neutral. Such assignments equate to Buy, Hold and Sell for the purposes of the above disclosure required by the FINRA Rules. See 'Ratings, Coverage groups
and views and related definitions' below. The Investment Banking Relationships chart reflects the percentage of subject companies within each rating category for whom Goldman Sachs has provided
investment banking services within the previous twelve months.
Price target and rating history chart(s)
Compendium report: please see disclosures at http://www.gs.com/research/hedge.html. Disclosures applicable to the companies included in this compendium can be found in the latest relevant
published research
Regulatory disclosures
Disclosures required by United States laws and regulations
See company-specific regulatory disclosures above for any of the following disclosures required as to companies referred to in this report: manager or co-manager in a pending transaction; 1% or
other ownership; compensation for certain services; types of client relationships; managed/co-managed public offerings in prior periods; directorships; for equity securities, market making and/or
specialist role. Goldman Sachs trades or may trade as a principal in debt securities (or in related derivatives) of issuers discussed in this report.
The following are additional required disclosures: Ownership and material conflicts of interest: Goldman Sachs policy prohibits its analysts, professionals reporting to analysts and members of their
households from owning securities of any company in the analyst's area of coverage. Analyst compensation: Analysts are paid in part based on the profitability of Goldman Sachs, which includes
investment banking revenues. Analyst as officer or director: Goldman Sachs policy prohibits its analysts, persons reporting to analysts or members of their households from serving as an officer,
director, advisory board member or employee of any company in the analyst's area of coverage. Non-U.S. Analysts: Non-U.S. analysts may not be associated persons of Goldman, Sachs & Co. and
therefore may not be subject to FINRA Rule 2241 or FINRA Rule 2242 restrictions on communications with subject company, public appearances and trading securities held by the analysts.
Distribution of ratings: See the distribution of ratings disclosure above. Price chart: See the price chart, with changes of ratings and price targets in prior periods, above, or, if electronic format or if
with respect to multiple companies which are the subject of this report, on the Goldman Sachs website at http://www.gs.com/research/hedge.html.
Additional disclosures required under the laws and regulations of jurisdictions other than the United States
The following disclosures are those required by the jurisdiction indicated, except to the extent already made above pursuant to United States laws and regulations. Australia: Goldman Sachs Australia
Pty Ltd and its affiliates are not authorised deposit-taking institutions (as that term is defined in the Banking Act 1959 (Cth)) in Australia and do not provide banking services, nor carry on a banking
business, in Australia. This research, and any access to it, is intended only for "wholesale clients" within the meaning of the Australian Corporations Act, unless otherwise agreed by Goldman Sachs. In
producing research reports, members of the Global Investment Research Division of Goldman Sachs Australia may attend site visits and other meetings hosted by the issuers the subject of its research
reports. In some instances the costs of such site visits or meetings may be met in part or in whole by the issuers concerned if Goldman Sachs Australia considers it is appropriate and reasonable in the
specific circumstances relating to the site visit or meeting. Brazil: Disclosure information in relation to CVM Instruction 483 is available at http://www.gs.com/worldwide/brazil/area/gir/index.html.
Where applicable, the Brazil-registered analyst primarily responsible for the content of this research report, as defined in Article 16 of CVM Instruction 483, is the first author named at the beginning of
this report, unless indicated otherwise at the end of the text. Canada: Goldman Sachs Canada Inc. is an affiliate of The Goldman Sachs Group Inc. and therefore is included in the company specific
disclosures relating to Goldman Sachs (as defined above). Goldman Sachs Canada Inc. has approved of, and agreed to take responsibility for, this research report in Canada if and to the extent that
Goldman Sachs Canada Inc. disseminates this research report to its clients. Hong Kong: Further information on the securities of covered companies referred to in this research may be obtained on

September 27, 2016 Asia: Automobiles
Goldman Sachs Global Investment Research 58
request from Goldman Sachs (Asia) L.L.C. India: Further information on the subject company or companies referred to in this research may be obtained from Goldman Sachs (India) Securities Private
Limited, Research Analyst - SEBI Registration Number INH000001493, 951-A, Rational House, Appasaheb Marathe Marg, Prabhadevi, Mumbai 400 025, India, Corporate Identity Number
U74140MH2006FTC160634, Phone +91 22 6616 9000, Fax +91 22 6616 9001. Goldman Sachs may beneficially own 1% or more of the securities (as such term is defined in clause 2 (h) the Indian
Securities Contracts (Regulation) Act, 1956) of the subject company or companies referred to in this research report. Japan: See below. Korea: Further information on the subject company or
companies referred to in this research may be obtained from Goldman Sachs (Asia) L.L.C., Seoul Branch. New Zealand: Goldman Sachs New Zealand Limited and its affiliates are neither "registered
banks" nor "deposit takers" (as defined in the Reserve Bank of New Zealand Act 1989) in New Zealand. This research, and any access to it, is intended for "wholesale clients" (as defined in the Financial
Advisers Act 2008) unless otherwise agreed by Goldman Sachs. Russia: Research reports distributed in the Russian Federation are not advertising as defined in the Russian legislation, but are
information and analysis not having product promotion as their main purpose and do not provide appraisal within the meaning of the Russian legislation on appraisal activity. Singapore: Further
information on the covered companies referred to in this research may be obtained from Goldman Sachs (Singapore) Pte. (Company Number: 198602165W). Taiwan: This material is for reference
only and must not be reprinted without permission. Investors should carefully consider their own investment risk. Investment results are the responsibility of the individual investor. United Kingdom: Persons who would be categorized as retail clients in the United Kingdom, as such term is defined in the rules of the Financial Conduct Authority, should read this research in conjunction
with prior Goldman Sachs research on the covered companies referred to herein and should refer to the risk warnings that have been sent to them by Goldman Sachs International. A copy of these
risks warnings, and a glossary of certain financial terms used in this report, are available from Goldman Sachs International on request.
European Union: Disclosure information in relation to Article 4 (1) (d) and Article 6 (2) of the European Commission Directive 2003/125/EC is available at
http://www.gs.com/disclosures/europeanpolicy.html which states the European Policy for Managing Conflicts of Interest in Connection with Investment Research.
Japan: Goldman Sachs Japan Co., Ltd. is a Financial Instrument Dealer registered with the Kanto Financial Bureau under registration number Kinsho 69, and a member of Japan Securities Dealers
Association, Financial Futures Association of Japan and Type II Financial Instruments Firms Association. Sales and purchase of equities are subject to commission pre-determined with clients plus
consumption tax. See company-specific disclosures as to any applicable disclosures required by Japanese stock exchanges, the Japanese Securities Dealers Association or the Japanese Securities
Finance Company.
Ratings, coverage groups and views and related definitions
Buy (B), Neutral (N), Sell (S) -Analysts recommend stocks as Buys or Sells for inclusion on various regional Investment Lists. Being assigned a Buy or Sell on an Investment List is determined by a
stock's return potential relative to its coverage group as described below. Any stock not assigned as a Buy or a Sell on an Investment List is deemed Neutral. Each regional Investment Review
Committee manages various regional Investment Lists to a global guideline of 25%-35% of stocks as Buy and 10%-15% of stocks as Sell; however, the distribution of Buys and Sells in any particular
coverage group may vary as determined by the regional Investment Review Committee. Regional Conviction Buy and Sell lists represent investment recommendations focused on either the size of the
potential return or the likelihood of the realization of the return.
Return potential represents the price differential between the current share price and the price target expected during the time horizon associated with the price target. Price targets are required for all
covered stocks. The return potential, price target and associated time horizon are stated in each report adding or reiterating an Investment List membership.
Coverage groups and views: A list of all stocks in each coverage group is available by primary analyst, stock and coverage group at http://www.gs.com/research/hedge.html. The analyst assigns one
of the following coverage views which represents the analyst's investment outlook on the coverage group relative to the group's historical fundamentals and/or valuation. Attractive (A). The
investment outlook over the following 12 months is favorable relative to the coverage group's historical fundamentals and/or valuation. Neutral (N). The investment outlook over the following 12
months is neutral relative to the coverage group's historical fundamentals and/or valuation. Cautious (C). The investment outlook over the following 12 months is unfavorable relative to the coverage
group's historical fundamentals and/or valuation.
Not Rated (NR). The investment rating and target price have been removed pursuant to Goldman Sachs policy when Goldman Sachs is acting in an advisory capacity in a merger or strategic
transaction involving this company and in certain other circumstances. Rating Suspended (RS). Goldman Sachs Research has suspended the investment rating and price target for this stock, because
there is not a sufficient fundamental basis for determining, or there are legal, regulatory or policy constraints around publishing, an investment rating or target. The previous investment rating and
price target, if any, are no longer in effect for this stock and should not be relied upon. Coverage Suspended (CS). Goldman Sachs has suspended coverage of this company. Not Covered (NC). Goldman Sachs does not cover this company. Not Available or Not Applicable (NA). The information is not available for display or is not applicable. Not Meaningful (NM). The
information is not meaningful and is therefore excluded.
Global product; distributing entities
The Global Investment Research Division of Goldman Sachs produces and distributes research products for clients of Goldman Sachs on a global basis. Analysts based in Goldman Sachs offices
around the world produce equity research on industries and companies, and research on macroeconomics, currencies, commodities and portfolio strategy. This research is disseminated in Australia
by Goldman Sachs Australia Pty Ltd (ABN 21 006 797 897); in Brazil by Goldman Sachs do Brasil Corretora de Títulos e Valores Mobiliários S.A.; in Canada by either Goldman Sachs Canada Inc. or
Goldman, Sachs & Co.; in Hong Kong by Goldman Sachs (Asia) L.L.C.; in India by Goldman Sachs (India) Securities Private Ltd.; in Japan by Goldman Sachs Japan Co., Ltd.; in the Republic of Korea by
Goldman Sachs (Asia) L.L.C., Seoul Branch; in New Zealand by Goldman Sachs New Zealand Limited; in Russia by OOO Goldman Sachs; in Singapore by Goldman Sachs (Singapore) Pte. (Company
Number: 198602165W); and in the United States of America by Goldman, Sachs & Co. Goldman Sachs International has approved this research in connection with its distribution in the United
Kingdom and European Union.
European Union: Goldman Sachs International authorised by the Prudential Regulation Authority and regulated by the Financial Conduct Authority and the Prudential Regulation Authority, has
approved this research in connection with its distribution in the European Union and United Kingdom; Goldman Sachs AG and Goldman Sachs International Zweigniederlassung Frankfurt, regulated
by the Bundesanstalt für Finanzdienstleistungsaufsicht, may also distribute research in Germany.
General disclosures
This research is for our clients only. Other than disclosures relating to Goldman Sachs, this research is based on current public information that we consider reliable, but we do not represent it is
accurate or complete, and it should not be relied on as such. The information, opinions, estimates and forecasts contained herein are as of the date hereof and are subject to change without prior

September 27, 2016 Asia: Automobiles
Goldman Sachs Global Investment Research 59
notification. We seek to update our research as appropriate, but various regulations may prevent us from doing so. Other than certain industry reports published on a periodic basis, the large majority
of reports are published at irregular intervals as appropriate in the analyst's judgment.
Goldman Sachs conducts a global full-service, integrated investment banking, investment management, and brokerage business. We have investment banking and other business relationships with a
substantial percentage of the companies covered by our Global Investment Research Division. Goldman, Sachs & Co., the United States broker dealer, is a member of SIPC (http://www.sipc.org).
Our salespeople, traders, and other professionals may provide oral or written market commentary or trading strategies to our clients and principal trading desks that reflect opinions that are contrary
to the opinions expressed in this research. Our asset management area, principal trading desks and investing businesses may make investment decisions that are inconsistent with the
recommendations or views expressed in this research.
The analysts named in this report may have from time to time discussed with our clients, including Goldman Sachs salespersons and traders, or may discuss in this report, trading strategies that
reference catalysts or events that may have a near-term impact on the market price of the equity securities discussed in this report, which impact may be directionally counter to the analyst's published
price target expectations for such stocks. Any such trading strategies are distinct from and do not affect the analyst's fundamental equity rating for such stocks, which rating reflects a stock's return
potential relative to its coverage group as described herein.
We and our affiliates, officers, directors, and employees, excluding equity and credit analysts, will from time to time have long or short positions in, act as principal in, and buy or sell, the securities or
derivatives, if any, referred to in this research.
The views attributed to third party presenters at Goldman Sachs arranged conferences, including individuals from other parts of Goldman Sachs, do not necessarily reflect those of Global Investment
Research and are not an official view of Goldman Sachs.
Any third party referenced herein, including any salespeople, traders and other professionals or members of their household, may have positions in the products mentioned that are inconsistent with
the views expressed by analysts named in this report.
This research is not an offer to sell or the solicitation of an offer to buy any security in any jurisdiction where such an offer or solicitation would be illegal. It does not constitute a personal
recommendation or take into account the particular investment objectives, financial situations, or needs of individual clients. Clients should consider whether any advice or recommendation in this
research is suitable for their particular circumstances and, if appropriate, seek professional advice, including tax advice. The price and value of investments referred to in this research and the income
from them may fluctuate. Past performance is not a guide to future performance, future returns are not guaranteed, and a loss of original capital may occur. Fluctuations in exchange rates could have
adverse effects on the value or price of, or income derived from, certain investments.
Certain transactions, including those involving futures, options, and other derivatives, give rise to substantial risk and are not suitable for all investors. Investors should review current options
disclosure documents which are available from Goldman Sachs sales representatives or at http://www.theocc.com/about/publications/character-risks.jsp. Transaction costs may be significant in option
strategies calling for multiple purchase and sales of options such as spreads. Supporting documentation will be supplied upon request.
All research reports are disseminated and available to all clients simultaneously through electronic publication to our internal client websites. Not all research content is redistributed to our clients or
available to third-party aggregators, nor is Goldman Sachs responsible for the redistribution of our research by third party aggregators. For research, models or other data available on a particular
security, please contact your sales representative or go to http://360.gs.com.
Disclosure information is also available at http://www.gs.com/research/hedge.html or from Research Compliance, 200 West Street, New York, NY 10282.
© 2016 Goldman Sachs.
No part of this material may be (i) copied, photocopied or duplicated in any form by any means or (ii) redistributed without the prior written consent of The Goldman Sachs Group, Inc.