Ash transformation in suspension fired boilers co-firing...
52
General rights Copyright and moral rights for the publications made accessible in the public portal are retained by the authors and/or other copyright owners and it is a condition of accessing publications that users recognise and abide by the legal requirements associated with these rights. • Users may download and print one copy of any publication from the public portal for the purpose of private study or research. • You may not further distribute the material or use it for any profit-making activity or commercial gain • You may freely distribute the URL identifying the publication in the public portal If you believe that this document breaches copyright please contact us providing details, and we will remove access to the work immediately and investigate your claim. Downloaded from orbit.dtu.dk on: May 30, 2018 Ash transformation in suspension fired boilers co-firing coal and straw Final report, PSO-Eltra 4766 Zheng, Yuanjing; Jensen, Peter Arendt; Jensen, Anker Degn Publication date: 2009 Document Version Publisher's PDF, also known as Version of record Link back to DTU Orbit Citation (APA): Zheng, Y., Jensen, P. A., & Jensen, A. D. (2009). Ash transformation in suspension fired boilers co-firing coal and straw: Final report, PSO-Eltra 4766. Technical University of Denmark, Department of Chemical Engineering. (CHEC; No. R0803).
Transcript of Ash transformation in suspension fired boilers co-firing...
General rights Copyright and moral rights for the publications made accessible in the public portal are retained by the authors and/or other copyright owners and it is a condition of accessing publications that users recognise and abide by the legal requirements associated with these rights.
• Users may download and print one copy of any publication from the public portal for the purpose of private study or research. • You may not further distribute the material or use it for any profit-making activity or commercial gain • You may freely distribute the URL identifying the publication in the public portal
If you believe that this document breaches copyright please contact us providing details, and we will remove access to the work immediately and investigate your claim.
Downloaded from orbit.dtu.dk on: May 30, 2018
Ash transformation in suspension fired boilers co-firing coal and strawFinal report, PSO-Eltra 4766
Zheng, Yuanjing; Jensen, Peter Arendt; Jensen, Anker Degn
Publication date:2009
Document VersionPublisher's PDF, also known as Version of record
Link back to DTU Orbit
Citation (APA):Zheng, Y., Jensen, P. A., & Jensen, A. D. (2009). Ash transformation in suspension fired boilers co-firing coaland straw: Final report, PSO-Eltra 4766. Technical University of Denmark, Department of Chemical Engineering.(CHEC; No. R0803).
1
November 2008, DTU no. 50315
Appendix D. Potassium capture by kaolin and fly ash powder in an
entrained flow reactor
Final report, PSO-Eltra 4766: Ash transformation in suspension fired boilers co-firing
coal and straw
Yuanjing Zheng, Peter Arendt Jensen, Anker Degn Jensen
CHEC Research Centre Department of Chemical and Biochemical Engineering Technical University of Denmark Søltofts Plads, Building 229, DK-2800 Lyngby, Denmark Phone: 45 25 28 00, Email: [email protected]
Rep.no. R0803
2
Potassium capture by kaolin and fly ash powder
in an entrained flow reactor
Yuanjing Zheng, Peter Arendt Jensen, Anker Degn Jensen
Department of Chemical Engineering, Technical University of Denmark, Building 229,
DK-2800 Kgs. Lyngby, Denmark
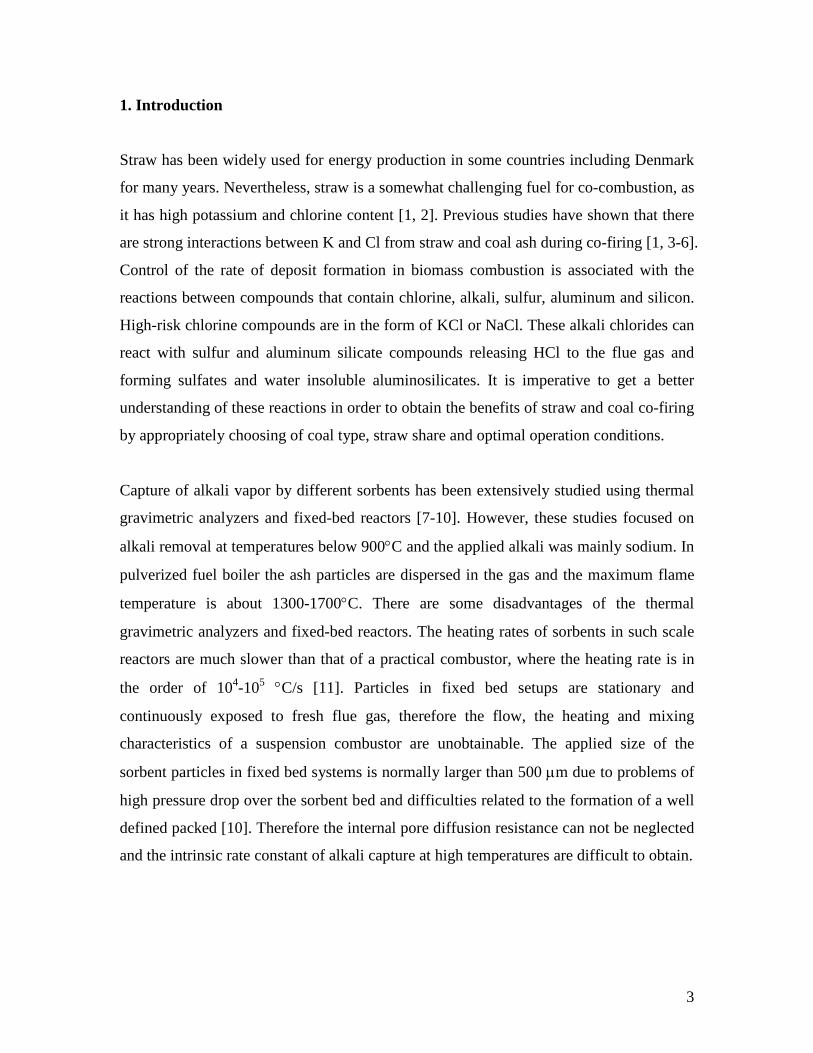
Abstract
To study the influence of local conditions on the reaction between gaseous KCl
and kaolin or coal fly ash experiments were done on CHECs electrically heated entrained
flow reactor, which can simulate the local conditions in suspension fired boilers. The
experimental results were compared with model calculations to support the interpretation.
The extent of the reaction between KCl vapor and coal minerals was evaluated by the
amount of formed water insoluble potassium in the product. The effects of reaction
temperature, residence time and potassium load on the potassium capture by coal
minerals were studied. Due to not completely well controlled conditions during the
experiments only preliminary conclusions can be provided. For experiments done at
1100°C with a molar ratio of K/Si=0.3 and a residence time of 1.07s approximately
80% of potassium from KCl reacted with kaolin. A changed temperature (1100-1300 °C)
or a changed amount of KCl (K/Si = 0.1 – 0.34) did only change the KCl conversion
slightly. Si and Al rich coal ash seems to be less efficient to react with KCl compared to
kaolin. However the applied coal ash had a larger particle size (d50 = 22μm) compared to
the kaolin (d50 = 10μm).
Keywords: Potassium; Coal minerals; Pulverized fuel; Coal/straw co-firing
3
1. Introduction
Straw has been widely used for energy production in some countries including Denmark
for many years. Nevertheless, straw is a somewhat challenging fuel for co-combustion, as
it has high potassium and chlorine content [1, 2]. Previous studies have shown that there
are strong interactions between K and Cl from straw and coal ash during co-firing [1, 3-6].
Control of the rate of deposit formation in biomass combustion is associated with the
reactions between compounds that contain chlorine, alkali, sulfur, aluminum and silicon.
High-risk chlorine compounds are in the form of KCl or NaCl. These alkali chlorides can
react with sulfur and aluminum silicate compounds releasing HCl to the flue gas and
forming sulfates and water insoluble aluminosilicates. It is imperative to get a better
understanding of these reactions in order to obtain the benefits of straw and coal co-firing
by appropriately choosing of coal type, straw share and optimal operation conditions.
Capture of alkali vapor by different sorbents has been extensively studied using thermal
gravimetric analyzers and fixed-bed reactors [7-10]. However, these studies focused on
alkali removal at temperatures below 900°C and the applied alkali was mainly sodium. In
pulverized fuel boiler the ash particles are dispersed in the gas and the maximum flame
temperature is about 1300-1700°C. There are some disadvantages of the thermal
gravimetric analyzers and fixed-bed reactors. The heating rates of sorbents in such scale
reactors are much slower than that of a practical combustor, where the heating rate is in
the order of 104-105 °C/s [11]. Particles in fixed bed setups are stationary and
continuously exposed to fresh flue gas, therefore the flow, the heating and mixing
characteristics of a suspension combustor are unobtainable. The applied size of the
sorbent particles in fixed bed systems is normally larger than 500 µm due to problems of
high pressure drop over the sorbent bed and difficulties related to the formation of a well
defined packed [10]. Therefore the internal pore diffusion resistance can not be neglected
and the intrinsic rate constant of alkali capture at high temperatures are difficult to obtain.
4
There are only few studies on sodium capture by coal minerals in a drop tube furnace,
which can be used to simulate the environment of high temperature thermal reactors such
as suspension fired boilers [12, 13].
Kaolin is a common clay mineral and often present in coal. It has been shown that the
extent of reaction between alkali and coal clay minerals, particularly kaolin, has
important implications for the reduction of troublesome volatile alkali compounds [9, 10].
In this work kaolin is chosen as a model coal mineral. It is difficult to uncouple partial
effects of different operating parameters on the alkali capture in a combustor. To alleviate
this problem, potassium capture by kaolin and a bituminous coal fly ash are investigated
by feeding KCl/kaolin and KCl/fly ash mixtures in a laminar electrically heated entrained
flow reactor (EFR) under well-defined conditions. The objective of this study is to
investigate the rate of the reaction between KCl and alumina silicates at the short
residence time and relatively high temperatures typical of suspension fired boilers.
2. Experimental
2.1 Experimental setup
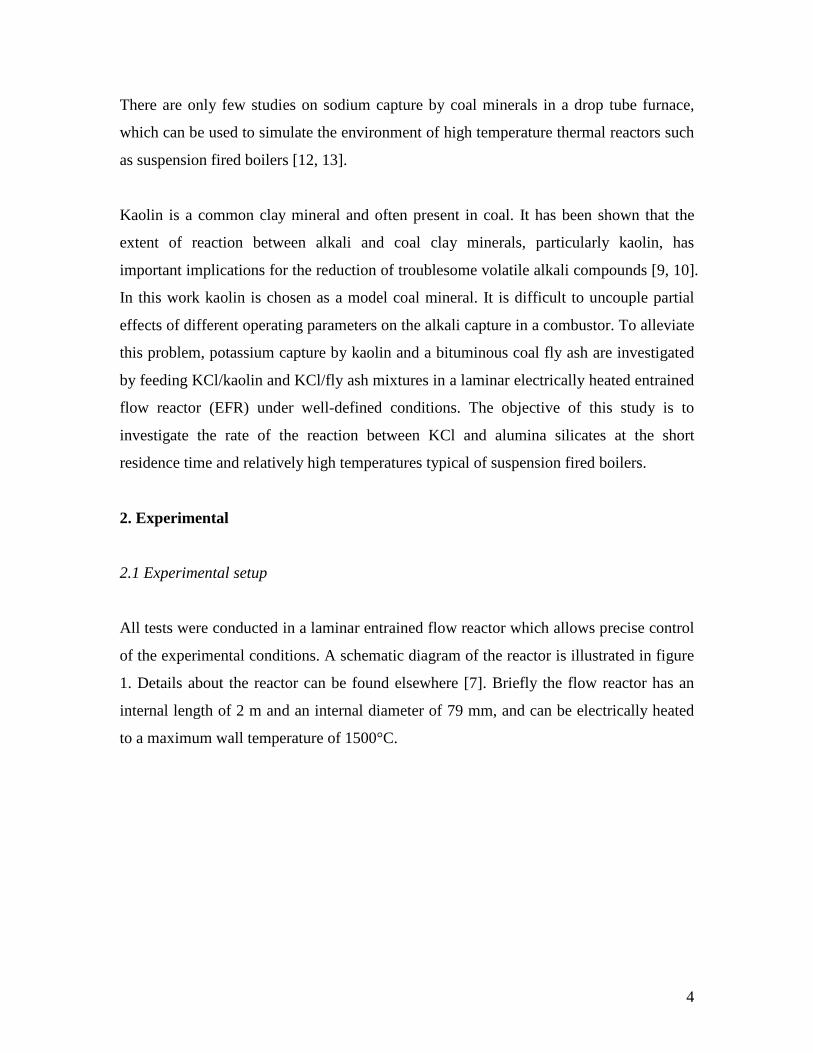
All tests were conducted in a laminar entrained flow reactor which allows precise control
of the experimental conditions. A schematic diagram of the reactor is illustrated in figure
1. Details about the reactor can be found elsewhere [7]. Briefly the flow reactor has an
internal length of 2 m and an internal diameter of 79 mm, and can be electrically heated
to a maximum wall temperature of 1500°C.
5
2.2 Potassium chloride evaporation test Two methods of adding alkali compounds into a model coal ash are used in entrained
flow reactor studies, namely, addition of fine alkali powders to the model coal ash [14]
and wet impregnation of model coal ash in a solution of alkali compounds followed by
drying, crushing and sieving [12, 13, 15]. Alkali salts containing potassium and sodium
volatilizes upon combustion, becomes dispersed through the gas stream and may later
react and condense on other ash particles. In this work the first method of potassium
addition was applied by mixing KCl powders with kaolin and bituminous coal fly ash
powders.
In order to quantify the amount of potassium vapor, evaporation tests of potassium
chloride powders in the entrained flow reactor were conducted. Similarly to the
evaporation tests conducted by Iisa et al. [16], the evaporated particles were collected by
a cyclone with a cut diameter of about 2 µm and an aerosol filter with a polycarbonate
filtration media which can collect particles above 0.05 µm. The reactor inlet gas was
compressed air that passed through a silica gel dryer prior to the reactor. The feeding air
Figure 1. Sketch of the entrained flow
reactor.
6
(supplying the solids) and total air flow is 10 Nl/min and 60 Nl/min, respectively. During
the evaporation test experiments a KCl powder feed rate of 60 g/h, which was slightly
larger than the typical KCl flow (50 g/h) in the kaolin/KCl mixture, was used to run
smoothly without problem of automatic stop of the feeder. The applied sampling time
was less than 10 min to avoid plugging of the sampling probe. Particles in the aerosol
filter, cyclone, sampling pipe, water cooled extraction probe tip and inside the probe were
collected. Pictures of the probe tip were taken to show the appearance of the collected
KCl powders after evaporation at different temperatures. The amounts of the collected
samples were compared with calculations, which were done by assuming the sampling
flow has the same KCl concentration as the air flow in the reactor. The evaporation
results were also compared with a model that simulates the heating and evaporation rate
of the KCl particles.
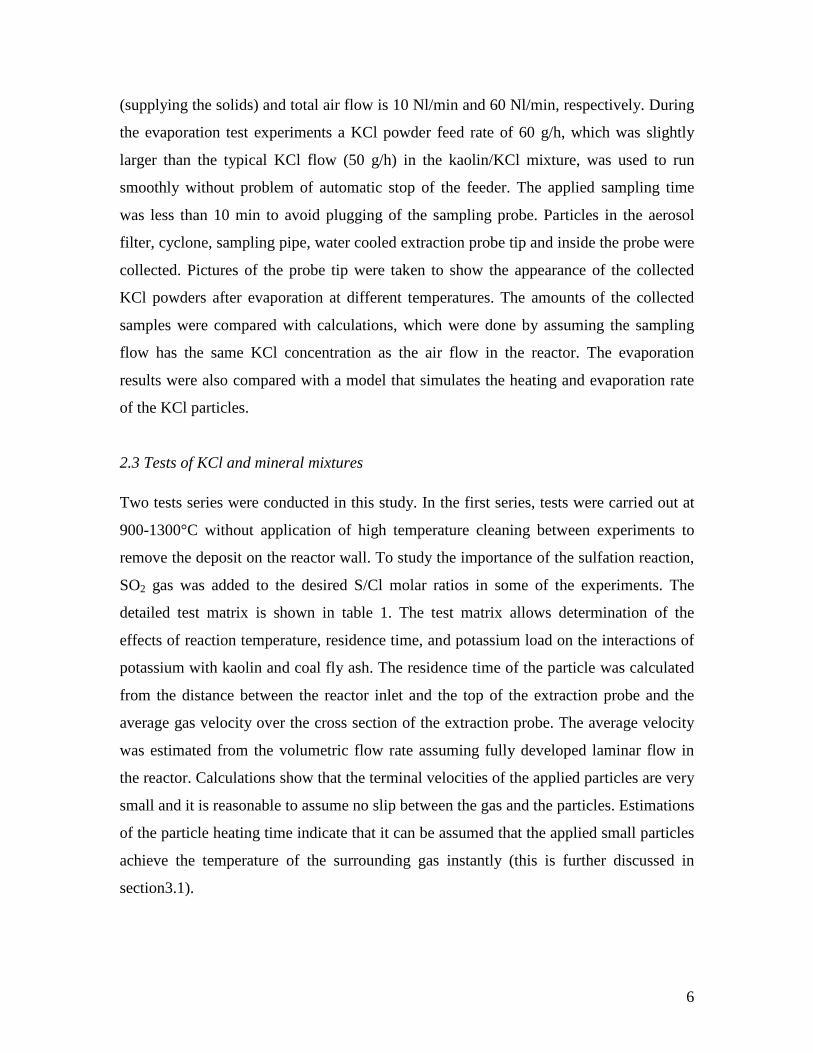
2.3 Tests of KCl and mineral mixtures Two tests series were conducted in this study. In the first series, tests were carried out at
900-1300°C without application of high temperature cleaning between experiments to
remove the deposit on the reactor wall. To study the importance of the sulfation reaction,
SO2 gas was added to the desired S/Cl molar ratios in some of the experiments. The
detailed test matrix is shown in table 1. The test matrix allows determination of the
effects of reaction temperature, residence time, and potassium load on the interactions of
potassium with kaolin and coal fly ash. The residence time of the particle was calculated
from the distance between the reactor inlet and the top of the extraction probe and the
average gas velocity over the cross section of the extraction probe. The average velocity
was estimated from the volumetric flow rate assuming fully developed laminar flow in
the reactor. Calculations show that the terminal velocities of the applied particles are very
small and it is reasonable to assume no slip between the gas and the particles. Estimations
of the particle heating time indicate that it can be assumed that the applied small particles
achieve the temperature of the surrounding gas instantly (this is further discussed in
section3.1).
7
Previous straw/coal co-firing combustion tests showed that there is a clear correlation
between the K/Si molar ratio in the fuel mixture and water soluble potassium content in
the fly ash [3]. The fraction of potassium chloride in the mixture was added to obtain
certain K/Si molar ratios, where a K/Si molar ratio of 0.34 corresponds to co-firing
typical bituminous coal with 30 wt.% Danish straw. Different S/Cl molar ratios were
applied by varying the amount of added SO2. Table 1. Test matrix.
Run Mineral K/Si (molar ratio)
Kaolin/KCl (molar ratio)
S/Cl (molar ratio)
Temperature
(°C)
Residence time (s)
Series 1 1 Kaolin 0.34 1.74 0 900 0.54 2 Kaolin 0.34 1.74 0 900 1.07 3 Kaolin 0.34 1.74 0 900 1.43 4 Kaolin 0.34 1.74 0 1100 1.07 5 Kaolin 0.34 1.74 0 1300 1.07 6 Kaolin 0.34 1.74 5.80 1100 1.07 7 Kaolin 0.34 1.74 5.80 1200 1.07 8 Kaolin 0.34 1.74 5.80 1300 1.07 9 Kaolin 0.34 1.74 9.30 1300 1.07
Series 2 1 Kaolin 0.10 7.10 0 1100 1.07 2 Kaolin 0.18 3.50 0 1100 1.07 3 Kaolin 0.34 1.74 0 1100 1.07 4 Kaolin 0.34 1.74 0 1100 0.54 5 Kaolin 0.34 1.74 0 1100 0.77 6 Kaolin 0.34 1.74 0 1100 1.22 7 Kaolin 0.34 1.74 0 1200 1.07 8 Kaolin 0.34 1.74 0 1300 1.07 9 SAKLEI fly ash 0.34 - 0.01 1100 1.07 10 SAKLEI fly ash 0.34 - 0.01 1200 1.07 11 SAKLEI fly ash 0.34 - 0.01 1300 1.07
The potassium chloride powders were milled in a Retsch ZM 100 centrifugal mill with a
80 µm sieve. Fine kaolin powders were mixed with KCl powders in appropriate
proportion in a mixer for 3 h to ensure thorough mixing. Due to the color difference, big
KCl particles were observed during the mixing with fly ash. To get better mixing,
premixed KCl and fly ash are milled together through the mill with an 80 µm sieve.
8
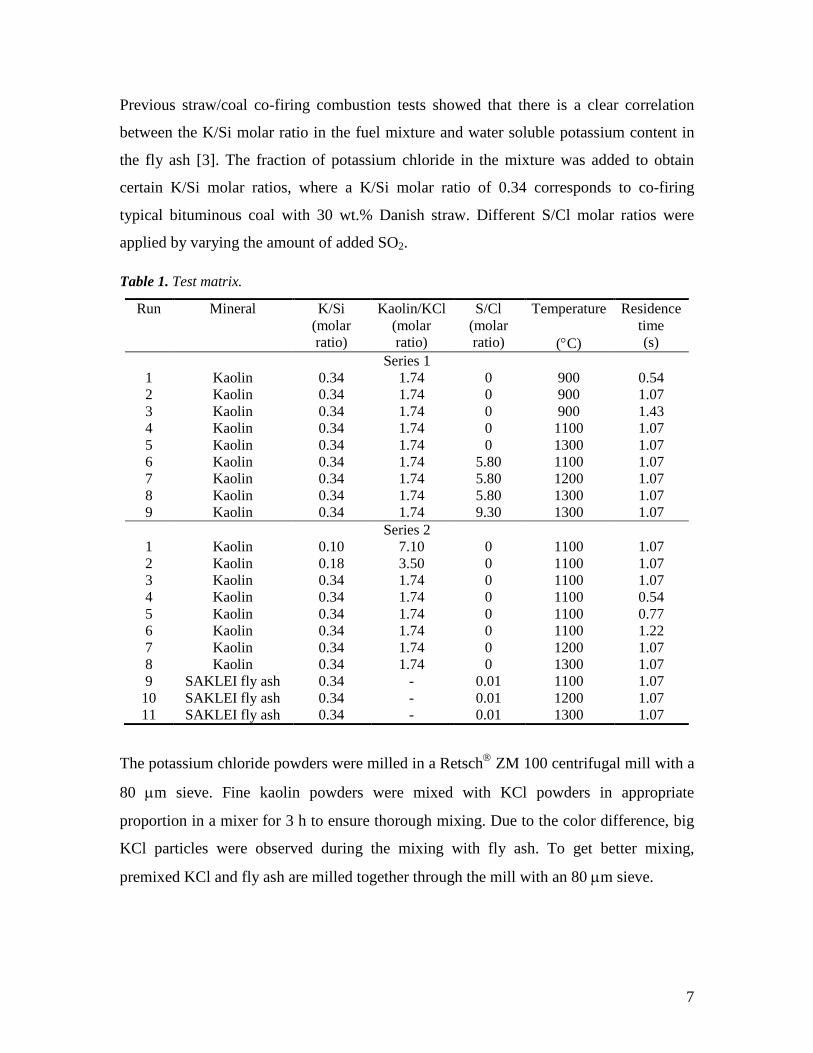
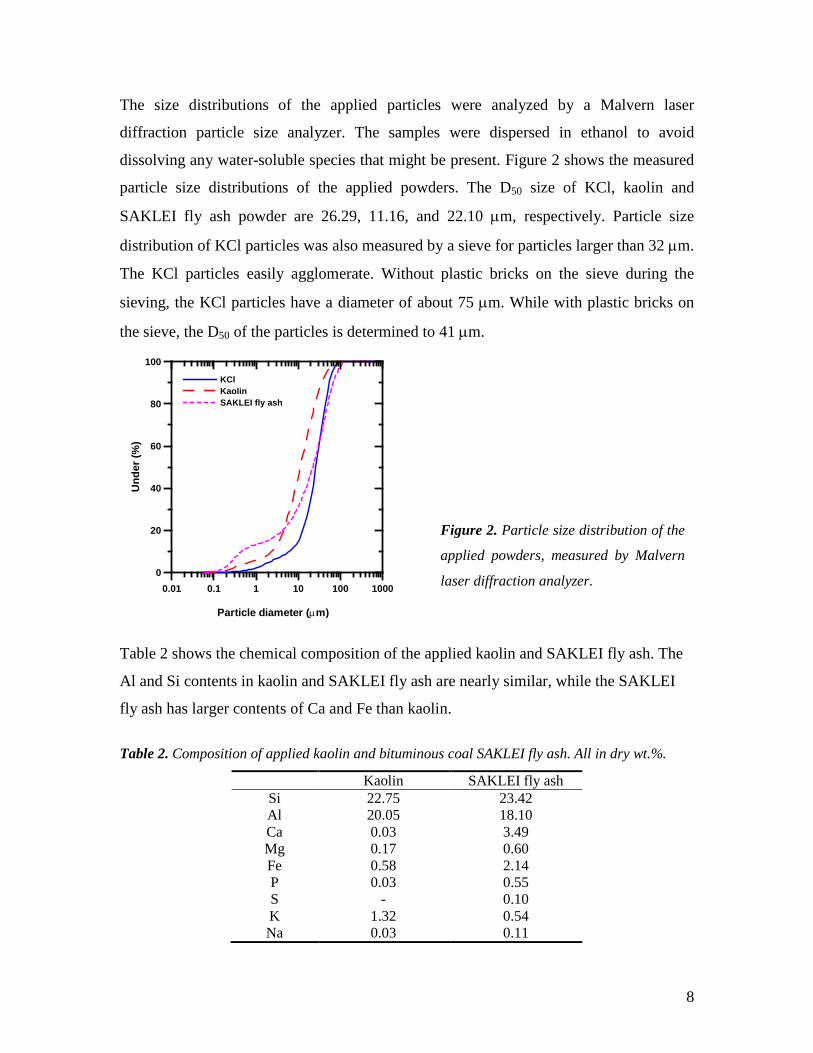
The size distributions of the applied particles were analyzed by a Malvern laser
diffraction particle size analyzer. The samples were dispersed in ethanol to avoid
dissolving any water-soluble species that might be present. Figure 2 shows the measured
particle size distributions of the applied powders. The D50 size of KCl, kaolin and
SAKLEI fly ash powder are 26.29, 11.16, and 22.10 µm, respectively. Particle size
distribution of KCl particles was also measured by a sieve for particles larger than 32 µm.
The KCl particles easily agglomerate. Without plastic bricks on the sieve during the
sieving, the KCl particles have a diameter of about 75 µm. While with plastic bricks on
the sieve, the D50 of the particles is determined to 41 µm.
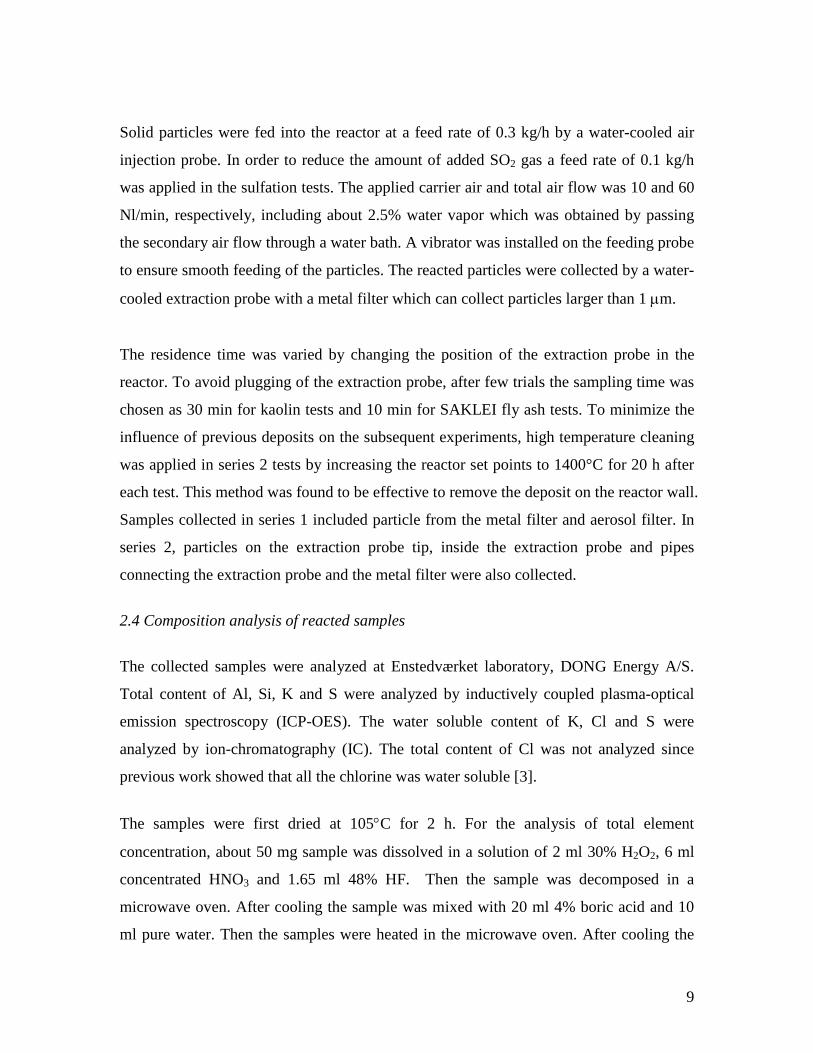
Table 2 shows the chemical composition of the applied kaolin and SAKLEI fly ash. The
Al and Si contents in kaolin and SAKLEI fly ash are nearly similar, while the SAKLEI
fly ash has larger contents of Ca and Fe than kaolin.
Table 2. Composition of applied kaolin and bituminous coal SAKLEI fly ash. All in dry wt.%.
Kaolin SAKLEI fly ash Si 22.75 23.42 Al 20.05 18.10 Ca 0.03 3.49 Mg 0.17 0.60 Fe 0.58 2.14 P 0.03 0.55 S - 0.10 K 1.32 0.54 Na 0.03 0.11
0.01 0.1 1 10 100 1000
Particle diameter (µm)
0
20
40
60
80
100
Und
er (%
)
KClKaolinSAKLEI fly ash
Figure 2. Particle size distribution of the
applied powders, measured by Malvern
laser diffraction analyzer.
9
Solid particles were fed into the reactor at a feed rate of 0.3 kg/h by a water-cooled air
injection probe. In order to reduce the amount of added SO2 gas a feed rate of 0.1 kg/h
was applied in the sulfation tests. The applied carrier air and total air flow was 10 and 60
Nl/min, respectively, including about 2.5% water vapor which was obtained by passing
the secondary air flow through a water bath. A vibrator was installed on the feeding probe
to ensure smooth feeding of the particles. The reacted particles were collected by a water-
cooled extraction probe with a metal filter which can collect particles larger than 1 µm.
The residence time was varied by changing the position of the extraction probe in the
reactor. To avoid plugging of the extraction probe, after few trials the sampling time was
chosen as 30 min for kaolin tests and 10 min for SAKLEI fly ash tests. To minimize the
influence of previous deposits on the subsequent experiments, high temperature cleaning
was applied in series 2 tests by increasing the reactor set points to 1400°C for 20 h after
each test. This method was found to be effective to remove the deposit on the reactor wall.
Samples collected in series 1 included particle from the metal filter and aerosol filter. In
series 2, particles on the extraction probe tip, inside the extraction probe and pipes
connecting the extraction probe and the metal filter were also collected.
2.4 Composition analysis of reacted samples
The collected samples were analyzed at Enstedværket laboratory, DONG Energy A/S.
Total content of Al, Si, K and S were analyzed by inductively coupled plasma-optical
emission spectroscopy (ICP-OES). The water soluble content of K, Cl and S were
analyzed by ion-chromatography (IC). The total content of Cl was not analyzed since
previous work showed that all the chlorine was water soluble [3].
The samples were first dried at 105°C for 2 h. For the analysis of total element
concentration, about 50 mg sample was dissolved in a solution of 2 ml 30% H2O2, 6 ml
concentrated HNO3 and 1.65 ml 48% HF. Then the sample was decomposed in a
microwave oven. After cooling the sample was mixed with 20 ml 4% boric acid and 10
ml pure water. Then the samples were heated in the microwave oven. After cooling the
10
solution was added to 100 ml by filling pure water and the ICP-OES analysis was
performed. For the analysis of water soluble elements, about 50 mg and 100 mg sample
was dissolved in 50 ml pure water, respectively. Then the sample bottle was closed and
heated at 120°C for 1 h. After cooling the solution was filtered by using a 0.45 µm filter.
Selected samples were examined on an Oxford JEOL-JSM 5900 scanning electron
microscope (SEM) to study the morphology. The energy-dispersive X-ray system was
used for elemental analysis of individual particles with an acceleration voltage of 15 kV.
3. Results and discussion
3.1 Evaporation of potassium chloride powder
Evaporation tests were conducted at 200-1300°C. The test at 200°C was performed to
study the dispersion and deposit behavior of KCl powders in the reactor. At such low
temperature KCl hardly evaporates. Detailed evaporation results are shown in table 3. In
all the tests the maximum KCl collection efficiency was about 42%. It is expected that a
lot of KCl particles deposit on the reactor wall.
There is a significant increase of the amount of collected aerosols when the evaporation
temperature increases from 200 to 1100°C as shown in table 3. The amounts of collected
particles in the sampling pipe decreases with increasing the evaporation temperature,
indicating that more fine aerosol particles are formed. We believe that the best estimation
of the evaporation fraction is the ratio of aerosol to the sum of samples collected in the
aerosol filter, the cyclone and the sampling pipe. This ratio shows that the KCl powder is
only partly evaporated at 900°C (approximately 30%), while at 1100°C and above
nearly all KCl is evaporated. The theoretical calculations indicate that the KCl is
completely evaporated already at 900°C (see Figure 6). However, the calculations are
based on a single particle size of 26 µm while in reality some particles are larger. Also an
eventual poor mixing of particles and gas in the entrained flow reactor will delay the
heating of the KCl particles.
11
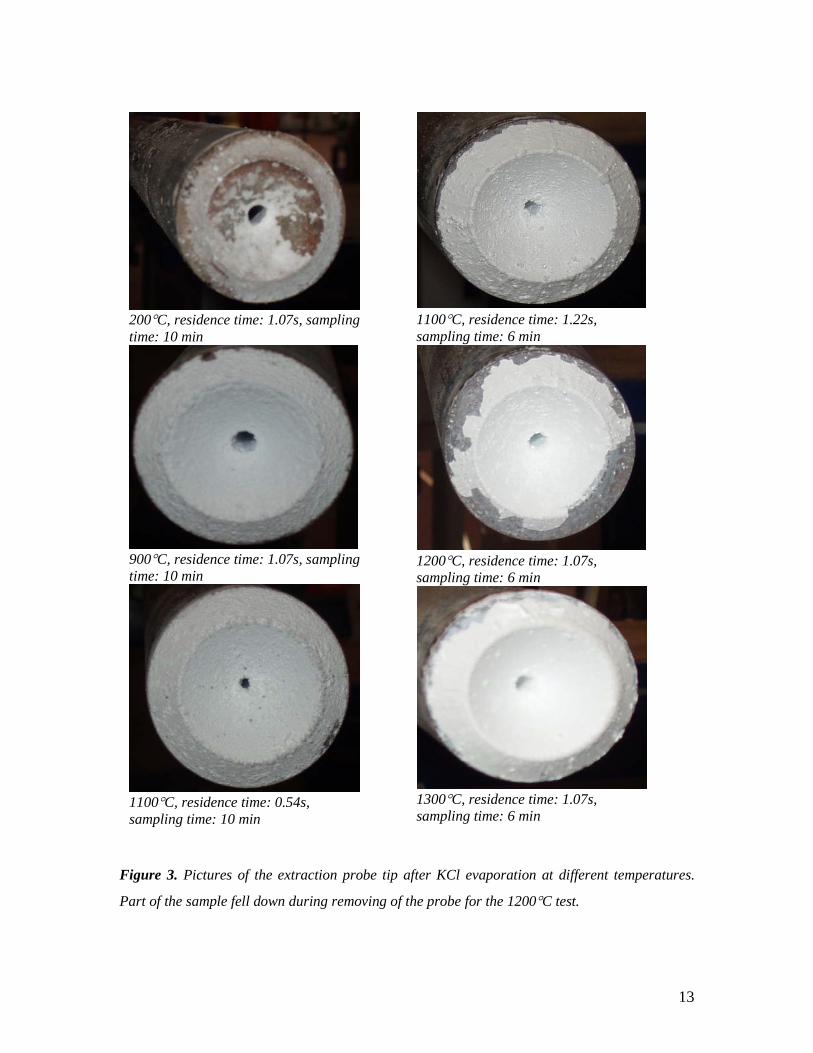
Figure 3 shows the pictures of the sampling probe tip after KCl evaporation at different
temperatures. The deposit on the probe tip increases with the evaporation temperature
and time. The deposit fell down as flakes during cleaning instead of powders for the
evaporation tests at temperatures above 1100°C. The sampling time was reduced from 10
min to 6 min to avoid plugging of the extraction probe for evaporation tests above
1100°C.

12
Table 3. Detailed results of KCl powder evaporation tests.
Temperature (0C) 200 200 600 900 900 900 1100 1100 1100 1200 1200 1300 Residence time (s) 1.07 2.67 1.07 1.07 1.07 1.07 0.54 1.07 1.22 1.07 1.07 1.07 Sampling duration (s) 600 600 600 600 600 600 600 509 360 360 360 360 Actual feed (g) 9.8 9.9 10.0 10.0 10.0 10.1 10.4 8.5 7.0 7.0 5.6 5.9 Calculated KCl concentration in the bulk gas (g/Nl) 0.016 0.017 0.017 0.017 0.017 0.017 0.017 0.017 0.019 0.019 0.016 0.016 Sampling flow (Nl/min) 14.830 15.017 14.269 16.320 16.499 17.400 11.414 16.710 15.502 15.905 15.722 16.165 Collected aerosol (g) 0.017 0.012 0.012 0.120 0.126 0.155 0.195 0.217 0.118 0.069 0.054 0.043 Collected cyclone sample (g) 0.000 0.001 0.000 0.018 0.014 0.029 0.000 0.002 0.000 0.000 0.000 0.000 Collected pipe sample (g) 0.134 0.079 0.127 0.317 0.313 0.311 0.005 0.008 0.011 0.001 0.000 0.000 Collected probe tip sample(g) 0.278 0.28 0.17 0.435 0.362 - 0.438 0.335 0.293 0.289 0.314 0.237 Collected inside probe sample (g) 0.176 0.176 0.131 0.244 0.222 - 0.175 0.17 0.097 0.09 0.075 0.063 Total collected sample (g) 0.605 0.548 0.44 1.134 1.037 - 0.813 0.732 0.519 0.449 0.443 0.343 Calculated sample collection from sampling flow and KCl concentration in bulk gas (g) 2.422 2.478 2.378 2.72 2.75 2.93 1.978 2.367 1.809 1.856 1.467 1.59 Collected sample/calculated collection (%) 24.98 22.12 18.5 41.69 37.71 - 41.09 30.92 28.7 24.2 30.19 21.58 Aerosol/total collected sample (%) 2.81 2.19 2.73 10.58 12.15 - 23.99 29.64 22.74 15.37 12.19 12.54 Aerosol/(aerosol+pipe+cyclone ash)(%) 11.26 13.04 8.63 26.37 27.81 31.31 97.50 95.59 91.47 98.57 100.00 100.00 Evaporation rate from model (%) 100 100 100 100 100 100 100 100 100
Note: Pipe samples are collected from the pipes connecting the extraction probe and the cyclone and aerosol filter.
13
Figure 3. Pictures of the extraction probe tip after KCl evaporation at different temperatures.
Part of the sample fell down during removing of the probe for the 1200°C test.
200°C, residence time: 1.07s, sampling time: 10 min
900°C, residence time: 1.07s, sampling time: 10 min
1100°C, residence time: 0.54s, sampling time: 10 min
1100°C, residence time: 1.22s, sampling time: 6 min
1200°C, residence time: 1.07s, sampling time: 6 min
1300°C, residence time: 1.07s, sampling time: 6 min
14
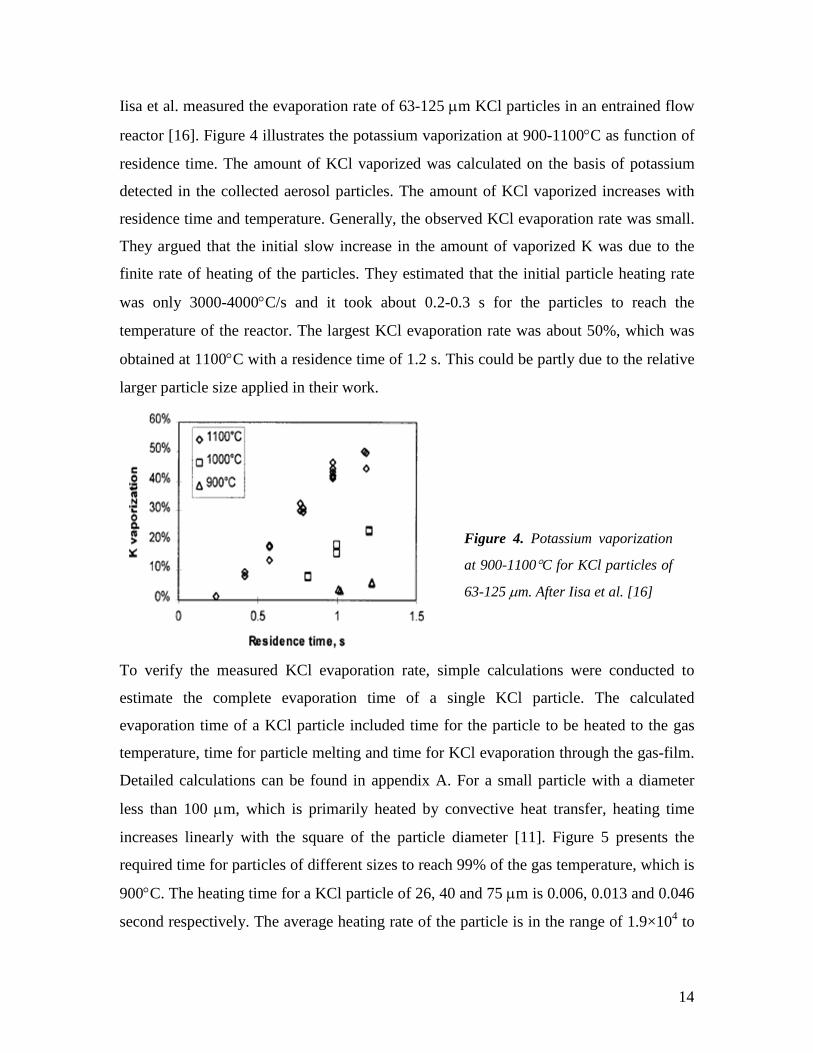
Iisa et al. measured the evaporation rate of 63-125 µm KCl particles in an entrained flow
reactor [16]. Figure 4 illustrates the potassium vaporization at 900-1100°C as function of
residence time. The amount of KCl vaporized was calculated on the basis of potassium
detected in the collected aerosol particles. The amount of KCl vaporized increases with
residence time and temperature. Generally, the observed KCl evaporation rate was small.
They argued that the initial slow increase in the amount of vaporized K was due to the
finite rate of heating of the particles. They estimated that the initial particle heating rate
was only 3000-4000°C/s and it took about 0.2-0.3 s for the particles to reach the
temperature of the reactor. The largest KCl evaporation rate was about 50%, which was
obtained at 1100°C with a residence time of 1.2 s. This could be partly due to the relative
larger particle size applied in their work.
To verify the measured KCl evaporation rate, simple calculations were conducted to
estimate the complete evaporation time of a single KCl particle. The calculated
evaporation time of a KCl particle included time for the particle to be heated to the gas
temperature, time for particle melting and time for KCl evaporation through the gas-film.
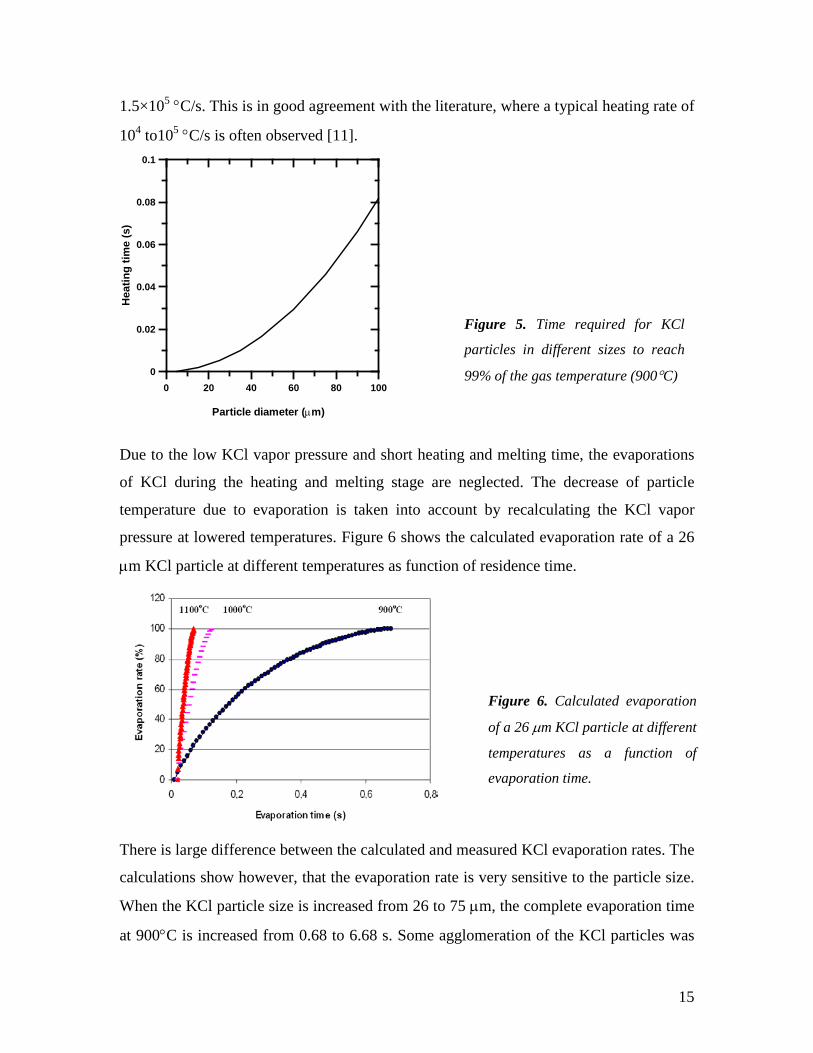
Detailed calculations can be found in appendix A. For a small particle with a diameter
less than 100 µm, which is primarily heated by convective heat transfer, heating time
increases linearly with the square of the particle diameter [11]. Figure 5 presents the
required time for particles of different sizes to reach 99% of the gas temperature, which is
900°C. The heating time for a KCl particle of 26, 40 and 75 µm is 0.006, 0.013 and 0.046
second respectively. The average heating rate of the particle is in the range of 1.9×10⁴ to
Figure 4. Potassium vaporization
at 900-1100°C for KCl particles of
63-125 µm. After Iisa et al. [16]
15
1.5×10⁵ °C/s. This is in good agreement with the literature, where a typical heating rate of
104 to105 °C/s is often observed [11].
0 20 40 60 80 100
Particle diameter (µm)
0
0.02
0.04
0.06
0.08
0.1
Hea
ting
time
(s)
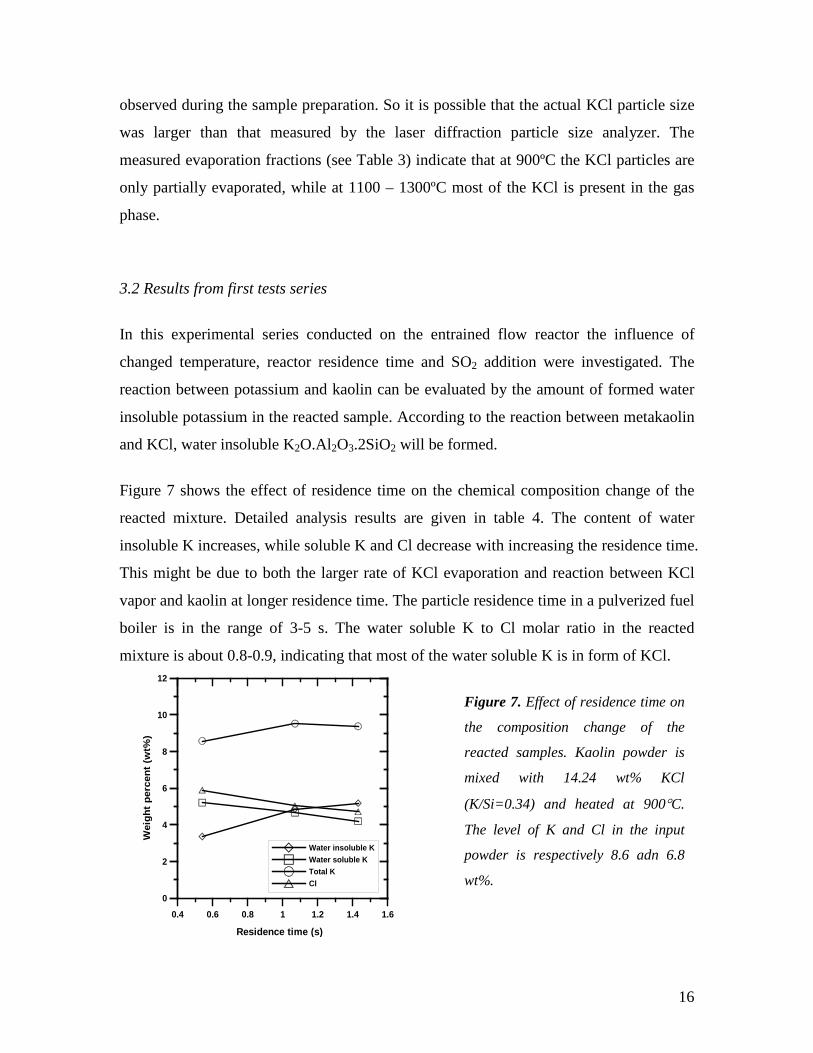
Due to the low KCl vapor pressure and short heating and melting time, the evaporations
of KCl during the heating and melting stage are neglected. The decrease of particle
temperature due to evaporation is taken into account by recalculating the KCl vapor
pressure at lowered temperatures. Figure 6 shows the calculated evaporation rate of a 26
µm KCl particle at different temperatures as function of residence time.
There is large difference between the calculated and measured KCl evaporation rates. The
calculations show however, that the evaporation rate is very sensitive to the particle size.
When the KCl particle size is increased from 26 to 75 µm, the complete evaporation time
at 900°C is increased from 0.68 to 6.68 s. Some agglomeration of the KCl particles was
Figure 5. Time required for KCl
particles in different sizes to reach
99% of the gas temperature (900°C)
Figure 6. Calculated evaporation
of a 26 µm KCl particle at different
temperatures as a function of
evaporation time.
16
observed during the sample preparation. So it is possible that the actual KCl particle size
was larger than that measured by the laser diffraction particle size analyzer. The
measured evaporation fractions (see Table 3) indicate that at 900ºC the KCl particles are
only partially evaporated, while at 1100 – 1300ºC most of the KCl is present in the gas
phase.
3.2 Results from first tests series
In this experimental series conducted on the entrained flow reactor the influence of
changed temperature, reactor residence time and SO2 addition were investigated. The
reaction between potassium and kaolin can be evaluated by the amount of formed water
insoluble potassium in the reacted sample. According to the reaction between metakaolin
and KCl, water insoluble K2O.Al2O3.2SiO2 will be formed.
Figure 7 shows the effect of residence time on the chemical composition change of the
reacted mixture. Detailed analysis results are given in table 4. The content of water
insoluble K increases, while soluble K and Cl decrease with increasing the residence time.
This might be due to both the larger rate of KCl evaporation and reaction between KCl
vapor and kaolin at longer residence time. The particle residence time in a pulverized fuel
boiler is in the range of 3-5 s. The water soluble K to Cl molar ratio in the reacted
mixture is about 0.8-0.9, indicating that most of the water soluble K is in form of KCl.
0.4 0.6 0.8 1 1.2 1.4 1.6
Residence time (s)
0
2
4
6
8
10
12
Wei
ght p
erce
nt (w
t%)
Water insoluble KWater soluble KTotal KCl
Figure 7. Effect of residence time on
the composition change of the
reacted samples. Kaolin powder is
mixed with 14.24 wt% KCl
(K/Si=0.34) and heated at 900°C.
The level of K and Cl in the input
powder is respectively 8.6 adn 6.8
wt%.
17
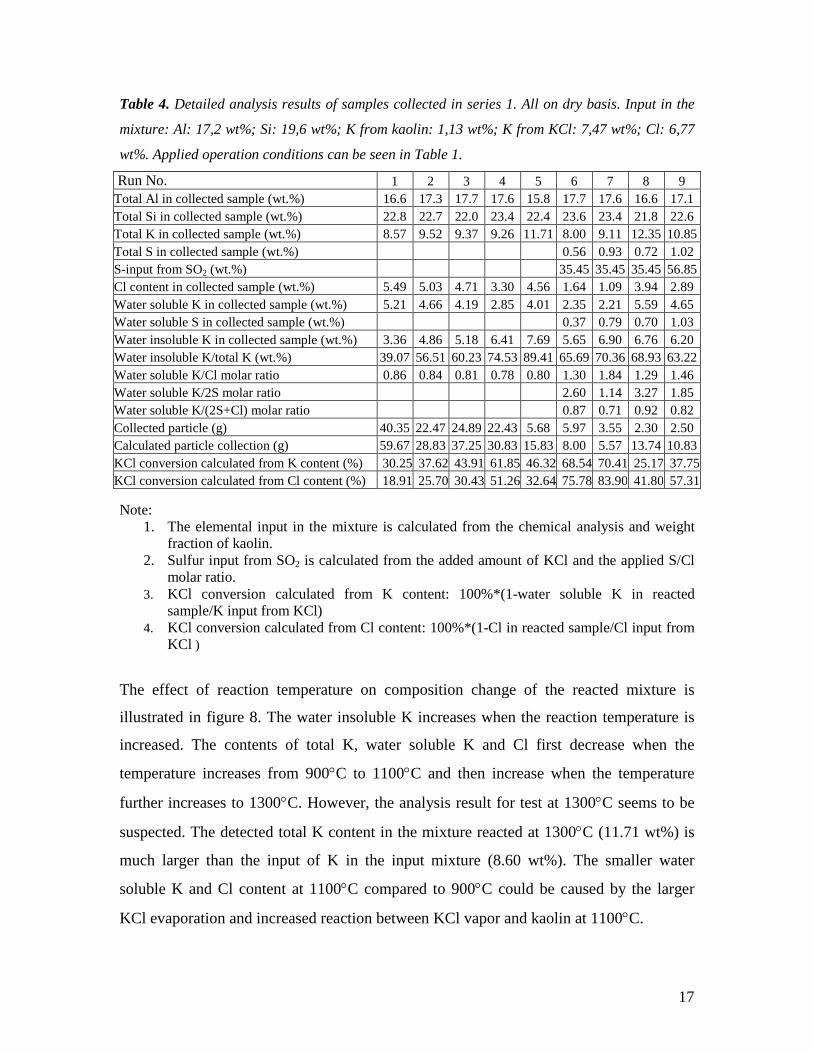
Table 4. Detailed analysis results of samples collected in series 1. All on dry basis. Input in the
mixture: Al: 17,2 wt%; Si: 19,6 wt%; K from kaolin: 1,13 wt%; K from KCl: 7,47 wt%; Cl: 6,77
wt%. Applied operation conditions can be seen in Table 1.
Run No. 1 2 3 4 5 6 7 8 9 Total Al in collected sample (wt.%) 16.6 17.3 17.7 17.6 15.8 17.7 17.6 16.6 17.1 Total Si in collected sample (wt.%) 22.8 22.7 22.0 23.4 22.4 23.6 23.4 21.8 22.6 Total K in collected sample (wt.%) 8.57 9.52 9.37 9.26 11.71 8.00 9.11 12.35 10.85 Total S in collected sample (wt.%) 0.56 0.93 0.72 1.02 S-input from SO2 (wt.%) 35.45 35.45 35.45 56.85 Cl content in collected sample (wt.%) 5.49 5.03 4.71 3.30 4.56 1.64 1.09 3.94 2.89 Water soluble K in collected sample (wt.%) 5.21 4.66 4.19 2.85 4.01 2.35 2.21 5.59 4.65 Water soluble S in collected sample (wt.%) 0.37 0.79 0.70 1.03 Water insoluble K in collected sample (wt.%) 3.36 4.86 5.18 6.41 7.69 5.65 6.90 6.76 6.20 Water insoluble K/total K (wt.%) 39.07 56.51 60.23 74.53 89.41 65.69 70.36 68.93 63.22 Water soluble K/Cl molar ratio 0.86 0.84 0.81 0.78 0.80 1.30 1.84 1.29 1.46 Water soluble K/2S molar ratio 2.60 1.14 3.27 1.85 Water soluble K/(2S+Cl) molar ratio 0.87 0.71 0.92 0.82 Collected particle (g) 40.35 22.47 24.89 22.43 5.68 5.97 3.55 2.30 2.50 Calculated particle collection (g) 59.67 28.83 37.25 30.83 15.83 8.00 5.57 13.74 10.83 KCl conversion calculated from K content (%) 30.25 37.62 43.91 61.85 46.32 68.54 70.41 25.17 37.75 KCl conversion calculated from Cl content (%) 18.91 25.70 30.43 51.26 32.64 75.78 83.90 41.80 57.31
Note:
1. The elemental input in the mixture is calculated from the chemical analysis and weight fraction of kaolin.
2. Sulfur input from SO2 is calculated from the added amount of KCl and the applied S/Cl molar ratio.
3. KCl conversion calculated from K content: 100%*(1-water soluble K in reacted sample/K input from KCl)
4. KCl conversion calculated from Cl content: 100%*(1-Cl in reacted sample/Cl input from KCl )
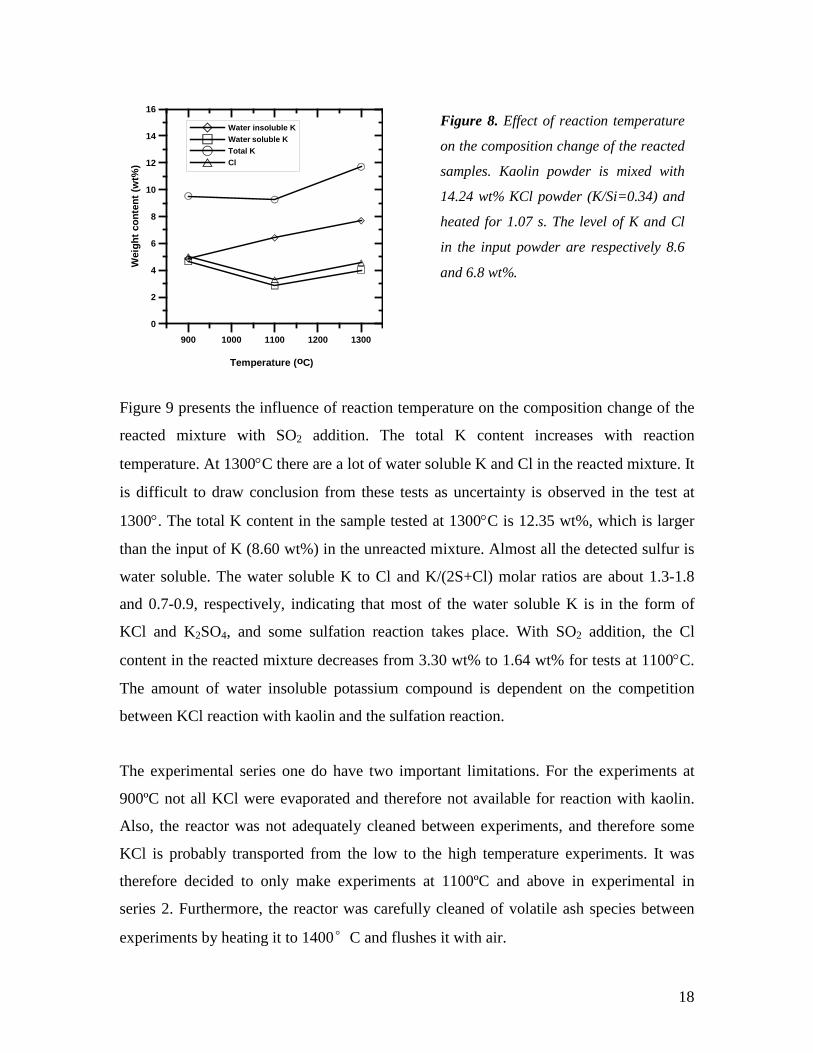
The effect of reaction temperature on composition change of the reacted mixture is
illustrated in figure 8. The water insoluble K increases when the reaction temperature is
increased. The contents of total K, water soluble K and Cl first decrease when the
temperature increases from 900°C to 1100°C and then increase when the temperature
further increases to 1300°C. However, the analysis result for test at 1300°C seems to be
suspected. The detected total K content in the mixture reacted at 1300°C (11.71 wt%) is
much larger than the input of K in the input mixture (8.60 wt%). The smaller water
soluble K and Cl content at 1100°C compared to 900°C could be caused by the larger
KCl evaporation and increased reaction between KCl vapor and kaolin at 1100°C.
18
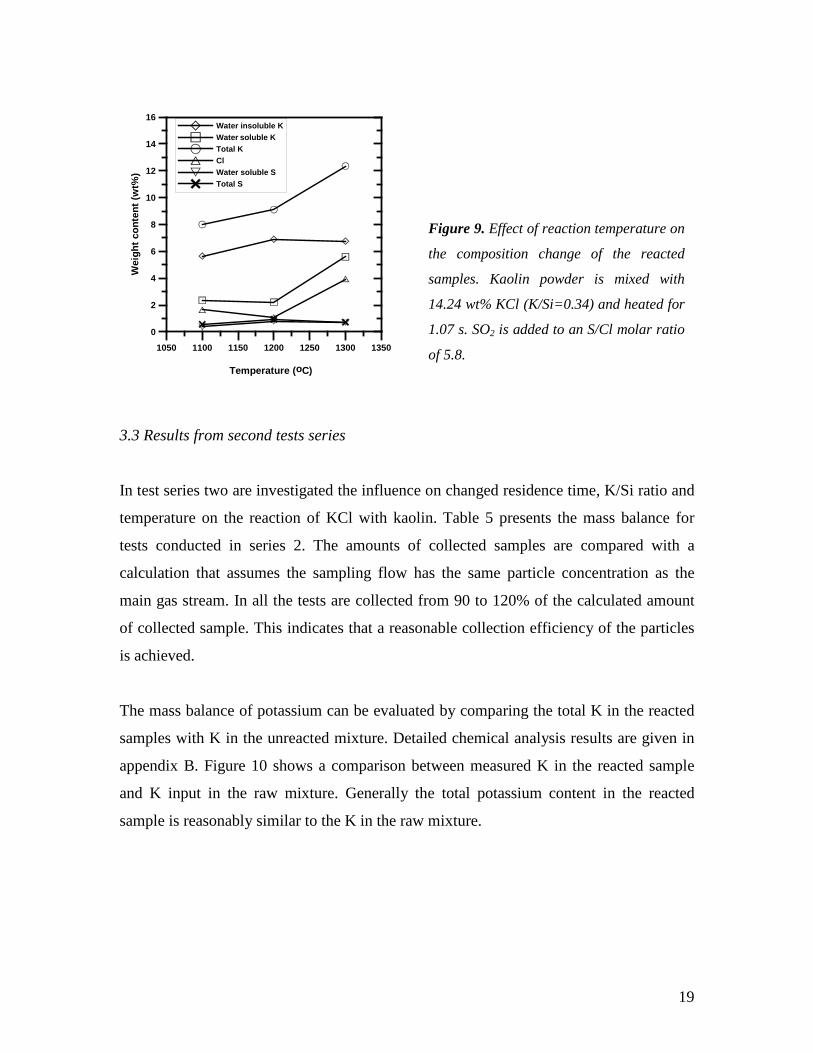
Figure 9 presents the influence of reaction temperature on the composition change of the
reacted mixture with SO2 addition. The total K content increases with reaction
temperature. At 1300°C there are a lot of water soluble K and Cl in the reacted mixture. It
is difficult to draw conclusion from these tests as uncertainty is observed in the test at
1300°. The total K content in the sample tested at 1300°C is 12.35 wt%, which is larger
than the input of K (8.60 wt%) in the unreacted mixture. Almost all the detected sulfur is
water soluble. The water soluble K to Cl and K/(2S+Cl) molar ratios are about 1.3-1.8
and 0.7-0.9, respectively, indicating that most of the water soluble K is in the form of
KCl and K2SO4, and some sulfation reaction takes place. With SO2 addition, the Cl
content in the reacted mixture decreases from 3.30 wt% to 1.64 wt% for tests at 1100°C.
The amount of water insoluble potassium compound is dependent on the competition
between KCl reaction with kaolin and the sulfation reaction.
The experimental series one do have two important limitations. For the experiments at
900ºC not all KCl were evaporated and therefore not available for reaction with kaolin.
Also, the reactor was not adequately cleaned between experiments, and therefore some
KCl is probably transported from the low to the high temperature experiments. It was
therefore decided to only make experiments at 1100ºC and above in experimental in
series 2. Furthermore, the reactor was carefully cleaned of volatile ash species between
experiments by heating it to 1400°C and flushes it with air.
900 1000 1100 1200 1300
Temperature (oC)
0
2
4
6
8
10
12
14
16
Wei
ght c
onte
nt (w
t%)
Water insoluble KWater soluble KTotal KCl
Figure 8. Effect of reaction temperature
on the composition change of the reacted
samples. Kaolin powder is mixed with
14.24 wt% KCl powder (K/Si=0.34) and
heated for 1.07 s. The level of K and Cl
in the input powder are respectively 8.6
and 6.8 wt%.
19
3.3 Results from second tests series
In test series two are investigated the influence on changed residence time, K/Si ratio and
temperature on the reaction of KCl with kaolin. Table 5 presents the mass balance for
tests conducted in series 2. The amounts of collected samples are compared with a
calculation that assumes the sampling flow has the same particle concentration as the
main gas stream. In all the tests are collected from 90 to 120% of the calculated amount
of collected sample. This indicates that a reasonable collection efficiency of the particles
is achieved.
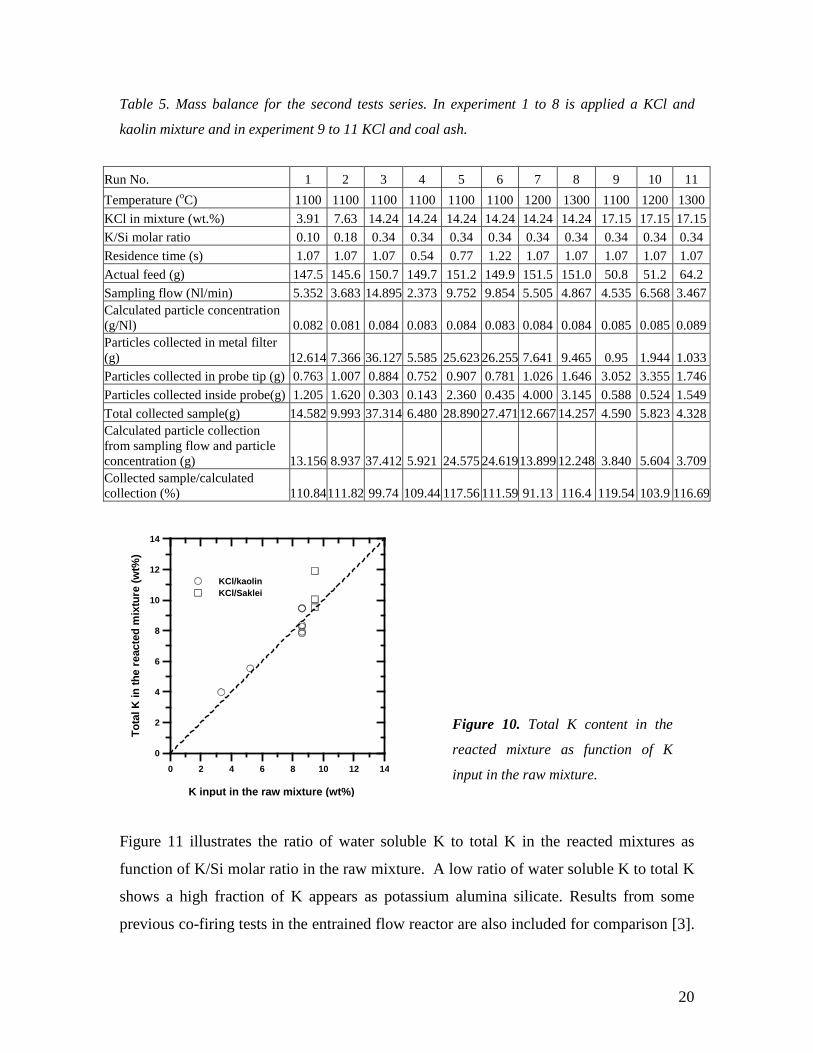
The mass balance of potassium can be evaluated by comparing the total K in the reacted
samples with K in the unreacted mixture. Detailed chemical analysis results are given in
appendix B. Figure 10 shows a comparison between measured K in the reacted sample
and K input in the raw mixture. Generally the total potassium content in the reacted
sample is reasonably similar to the K in the raw mixture.
1050 1100 1150 1200 1250 1300 1350
Temperature (oC)
0
2
4
6
8
10
12
14
16
Wei
ght c
onte
nt (w
t%)
Water insoluble KWater soluble KTotal KClWater soluble STotal S
Figure 9. Effect of reaction temperature on
the composition change of the reacted
samples. Kaolin powder is mixed with
14.24 wt% KCl (K/Si=0.34) and heated for
1.07 s. SO2 is added to an S/Cl molar ratio
of 5.8.
20
Table 5. Mass balance for the second tests series. In experiment 1 to 8 is applied a KCl and
kaolin mixture and in experiment 9 to 11 KCl and coal ash.
Figure 11 illustrates the ratio of water soluble K to total K in the reacted mixtures as
function of K/Si molar ratio in the raw mixture. A low ratio of water soluble K to total K
shows a high fraction of K appears as potassium alumina silicate. Results from some
previous co-firing tests in the entrained flow reactor are also included for comparison [3].
Run No. 1 2 3 4 5 6 7 8 9 10 11 Temperature (oC) 1100 1100 1100 1100 1100 1100 1200 1300 1100 1200 1300 KCl in mixture (wt.%) 3.91 7.63 14.24 14.24 14.24 14.24 14.24 14.24 17.15 17.15 17.15 K/Si molar ratio 0.10 0.18 0.34 0.34 0.34 0.34 0.34 0.34 0.34 0.34 0.34 Residence time (s) 1.07 1.07 1.07 0.54 0.77 1.22 1.07 1.07 1.07 1.07 1.07 Actual feed (g) 147.5 145.6 150.7 149.7 151.2 149.9 151.5 151.0 50.8 51.2 64.2 Sampling flow (Nl/min) 5.352 3.683 14.895 2.373 9.752 9.854 5.505 4.867 4.535 6.568 3.467 Calculated particle concentration (g/Nl) 0.082 0.081 0.084 0.083 0.084 0.083 0.084 0.084 0.085 0.085 0.089 Particles collected in metal filter (g) 12.614 7.366 36.127 5.585 25.623 26.255 7.641 9.465 0.95 1.944 1.033 Particles collected in probe tip (g) 0.763 1.007 0.884 0.752 0.907 0.781 1.026 1.646 3.052 3.355 1.746 Particles collected inside probe(g) 1.205 1.620 0.303 0.143 2.360 0.435 4.000 3.145 0.588 0.524 1.549 Total collected sample(g) 14.582 9.993 37.314 6.480 28.890 27.471 12.667 14.257 4.590 5.823 4.328 Calculated particle collection from sampling flow and particle concentration (g) 13.156 8.937 37.412 5.921 24.575 24.619 13.899 12.248 3.840 5.604 3.709 Collected sample/calculated collection (%) 110.84 111.82 99.74 109.44 117.56 111.59 91.13 116.4 119.54 103.9 116.69
0 2 4 6 8 10 12 14
K input in the raw mixture (wt%)
0
2
4
6
8
10
12
14
Tota
l K in
the
reac
ted
mix
ture
(wt%
)
KCl/kaolinKCl/Saklei
Figure 10. Total K content in the
reacted mixture as function of K
input in the raw mixture.
21
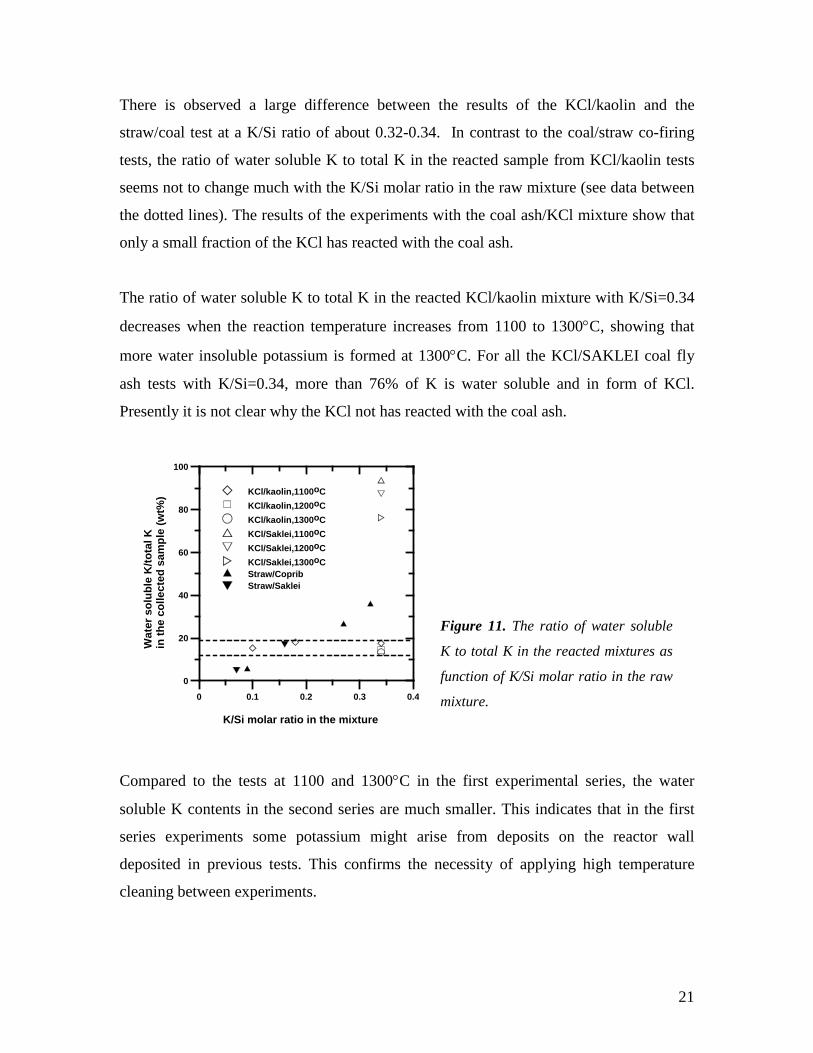
There is observed a large difference between the results of the KCl/kaolin and the
straw/coal test at a K/Si ratio of about 0.32-0.34. In contrast to the coal/straw co-firing
tests, the ratio of water soluble K to total K in the reacted sample from KCl/kaolin tests
seems not to change much with the K/Si molar ratio in the raw mixture (see data between
the dotted lines). The results of the experiments with the coal ash/KCl mixture show that
only a small fraction of the KCl has reacted with the coal ash.
The ratio of water soluble K to total K in the reacted KCl/kaolin mixture with K/Si=0.34
decreases when the reaction temperature increases from 1100 to 1300°C, showing that
more water insoluble potassium is formed at 1300°C. For all the KCl/SAKLEI coal fly
ash tests with K/Si=0.34, more than 76% of K is water soluble and in form of KCl.
Presently it is not clear why the KCl not has reacted with the coal ash.
Compared to the tests at 1100 and 1300°C in the first experimental series, the water
soluble K contents in the second series are much smaller. This indicates that in the first
series experiments some potassium might arise from deposits on the reactor wall
deposited in previous tests. This confirms the necessity of applying high temperature
cleaning between experiments.
0 0.1 0.2 0.3 0.4
K/Si molar ratio in the mixture
0
20
40
60
80
100
Wat
er s
olub
le K
/tota
l K
in th
e co
llect
ed s
ampl
e (w
t%) KCl/kaolin,1100oC
KCl/kaolin,1200oCKCl/kaolin,1300oCKCl/Saklei,1100oCKCl/Saklei,1200oCKCl/Saklei,1300oCStraw/CopribStraw/Saklei
Figure 11. The ratio of water soluble
K to total K in the reacted mixtures as
function of K/Si molar ratio in the raw
mixture.
22
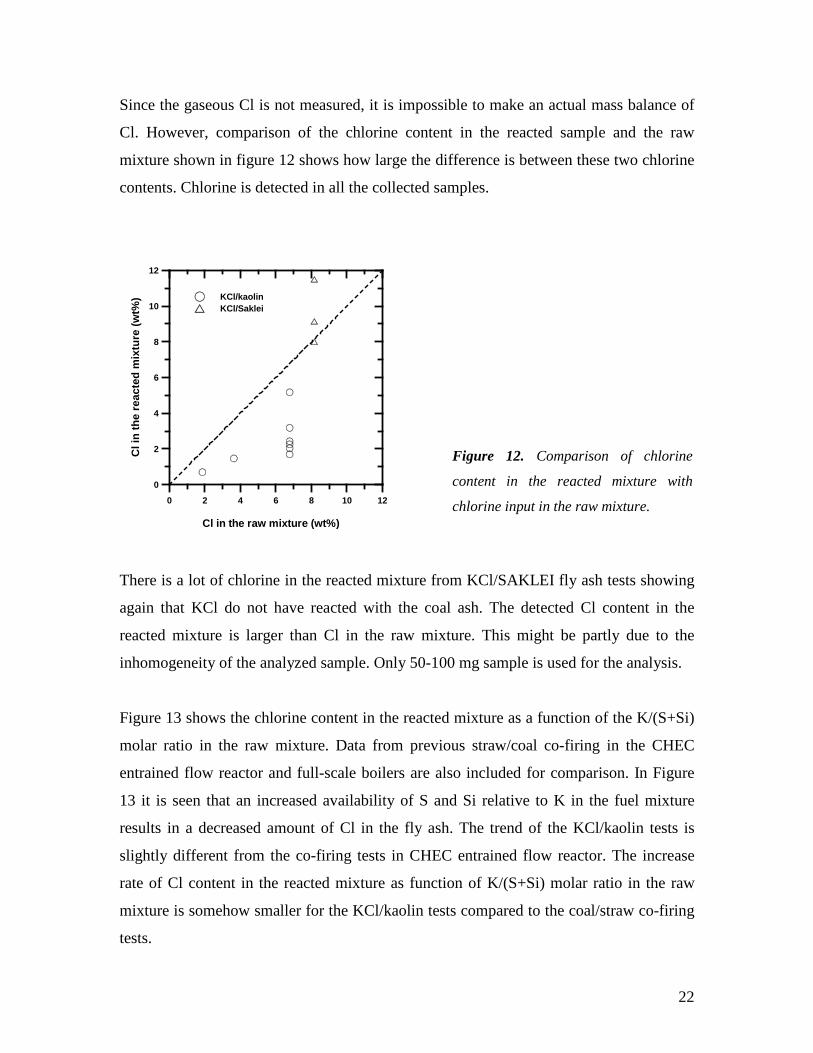
Since the gaseous Cl is not measured, it is impossible to make an actual mass balance of
Cl. However, comparison of the chlorine content in the reacted sample and the raw
mixture shown in figure 12 shows how large the difference is between these two chlorine
contents. Chlorine is detected in all the collected samples.
There is a lot of chlorine in the reacted mixture from KCl/SAKLEI fly ash tests showing
again that KCl do not have reacted with the coal ash. The detected Cl content in the
reacted mixture is larger than Cl in the raw mixture. This might be partly due to the
inhomogeneity of the analyzed sample. Only 50-100 mg sample is used for the analysis.
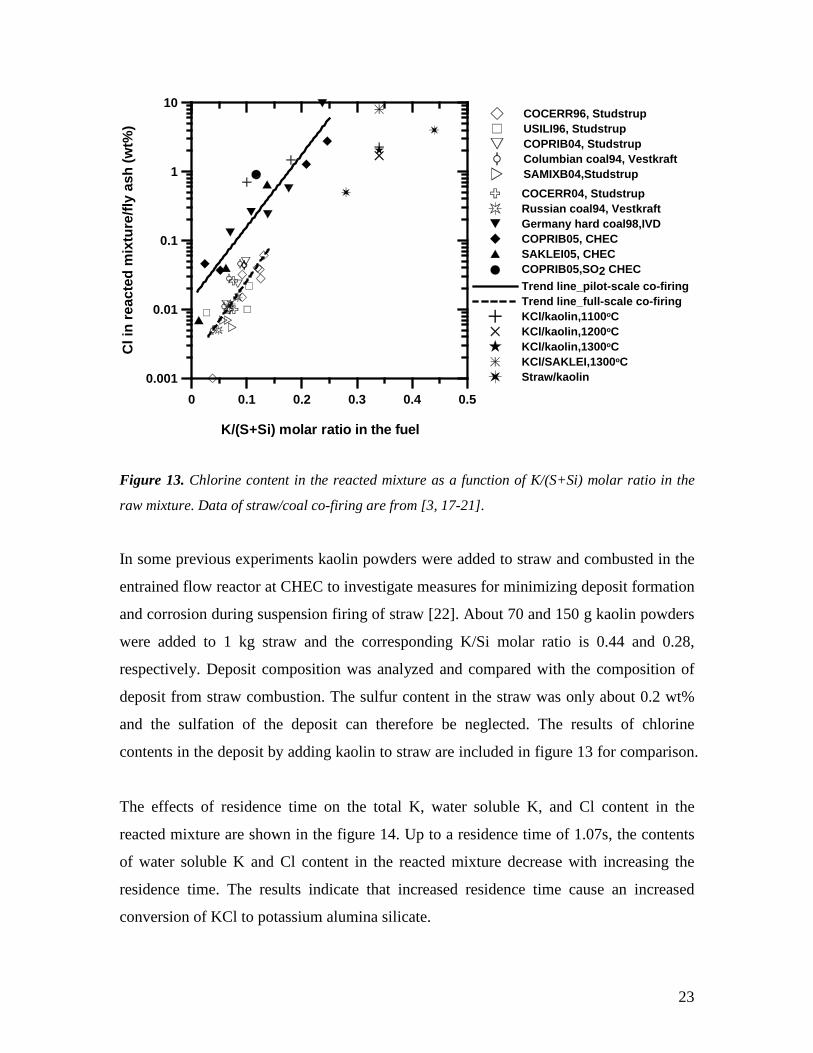
Figure 13 shows the chlorine content in the reacted mixture as a function of the K/(S+Si)
molar ratio in the raw mixture. Data from previous straw/coal co-firing in the CHEC
entrained flow reactor and full-scale boilers are also included for comparison. In Figure
13 it is seen that an increased availability of S and Si relative to K in the fuel mixture
results in a decreased amount of Cl in the fly ash. The trend of the KCl/kaolin tests is
slightly different from the co-firing tests in CHEC entrained flow reactor. The increase
rate of Cl content in the reacted mixture as function of K/(S+Si) molar ratio in the raw
mixture is somehow smaller for the KCl/kaolin tests compared to the coal/straw co-firing
tests.
0 2 4 6 8 10 12
Cl in the raw mixture (wt%)
0
2
4
6
8
10
12
Cl i
n th
e re
acte
d m
ixtu
re (w
t%) KCl/kaolin
KCl/Saklei
Figure 12. Comparison of chlorine
content in the reacted mixture with
chlorine input in the raw mixture.
23
0 0.1 0.2 0.3 0.4 0.5
K/(S+Si) molar ratio in the fuel
0.001
0.01
0.1
1
10
Cl i
n re
acte
d m
ixtu
re/fl
y as
h (w
t%)
COCERR96, StudstrupUSILI96, StudstrupCOPRIB04, StudstrupColumbian coal94, VestkraftSAMIXB04,StudstrupCOCERR04, StudstrupRussian coal94, VestkraftGermany hard coal98,IVDCOPRIB05, CHECSAKLEI05, CHECCOPRIB05,SO2 CHECTrend line_pilot-scale co-firingTrend line_full-scale co-firingKCl/kaolin,1100oCKCl/kaolin,1200oCKCl/kaolin,1300oCKCl/SAKLEI,1300oCStraw/kaolin
Figure 13. Chlorine content in the reacted mixture as a function of K/(S+Si) molar ratio in the
raw mixture. Data of straw/coal co-firing are from [3, 17-21].
In some previous experiments kaolin powders were added to straw and combusted in the
entrained flow reactor at CHEC to investigate measures for minimizing deposit formation
and corrosion during suspension firing of straw [22]. About 70 and 150 g kaolin powders
were added to 1 kg straw and the corresponding K/Si molar ratio is 0.44 and 0.28,
respectively. Deposit composition was analyzed and compared with the composition of
deposit from straw combustion. The sulfur content in the straw was only about 0.2 wt%
and the sulfation of the deposit can therefore be neglected. The results of chlorine
contents in the deposit by adding kaolin to straw are included in figure 13 for comparison.
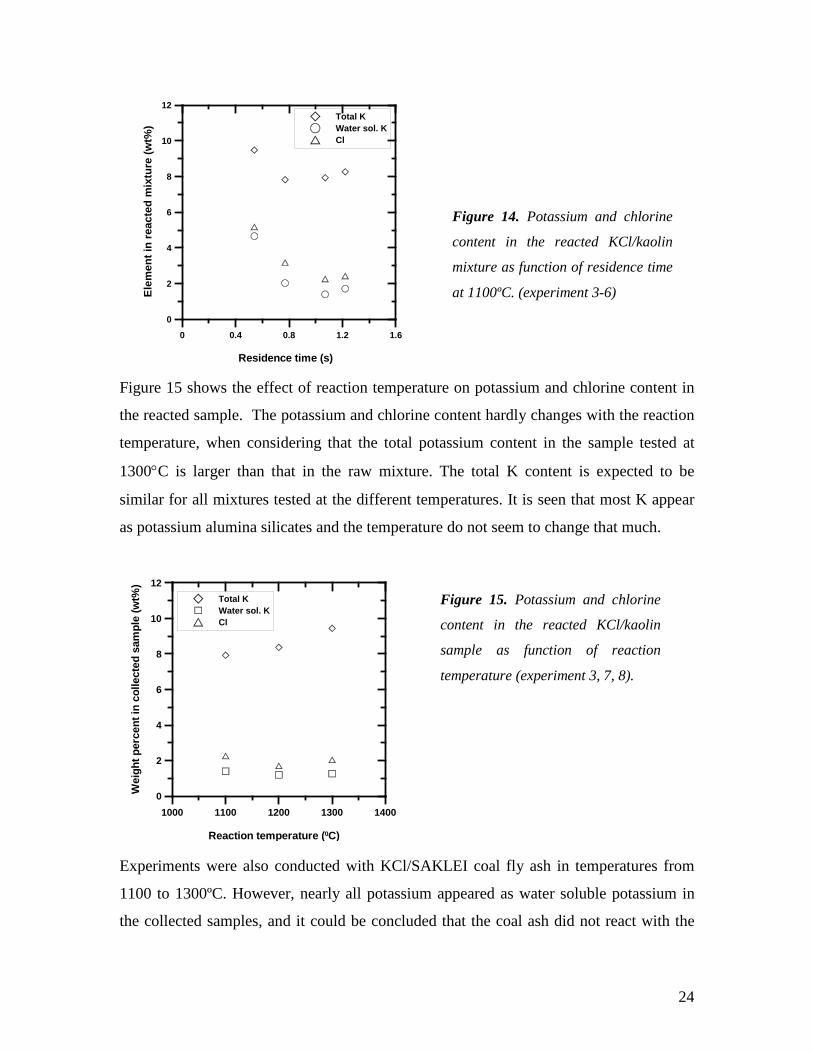
The effects of residence time on the total K, water soluble K, and Cl content in the
reacted mixture are shown in the figure 14. Up to a residence time of 1.07s, the contents
of water soluble K and Cl content in the reacted mixture decrease with increasing the
residence time. The results indicate that increased residence time cause an increased
conversion of KCl to potassium alumina silicate.
24
Figure 15 shows the effect of reaction temperature on potassium and chlorine content in
the reacted sample. The potassium and chlorine content hardly changes with the reaction
temperature, when considering that the total potassium content in the sample tested at
1300°C is larger than that in the raw mixture. The total K content is expected to be
similar for all mixtures tested at the different temperatures. It is seen that most K appear
as potassium alumina silicates and the temperature do not seem to change that much.
Experiments were also conducted with KCl/SAKLEI coal fly ash in temperatures from
1100 to 1300ºC. However, nearly all potassium appeared as water soluble potassium in
the collected samples, and it could be concluded that the coal ash did not react with the
0 0.4 0.8 1.2 1.6
Residence time (s)
0
2
4
6
8
10
12
Elem
ent i
n re
acte
d m
ixtu
re (w
t%)
Total KWater sol. KCl
1000 1100 1200 1300 1400
Reaction temperature (0C)
0
2
4
6
8
10
12
Wei
ght p
erce
nt in
col
lect
ed s
ampl
e (w
t%)
Total KWater sol. KCl
Figure 14. Potassium and chlorine
content in the reacted KCl/kaolin
mixture as function of residence time
at 1100ºC. (experiment 3-6)
Figure 15. Potassium and chlorine
content in the reacted KCl/kaolin
sample as function of reaction
temperature (experiment 3, 7, 8).
25
KCl. Presently it is not clear why only a limited reaction was observed. Previous test with
SAKLAI coal and straw showed a high capability of the SAKLAI coal ash to bind
potassium.
Detailed measuring data from both the SAKLAI and kaolin tests are shown in appendix B.
Based on the potassium contents measurements it was calculated that in the KCl/kaolin
tests between 73 and 84 % of the inlet potassium was converted to potassium alumina
silicates in the cases with temperatures from 1100 to 1300ºC and residence times of
approximately 1.1 second.
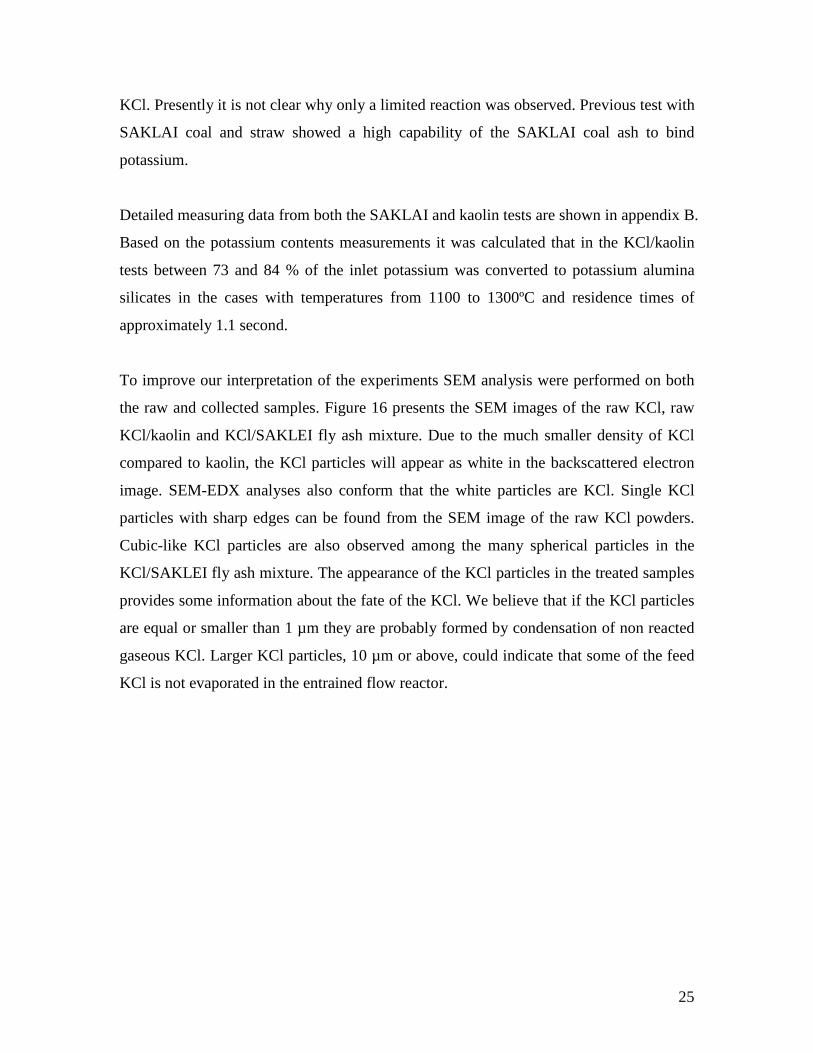
To improve our interpretation of the experiments SEM analysis were performed on both
the raw and collected samples. Figure 16 presents the SEM images of the raw KCl, raw
KCl/kaolin and KCl/SAKLEI fly ash mixture. Due to the much smaller density of KCl
compared to kaolin, the KCl particles will appear as white in the backscattered electron
image. SEM-EDX analyses also conform that the white particles are KCl. Single KCl
particles with sharp edges can be found from the SEM image of the raw KCl powders.
Cubic-like KCl particles are also observed among the many spherical particles in the
KCl/SAKLEI fly ash mixture. The appearance of the KCl particles in the treated samples
provides some information about the fate of the KCl. We believe that if the KCl particles
are equal or smaller than 1 µm they are probably formed by condensation of non reacted
gaseous KCl. Larger KCl particles, 10 µm or above, could indicate that some of the feed
KCl is not evaporated in the entrained flow reactor.
26
Figure 16. SEM images of raw KCl, KCl/kaolin/SAKLEI fly ash mixture.
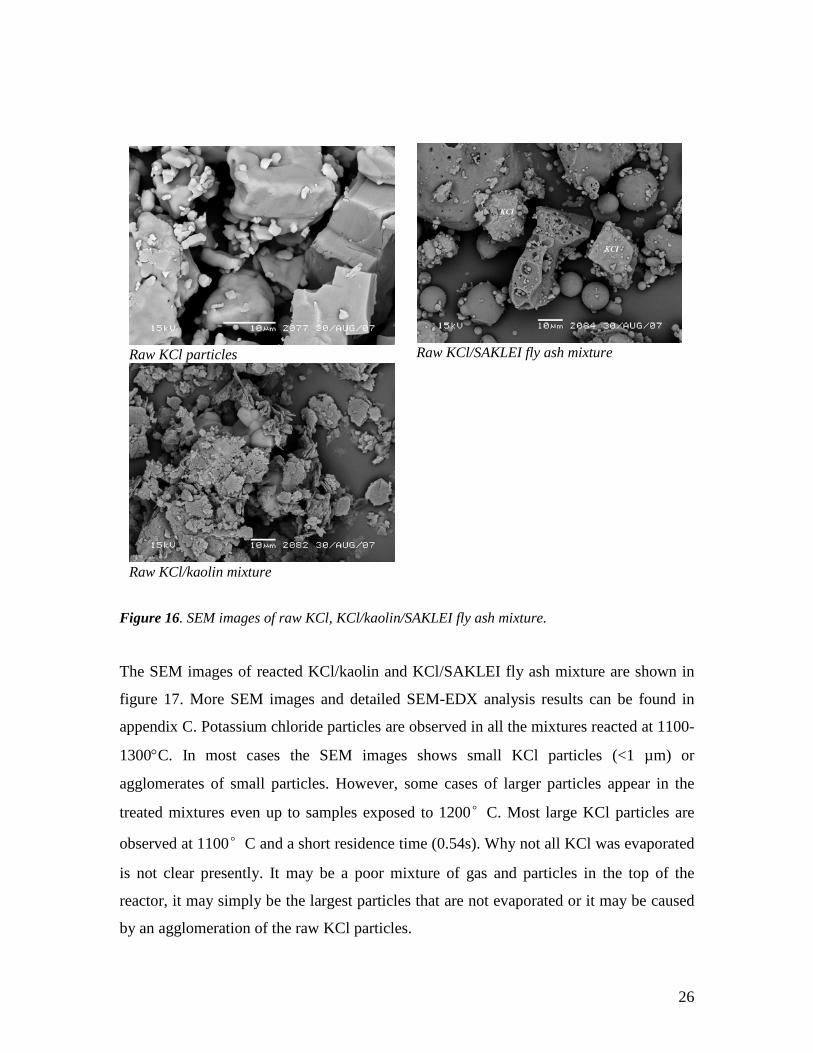
The SEM images of reacted KCl/kaolin and KCl/SAKLEI fly ash mixture are shown in
figure 17. More SEM images and detailed SEM-EDX analysis results can be found in
appendix C. Potassium chloride particles are observed in all the mixtures reacted at 1100-
1300°C. In most cases the SEM images shows small KCl particles (<1 µm) or
agglomerates of small particles. However, some cases of larger particles appear in the
treated mixtures even up to samples exposed to 1200°C. Most large KCl particles are
observed at 1100°C and a short residence time (0.54s). Why not all KCl was evaporated
is not clear presently. It may be a poor mixture of gas and particles in the top of the
reactor, it may simply be the largest particles that are not evaporated or it may be caused
by an agglomeration of the raw KCl particles.
Raw KCl particles
Raw KCl/kaolin mixture
Raw KCl/SAKLEI fly ash mixture
27
Figure 17. SEM images of reacted KCl/kaolin and KCl/SAKLEI fly ash mixtures.
KCl/kaolin mixture with K/Si=0.34, reacted at 1100°C for 0.54 s.
KCl/kaolin mixture with K/Si=0.34, reacted at 1100°C for 1.07 s.
KCl/kaolin mixture with K/Si=0.34, reacted at 1200°C for 1.07 s.
KCl/kaolin mixture with K/Si=0.34, reacted at 1300°C for 1.07 s
KCl/SAKLEI fly ash mixture with K/Si=0.34, reacted at 1100°C for 1.07 s
28
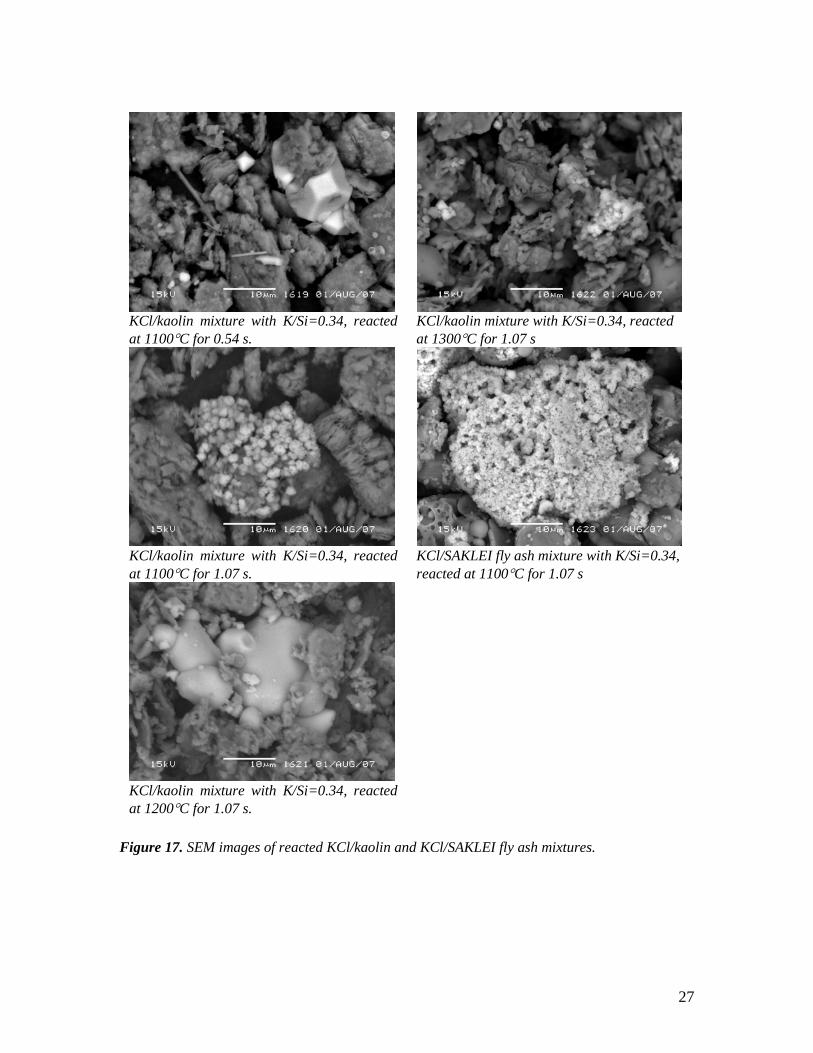
Figure 18 shows SEM images of deposits from previous straw/kaolin combustion tests
[22]. Two types of particles are observed in the deposit from straw combustion. There are
some silica rich spheres with a size of 10-30 µm. The other small particles are KCl and
K2SO4 which glue the big particles together or deposit on the surfaces of the big particles.
The big particles in the deposit from straw/kaolin tests are rich in Al, Si and K. No non
converted kaolin particles were observed.
Figure 18. SEM images of deposit from straw/kaolin tests [22]. Left: pure straw; right: straw and
kaolin.
Compared to the straw/kaolin combustion tests, the kaolin particles from KCl/kaolin tests
appear as flakes rather than spheres. This is probably due to the lack of a flame and
therefore a low temperature in the KCl/kaolin test compared to the combustion studies.
The actual local flue gas temperature in the top of the reactor is probably in the range of
1400-1700°C during the combustion experiments [22]. Particles in the present KCl/kaolin
test are much less melted than the combustion ash.
29
4. Model evaluation of parameters affecting potassium capture by kaolin in
entrained flow reactor
Model simulations are conducted to investigate the effects of parameters, such as particle
diameter, residence time, rate constant and particle KCl effective diffusion coefficient, on
potassium capture by kaolin powder in the entrained flow reactor. The previously
developed fixed-bed single particle model is extended to a plug flow model23. In such a
case kaolin powders are injected into a plug flow reactor and react with KCl vapor. The
bulk KCl concentration is therefore updated for each small time step. The KCl conversion
can be calculated from the single pellet conversion and the molar ratio of kaolin to KCl in
the flow. A simple gas-film control and a kinetic control model are also developed to
study the importance of external mass transfer and reaction kinetics on the potassium
capture by kaolin powders. Detailed description of the models can be found in appendix
D.
Since the previous developed fixed bed model23 works only at a reaction temperature of
900°C, simulations of the plug flow reactor are conducted at 900°C using the rate
constant and effective KCl diffusion coefficient from the fixed-bed single particle model,
i.e. k=3907 m3-gas/m3-solid/s, De=4.5E-6 m2/s. The calculated KCl concentration of
KCl/kaolin mixture with K/Si molar ratio of 0.34 at 900°C is 3550 ppmv (14.24 wt% of
KCl in the mixture, fed at a rate of 5 g/min to 60 Nl/min air). The corresponding kaolin to
KCl molar ratio is about 1.74 and the d50 size of kaolin powders is about 10 µm.
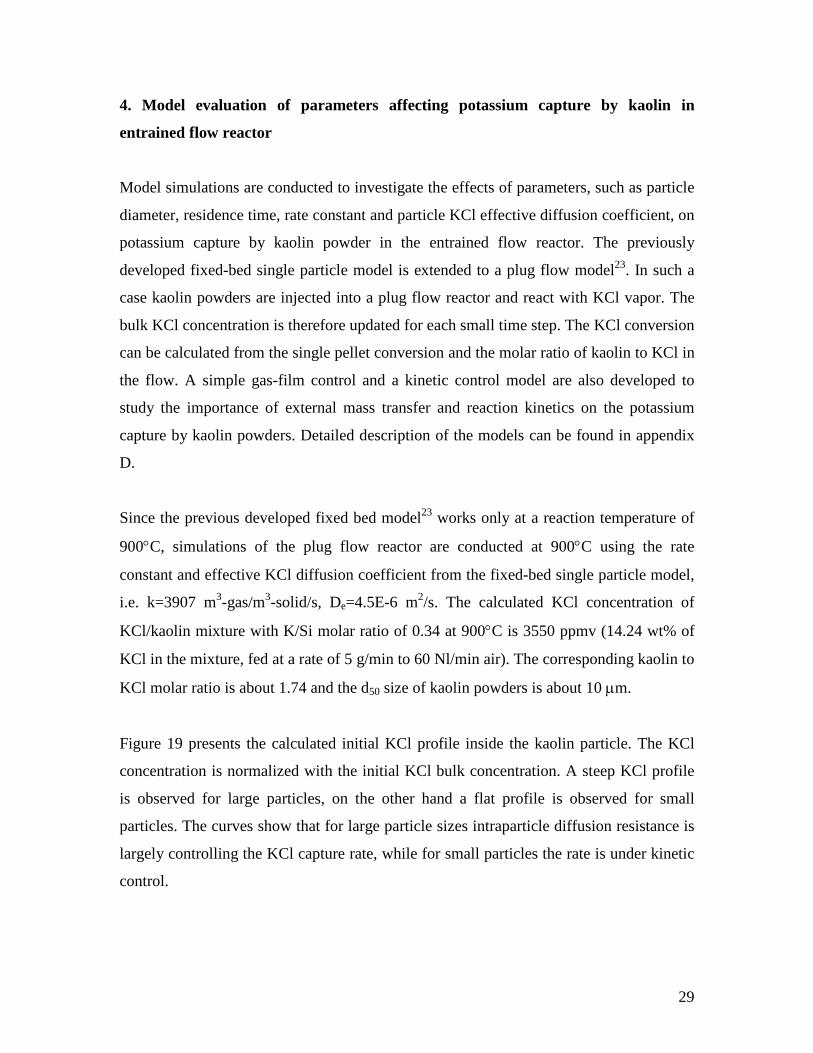
Figure 19 presents the calculated initial KCl profile inside the kaolin particle. The KCl
concentration is normalized with the initial KCl bulk concentration. A steep KCl profile
is observed for large particles, on the other hand a flat profile is observed for small
particles. The curves show that for large particle sizes intraparticle diffusion resistance is
largely controlling the KCl capture rate, while for small particles the rate is under kinetic
control.
30
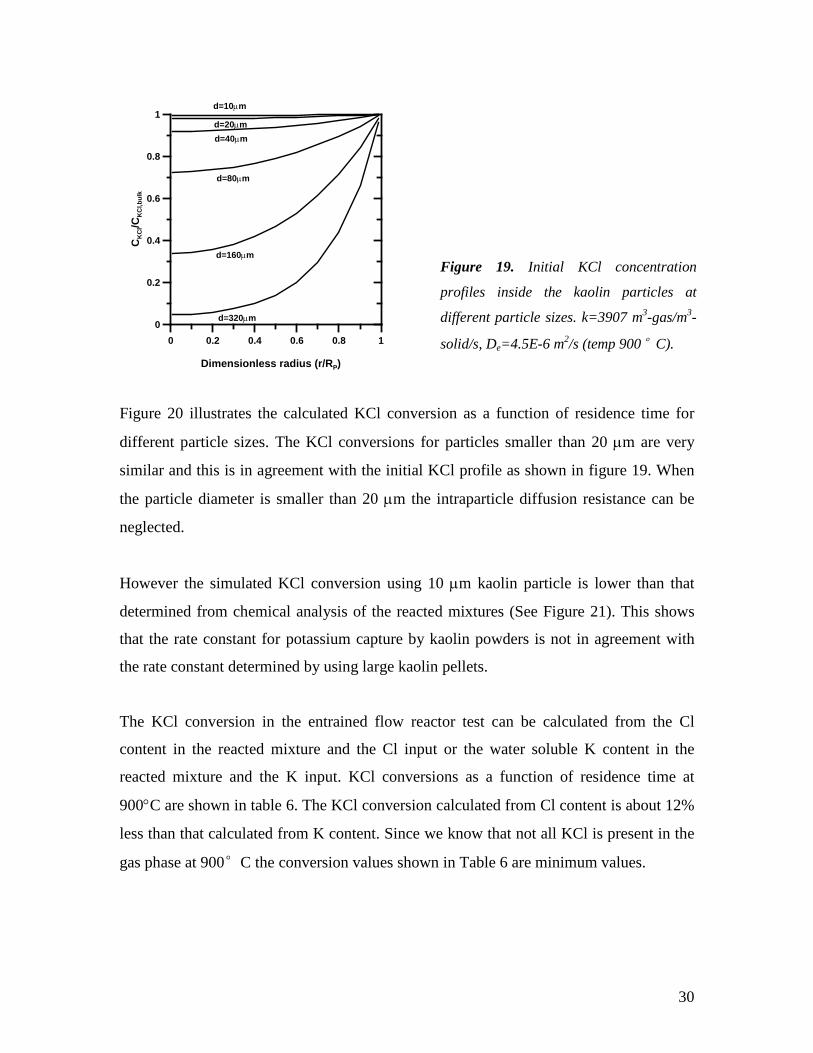
Figure 20 illustrates the calculated KCl conversion as a function of residence time for
different particle sizes. The KCl conversions for particles smaller than 20 µm are very
similar and this is in agreement with the initial KCl profile as shown in figure 19. When
the particle diameter is smaller than 20 µm the intraparticle diffusion resistance can be
neglected.
However the simulated KCl conversion using 10 µm kaolin particle is lower than that
determined from chemical analysis of the reacted mixtures (See Figure 21). This shows
that the rate constant for potassium capture by kaolin powders is not in agreement with
the rate constant determined by using large kaolin pellets.
The KCl conversion in the entrained flow reactor test can be calculated from the Cl
content in the reacted mixture and the Cl input or the water soluble K content in the
reacted mixture and the K input. KCl conversions as a function of residence time at
900°C are shown in table 6. The KCl conversion calculated from Cl content is about 12%
less than that calculated from K content. Since we know that not all KCl is present in the
gas phase at 900°C the conversion values shown in Table 6 are minimum values.
0 0.2 0.4 0.6 0.8 1
Dimensionless radius (r/RP)
0
0.2
0.4
0.6
0.8
1
CK
Cl/C
KC
l,bul
k
d=10µm
d=320µm
d=160µm
d=80µm
d=40µmd=20µm
Figure 19. Initial KCl concentration
profiles inside the kaolin particles at
different particle sizes. k=3907 m3-gas/m3-
solid/s, De=4.5E-6 m2/s (temp 900°C).
31
Table 6. Calculated KCl conversions for entrained flow reactor tests at 900°C.
Residence time (s) KCl conversion from Cl content (%)
KCl conversion from K content (%)
0.54 18.91 30.25 1.07 25.71 37.62 1.43 30.43 43.91
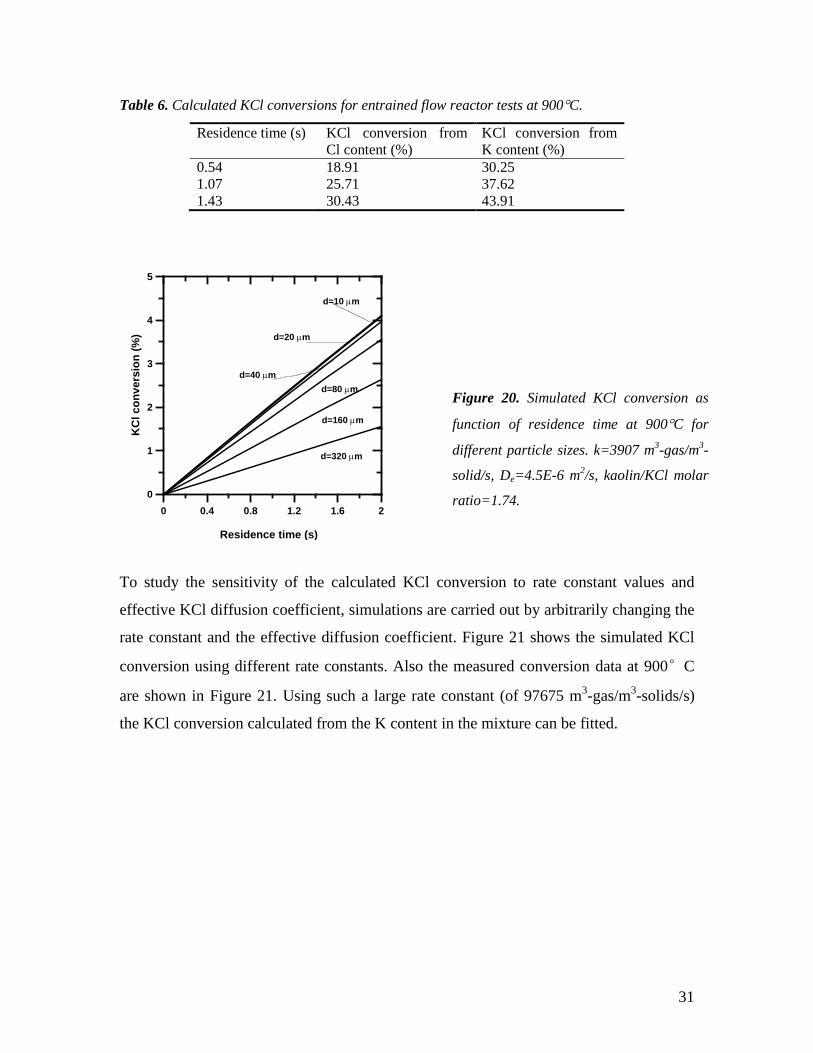
To study the sensitivity of the calculated KCl conversion to rate constant values and
effective KCl diffusion coefficient, simulations are carried out by arbitrarily changing the
rate constant and the effective diffusion coefficient. Figure 21 shows the simulated KCl
conversion using different rate constants. Also the measured conversion data at 900°C
are shown in Figure 21. Using such a large rate constant (of 97675 m3-gas/m3-solids/s)
the KCl conversion calculated from the K content in the mixture can be fitted.
0 0.4 0.8 1.2 1.6 2
Residence time (s)
0
1
2
3
4
5
KC
l con
vers
ion
(%)
d=320 µm
d=160 µm
d=80 µm
d=10 µm
d=20 µm
d=40 µm
Figure 20. Simulated KCl conversion as
function of residence time at 900°C for
different particle sizes. k=3907 m3-gas/m3-
solid/s, De=4.5E-6 m2/s, kaolin/KCl molar
ratio=1.74.
32
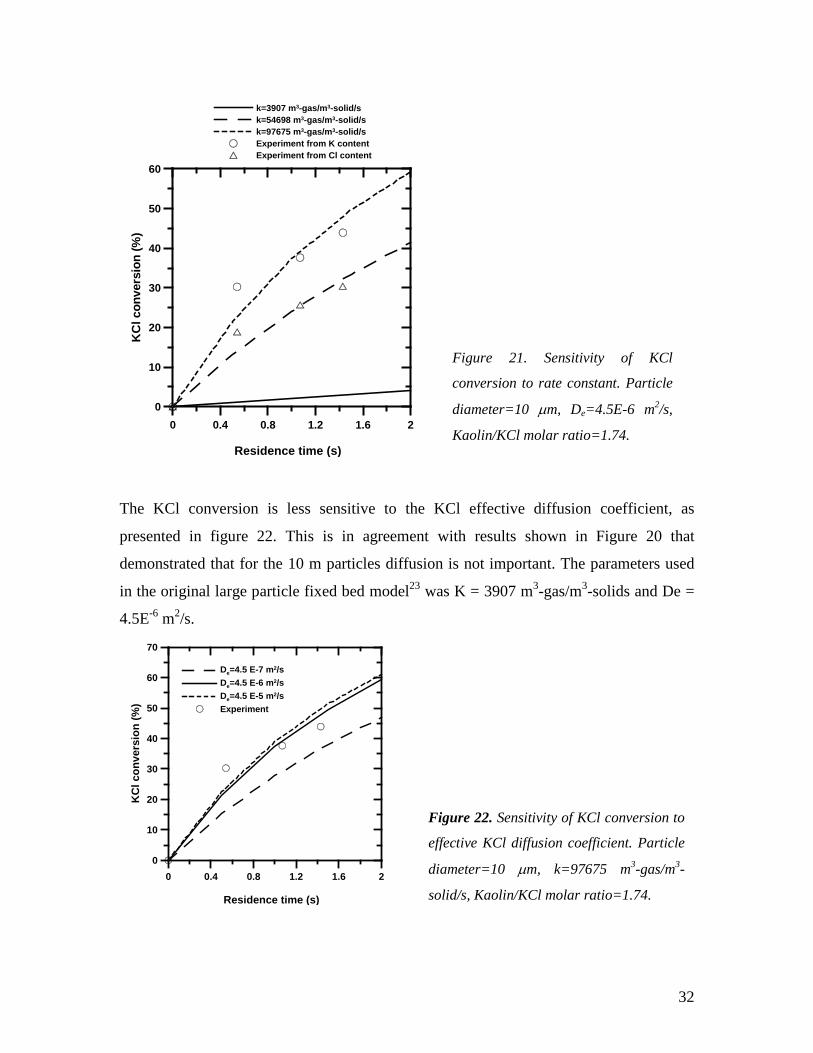
The KCl conversion is less sensitive to the KCl effective diffusion coefficient, as
presented in figure 22. This is in agreement with results shown in Figure 20 that
demonstrated that for the 10 m particles diffusion is not important. The parameters used
in the original large particle fixed bed model23 was K = 3907 m3-gas/m3-solids and De =
4.5E-6 m2/s.
0 0.4 0.8 1.2 1.6 2
Residence time (s)
0
10
20
30
40
50
60
KC
l con
vers
ion
(%)
k=3907 m3-gas/m3-solid/sk=54698 m3-gas/m3-solid/sk=97675 m3-gas/m3-solid/sExperiment from K contentExperiment from Cl content
0 0.4 0.8 1.2 1.6 2
Residence time (s)
0
10
20
30
40
50
60
70
KC
l con
vers
ion
(%)
De=4.5 E-7 m2/sDe=4.5 E-6 m2/sDe=4.5 E-5 m2/sExperiment
Figure 21. Sensitivity of KCl
conversion to rate constant. Particle
diameter=10 µm, De=4.5E-6 m2/s,
Kaolin/KCl molar ratio=1.74.
Figure 22. Sensitivity of KCl conversion to
effective KCl diffusion coefficient. Particle
diameter=10 µm, k=97675 m3-gas/m3-
solid/s, Kaolin/KCl molar ratio=1.74.
33
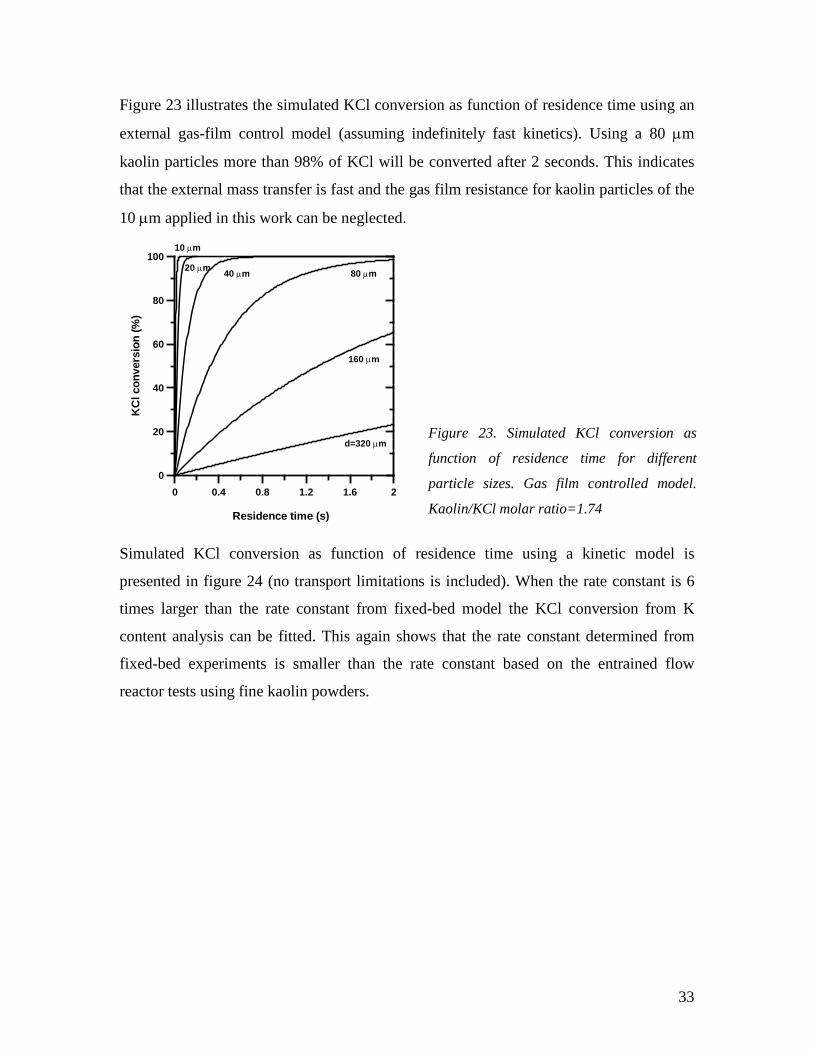
Figure 23 illustrates the simulated KCl conversion as function of residence time using an
external gas-film control model (assuming indefinitely fast kinetics). Using a 80 µm
kaolin particles more than 98% of KCl will be converted after 2 seconds. This indicates
that the external mass transfer is fast and the gas film resistance for kaolin particles of the
10 µm applied in this work can be neglected.
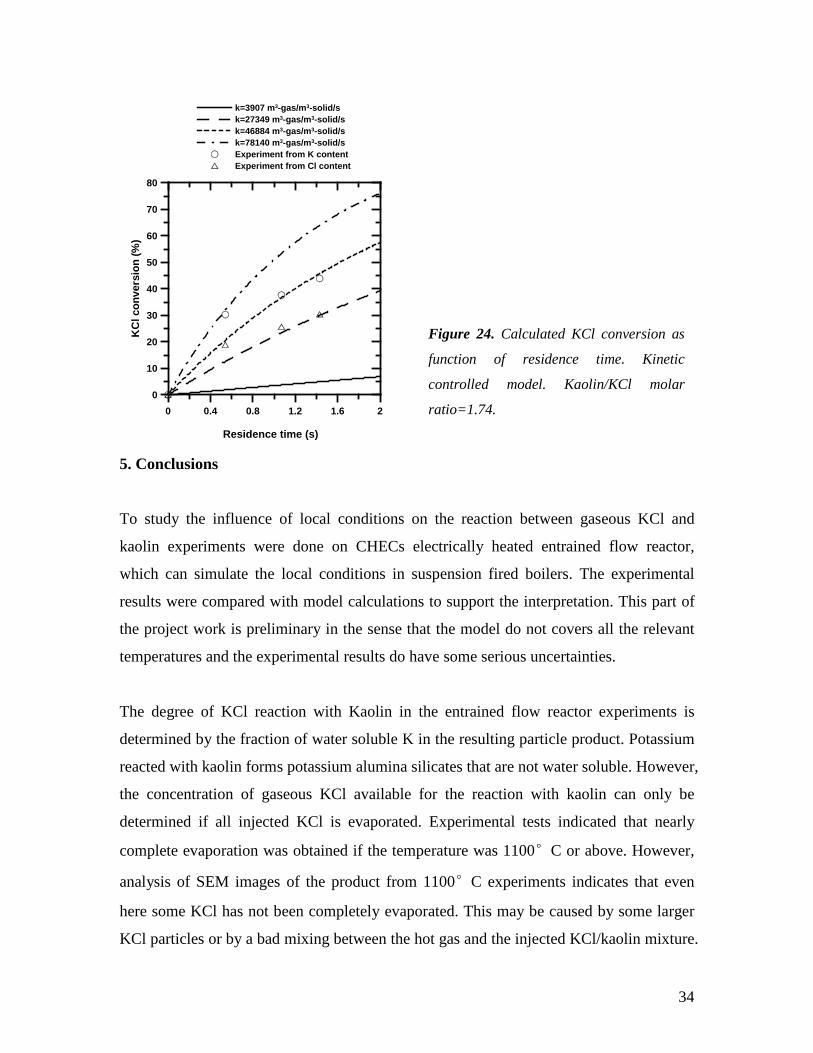
Simulated KCl conversion as function of residence time using a kinetic model is
presented in figure 24 (no transport limitations is included). When the rate constant is 6
times larger than the rate constant from fixed-bed model the KCl conversion from K
content analysis can be fitted. This again shows that the rate constant determined from
fixed-bed experiments is smaller than the rate constant based on the entrained flow
reactor tests using fine kaolin powders.
0 0.4 0.8 1.2 1.6 2
Residence time (s)
0
20
40
60
80
100
KC
l con
vers
ion
(%)
d=320 µm
160 µm
80 µm40 µm20 µm
10 µm
Figure 23. Simulated KCl conversion as
function of residence time for different
particle sizes. Gas film controlled model.
Kaolin/KCl molar ratio=1.74
34
5. Conclusions
To study the influence of local conditions on the reaction between gaseous KCl and
kaolin experiments were done on CHECs electrically heated entrained flow reactor,
which can simulate the local conditions in suspension fired boilers. The experimental
results were compared with model calculations to support the interpretation. This part of
the project work is preliminary in the sense that the model do not covers all the relevant
temperatures and the experimental results do have some serious uncertainties.
The degree of KCl reaction with Kaolin in the entrained flow reactor experiments is
determined by the fraction of water soluble K in the resulting particle product. Potassium
reacted with kaolin forms potassium alumina silicates that are not water soluble. However,
the concentration of gaseous KCl available for the reaction with kaolin can only be
determined if all injected KCl is evaporated. Experimental tests indicated that nearly
complete evaporation was obtained if the temperature was 1100°C or above. However,
analysis of SEM images of the product from 1100°C experiments indicates that even
here some KCl has not been completely evaporated. This may be caused by some larger
KCl particles or by a bad mixing between the hot gas and the injected KCl/kaolin mixture.
0 0.4 0.8 1.2 1.6 2
Residence time (s)
0
10
20
30
40
50
60
70
80
KC
l con
vers
ion
(%)
k=3907 m3-gas/m3-solid/sk=27349 m3-gas/m3-solid/sk=46884 m3-gas/m3-solid/sk=78140 m3-gas/m3-solid/sExperiment from K contentExperiment from Cl content
Figure 24. Calculated KCl conversion as
function of residence time. Kinetic
controlled model. Kaolin/KCl molar
ratio=1.74.
35
However, with some precaution the following conclusions can be provided based on the
experimental and modeling work:
- For particles bellow 20 µm the kinetics determine the conversion rate and both
external and internal transport limitations are not important.
- For experiments done at 1100°C with a molar ratio of K/Si=0.3 and a residence
time of 1.07s approximately 80% of potassium from KCl reacted with kaolin.
- A changed temperature (1100-1300 °C) or a changed amount of KCl (K/Si = 0.1
– 0.34) did only change the KCl conversion slightly.
- Si and Al rich coal ash seems to be less efficient to react with KCl compared to
kaolin. However the applied coal ash had a larger particle size (d50 = 22μm)
compared to the kaolin (d50 = 10μm).
- The kinetic rate constant of the reaction of KCl with kaolin have been determined
to be much larger for the entrained flow reactor experiments than the rate constant
determined from fixed bed experiments on larger particles. Presently the reason
for the observed deviation is not clear.
Acknowledgements
This study is financially supported by the PSO Energinet.dk project 4766 ‘Ash
transformation in suspension fired boilers co-firing coal and straw’. This work is part of
the CHEC (Combustion and Harmful Emission Control) research program, which is
funded a.o. by the Technical University of Denmark, the Danish Technical Research
Council, the European Union, the Nordic Energy Research, Dong Energy A/S, Vattenfall
A.B., FLSmidth A/S, and Public Service Obligation funds from Energinet.dk and the
Danish Energy Research program.
36
References
[1] European Bioenergy Networks, Biomass co-firing- an efficient way to reduce
greenhouse gas emissions, VTT processes, 2003.
[2] Sander B. Properties of Danish biofuels and the requirements for power production.
Biomass and Bioenergy 1997; 12(3):177-83.
[3] Zheng Y, Jensen PA, Jensen AD, Sander B, Junker H. Ash transformation during co-
firing coal and straw. Fuel 2007; 86: 1008-20.
[4] Sander B, Wieck-Hansen K. Full-scale investigations on alkali chemistry and ash
utilization by co-firing of straw. Proceedings of 14th European Biomass Conference and
Exhibition, Paris, 17-21 October, 2005.
[5] Wei X, Lopez C, von Puttkamer T, Schnell U, Unterberger S, Hein KRG. Assessment
of chlorine-alkali-mineral interactions during co-combustion of coal and straw. Energy &
Fuels 2002; 16:1095-108.
[6] Dayton DC, Belle-Oudry D, Nordin A. Effect of coal minerals on chlorine and alkali
metals released during biomass/coal cofiring. Energy & Fuels 1999; 13:1203-11.
[7] Lee SHD, Johnson U. Removal of gaseous alkali metal compounds from hot flue gas
by particulate sorbents. J. Eng. Power 1980; 102:397-402.
[8] Kyi S, Chadwick BL. Screening of potential mineral additives for use as fouling
preventatives in Victorian brown coal combustion. Fuel 1999; 78:845-55.
[9] Punjak WA, Shadman F. Aluminosilicate sorbents for control of alkali vapors during
coal combustion and gasification. Energy & Fuels 1988; 2:702-8.
[10] Tran KQ, Iisa K, Steenari BM, Lindqvist O. A kinetic study of gaseous alkali
capture by kaolin in the fixed bed reactor equipped with an alkali detector. Fuel 2005;
84:169-75.
[11] Wall TF. The combustion of coal as pulverized fuel through swirl burners, chapter 3
in Combustion Treatise, Principles of combustion engineering for boilers, Ed. Lawn CJ,
Academic Press, 1987.
[12] Vuthaluru HB, Vleeskens JM, Wall TF. Reducing fouling from brown coals by
sodium-binding additives. Fuel processing Technology 1998; 55:161-73.
37
[13] Vuthaluru HB, Remediation of ash problems in pulverized coal-fired boilers. Fuel
1999; 78:1789-803.
[14] Erickson TA, Ludlow DK, Benson SA. Interaction of sodium, sulfur and silica
during coal combustion. Energy & Fuels 1991; 5:539-47.
[15] Kosminski A, Ross DP, Agnew JB. Reactions between sodium and silica during
gasification of a low-rank coal. Fuel Processing Technology 2006; 87: 1037-49.
[16] Iisa K, Lu Y, Salmenoja K. Sulfation of potassium chloride at combustion conditions.
Energy & Fuels 1999; 1184-90.
[17] Sander B. Report of EU project UCOR–Utilization of residues from biomass co-
combustion in pulverized coal boilers, results from full-scale co-firing of coal and straw
at the Vest Kraft Power Station Unit 1. Elsam Engineering A/S, Report no. 02-443; 2002.
[18] Andersen KH. Deposit formatting during coal-straw co-combustion in a utility PF-
boiler. PhD thesis, Department of Chemical Engineering, Technical University of
Denmark, Kgs. Lyngby; 1998.
[19] Wieck-Hansen K, Sander B. Report of EU project UCOR–Utilization of residues
from biomass co-combustion in pulverized coal boilers, results from full-scale co-firing
of coal and straw at the Studstrup Power Station Unit 1. Elsam Engineering A/S, Report
No. 01-456; 2001.
[20] Sander B, Wieck-Hansen K. Full-scale investigations on alkali chemistry and ash
utilization by co-firing of straw. Proceedings of 14th European Biomass Conference and
Exhibition, Paris, 17-21 October, 2005.
[21] Heinzel T, Maier J, Baum J, Spliethoff H, Hein KRG. Slagging and fouling in dry
and molten ash PFC. Joule III programme Clean Coal Technology R&D, Vol. V,
European Commission, 1999; 1-63.
[22] Jensen PA, Frandsen F, Jensen A. Eksperimentel og teoretisk undersøgelse af
indvirkningen af additiver på belægningsdannelse og korrosion i suspensionsfyrede
kedler der anvender halmbrændsel. Del af PSO-Eltra Projekt 3149: Halmtilsatsfyring i
naturgasfyret kraftværkskedel.
[23] Zheng Y, Jensen PA, Jensen AD. A kinetic study of gaseous potassium capture by
coal minerals in a high temperature fixed-bed reactor. Fuel 2008; 87: 3304-3312.
38
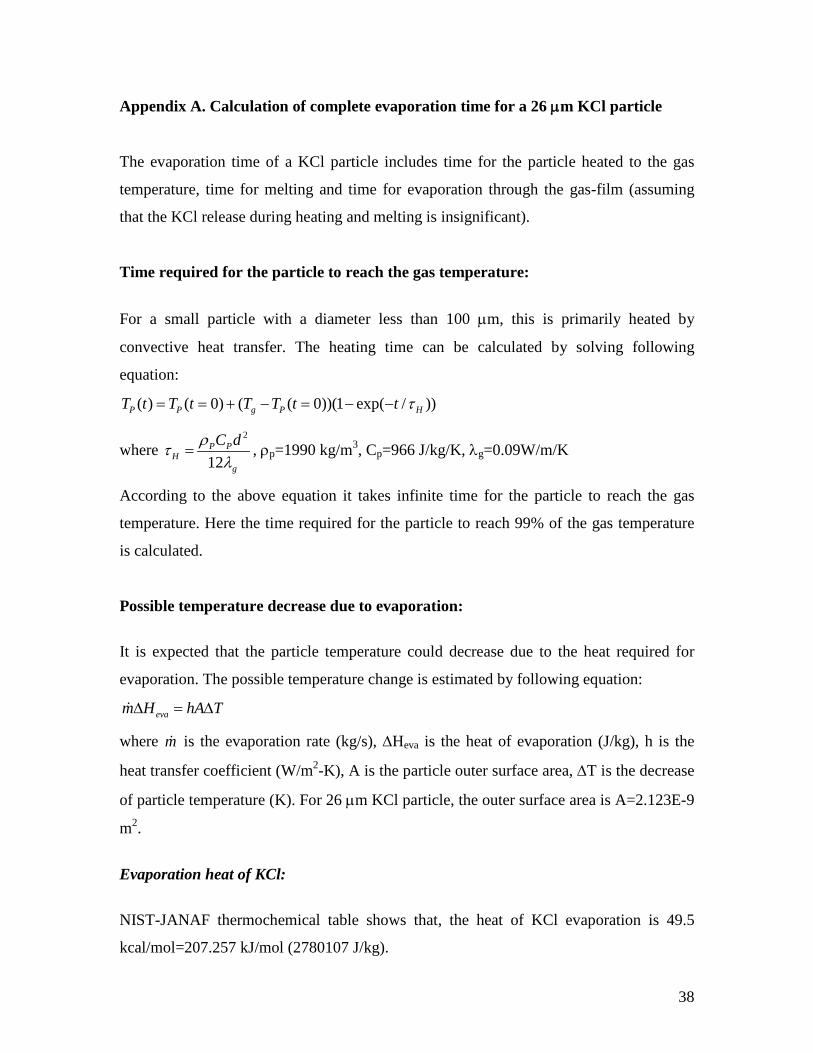
Appendix A. Calculation of complete evaporation time for a 26 µm KCl particle
The evaporation time of a KCl particle includes time for the particle heated to the gas
temperature, time for melting and time for evaporation through the gas-film (assuming
that the KCl release during heating and melting is insignificant).
Time required for the particle to reach the gas temperature:
For a small particle with a diameter less than 100 µm, this is primarily heated by
convective heat transfer. The heating time can be calculated by solving following
equation:
( ) ( 0) ( ( 0))(1 exp( / ))P P g P HT t T t T T t t τ= = + − = − −
where 2
12P P
Hg
C dρτλ
= , ρp=1990 kg/m3, Cp=966 J/kg/K, λg=0.09W/m/K
According to the above equation it takes infinite time for the particle to reach the gas
temperature. Here the time required for the particle to reach 99% of the gas temperature
is calculated.
Possible temperature decrease due to evaporation:
It is expected that the particle temperature could decrease due to the heat required for
evaporation. The possible temperature change is estimated by following equation:
evam H hA T∆ = ∆
where m is the evaporation rate (kg/s), ∆Heva is the heat of evaporation (J/kg), h is the
heat transfer coefficient (W/m2-K), A is the particle outer surface area, ∆T is the decrease
of particle temperature (K). For 26 µm KCl particle, the outer surface area is A=2.123E-9
m2.
Evaporation heat of KCl:
NIST-JANAF thermochemical table shows that, the heat of KCl evaporation is 49.5
kcal/mol=207.257 kJ/mol (2780107 J/kg).
39
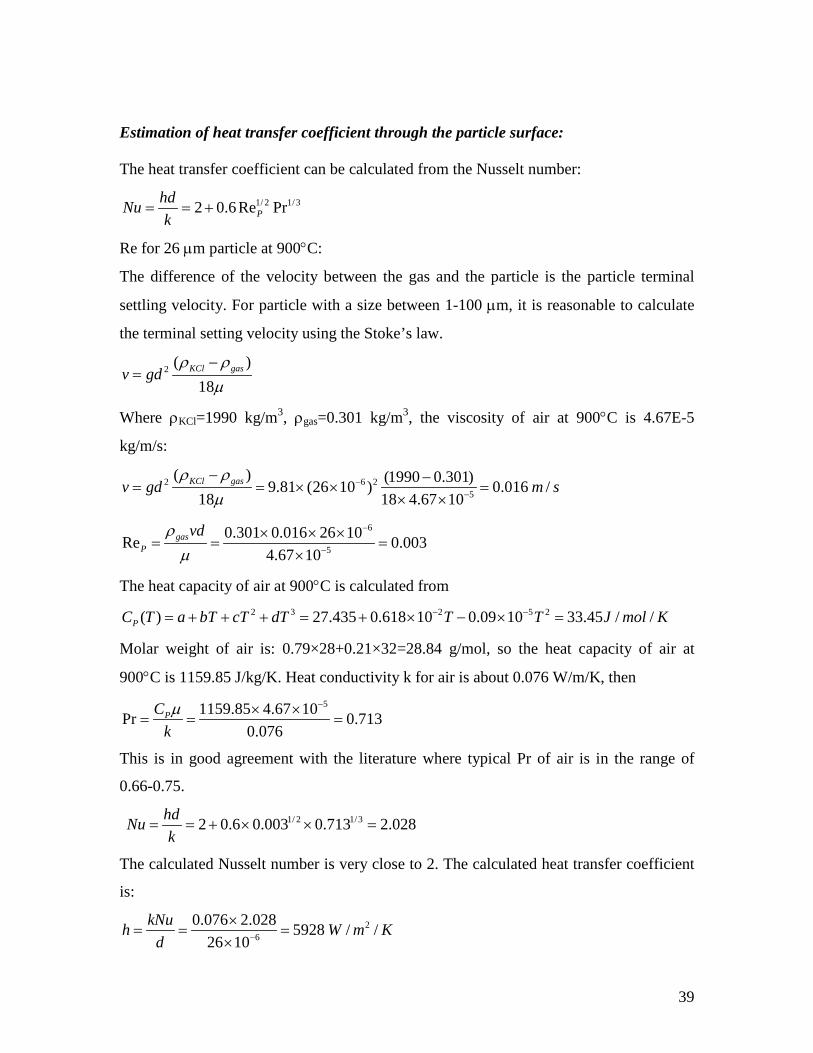
Estimation of heat transfer coefficient through the particle surface: The heat transfer coefficient can be calculated from the Nusselt number:
1/ 2 1/32 0.6Re PrPhdNuk
= = +
Re for 26 µm particle at 900°C:
The difference of the velocity between the gas and the particle is the particle terminal
settling velocity. For particle with a size between 1-100 µm, it is reasonable to calculate
the terminal setting velocity using the Stoke’s law.
2 ( )18
KCl gasv gdρ ρ
µ−
=
Where ρKCl=1990 kg/m3, ρgas=0.301 kg/m3, the viscosity of air at 900°C is 4.67E-5
kg/m/s:
2 6 25
( ) (1990 0.301)9.81 (26 10 ) 0.016 /18 18 4.67 10
KCl gasv gd m sρ ρ
µ−
−
− −= = × × =
× ×
6
5
0.301 0.016 26 10Re 0.0034.67 10
gasP
vdρµ
−
−
× × ×= = =
×
The heat capacity of air at 900°C is calculated from 2 3 2 5 2( ) 27.435 0.618 10 0.09 10 33.45 / /PC T a bT cT dT T T J mol K− −= + + + = + × − × =
Molar weight of air is: 0.79×28+0.21×32=28.84 g/mol, so the heat capacity of air at
900°C is 1159.85 J/kg/K. Heat conductivity k for air is about 0.076 W/m/K, then 51159.85 4.67 10Pr 0.713
0.076PCkµ −× ×
= = =
This is in good agreement with the literature where typical Pr of air is in the range of
0.66-0.75.
1/ 2 1/32 0.6 0.003 0.713 2.028hdNuk
= = + × × =
The calculated Nusselt number is very close to 2. The calculated heat transfer coefficient
is:
26
0.076 2.028 5928 / /26 10
kNuh W m Kd −
×= = =
×
40
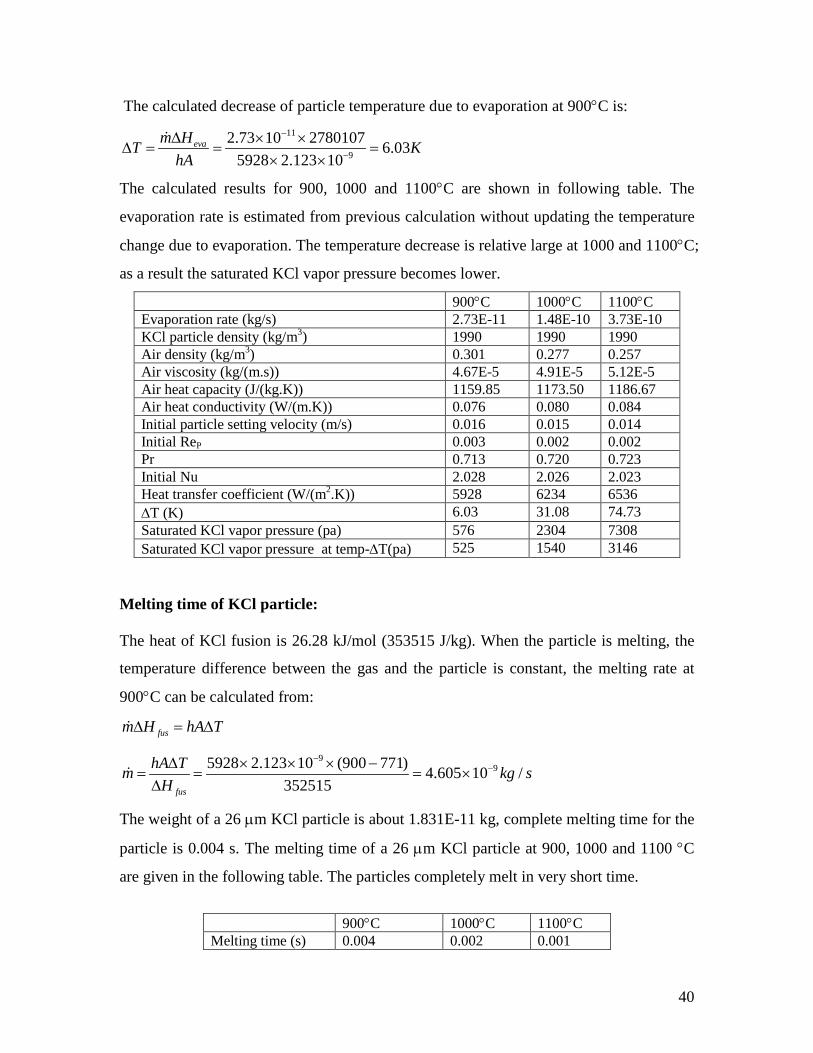
The calculated decrease of particle temperature due to evaporation at 900°C is: 11
9
2.73 10 2780107 6.035928 2.123 10
evam HT KhA
−
−
∆ × ×∆ = = =
× ×
The calculated results for 900, 1000 and 1100°C are shown in following table. The
evaporation rate is estimated from previous calculation without updating the temperature
change due to evaporation. The temperature decrease is relative large at 1000 and 1100°C;
as a result the saturated KCl vapor pressure becomes lower.
900°C 1000°C 1100°C Evaporation rate (kg/s) 2.73E-11 1.48E-10 3.73E-10 KCl particle density (kg/m3) 1990 1990 1990 Air density (kg/m3) 0.301 0.277 0.257 Air viscosity (kg/(m.s)) 4.67E-5 4.91E-5 5.12E-5 Air heat capacity (J/(kg.K)) 1159.85 1173.50 1186.67 Air heat conductivity (W/(m.K)) 0.076 0.080 0.084 Initial particle setting velocity (m/s) 0.016 0.015 0.014 Initial ReP 0.003 0.002 0.002 Pr 0.713 0.720 0.723 Initial Nu 2.028 2.026 2.023 Heat transfer coefficient (W/(m2.K)) 5928 6234 6536 ∆T (K) 6.03 31.08 74.73 Saturated KCl vapor pressure (pa) 576 2304 7308 Saturated KCl vapor pressure at temp-∆T(pa) 525 1540 3146
Melting time of KCl particle: The heat of KCl fusion is 26.28 kJ/mol (353515 J/kg). When the particle is melting, the
temperature difference between the gas and the particle is constant, the melting rate at
900°C can be calculated from:
fusm H hA T∆ = ∆
995928 2.123 10 (900 771) 4.605 10 /
352515fus
hA Tm kg sH
−−∆ × × × −
= = = ×∆
The weight of a 26 µm KCl particle is about 1.831E-11 kg, complete melting time for the
particle is 0.004 s. The melting time of a 26 µm KCl particle at 900, 1000 and 1100 °C
are given in the following table. The particles completely melt in very short time.
900°C 1000°C 1100°C Melting time (s) 0.004 0.002 0.001
41
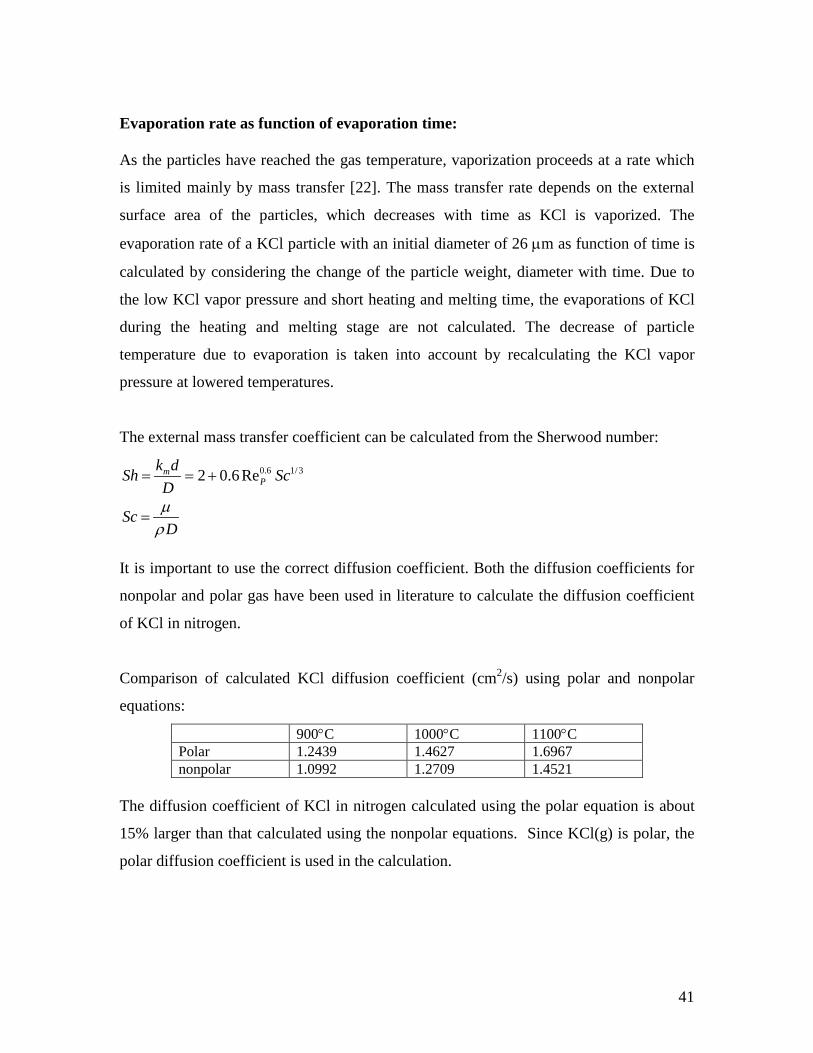
Evaporation rate as function of evaporation time: As the particles have reached the gas temperature, vaporization proceeds at a rate which
is limited mainly by mass transfer [22]. The mass transfer rate depends on the external
surface area of the particles, which decreases with time as KCl is vaporized. The
evaporation rate of a KCl particle with an initial diameter of 26 µm as function of time is
calculated by considering the change of the particle weight, diameter with time. Due to
the low KCl vapor pressure and short heating and melting time, the evaporations of KCl
during the heating and melting stage are not calculated. The decrease of particle
temperature due to evaporation is taken into account by recalculating the KCl vapor
pressure at lowered temperatures.
The external mass transfer coefficient can be calculated from the Sherwood number:
0.6 1/32 0.6RemP
k dSh ScD
= = +
ScDµρ
=
It is important to use the correct diffusion coefficient. Both the diffusion coefficients for
nonpolar and polar gas have been used in literature to calculate the diffusion coefficient
of KCl in nitrogen.
Comparison of calculated KCl diffusion coefficient (cm2/s) using polar and nonpolar
equations:
900°C 1000°C 1100°C Polar 1.2439 1.4627 1.6967 nonpolar 1.0992 1.2709 1.4521
The diffusion coefficient of KCl in nitrogen calculated using the polar equation is about
15% larger than that calculated using the nonpolar equations. Since KCl(g) is polar, the
polar diffusion coefficient is used in the calculation.
42
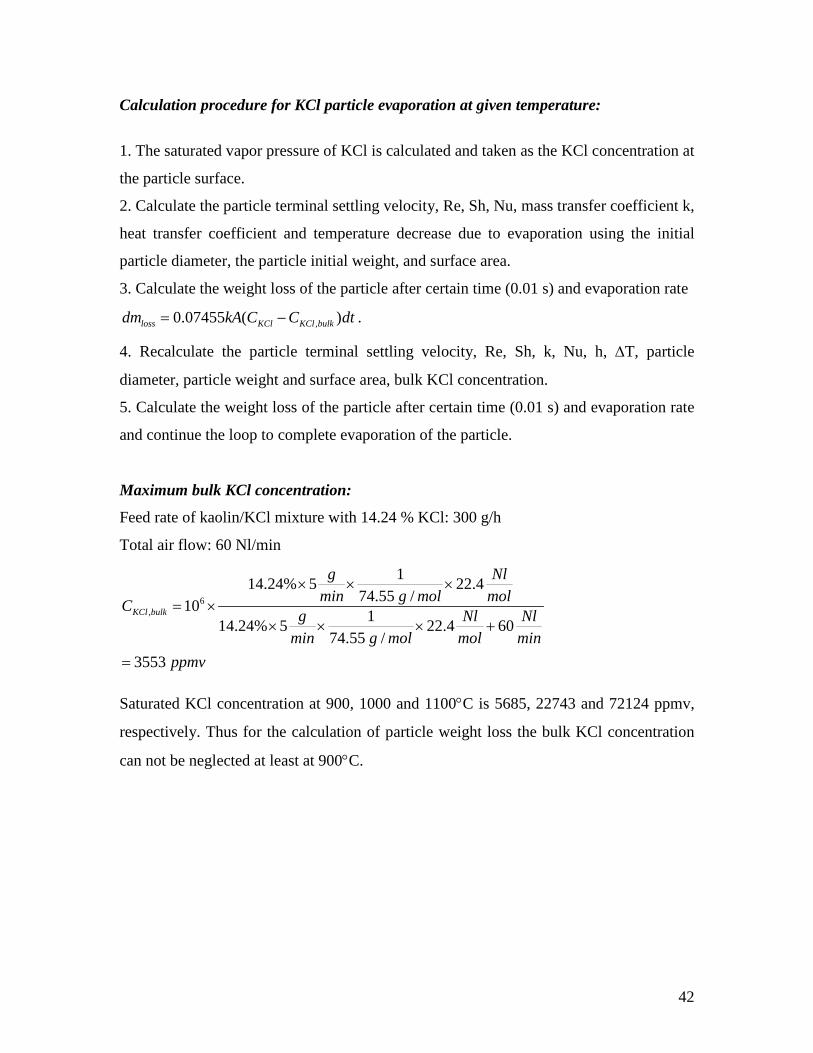
Calculation procedure for KCl particle evaporation at given temperature:
1. The saturated vapor pressure of KCl is calculated and taken as the KCl concentration at
the particle surface.
2. Calculate the particle terminal settling velocity, Re, Sh, Nu, mass transfer coefficient k,
heat transfer coefficient and temperature decrease due to evaporation using the initial
particle diameter, the particle initial weight, and surface area.
3. Calculate the weight loss of the particle after certain time (0.01 s) and evaporation rate
,0.07455 ( )loss KCl KCl bulkdm kA C C dt= − .
4. Recalculate the particle terminal settling velocity, Re, Sh, k, Nu, h, ∆T, particle
diameter, particle weight and surface area, bulk KCl concentration.
5. Calculate the weight loss of the particle after certain time (0.01 s) and evaporation rate
and continue the loop to complete evaporation of the particle.
Maximum bulk KCl concentration:
Feed rate of kaolin/KCl mixture with 14.24 % KCl: 300 g/h
Total air flow: 60 Nl/min
6,
114.24% 5 22.474.55 /10 114.24% 5 22.4 60
74.55 /3553
KCl bulk
g Nlmin g mol molC g Nl Nl
min g mol mol minppmv
× × ×= ×
× × × +
=
Saturated KCl concentration at 900, 1000 and 1100°C is 5685, 22743 and 72124 ppmv,
respectively. Thus for the calculation of particle weight loss the bulk KCl concentration
can not be neglected at least at 900°C.
43
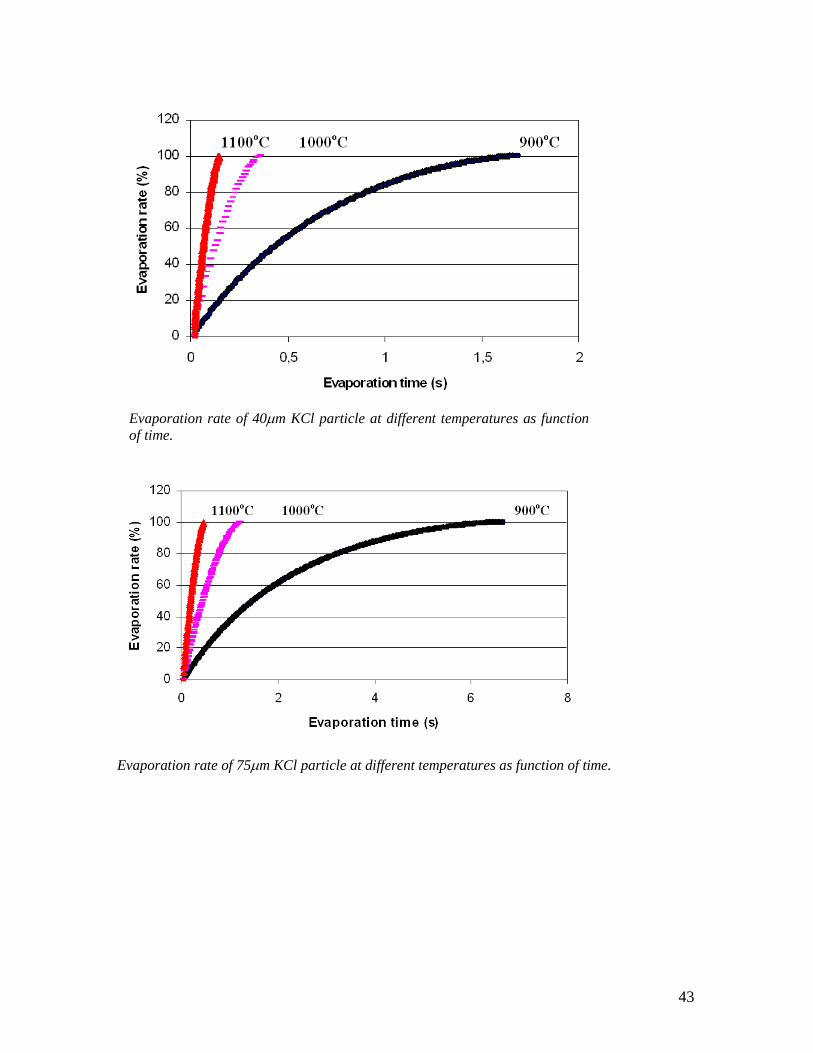
Evaporation rate of 40µm KCl particle at different temperatures as function of time.
Evaporation rate of 75µm KCl particle at different temperatures as function of time.
44
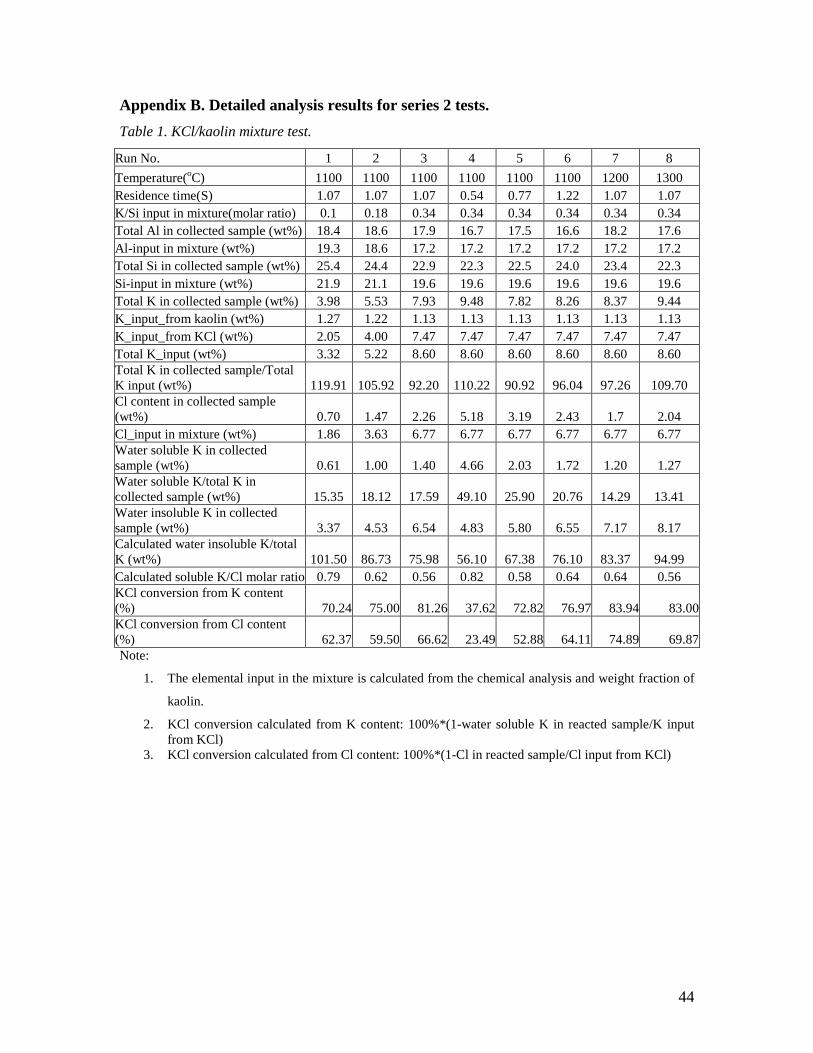
Appendix B. Detailed analysis results for series 2 tests. Table 1. KCl/kaolin mixture test.
Run No. 1 2 3 4 5 6 7 8 Temperature(oC) 1100 1100 1100 1100 1100 1100 1200 1300 Residence time(S) 1.07 1.07 1.07 0.54 0.77 1.22 1.07 1.07 K/Si input in mixture(molar ratio) 0.1 0.18 0.34 0.34 0.34 0.34 0.34 0.34 Total Al in collected sample (wt%) 18.4 18.6 17.9 16.7 17.5 16.6 18.2 17.6 Al-input in mixture (wt%) 19.3 18.6 17.2 17.2 17.2 17.2 17.2 17.2 Total Si in collected sample (wt%) 25.4 24.4 22.9 22.3 22.5 24.0 23.4 22.3 Si-input in mixture (wt%) 21.9 21.1 19.6 19.6 19.6 19.6 19.6 19.6 Total K in collected sample (wt%) 3.98 5.53 7.93 9.48 7.82 8.26 8.37 9.44 K_input_from kaolin (wt%) 1.27 1.22 1.13 1.13 1.13 1.13 1.13 1.13 K_input_from KCl (wt%) 2.05 4.00 7.47 7.47 7.47 7.47 7.47 7.47 Total K_input (wt%) 3.32 5.22 8.60 8.60 8.60 8.60 8.60 8.60 Total K in collected sample/Total K input (wt%) 119.91 105.92 92.20 110.22 90.92 96.04 97.26 109.70 Cl content in collected sample (wt%) 0.70 1.47 2.26 5.18 3.19 2.43 1.7 2.04 Cl_input in mixture (wt%) 1.86 3.63 6.77 6.77 6.77 6.77 6.77 6.77 Water soluble K in collected sample (wt%) 0.61 1.00 1.40 4.66 2.03 1.72 1.20 1.27 Water soluble K/total K in collected sample (wt%) 15.35 18.12 17.59 49.10 25.90 20.76 14.29 13.41 Water insoluble K in collected sample (wt%) 3.37 4.53 6.54 4.83 5.80 6.55 7.17 8.17 Calculated water insoluble K/total K (wt%) 101.50 86.73 75.98 56.10 67.38 76.10 83.37 94.99 Calculated soluble K/Cl molar ratio 0.79 0.62 0.56 0.82 0.58 0.64 0.64 0.56 KCl conversion from K content (%) 70.24 75.00 81.26 37.62 72.82 76.97 83.94 83.00 KCl conversion from Cl content (%) 62.37 59.50 66.62 23.49 52.88 64.11 74.89 69.87 Note:
1. The elemental input in the mixture is calculated from the chemical analysis and weight fraction of
kaolin.
2. KCl conversion calculated from K content: 100%*(1-water soluble K in reacted sample/K input from KCl)
3. KCl conversion calculated from Cl content: 100%*(1-Cl in reacted sample/Cl input from KCl)
45
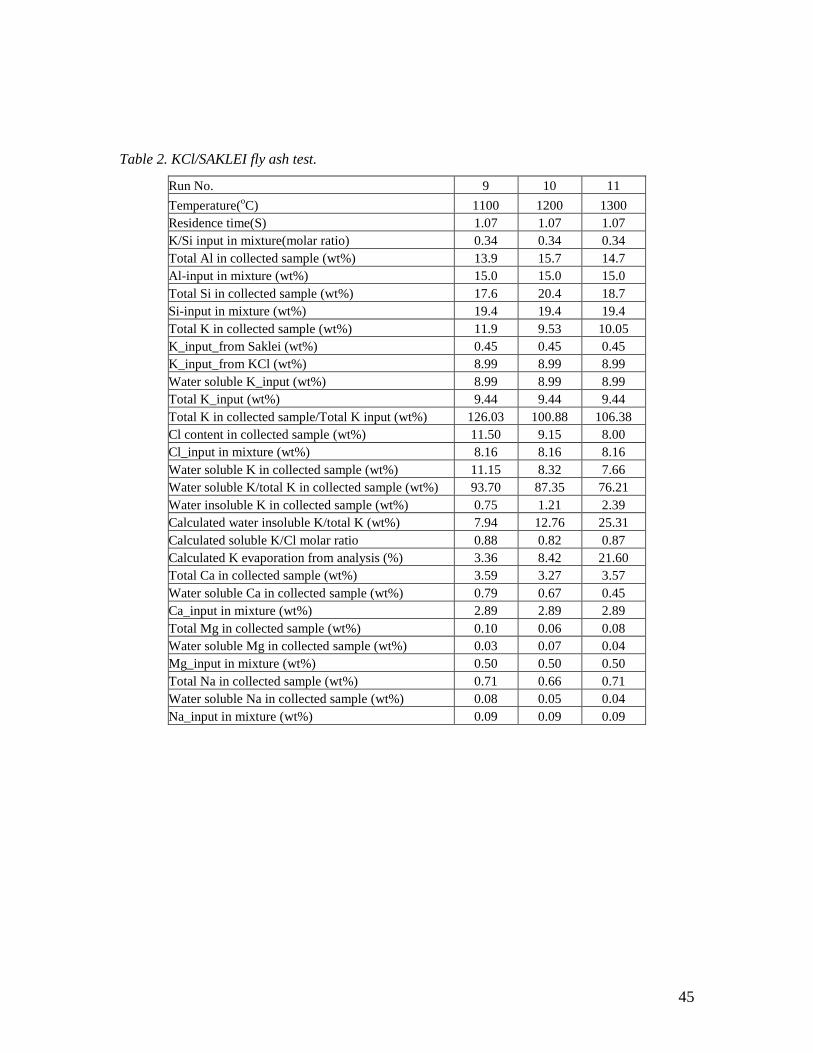
Table 2. KCl/SAKLEI fly ash test.
Run No. 9 10 11 Temperature(oC) 1100 1200 1300 Residence time(S) 1.07 1.07 1.07 K/Si input in mixture(molar ratio) 0.34 0.34 0.34 Total Al in collected sample (wt%) 13.9 15.7 14.7 Al-input in mixture (wt%) 15.0 15.0 15.0 Total Si in collected sample (wt%) 17.6 20.4 18.7 Si-input in mixture (wt%) 19.4 19.4 19.4 Total K in collected sample (wt%) 11.9 9.53 10.05 K_input_from Saklei (wt%) 0.45 0.45 0.45 K_input_from KCl (wt%) 8.99 8.99 8.99 Water soluble K_input (wt%) 8.99 8.99 8.99 Total K_input (wt%) 9.44 9.44 9.44 Total K in collected sample/Total K input (wt%) 126.03 100.88 106.38 Cl content in collected sample (wt%) 11.50 9.15 8.00 Cl_input in mixture (wt%) 8.16 8.16 8.16 Water soluble K in collected sample (wt%) 11.15 8.32 7.66 Water soluble K/total K in collected sample (wt%) 93.70 87.35 76.21 Water insoluble K in collected sample (wt%) 0.75 1.21 2.39 Calculated water insoluble K/total K (wt%) 7.94 12.76 25.31 Calculated soluble K/Cl molar ratio 0.88 0.82 0.87 Calculated K evaporation from analysis (%) 3.36 8.42 21.60 Total Ca in collected sample (wt%) 3.59 3.27 3.57 Water soluble Ca in collected sample (wt%) 0.79 0.67 0.45 Ca_input in mixture (wt%) 2.89 2.89 2.89 Total Mg in collected sample (wt%) 0.10 0.06 0.08 Water soluble Mg in collected sample (wt%) 0.03 0.07 0.04 Mg_input in mixture (wt%) 0.50 0.50 0.50 Total Na in collected sample (wt%) 0.71 0.66 0.71 Water soluble Na in collected sample (wt%) 0.08 0.05 0.04 Na_input in mixture (wt%) 0.09 0.09 0.09
46
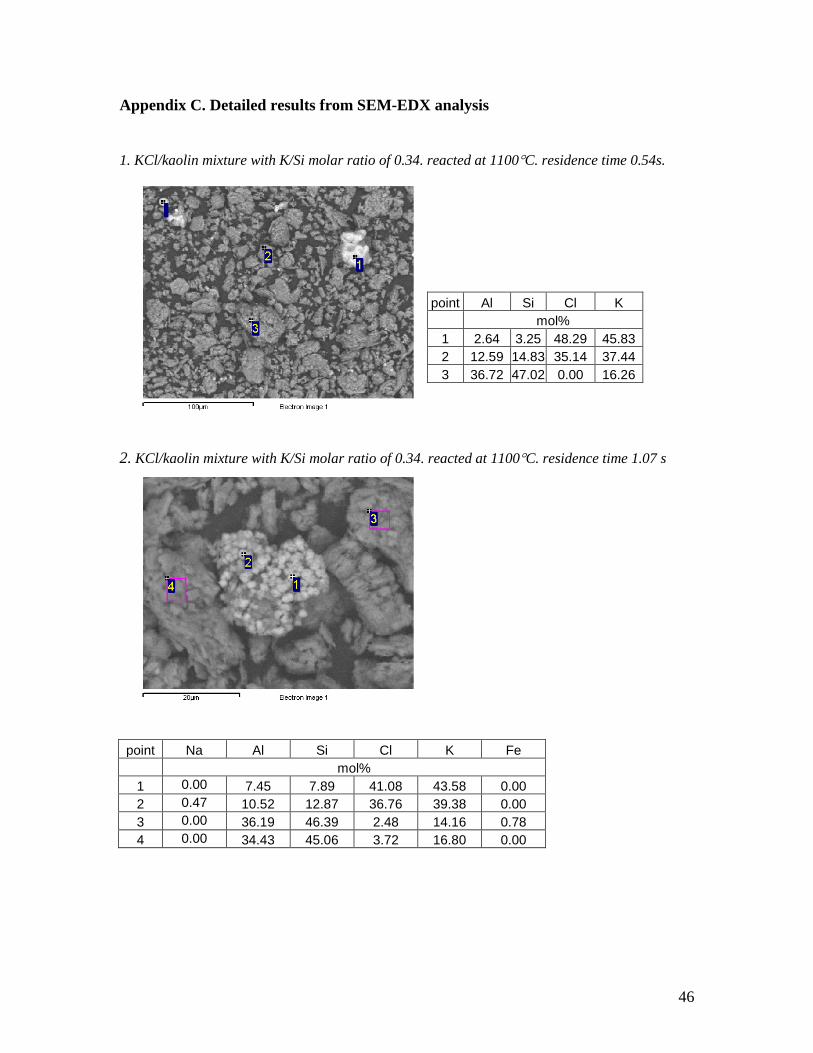
Appendix C. Detailed results from SEM-EDX analysis
1. KCl/kaolin mixture with K/Si molar ratio of 0.34. reacted at 1100°C. residence time 0.54s.
2. KCl/kaolin mixture with K/Si molar ratio of 0.34. reacted at 1100°C. residence time 1.07 s
point Na Al Si Cl K Fe mol% 1 0.00 7.45 7.89 41.08 43.58 0.00 2 0.47 10.52 12.87 36.76 39.38 0.00 3 0.00 36.19 46.39 2.48 14.16 0.78 4 0.00 34.43 45.06 3.72 16.80 0.00
point Al Si Cl K mol% 1 2.64 3.25 48.29 45.83 2 12.59 14.83 35.14 37.44 3 36.72 47.02 0.00 16.26
47
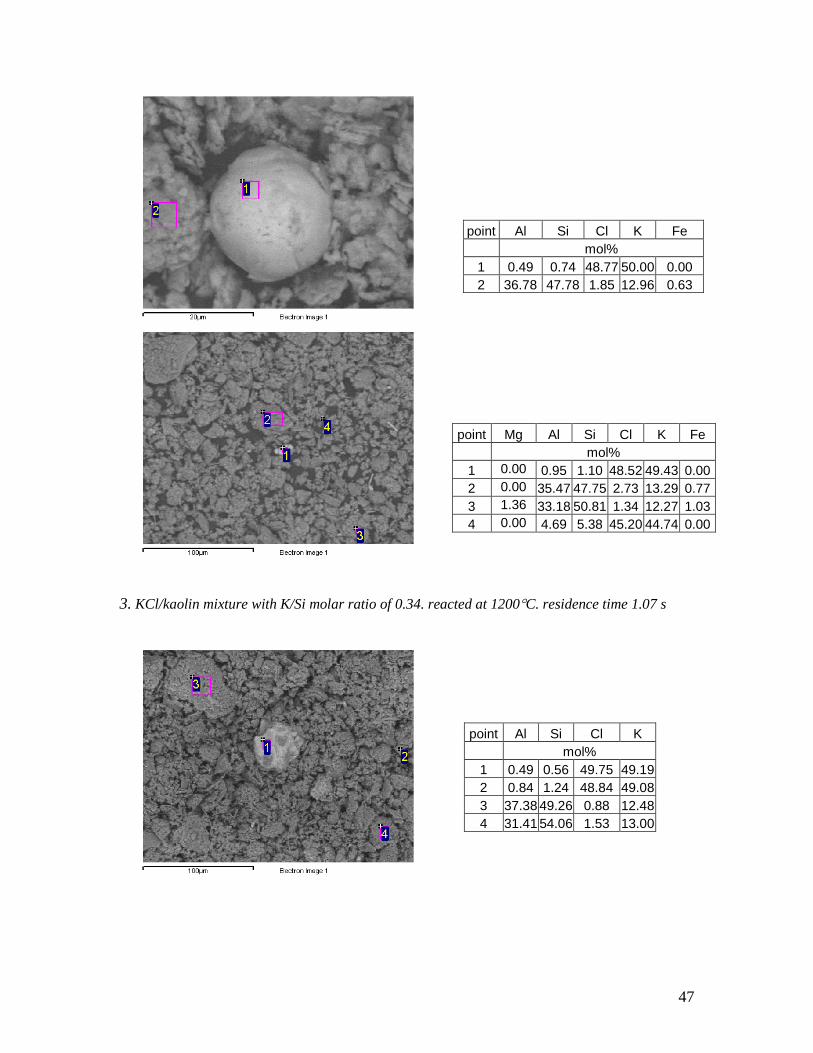
3. KCl/kaolin mixture with K/Si molar ratio of 0.34. reacted at 1200°C. residence time 1.07 s
point Al Si Cl K Fe mol% 1 0.49 0.74 48.77 50.00 0.00 2 36.78 47.78 1.85 12.96 0.63
point Mg Al Si Cl K Fe mol% 1 0.00 0.95 1.10 48.52 49.43 0.00 2 0.00 35.47 47.75 2.73 13.29 0.77 3 1.36 33.18 50.81 1.34 12.27 1.03 4 0.00 4.69 5.38 45.20 44.74 0.00
point Al Si Cl K mol% 1 0.49 0.56 49.75 49.19 2 0.84 1.24 48.84 49.08 3 37.38 49.26 0.88 12.48 4 31.41 54.06 1.53 13.00
48
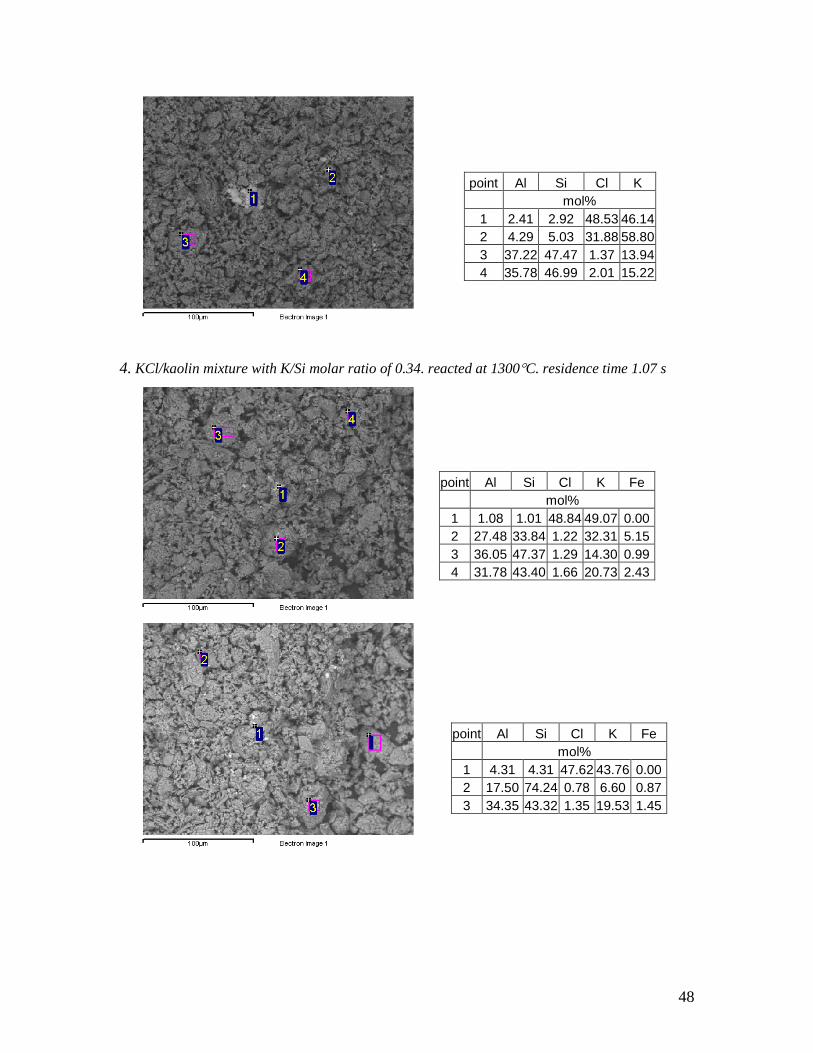
4. KCl/kaolin mixture with K/Si molar ratio of 0.34. reacted at 1300°C. residence time 1.07 s
point Al Si Cl K mol% 1 2.41 2.92 48.53 46.14 2 4.29 5.03 31.88 58.80 3 37.22 47.47 1.37 13.94 4 35.78 46.99 2.01 15.22
point Al Si Cl K Fe mol% 1 1.08 1.01 48.84 49.07 0.00 2 27.48 33.84 1.22 32.31 5.15 3 36.05 47.37 1.29 14.30 0.99 4 31.78 43.40 1.66 20.73 2.43
point Al Si Cl K Fe mol% 1 4.31 4.31 47.62 43.76 0.00 2 17.50 74.24 0.78 6.60 0.87 3 34.35 43.32 1.35 19.53 1.45
49
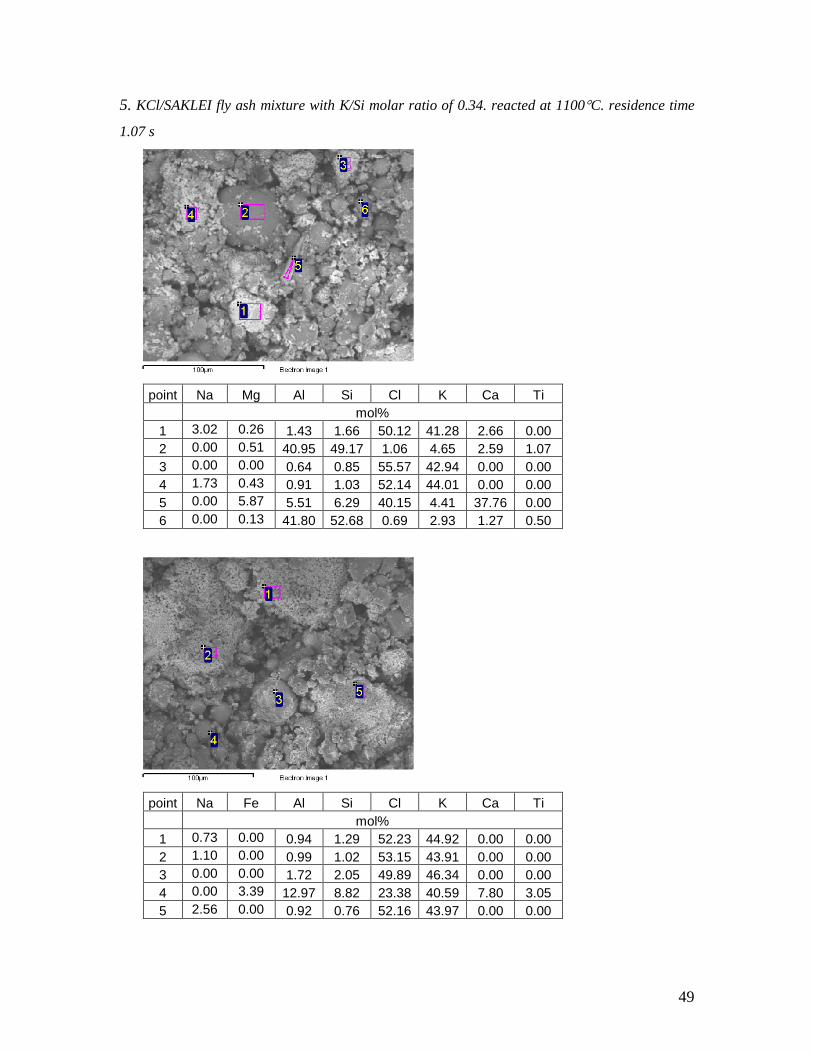
5. KCl/SAKLEI fly ash mixture with K/Si molar ratio of 0.34. reacted at 1100°C. residence time
1.07 s
point Na Mg Al Si Cl K Ca Ti
mol% 1 3.02 0.26 1.43 1.66 50.12 41.28 2.66 0.00 2 0.00 0.51 40.95 49.17 1.06 4.65 2.59 1.07 3 0.00 0.00 0.64 0.85 55.57 42.94 0.00 0.00 4 1.73 0.43 0.91 1.03 52.14 44.01 0.00 0.00 5 0.00 5.87 5.51 6.29 40.15 4.41 37.76 0.00 6 0.00 0.13 41.80 52.68 0.69 2.93 1.27 0.50
point Na Fe Al Si Cl K Ca Ti
mol% 1 0.73 0.00 0.94 1.29 52.23 44.92 0.00 0.00 2 1.10 0.00 0.99 1.02 53.15 43.91 0.00 0.00 3 0.00 0.00 1.72 2.05 49.89 46.34 0.00 0.00 4 0.00 3.39 12.97 8.82 23.38 40.59 7.80 3.05 5 2.56 0.00 0.92 0.76 52.16 43.97 0.00 0.00
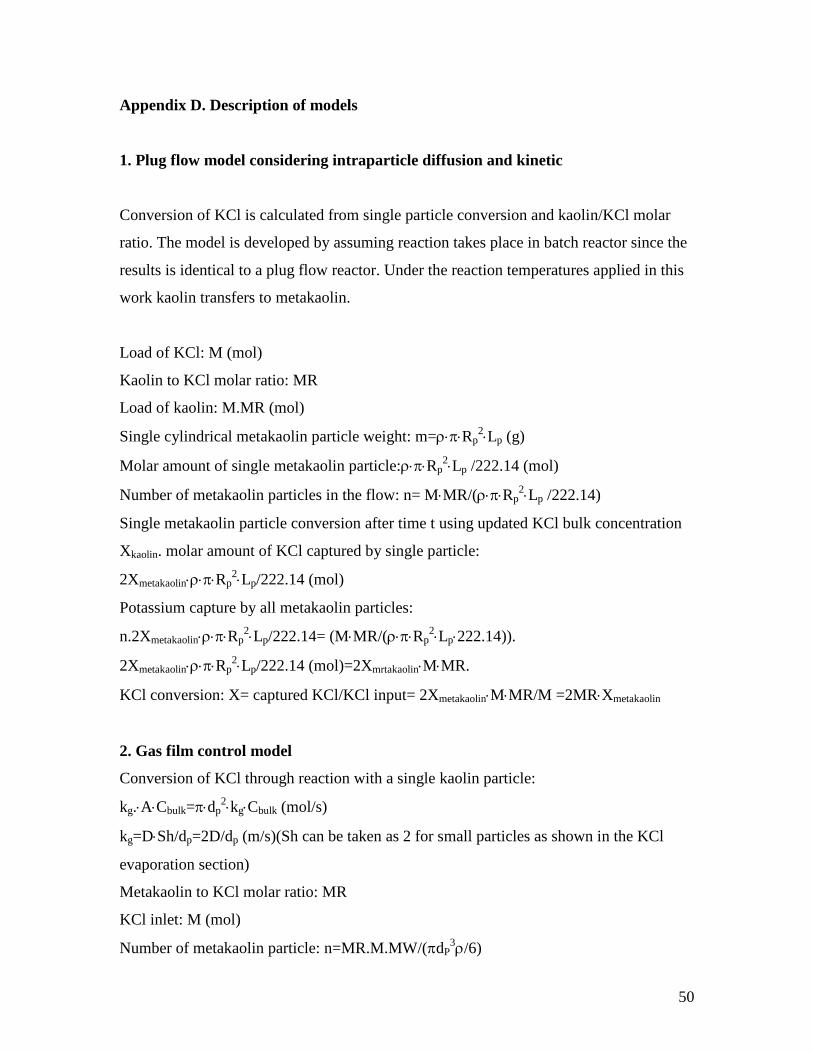
50
Appendix D. Description of models
1. Plug flow model considering intraparticle diffusion and kinetic
Conversion of KCl is calculated from single particle conversion and kaolin/KCl molar
ratio. The model is developed by assuming reaction takes place in batch reactor since the
results is identical to a plug flow reactor. Under the reaction temperatures applied in this
work kaolin transfers to metakaolin.
Load of KCl: M (mol)
Kaolin to KCl molar ratio: MR
Load of kaolin: M.MR (mol)
Single cylindrical metakaolin particle weight: m=ρ⋅π⋅Rp2⋅Lp (g)
Molar amount of single metakaolin particle:ρ⋅π⋅Rp2⋅Lp /222.14 (mol)
Number of metakaolin particles in the flow: n= M⋅MR/(ρ⋅π⋅Rp2⋅Lp /222.14)
Single metakaolin particle conversion after time t using updated KCl bulk concentration
Xkaolin. molar amount of KCl captured by single particle:
2Xmetakaolin⋅ρ⋅π⋅Rp2⋅Lp/222.14 (mol)
Potassium capture by all metakaolin particles:
n.2Xmetakaolin⋅ρ⋅π⋅Rp2⋅Lp/222.14= (M⋅MR/(ρ⋅π⋅Rp
2⋅Lp⋅222.14)).
2Xmetakaolin⋅ρ⋅π⋅Rp2⋅Lp/222.14 (mol)=2Xmrtakaolin⋅M⋅MR.
KCl conversion: X= captured KCl/KCl input= 2Xmetakaolin⋅M⋅MR/M =2MR⋅Xmetakaolin
2. Gas film control model
Conversion of KCl through reaction with a single kaolin particle:
kg.⋅A⋅Cbulk=π⋅dp2⋅kg⋅Cbulk (mol/s)
kg=D⋅Sh/dp=2D/dp (m/s)(Sh can be taken as 2 for small particles as shown in the KCl
evaporation section)
Metakaolin to KCl molar ratio: MR
KCl inlet: M (mol)
Number of metakaolin particle: n=MR.M.MW/(πdP3ρ/6)
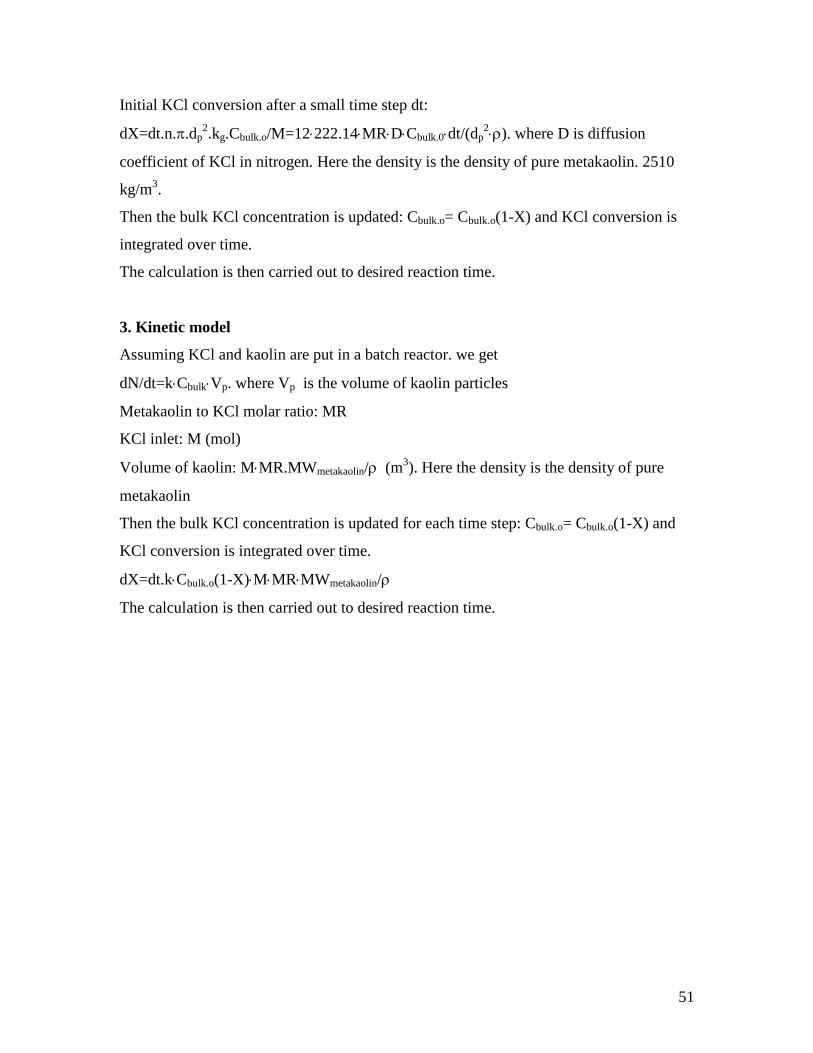
51
Initial KCl conversion after a small time step dt:
dX=dt.n.π.dp2.kg.Cbulk.o/M=12⋅222.14⋅MR⋅D⋅Cbulk.0⋅dt/(dp
2⋅ρ). where D is diffusion
coefficient of KCl in nitrogen. Here the density is the density of pure metakaolin. 2510
kg/m3.
Then the bulk KCl concentration is updated: Cbulk.o= Cbulk.o(1-X) and KCl conversion is
integrated over time.
The calculation is then carried out to desired reaction time.
3. Kinetic model
Assuming KCl and kaolin are put in a batch reactor. we get
dN/dt=k⋅Cbulk⋅Vp. where Vp is the volume of kaolin particles
Metakaolin to KCl molar ratio: MR
KCl inlet: M (mol)
Volume of kaolin: M⋅MR.MWmetakaolin/ρ (m3). Here the density is the density of pure
metakaolin
Then the bulk KCl concentration is updated for each time step: Cbulk.o= Cbulk.o(1-X) and
KCl conversion is integrated over time.
dX=dt.k⋅Cbulk.o(1-X)⋅M⋅MR⋅MWmetakaolin/ρ
The calculation is then carried out to desired reaction time.