ASEAN Monetary Cooperation: Issues and Prospects
30
PACIFIC ECONOMIC PAPERS NO. 349, 2005 ASEAN Monetary Cooper ASEAN Monetary Cooper ASEAN Monetary Cooper ASEAN Monetary Cooper ASEAN Monetary Cooperation: Issues and ation: Issues and ation: Issues and ation: Issues and ation: Issues and Pr Pr Pr Pr Prospects ospects ospects ospects ospects AUSTRALIA–JAP AUSTRALIA–JAP AUSTRALIA–JAP AUSTRALIA–JAP AUSTRALIA–JAPAN RESEARCH CENTRE AN RESEARCH CENTRE AN RESEARCH CENTRE AN RESEARCH CENTRE AN RESEARCH CENTRE ASIA PACIFIC SCHOOL OF ECONOMICS & GOVERNMENT ASIA PACIFIC SCHOOL OF ECONOMICS & GOVERNMENT ASIA PACIFIC SCHOOL OF ECONOMICS & GOVERNMENT ASIA PACIFIC SCHOOL OF ECONOMICS & GOVERNMENT ASIA PACIFIC SCHOOL OF ECONOMICS & GOVERNMENT Arief Ramayandi Arief Ramayandi Arief Ramayandi Arief Ramayandi Arief Ramayandi
Transcript of ASEAN Monetary Cooperation: Issues and Prospects
PACIFIC ECONOMIC PAPERS
NO. 349, 2005
ASEAN Monetary CooperASEAN Monetary CooperASEAN Monetary CooperASEAN Monetary CooperASEAN Monetary Cooperation: Issues andation: Issues andation: Issues andation: Issues andation: Issues andPrPrPrPrProspectsospectsospectsospectsospects
AUSTRALIA–JAPAUSTRALIA–JAPAUSTRALIA–JAPAUSTRALIA–JAPAUSTRALIA–JAPAN RESEARCH CENTREAN RESEARCH CENTREAN RESEARCH CENTREAN RESEARCH CENTREAN RESEARCH CENTRE
ASIA PACIFIC SCHOOL OF ECONOMICS & GOVERNMENTASIA PACIFIC SCHOOL OF ECONOMICS & GOVERNMENTASIA PACIFIC SCHOOL OF ECONOMICS & GOVERNMENTASIA PACIFIC SCHOOL OF ECONOMICS & GOVERNMENTASIA PACIFIC SCHOOL OF ECONOMICS & GOVERNMENT
Arief RamayandiArief RamayandiArief RamayandiArief RamayandiArief Ramayandi

ASEAN Monetary Cooperation: Issues andProspects
Arief RamayandiAustralian National University
andPadjadjaran University
PACIFIC ECONOMIC PAPER NO. 349
2005
AUSTRALIA–JAPAN RESEARCH CENTREAUSTRALIA–JAPAN RESEARCH CENTREAUSTRALIA–JAPAN RESEARCH CENTREAUSTRALIA–JAPAN RESEARCH CENTREAUSTRALIA–JAPAN RESEARCH CENTRE
ASIA PACIFIC SCHOOL OF ECONOMICS & GOVERNMENTASIA PACIFIC SCHOOL OF ECONOMICS & GOVERNMENTASIA PACIFIC SCHOOL OF ECONOMICS & GOVERNMENTASIA PACIFIC SCHOOL OF ECONOMICS & GOVERNMENTASIA PACIFIC SCHOOL OF ECONOMICS & GOVERNMENT
ii
© Australia–Japan Research Centre 2005
This work is copyright. Apart from those uses which may be permitted under the Copyright Act 1968 asamended, no part may be reproduced by any process without written permission.
Pacific Economic Papers are published under the direction of the Research Committee of theAustralia–Japan Research Centre. Members of the Research Committee are:
Professor Jenny CorbettExecutive DirectorAustralia–Japan Research CentreThe Australian National University, Canberra
Professor Christopher FindlayResearch DirectorAsia Pacific School of Economics and GovernmentThe Australian National University, Canberra
Professor Emeritus Peter DrysdaleAsia Pacific School of Economics and GovernmentThe Australian National University, Canberra
Professor Stuart HarrisDepartment of International RelationsThe Australian National University, Canberra
Papers submitted for publication in this series are subject to double-blind external review by two referees.The Australia–Japan Research Centre is part of the Asia Pacific School of Economics and
Government, The Australian National University, Canberra.
ISSN 0 728 8409ISBN 0 86413 302 2
Australia–Japan Research CentreAsia Pacific School of Economics and GovernmentThe Australian National UniversityCanberra ACT 0200
Telephone: (61 2) 6125 3780Facsimile: (61 2) 6125 0767E-mail: [email protected]: http://apseg.anu.edu.au
iii
CONTENTS
List of figures and tables .......................................................................................... iv
Introduction ..................................................................................................... 1
Some general standard economic criteria for an OCA: The case of ASEAN ...... 2
Structural shock similarities .............................................................................. 6
Moving forward: Potential impediments and steps to be taken ........................ 11
Conclusion ..................................................................................................... 15
Notes ....................................................................................................................... 17
References ............................................................................................................... 17
Appendix ................................................................................................................ 19
iv
TABLES
FIGURES
Figure 1 Standard deviation of the GDP growth of the fiveASEAN nations (1994–2002) ...................................................... 10
Table 1 Trade indices for ASEAN countries ............................................... 4
Table 2 Correlation of aggregate supply shocks across theASEAN nations ............................................................................. 7
Table 3 Correlation of aggregate demand shocks across thefive ASEAN nations ...................................................................... 8
Table 4 Correlation of exchange rates per US dollar for fiveASEAN nations ........................................................................... 12
Table 5 Correlation of exchange rates to US dollar for fiveASEAN nations ........................................................................... 12
ASEAN MONETARY COOPERATION: ISSUES AND PROSPECTS
Among other things, the 1997–98 East Asian financial crisis has led to questioning within theAssociation of Southeast Asian Nations (ASEAN) about whether the region needs a commoncurrency. This paper aims to discuss the underlying economic issues and prospects, from both atheoretical and a practical point view. The analysis focuses only on the five largest ASEAN nations.Standard criteria suggested by the theory of Optimal Currency Areas are reviewed and applied tothe region. The paper then provides a discussion on possible steps that can be pursued to realisecurrency union.
Introduction
The issue of financial integration in East Asia has received growing attention in recent decades. Since
the beginning of the 1990s some authors started to look at issues related to monetary integration in
East Asia, for example Frankel (1991, 1993), Frankel and Wei (1994), Goto and Hamada (1994),
Bayoumi and Eichengreen (1994). However, in the case of ASEAN nations, the issue of monetary
integration was almost unimaginable, at least until the 1997–98 financial crisis hit most of its member
countries. The crisis persuaded the ASEAN nations to think of themselves more in terms of a region,
and musings about the idea of having a common currency for ASEAN surfaced.
In responding to the crisis, ASEAN heads of governments in December 1997 set out their
ASEAN ‘Vision 2020’ statement.1 The vision contains a message in favour of moving towards closer
regional cohesion and economic integration. It was soon followed by an action plan concluded in the
following year at the ASEAN summit in Hanoi. The action plan, among other things, calls for a
strengthening of the financial system in the region to maintain regional macroeconomic and financial
stability, and to intensify cooperation on money, tax and other financial related matters.2
To reinforce the Hanoi action plan in order to achieve this goal, ASEAN nations have also moved
forward by looking at a wider region in terms of economic and financial cooperation. The so-called
ASEAN+3 (ASEAN member countries plus China, Japan and the Republic of Korea) met in Chiang
Mai in 2000 and agreed to establish a regional financing arrangement called the Chiang Mai Initiative.
2
Pacific Economic Papers
This initiative provides an expanded ASEAN Swap Arrangement and a network of bilateral swap
agreements among the ASEAN+3 nations.
One of the possible interpretations of the ASEAN ‘Vision 2020’ is for ASEAN to implement
more intensive monetary cooperation among its members, particularly in terms of a possible ASEAN
exchange rate system. This could include the possibility of creating an ASEAN Currency Unit (ACU),
as mentioned in the ASEAN Secretariat report ‘Recent Developments in ASEAN Economic Integra-
tion’.3 When considering the feasibility of an ACU, one will have to contemplate the question of
whether or not this region satisfies the requirements put forward by the theory of optimum currency
area (OCA). According to this theory, countries that seek a common monetary arrangement should
meet some necessary level of political preconditions as well as standard economic criteria. The necessary
political preconditions relate to the readiness to establish a trans-national institution capable of lending
credibility to the commitment of jointly defending the currency pegs of the participating countries. The
general standard economic criteria for an OCA refer to the closeness of participating economies, which
includes the degree of intra-regional trade, symmetry in the nature of economic/structural shocks and
similarities in terms of past macroeconomic policies, stage of development and financial systems.
The aim of this paper is to focus attention on the underlying economic issues for forming an ACU
and the feasible steps that can be taken to foster monetary cooperation in the region. This paper limits
its discussion only to the five largest ASEAN economies, Indonesia, Malaysia, the Philippines,
Singapore and Thailand. The rest of the paper is structured in the following manner: Section 2 reviews
the general standard economic criteria for an OCA as applied to ASEAN by going through some
empirical data on recent developments in ASEAN;. Section 3 discusses some of the potential
impediments for moving forward with the idea as well as necessary intermediate steps to be pursued
to realise a monetary regionalism; Section 4 concludes.
Some general standard economic criteria for an OCA: The case of ASEAN
To provide an assessment of ASEAN’s readiness to form a common currency area, recent developments
in the economic environment among ASEAN countries must be gauged against the general standard
economic criteria in the OCA literature. This section looks in particular at the development of ASEAN
intra-regional trade, structural shocks faced by those economies, and some measures of dispersion of
real economic growth.
3
No. 349, 2005
Trade integration
After the launch of the ASEAN Free Trade Area (AFTA) in 1992, the volumes of trade in the region
increased dramatically. Exports between ASEAN members increased at the average rate of around 28.3
per cent a year from 1993 to 1996. Intra-regional trade as a proportion of ASEAN’s total trade also
increased from 20 per cent to 25 per cent during the same period (Bunyaratavej and Hahn, 2003, p.
50). There was a hiccup during the East Asia financial crisis in 1997 and 1998, but by 2000, intra
regional trade as a share of the total trade improved and reached a level of about 23 per cent.
Bayoumi, et al (1999) compare the regional trade patterns in ASEAN to those of the other
trading regions based on 1995 data. In terms of its share of the regional GDP, the pattern in ASEAN
is similar to that of the Euro area and higher than that of other countries participating in Mercosur or
NAFTA. In terms of intra-regional trade relative to total trade, however, the figures are comparatively
lower than other regions.
Although useful for describing the regional trade patterns, studying intra-regional trade shares
can be misleading. The number of countries participating in a specific trade bloc dramatically influences
the outcome of this sort of analysis (Anderson and Norheim, 1993). One possible way to overcome this
problem is to adjust the traditional regional trade shares using a parameter that shows the relevance of
the region in world trade. This parameter is calculated by simply dividing the intra-regional trade share
by the region’s share of the world trade generating the so-called trade intensity index (Iij). If trade is
not geographically biased – which means the trade share among the countries exactly match the share
of the bloc in world trade – the ratio will be equal to 1, and the larger the ratio the larger will be the
trade intensity.
In the following, we will investigate the intensity of the intra-regional trade within the five
ASEAN countries under consideration. The trade intensity index can be decomposed into two different
components; i.e. trade complementarity index (Cij) and trade bias index (Bij). Cij measures the degree
of ‘matching’ in commodity compositions between any two countries i and j. When the export
composition of one country (say, country i) is very similar to the import composition of the other (say,
country j), then trade between the two countries will be more intense. Bij (=Iij/Cij) acted as a residual
component of Iij, in which it explained the Iij component that cannot be captured by the Cij. In other
words, Bij results from differences in transaction costs between partners. This effect depends on various
things like transport costs and the existence of discriminatory trade policies. By looking at both
components of the Iij, one will be able to analyse the factors behind the intensity of trade between
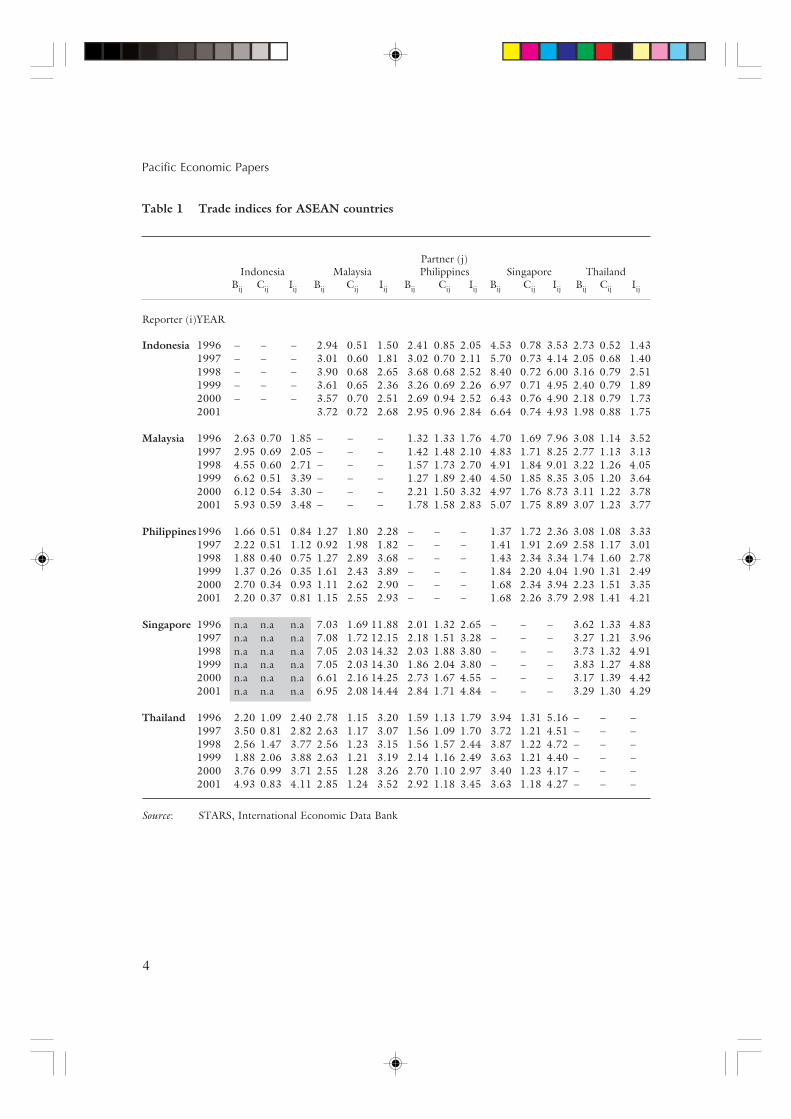
countries. All the figures are summarised in Table 1.
4
Pacific Economic Papers
Table 1 Trade indices for ASEAN countries
Partner (j)Indonesia Malaysia Philippines Singapore Thailand
Bij Cij Iij Bij Cij Iij Bij Cij Iij Bij Cij Iij Bij Cij Iij
Reporter (i)YEAR
Indonesia 1996 – – – 2.94 0.51 1.50 2.41 0.85 2.05 4.53 0.78 3.53 2.73 0.52 1.431997 – – – 3.01 0.60 1.81 3.02 0.70 2.11 5.70 0.73 4.14 2.05 0.68 1.401998 – – – 3.90 0.68 2.65 3.68 0.68 2.52 8.40 0.72 6.00 3.16 0.79 2.511999 – – – 3.61 0.65 2.36 3.26 0.69 2.26 6.97 0.71 4.95 2.40 0.79 1.892000 – – – 3.57 0.70 2.51 2.69 0.94 2.52 6.43 0.76 4.90 2.18 0.79 1.732001 3.72 0.72 2.68 2.95 0.96 2.84 6.64 0.74 4.93 1.98 0.88 1.75
Malaysia 1996 2.63 0.70 1.85 – – – 1.32 1.33 1.76 4.70 1.69 7.96 3.08 1.14 3.521997 2.95 0.69 2.05 – – – 1.42 1.48 2.10 4.83 1.71 8.25 2.77 1.13 3.131998 4.55 0.60 2.71 – – – 1.57 1.73 2.70 4.91 1.84 9.01 3.22 1.26 4.051999 6.62 0.51 3.39 – – – 1.27 1.89 2.40 4.50 1.85 8.35 3.05 1.20 3.642000 6.12 0.54 3.30 – – – 2.21 1.50 3.32 4.97 1.76 8.73 3.11 1.22 3.782001 5.93 0.59 3.48 – – – 1.78 1.58 2.83 5.07 1.75 8.89 3.07 1.23 3.77
Philippines1996 1.66 0.51 0.84 1.27 1.80 2.28 – – – 1.37 1.72 2.36 3.08 1.08 3.331997 2.22 0.51 1.12 0.92 1.98 1.82 – – – 1.41 1.91 2.69 2.58 1.17 3.011998 1.88 0.40 0.75 1.27 2.89 3.68 – – – 1.43 2.34 3.34 1.74 1.60 2.781999 1.37 0.26 0.35 1.61 2.43 3.89 – – – 1.84 2.20 4.04 1.90 1.31 2.492000 2.70 0.34 0.93 1.11 2.62 2.90 – – – 1.68 2.34 3.94 2.23 1.51 3.352001 2.20 0.37 0.81 1.15 2.55 2.93 – – – 1.68 2.26 3.79 2.98 1.41 4.21
Singapore 1996 n.a n.a n.a 7.03 1.69 11.88 2.01 1.32 2.65 – – – 3.62 1.33 4.831997 n.a n.a n.a 7.08 1.72 12.15 2.18 1.51 3.28 – – – 3.27 1.21 3.961998 n.a n.a n.a 7.05 2.03 14.32 2.03 1.88 3.80 – – – 3.73 1.32 4.911999 n.a n.a n.a 7.05 2.03 14.30 1.86 2.04 3.80 – – – 3.83 1.27 4.882000 n.a n.a n.a 6.61 2.16 14.25 2.73 1.67 4.55 – – – 3.17 1.39 4.422001 n.a n.a n.a 6.95 2.08 14.44 2.84 1.71 4.84 – – – 3.29 1.30 4.29
Thailand 1996 2.20 1.09 2.40 2.78 1.15 3.20 1.59 1.13 1.79 3.94 1.31 5.16 – – –1997 3.50 0.81 2.82 2.63 1.17 3.07 1.56 1.09 1.70 3.72 1.21 4.51 – – –1998 2.56 1.47 3.77 2.56 1.23 3.15 1.56 1.57 2.44 3.87 1.22 4.72 – – –1999 1.88 2.06 3.88 2.63 1.21 3.19 2.14 1.16 2.49 3.63 1.21 4.40 – – –2000 3.76 0.99 3.71 2.55 1.28 3.26 2.70 1.10 2.97 3.40 1.23 4.17 – – –2001 4.93 0.83 4.11 2.85 1.24 3.52 2.92 1.18 3.45 3.63 1.18 4.27 – – –
Source: STARS, International Economic Data Bank
5
No. 349, 2005
The trade intensity index between the five ASEAN economies in Table 1 shows that each country
(except for the Philippines and Indonesia) has been intensively trading with the others. In most cases,
the trade intensity index figures also show an increasing trend and the highest value of the index is found
in the case of trading with Singapore. Those trends indicate the tendency that recently the five ASEAN
economies are trading more intensively among themselves.
Over the period 1996–2001, Indonesia experienced an increase in the trade intensity index with
its four neighbouring trade partners. The most dramatic trade intensity increase occurred in the case
of trade with Malaysia (about 79 per cent increase), while the lowest increase occurred in the case of
trade with Thailand (about 22 per cent). In most cases, the trade intensity improvement peaked in 1998
and slows down a bit in the following years. Malaysia’s case is similar to that of Indonesia. Here, the
most dramatic increase in trade intensity occurred in the case of trade with Indonesia (about 88 per
cent), while the lowest occurred in the case with Thailand (about 7 per cent). Singapore and Thailand
share similar patterns in terms of trends of their trade intensity with the neighbouring economies. Both
experienced the most dramatic increase in trade intensity index with the Philippines (about 83 per cent
for Singapore and about 93 per cent for Thailand), while both also experienced a slow-down in trade
intensity between each other (about -11 per cent for Singapore and -17 per cent for Thailand). It is
noteworthy, however, that both Singapore and Thailand have been trading very intensively with each
other throughout the period under consideration.4 Philippines, on the other hand, shows a slightly
different pattern from its neighbours. Although it reciprocates the trade intensity with Singapore (the
index increased by about 60 per cent over the period), it does not do so in the case of Indonesia. The
trade intensity index for the Philippines with Indonesia decreases by about 3.5 per cent over the period,
and its magnitude also suggests that Philippines is not intensively trading with Indonesia at this time.
Table 1 also shows that trade complementarity acts as a relatively strong driver behind this more
intensified trade in the region. All the economies in the region show a magnitude of trade
complementarity index that is above one. This suggests that those economies are relatively ‘matched’
in terms of trade commodity compositions. An exception, however, is evident in the case of Indonesia.
The magnitude of this index almost always lies below one in all cases. Therefore, in this instance, the
increasing intensity of trade between Indonesia and its neighbouring economies is not being driven by
the matching of trade commodity composition, but rather by something else.
As also evident from Table 1, the biggest contributor for the highly intensified trade in all cases
comes from the trade bias effect. In all cases, the bias component plays a large role in increasing the trade
intensity within the region (all figures for this index are larger than one). As mentioned earlier, this effect
depends on various items like transport costs and the existence of discriminatory trade policies. It seems
6
Pacific Economic Papers
that the signing of AFTA and the 1997–98 financial crisis are among the driving factors behind this
trade bias effect. This bias effect in trade may be of particular importance in explaining the increasing
intensity of trade between Indonesia and its neighbouring trade partners.
In summary, in addition to any economic causes, the increasing trade intensity in ASEAN also
seems to be supported by some institutionalised agenda to move towards a more integrated region.
Therefore, if the picture from the recent development in the trade patterns in ASEAN continues, then
the region may be able to capture the extra benefit of reduction in transaction costs and improvement
in price transparency by forming a currency union.
Structural shock similarities
Aggregate supply shocks
Several economists have sought to assess the suitability for forming a currency bloc in East Asia. The
most common approach utilised to address this issue follows the seminal paper by Bayoumi and
Eichengreen (1994), who apply the Blanchard and Quah (1989) long-run identifying restriction to a
bivariate vector auto-regression (VAR) system to reveal the structural shocks for a number of countries
in the Americas, Western Europe and East Asia. This approach has been utilised by some other authors
to investigate symmetry in structural shocks specifically for the ASEAN economies (for example,
Bayoumi and Mauro, 1999).
Using series of data from 1969–1989, Bayoumi and Eichengreen (1994) conclude that based
on the structural shock similarities, there is a case for an OCA in the Southeast Asia region. The
candidate participants include Indonesia, Malaysia, Singapore and Hong Kong plus the possibility of
Thailand. By extending the data series to cover 1968–1998, Bayoumi and Mauro conclude that the
same group of the candidate countries exists
This sub-section examines a more recent picture of those aggregate structural shock relationships
for the five ASEAN countries by including a longer time period (1960–2002). By doing so, the
estimation would also cover the post-crisis years. The aggregate structural estimates are obtained by
using the bi-variate SVAR(1) for each country.5
An examination of the correlation coefficients for the aggregate supply shocks in ASEAN during
1960–1996 (just a year before the crisis started) suggests that the aggregate supply shocks across the
five ASEAN nations are mostly not significantly correlated. Significant correlation is found for the cases
of Indonesia and Malaysia, Malaysia and Singapore, and Singapore and Thailand (see Table 2). The
7
No. 349, 2005
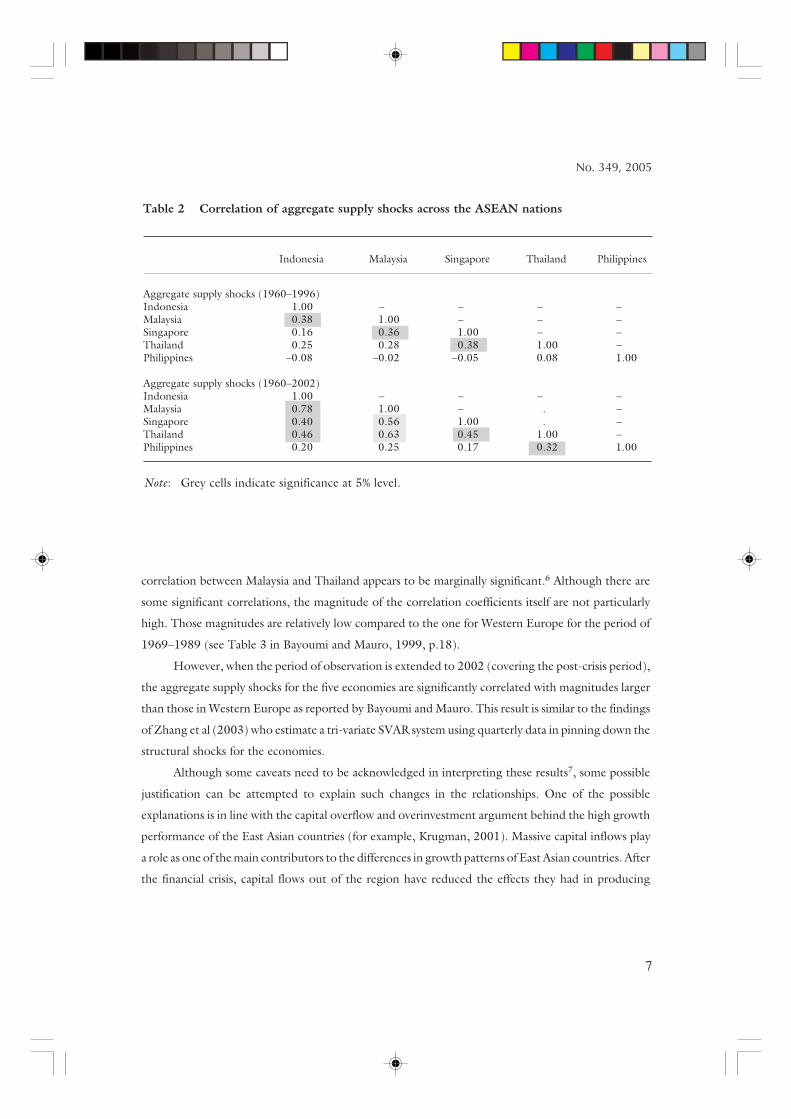
correlation between Malaysia and Thailand appears to be marginally significant.6 Although there are
some significant correlations, the magnitude of the correlation coefficients itself are not particularly
high. Those magnitudes are relatively low compared to the one for Western Europe for the period of
1969–1989 (see Table 3 in Bayoumi and Mauro, 1999, p.18).
However, when the period of observation is extended to 2002 (covering the post-crisis period),
the aggregate supply shocks for the five economies are significantly correlated with magnitudes larger
than those in Western Europe as reported by Bayoumi and Mauro. This result is similar to the findings
of Zhang et al (2003) who estimate a tri-variate SVAR system using quarterly data in pinning down the
structural shocks for the economies.
Although some caveats need to be acknowledged in interpreting these results7, some possible
justification can be attempted to explain such changes in the relationships. One of the possible
explanations is in line with the capital overflow and overinvestment argument behind the high growth
performance of the East Asian countries (for example, Krugman, 2001). Massive capital inflows play
a role as one of the main contributors to the differences in growth patterns of East Asian countries. After
the financial crisis, capital flows out of the region have reduced the effects they had in producing
Table 2 Correlation of aggregate supply shocks across the ASEAN nations
Indonesia Malaysia Singapore Thailand Philippines
Aggregate supply shocks (1960–1996)Indonesia 1.00 – – – –Malaysia 0.38 1.00 – – –Singapore 0.16 0.36 1.00 – –Thailand 0.25 0.28 0.38 1.00 –Philippines –0.08 –0.02 –0.05 0.08 1.00
Aggregate supply shocks (1960–2002)Indonesia 1.00 – – – –Malaysia 0.78 1.00 – . –Singapore 0.40 0.56 1.00 . –Thailand 0.46 0.63 0.45 1.00 –Philippines 0.20 0.25 0.17 0.32 1.00
Note: Grey cells indicate significance at 5% level.

8
Pacific Economic Papers
differing patterns of growth. This situation then leaves the economies with more similarities than
before. If this argument is admissible, then it can explain partly the change in correlations observed.
Regardless of the explanation behind such changes, the figures from Table 2 suggest that the
region is now moving towards having more synchronised aggregate supply shock elements. As
suggested by the theory of OCA, similarities in supply shocks plays a more important role in analysing
the economic disturbances. This then suggests that, based on this particular criterion, the five ASEAN
economies (with some qualifications in the case of the Philippines)8 are now in a position to consider
the possibility of introducing a more integrated monetary system.
Aggregate demand shocks
Although its relative importance in analysing the symmetry of the economic disturbances is not as great
as aggregate supply shocks,9 correlation in aggregate demand shocks still provides relevant historical
information on the similar behaviour on the demand side of the of the group of economies under
consideration. This historical behaviour provides, among other things, some insight on how macroeco-
nomic policy used to be conducted during the observed period. Table 3 illustrates the magnitude of
the correlation coefficients for the aggregate demand shocks in the five ASEAN economies.
Table 3 Correlation of aggregate demand shocks across the five ASEAN nations
Indonesia Malaysia Singapore Thailand Philippines
Aggregate demand shocks (1960–1996)Indonesia 1.00 – – – –Malaysia 0.79 1.00 – – –Singapore 0.60 0.59 1.00 – –Thailand 0.40 0.49 0.63 1.00 –Philippines 0.42 0.47 0.44 0.17 1.00
Aggregate demand shocks (1960–2002)Indonesia 1.00 – – – –Malaysia 0.71 1.00 – – –Singapore 0.59 0.52 1.00 – –Thailand 0.56 0.56 0.67 1.00 –Philippines 0.28 0.32 0.45 0.16 1.00
Note: Grey cells indicate significance at 5 per cent level.
9
No. 349, 2005
Except for the case of the Philippines, aggregate demand shocks in the five ASEAN countries look
relatively synchronised, both before and after the post-crisis period. Those shocks were positively and
significantly correlated within the region, with a relatively high magnitude. The pattern does not seem
to change at all even after considering the post-crisis period. Although the correlation between
aggregate demand shock in Indonesia and the Philippines ceases to be significant at the 5 per cent level
under the sample for 1960–2002, it is still marginally significant at 10 per cent level. One interesting
pattern that can be observed from Table 3, however, is that after expanding the series of observations,
the magnitude of the Philippines aggregate demand correlation with the rest of the group tends to
become lower. A possible explanation is that the impact of the 1997–98 crisis on the Philippines is
somewhat different from the other countries considered.
The demand shocks essentially capture both the components of macro-policy shocks and the
public preference shocks in private demand behaviour. Relatively high and significantly positive
correlation in the aggregate demand for the five economies, then suggests that the demand side
behaviour of those economies not only tends to be highly correlated but also evolved similarly over the
observed period. In other words, the overall preferences on the demand side of those economies have
already been closely and positively correlated during the period under consideration.
Economic convergence
Convergence in economic development in the ASEAN countries is frequently considered an obstacle
to more integrated economic policies in the region. Bunyaratavej and Hahn (2003) specifically examine
this issue in their paper. By applying the s and the b convergence model, they find that for the ASEAN
region, there is evidence that points to the existence of economic divergence in terms of per capita
income growth. They argue that the standard deviation of real GDP per capita in the ASEAN economies
does not show any sign of falling over time, and therefore, does not give any indication of s convergence.
The results of their examination on the b convergence also do not offer evidence that the poorer
countries are growing faster than the richer ones. They therefore conclude that in this respect the region
may not be suitable to having a common currency.
If one considers a simple standard deviation of aggregate economic growth of the five ASEAN
countries under consideration, then a slow but obvious downward trend appears (see Figure 1). In
particular, this trend is more pronounced when one ignores the crisis-affected measurements of 1997
and 1998. The observed trend shown in Figure 1 suggests that, in a way, the dispersion of growth
among the five ASEAN nations is decreasing through time. If this trend continues, then it may show

10
Pacific Economic Papers
that in terms of economic growth, those countries are slowly converging with each other. Of course,
this observation does not necessarily mean that the level of development in the economies under
consideration will then be converging as well. However, at the very least, this trend suggests that the
preference of those countries in favour of their economic growth rate is becoming closer. This may
imply that, having similarities in their economic structure, these countries would be less tempted to
pursue a significantly different demand management strategy. This, in turn, provides some room for
more synchronised policy regimes, which would be needed to maintain an arrangement such as a
common currency regime.
To sum up, disparities in the level of economic development of the region appears to be an
impediment for ASEAN in satisfying the standard economic criteria of an OCA. However, that does
not necessarily mean that any steps taken towards forming a more integrated monetary regime should
be stopped immediately. The trend of convergence in growth rates between the five ASEAN nations
provides some room for a relatively more synchronised policy regime in the coming years.
0
1
2
3
4
5
6
1994 1995 1996 1997 1998 1999 2000 2001 2002
In %
Source: Computed from CEIC database
Figure 1 Standard deviation of the GDP growth of the five ASEAN nations (1994–2002)
per
cent
11
No. 349, 2005
Moving forward: Potential impediments and steps to be taken
Summary of the current situation
From the discussion in the previous section, the five largest ASEAN countries appear to meet some of
the preconditions for forming a common currency area. Intra-regional trade in ASEAN seems to be
relatively intense for the last couple of years. This situation is accompanied by evidence that it will
become even more intensive in the coming years. An examination of various trade indices suggests that
the relatively high intra-regional trade intensity is, in most cases, not only being driven by trade
complementarity factors but also by the bias component in the direction of trade. From this point of
view, those economies are likely to have met one of the preconditions for forming a currency area, and
may be benefiting from lower transaction costs and greater price transparency in conducting trade
among each other.
A relatively high and significantly positive correlation of aggregate supply shocks among the
nations suggests that, after taking account of the crisis period, the five ASEAN countries now face more
common structural shocks affecting their economies. Because of this similarity, the policy reactions
required to deal with such shocks in the future will be, in some ways, similar. Therefore, the region will
obtain benefits from a reduction in the operating costs of implementing policies if they integrate their
monetary systems. Again, in this respect, Indonesia, Malaysia, Thailand, Singapore and probably the
Philippines represent viable candidates for a monetary union.
As an aside, the correlation in the aggregate demand figures is surprisingly positive and very high
as well. Although caution is required in interpreting this result, the figures suggest that the countries
concerned share similar components of demand shocks. If macroeconomic policy is one of the main
drivers for the shared similarities in demand shock components, then further harmonising macroeco-
nomic policy by entering some sort of arrangement like a monetary union could be even smoother. This
is particularly so when we consider the manner in which these countries have managed their exchange
rates in the past. The following table shows correlation coefficients of the exchange rates among the
five countries in the past few years, using monthly data between 1996 and 2003.
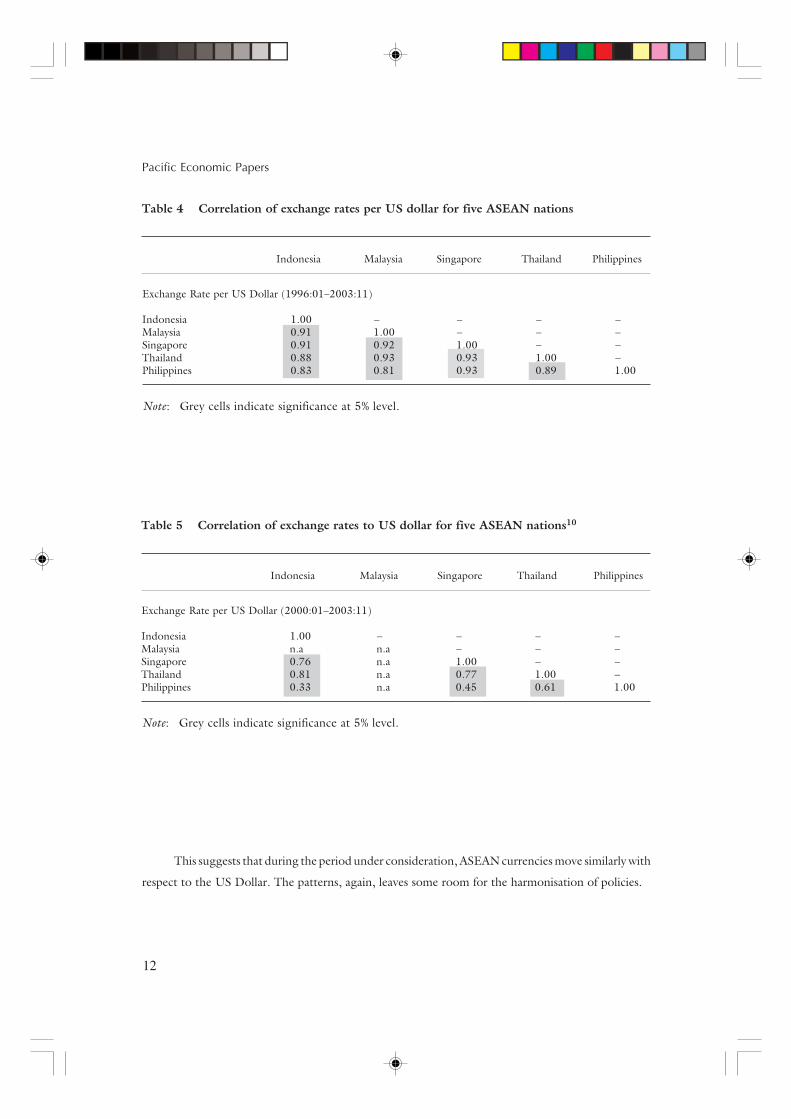
Table 4 highlights a very high, positive and statistically significant correlation between each
country exchange rate with respect to the US dollar. Indeed, the crisis period is the main contributor
for such a high correlation. However, even when one only considers the correlation of those countries
exchange rates from the beginning of 2000, a highly positive correlation is still evident (as shown in
Table 5).
12
Pacific Economic Papers
Table 4 Correlation of exchange rates per US dollar for five ASEAN nations
Indonesia Malaysia Singapore Thailand Philippines
Exchange Rate per US Dollar (1996:01–2003:11)
Indonesia 1.00 – – – –Malaysia 0.91 1.00 – – –Singapore 0.91 0.92 1.00 – –Thailand 0.88 0.93 0.93 1.00 –Philippines 0.83 0.81 0.93 0.89 1.00
Note: Grey cells indicate significance at 5% level.
This suggests that during the period under consideration, ASEAN currencies move similarly with
respect to the US Dollar. The patterns, again, leaves some room for the harmonisation of policies.
Table 5 Correlation of exchange rates to US dollar for five ASEAN nations10
Indonesia Malaysia Singapore Thailand Philippines
Exchange Rate per US Dollar (2000:01–2003:11)
Indonesia 1.00 – – – –Malaysia n.a n.a – – –Singapore 0.76 n.a 1.00 – –Thailand 0.81 n.a 0.77 1.00 –Philippines 0.33 n.a 0.45 0.61 1.00
Note: Grey cells indicate significance at 5% level.
13
No. 349, 2005
Potential impediments and steps to be taken
The above account provides some analytical support for the proposition that the five ASEAN
economies can move forward in integrating their monetary systems. However, as mentioned in the
previous section, the five countries are facing disparities in the level of economic development. This
issue may act as a natural stumbling block for any monetary integration process. Together with the
relatively weak performance in meeting the political preconditions for forming an OCA, relative
economic divergence can become the main potential impediment in realising an ACU or any other kind
of monetary arrangement in ASEAN. With such differences in the level of economic development, the
participating countries may always be tempted to deviate from the aim of the agreed arrangement. This
potential problem will be a lot more serious in the absence of strong political commitment in the
background.
Increasing interest in closer monetary cooperation in ASEAN is mainly driven by the common
perception of a need to stabilise the exchange rates within the region. The issue starts to emerge right
after the enormous currency crisis in 1997 and has been present as a topic of lively discourse since then.
On the practical side, however, the discourse is not yet making an impressive progress. Apart from the
potential impediment in the form of relative economic divergence, this situation also resulted from the
relatively low level of political drive to move forward in each of the member country.
To provide relatively stable exchange rates in the region, it is argued that in the short run, pegging
to an (a basket of) external anchor(s) would work.11 However, in a relatively highly integrated region,
this anchor needs to be common in order to stabilise the intra-regional exchange rates. In this sense,
the ASEAN five also face a coordination problem of choosing the right common anchor, which carries
with it consequences of having to adopt the anchor(s) country’s (or countries’) corresponding
monetary policy. In other words, even consideration of a common peg regime as an alternative to
adopting a common currency would still entail some degree of monetary regionalism for the region.
Therefore, consideration of the optimum currency area criterion should still be taken in to account.
As discussed previously, this particular consideration faces a relatively low level of political
commitment problem as one of its potential stumbling blocks. Whatever the potential benefits, it is also
widely recognised in the literature that any regional monetary cooperation would involve costs to the
potential members. This may be one of the main reasons behind the relatively low level of political
commitment to moving forward practically with a more integrated monetary system in ASEAN. This
circumstance, of course, does not deny that the economies under consideration have (to some extent)
started to put some elements of cooperative agreements in place. Significant progress in implementing

14
Pacific Economic Papers
the AFTA agreement, evidenced by the trend of a more intensified trade within the region, is one of
promising example. An introduction of a explicit bilateral stand-by agreement through the Chiang Mai
initiative is a concrete example of establishing an instrument for monetary cooperation. However, this
agreement is relatively limited in terms of the amount of funds that are covered, which makes it unlikely
to impress financial markets.
Given the above obstacle, the most crucial thing to do is to work on the political commitment
for further harmonisation of monetary policies within the region. Policy dialogues and surveillance are
necessary conditions to begin enhancing such a commitment politically. To some extent, this step has
already been pursued through existing coordination among monetary and financial authorities within
the region, mostly through information sharing. The question, however, is how credibly has this
process been conducted and how much effort has been put to achieve the acceptable political
requirements to move forward in forming an integrated monetary system. The answer, for the time
being, may not be very encouraging. As often mentioned in the coordination literature, without
binding requirements in place behind the practice of information sharing, this process could potentially
end up as a ‘cheap talk’ rather than a productive one. In order to avoid that outcome, efforts aimed at
creating binding requirements such as common incentives for sharing credible information are
particularly important. Even though the structural shocks for these economies are highly and positively
correlated, individual economies could still enjoy some benefit from sending false signals to others
when handling their own country shocks. One of the steps often suggested is to strengthen and deepen
the coverage of regional financial markets and institutions. This could then generate a greater need to
share credible information since each domestic financial system is interconnected within the region
through the regional financial markets.
Once the monetary coordination process is being conducted effectively, then serious policy
dialogues could be initiated on how far each of these economies is willing to relinquish its monetary
sovereignty. In other words, the region can then move on to start considering formal monetary
cooperation. If ever an agreement for this is achieved, then an agenda for necessary steps to be taken
must also be agreed to. This is not at all an easy task. The process of harmonising monetary policies will
involve tough policy decisions, such as adhering to fiscal and exchange rate agreements, especially in
the presence of the existing dissimilarities in the level of economic development. The European
experience may provide good guidance on this front.
The detail of any ASEAN movement towards full-fledged monetary integration, even if the
political commitment is present, may still be harder to achieve than that observed in the EU.
Establishing a trans-national institution that is capable of generating credibility would certainly be a
15
No. 349, 2005
hard task. Unlike Europe, which has Germany to take the lead, addressing this question in the case of
ASEAN would be rather tricky. Not only will it be necessary to define the appropriate anchor for the
process, but participants will also need to agree on an appropriate set-up for the trans-national
institution that will be in the vanguard of the process. This issue, again, requires a very strong political
will on the part of the participating nations to find the best way through this problem.
If an agreement on monetary regionalism is achieved, the next question is whether the
cooperation involved would be strong enough to last over the longer term. That is, would the
cooperation be enforceable to keep participating countries on course over time? To answer this
question will mean pinning down the available incentive structure needed to keep the cooperation in
place overtime. Say, governments of the participating countries at some date agreed to pursue monetary
cooperation. In order to ensure that the scheme could be implemented successfully, participants would
need to guarantee that the agreement would be maintained even if there is a power shift in any of the
participating countries. Therefore, the creation of a reliable institution that contains an incentive
structure sufficient to keep all participating economies from ‘cheating’ would be crucial. In order to
ensure this, ASEAN nations would need to identify the appropriate incentive structure. This is needed
to see how far the current incentive structure differs from the one needed to maintain institutional
cohesion.
The above discussion suggests that a proposal for integrating monetary systems in ASEAN,
particularly within the five countries under consideration, is achievable. This is so because of the
potentials for the region to enjoy considerable benefit from the process. The region has met some of
the standard economic criteria provided by the theory of OCA. To move ahead, a strong and sustainable
political commitment needs to be institutionalised. A gradual harmonisation of the region’s monetary
policy-making, while at the same time working towards less dispersion in the level of economic
development, would be a good starting point. For that, doing things gradually, starting from
coordinating macroeconomic policies that are moving consistently towards achieving the goal of a more
integrated monetary system, would be the best idea. However, a binding institutional arrangement has
to be established and agreed upon as early as possible to avoid participating countries from deviating
from the agreement by capitalising gains at other countries’ expense.
Conclusion
Indonesia, Malaysia, Singapore, Thailand and the Philippines appear to be relatively suitable to form
a monetary union. This can be justified on least two grounds: the trade pattern among these economies,
16
Pacific Economic Papers
and the relative symmetry in the nature of their economic shocks. These five countries will potentially
reap sizable benefits from having a cooperative monetary policy, or even from a common currency.
Similarities in the recent pattern of demand shock components and exchange rate variations among
them also suggest that the harmonisation process in terms of macroeconomic policies may not be as
hard as previously thought. Should these current trends continue into the future, practical steps toward
full-fledged monetary cooperation may become likely.
Because of existing impediments, however, the process for integrating the monetary systems in
the five ASEAN countries would neither be a smooth nor an easy process. However, the potential also
exists for these countries to enjoy benefits from taking such an initiative. If any action is to be taken,
attention needs to be carefully directed to the current dispersion in the level of economic development.
This aspect alone is potentially harmful to any decision on integrating the monetary system. As has been
acknowledged in the literature on monetary cooperation, in addition to the potential benefits, there
will inevitably be costs associated with initiating such a process. These costs will not only be a direct
cost from the process itself, but also the possibility of having a participant deviate from the agreed
arrangement. As far as the level of economic development is concerned, a country may well be tempted
to deviate from the agreement if it can capitalise on such non-cooperative action, given that the actions
of every other participants would be known. The rest of the non-deviating participants would
potentially bear the costs of such an action. This action could then jeopardise the process and threaten
the sustainability of monetary integration at large.
To avoid such an eventuality, careful staging and strong institution for ensuring the smooth
progress of integration needs to be designed. Careful study of the underlying incentive structure behind
the process of integration for each potential participant needs to be carried out in order to identify the
correct form of the institutional system.
In summary, monetary integration in ASEAN, although not impossible, will have to go through
a relatively long process before it can be realised. The five largest ASEAN countries seem to be suitable
candidates to begin with. Further study concerning the proper institutional set-up and the preferred
arrangement will hopefully shed light on the challenges identified.
17
No. 349, 2005
Notes
The views expressed in this paper is the author’s own and not of the institutions with which he isaffiliated.
I thank Prof. Gordon de Brouwer, Prof. Peter Drysdale, Eddie Cheung, Hadi Soesastro and theparticipants in the 29th FAEA Conference, Kuala Lumpur, December 10–11, 2004 for their helpfulcomments and suggestions. The author, however, remains solely responsible for the content of thispaper.
1 ASEAN Vision 2020, 1997, http://www.aseansec.org/1814.htm
2 Hanoi Plan of Action 1998, http://www.aseansec.org/687.htm
3 Recent Developments in ASEAN Economic Integration, ASEAN Secretariat, 1999, Jakartahttp://www.aseansec.org/7661.htm
4 The trade intensity index between Singapore and Thailand varies around 4 to 5 for 1996–2001compared to around 4.2 to 5.2 for the trade intensity index between Thailand and Singapore.
5 See appendix for description of the methodology.
6 The correlation is only significant at 10% level of significance.
7 Including the financial crisis and the post-crisis period in VAR estimation might invitestructural breaks in the data, hence could potentially affect the estimation. Another possibleexplanation would be relative reliability in the proxies for the structural shocks.
8 This country only shows a relatively small positive and significant correlation with Thailand.
9 Due to the fact that demand shocks are comprised of macroeconomic policy as well as purelystochastic components.
10 A correlation coefficient for Malaysia does not exist since Malaysia fixed its exchange rate tothe US dollar right after the crisis.
11 See, for example, Mundell (2003).
References
Anderson, K. and H. Norheim (1993) ‘History, Geography and Regional Economic Integration’,Chapter 2 in K. Anderson and R. Blackhurst (eds), Regional Integration and the GlobalTrading System, Harvester Wheatsheaf, Hemel Hempstead.
Bayoumi, T. and B. Eichengreen (1994) ‘One Money or Many? Analyzing the Prospects forMonetary Unification on Various Parts of the World’, Princeton Studies in InternationalFinance, 76.
Bayoumi, T., B. Eichengreen and P. Mauro (1999) ‘On Regional Monetary Arrangements forASEAN’, Paper in the ADB/CEPII/KIEP Conference on Exchange Rate Regimes in EmergingMarket Economies, Tokyo, December 1999, available at: http://www.adbi.org/PDF/cf991217/mauropaper.pdf
18
Pacific Economic Papers
Bayoumi, T. and P. Mauro (1999) ‘The Suitability of ASEAN for a Regional Currency Arrangement’,IMF Working Paper, WP/99/162.
Bénassy-Quéré, A. and B. Coeuré (2000) ‘Big and Small Currencies: The Regional Connection’,Document de travail, no. 2000–10, CEPII.
Bunyaratavej, K. and E. D. Hahn (2003) ‘Convergence and Implications for a Common Currencyin ASEAN’, ASEAN Economic Bulletin, 20(1), 49–59.
de Brouwer, G. J. (1999) ‘Financial Integration in East Asia’, Cambridge University Press,Cambridge.
Frankel, J.A. (1991) ‘Is a Yen Bloc Forming in Pacific Asia?’, in R. O’Brien (ed.), Finance and theInternational Economy: 5, The AMEX Bank Review Price Essay, Oxford University PressLondon.
Frankel, J. A. (1993) ‘Is Japan Creating a Yen Bloc in East Asia and the Pacific?’ in J. A. Frankel andM. Kahler (eds), Regionalism and Rivalry: Japan and the U.S. in Pacific Asia, University ofChicago Press, Chicago.
Frankel, J. A. and S. J. Wei (1994) ‘Yen Bloc or Dollar Bloc: Exchange Rate Policies of the East AsianEconomies’, in T. Ito and A. O. Krueger (eds), Macroeconomic Linkage, University ofChicago Press, Chicago.
Henning, C. R. (2004) ‘The Complex Political Economy of Cooperation and Integration’, inG. J. de Brouwer and Y. Wang (eds), Financial Governance in East Asia: Policy Dialogue,Surveillance and Cooperation, RoutledgeCurzon, New York.
Kawai, M. and T. Motonishi (2005) ‘Is East Asia an Optimum Currency Area?’, available athttp://www.mof.go.jp/english/soken/kiep2005/kiep2005_04.pdf.
Krugman, P. (2001) ‘What Happened to Asia?’, Financial Market Integration and InternationalCapital Flows, 209–218.
Mundell, R. (2003) ‘Prospects for an Asian Currency Area’, Journal of Asian Economies, 14, 1–10.Zhang, Z., K. Sato and M. McAleer (2003) ‘Asian Monetary Integration: A Structural VAR
Approach’, CIRJE Discussion Papers, available at: http://www.e.u-tokyo.ac.jp/cirje/research/03research02dp.html

19
No. 349, 2005
Appendix
In order to construct the series of aggregate structural shocks, we employ the YP-model from Bayoumi
and Eichengreen (1994). The data used are the annual GDP in local currency at constant price and GDP
deflator (as a proxy of inflation) of the economies under consideration obtained from the 2003 World
Development Indicators CD-ROM.
Following the YP-model, the specification of interest is set as follows:
=
∆∆
st
dt
pp
yy
t
t
u
u
LcLc
LcLc
p
y
)()(
)()(
21
21
(1)
or, Xt = C(L)ut
where, ∆yt is the first difference of the log of real gross domestic product (GDP) measure (hence
measuring economic growth) and ∆pt is the difference of the log of the real GDP deflator (hence
measuring inflation). cij(L); i=(y,p) and j=(1=demand shock,2=supply shock). udt is the demand shock
at time t and ust is the supply shock at time t.
Since udt and ust are unobservable, they are estimated by first estimating the following
unrestricted VAR model:
Xt = A(L)Xt–1— + et (2)
Where, XtT = [∆yt, ∆pt]; A(L) is the 2´2 matrix with elements equal to aik(L); k represents column;
and etT
= [eyt, ept], the vector of error terms from the two equation in the bivariate system. The next step
is to convert the VAR model in (2) into its vector moving average (VMA) representation as follows:
Xt = (I – A(L))-1et (3)
Except for being expressed in different variables, (1) and (3) are exactly the same. Therefore:
(I – A(L))-1et= C(L)ut. By assuming that udt and ust follow a white noise process and normalising their
variance to be equal to 1, and by imposing the long run identifying restriction for the demand shock

20
Pacific Economic Papers
effects on output (Σcy1(L)=0), we have enough information to estimate the contemporaneous
parameters udt and ust (cij(0)).
Using the estimated cij(0) above, we can calculate the estimated values for the structural shocks.
From (2), eit is the one step ahead forecast error of Dyt and Dpt ; while from (1), we know that those
one step ahead forecast errors are Sjcij(0)ujt. Therefore, tt eCu 1)0( −= .
21
No. 349, 2005
Previous Pacific Economic Papers
348 Growth and reform in the Korean economyVolume edited by Jong-Soon Kang and Jung Soo Seo, 2005
347 Trade policy at the crossraods – The Indonesian storyDavid Vanzetti et al, 2005
346 Fiscal rules and targets and public expenditure management: Enthusiasm in the 1990s and itsaftermathHideaki Tanaka, 2005
345 The Australia–US Free Trade Agreement: An assessmentPhilippa Dee, 2005
344 Regional cooperation in East Asia and FTA strategiesPeter Drysdale, 2005
343 Taiwan’s role in the economic architecture of east Asia and the PacificPeter Drysdale and Xinpeng Xu, 2005
342 A regional bond market for East Asia? The evolving political dynamics of regional financialcooperationJennifer Amyx, 2004
341 East Asian economic integration: China’s perspective and policyXu Mingqi, 2003
340 Services trade liberalisationMotoshige Itoh and Naoki Shimoi, 2003
339 The enigma of Toyota’s competitive advantage: Is Denso the missing link in the academicliterature?Evelyn Anderson, 2003
338 An ASEAN Economic Community and ASEAN+3: How do they fit together?Hadi Soesastro, 2003
337 Regional approaches to services trade and investment liberalisationJane Drake-Brockman, 2003
336 Beyond free trade agreements: 21st century choices for East Asian economic cooperationAndrew Elek, February 2003
335 Trading with favourites: Free trade agreements in the Asia PacificChristopher Findlay, Haflah Piei and Mari Pangestu, January 2003
334 WTO market access negotiations for non-agricultural products, Doha Round: Implications forEast AsiaKate Flowers and Malcolm Bosworth, December 2002
333 Regional economic integration in East AsiaJane Drake-Brockman and Peter Drysdale, November 2002
332 Strengthening regional financial cooperation in East Asia
Haruhiko Kuroda and Masahiro Kawai, October 2002
331 Moving beyond bilateralism? Japan and the Asian Monetary FundJennifer Amyx, September 2002
330 Impact of APEC trade liberalisation on Sino–Australian bilateral tradeYu Sheng, August 2002
329 Intra-industry foreign direct investment and intra-industry trade in KoreaJung-Soo Seo, Jong-Soon Kang and Deok-Ki Kim, July 2002
328 The effects of the euro on financial markets, activity and structureWerner Studener, June 2002
327 The compatibility of capital controls and financial development: a selective survey and empiricalevidenceMenzie D. Chinn, May 2002
326 The Basel process and regional harmonisation in AsiaShinichi Yoshikuni, April 2002
325 Trends in global finance, markets and institutions: some implications for developments in theAsian regionWilliam E. Alexander, March 2002
324 The IMF and East AsiaGordon de Brouwer, February 2002
323 APEC and the new economyMari Pangestu and Sung-hoon Park, January 2002
322 East Asian steel projections for the 1990s revisitedBen Garvey and Peter Drysdale, December 2001
321 Evidence of shifts in the determinants of the structure of Japanese manaufacturing trade, 1970–95Peter Drysdale and Ligang Song, November 2001
320 The services content of Japanese tradeKozo Kiyota, October 2001
319 Changes in the Japanese food sectorRay Trewin et al., September 2001
318 The changing economic performance and political significance of Japan’s agriculturalcooperativesYoshihisa Godo, August 2001
317 Bank and corporate restructuring in crisis-affected East Asia: from systemic collapse toreconstructionMasahiro Kawai, July 2001
316 Hot and spicy: ups and downs on the price floor and ceiling at Japanese supermarketsKenn Ariga, June 2001
315 China’s admittance to the WTO and industrial structural adjustment in the world economyChristopher Findlay, May 2001
314 ‘Japan Inc.’ in the agricultural sector: reform or regression?Aurelia George Mulgan, April 2001
313 Encouraging ‘democracy’ in a Cold War climate: the dual-platform policy approach of Evatt andLabor toward the allied occupationChristine de Matos, March 2001
312 Managing capital flows: a distortions approachDominic Wilson, February 2001
311 Old issues in new regionalismChristopher Findlay, January 2001
310 Trade conflicts between Japan and the United States over market access: the case of automobilesand automotive partsMasao Satake, December 2000
309 Subregional trading arrangements among APEC economies: managing diversity in the AsiaPacificAndrew Elek, November 2000
308 Weathering the Asian crisis: the role of ChinaYongzheng Yang and Rod Tyers, October 2000
307 The internationalisation of the yen: essential issues overlookedTetsuji Murase, September 2000
306 Japan’s local governance at the crossroads: the third wave of reformPurnendra Jain, August 2000
Annual subscription rate for twelve issues:Individuals A$65.00 (includes GST) A$60 (overseas)Institutions A$110.00 (includes GST) A$100 (overseas)
Cost for single issues:A$16.50 (includes GST) A$15.00 (overseas)A$10.00 (Students)
No postage required within Australia
Available from: Publications DepartmentAustralia–Japan Research CentreAsia Pacific School of Economics and ManagementThe Australian National UniversityCanberra ACT 0200, AustraliaFacsimile: (61 2) 6249 0767Telephone: (61 2) 6249 3780Email: [email protected]: http://ajrcnet.anu.edu.au/
305 Some key issues for the East Asian food sectorM. Honma, R. Trewin, M. Bosworth, R. Stringer and Y. Godo, July 2000(special volume)
304 Food embargoes against China: their likelihood and potential consequencesYongzheng Yang, June 2000
303 Foreign direct investment and intra-industry trade – the case of the United StatesTina Yiping Chen, May 2000
302 Implications of recent Japanese legal reformsLeon Wolff, Veronica Taylor and Akiyoshi Horiuchi, April 2000(special volume)
301 Toward reform and transparency in Japanese policymaking processesJ.A.A. Stockwin, Jennifer Amyx and Gregory Noble, March 2000(special volume)
300 A way forward for Japanese agriculture?Masayoshi Homna, Ray Trewin, Jennifer Amyx and Allan Rae, February 2000(special volume)