Ascendas India Trust
50
Ascendas India Trust 2H FY2020 Financial Results Presentation 28 January 2021
Transcript of Ascendas India Trust
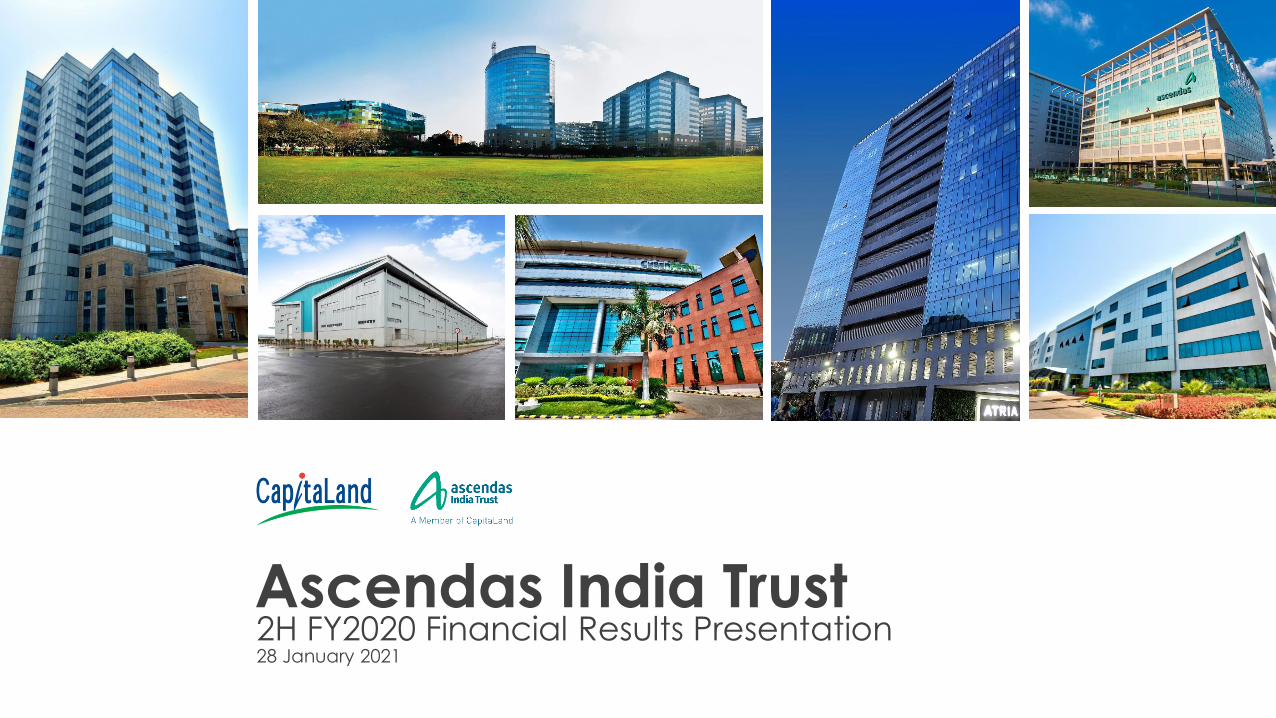
Ascendas India Trust2H FY2020 Financial Results Presentation28 January 2021

This presentation on a-iTrust’s results for the 6-month period ended 31 December 2020 (“2H FY2020”) should be read in
conjunction with a-iTrust’s half-yearly results announcement, a copy of which is available on www.sgx.com or www.a-iTrust.com.
This presentation may contain forward-looking statements. Actual future performance, outcomes and results may differ materially from those expressed inforward-looking statements as a result of a number of risks, uncertainties and assumptions. Representative examples of these factors include (withoutlimitation) general industry and economic conditions, interest rate trends, cost of capital and capital availability, availability of real estate properties,competition from other developments or companies, shifts in customer demands, shifts in expected levels of occupancy rate, property rental income,charge out collections, changes in operating expenses (including employee wages, benefits and training, property operating expenses), governmentaland public policy changes and the continued availability of financing in the amounts and the terms necessary to support future business.
You are cautioned not to place undue reliance on these forward-looking statements, which are based on the current view of management regardingfuture events. No representation or warranty express or implied is made as to, and no reliance should be placed on, the fairness, accuracy, completenessor correctness of the information or opinions contained in this presentation. Neither Ascendas Property Fund Trustee Pte. Ltd. (“Trustee-Manager”) nor anyof its affiliates, advisers or representatives shall have any liability whatsoever (in negligence or otherwise) for any loss howsoever arising, whether directly orindirectly, from any use of, reliance on or distribution of this presentation or its contents or otherwise arising in connection with this presentation.
The past performance of Ascendas India Trust (“a-iTrust”) is not indicative of future performance. The listing of the units in a-iTrust (“Units”) on the SingaporeExchange Securities Trading Limited (SGX-ST) does not guarantee a liquid market for the Units. The value of the Units and the income derived from themmay fall as well as rise. Units are not obligations of, deposits in, or guaranteed by, the Trustee-Manager. An investment in the Units is subject to investmentrisks, including the possible loss of the principal amount invested. Investors have no right to request that the Trustee-Manager redeem or purchase theirUnits while the Units are listed on the SGX-ST. It is intended that holders of Units may only deal in their Units through trading on the SGX-ST.
This presentation for information only and does not constitute an invitation or offer to acquire, purchase or subscribe for the Units.
All measurements of floor area are defined herein as “Super Built-up Area” or “SBA”, which is the sum of the floor area enclosed within the walls, the areaoccupied by the walls, and the common areas such as the lobbies, lift shafts, toilets and staircases of that property, and in respect of which rent ispayable.
The Indian Rupee and Singapore Dollar are defined herein as “INR/₹” and “SGD/S$” respectively.
Any discrepancy between individual amounts and total shown in this presentation is due to rounding.
Disclaimer
2

FY2020 key highlights
3
Development
• Completed construction of Endeavour1 building, a 0.7 million sq ft multi-tenanted building in ITPB in November
2020. Endeavour was fully committed as at completion.
• Increase in development potential in ITPH by 0.7 million sq ft to 4.2 million sq ft due to revised building height
approvals.
Forward purchase
and acquisition
• March 2020 – Entered into agreement for conditional acquisition of 1 Grade-A warehouse in Khurja, NCR.
• November 2020 – Consent has been obtained from Indian authorities for a revised investment structure which will
allow a-iTrust to acquire aVance 5 and aVance 6 separately.
Index inclusion • a-iTrust’s was included in the MSCI Singapore Small Caps Index effective 29 May 2020.
COVID-19
preparedness
• All a-iTrust business parks and Park Square Mall have been accredited with the British Safety Council’s certification
for global benchmark in COVID-19 control measures.
Financial
performance
• FY2020 DPU grew by 12% and 8% in INR and SGD respectively.
• Valuation of investment properties increased by 5.1% in INR and 0.2% in SGD as at 31 December 2020.
1. Endeavour was previously known as MTB 5.
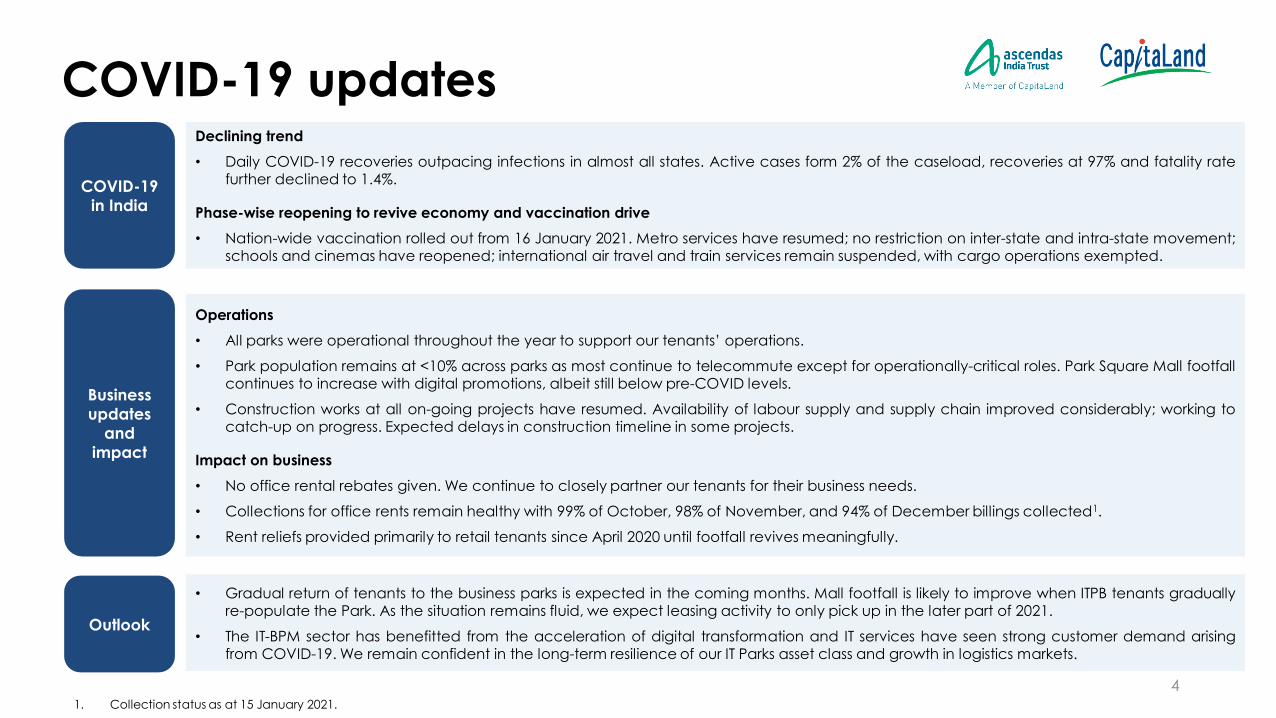
Operations
• All parks were operational throughout the year to support our tenants’ operations.
• Park population remains at <10% across parks as most continue to telecommute except for operationally-critical roles. Park Square Mall footfallcontinues to increase with digital promotions, albeit still below pre-COVID levels.
• Construction works at all on-going projects have resumed. Availability of labour supply and supply chain improved considerably; working tocatch-up on progress. Expected delays in construction timeline in some projects.
Impact on business
• No office rental rebates given. We continue to closely partner our tenants for their business needs.
• Collections for office rents remain healthy with 99% of October, 98% of November, and 94% of December billings collected1.
• Rent reliefs provided primarily to retail tenants since April 2020 until footfall revives meaningfully.
COVID-19 updates
4
Declining trend
• Daily COVID-19 recoveries outpacing infections in almost all states. Active cases form 2% of the caseload, recoveries at 97% and fatality ratefurther declined to 1.4%.
Phase-wise reopening to revive economy and vaccination drive
• Nation-wide vaccination rolled out from 16 January 2021. Metro services have resumed; no restriction on inter-state and intra-state movement;schools and cinemas have reopened; international air travel and train services remain suspended, with cargo operations exempted.
COVID-19
in India
Business
updates
and
impact
1. Collection status as at 15 January 2021.
Outlook
• Gradual return of tenants to the business parks is expected in the coming months. Mall footfall is likely to improve when ITPB tenants graduallyre-populate the Park. As the situation remains fluid, we expect leasing activity to only pick up in the later part of 2021.
• The IT-BPM sector has benefitted from the acceleration of digital transformation and IT services have seen strong customer demand arisingfrom COVID-19. We remain confident in the long-term resilience of our IT Parks asset class and growth in logistics markets.

International Tech Park Bangalore
Financial review

2H FY2020 results
6
2H FY20201 2H FY20191 Variance
SGD/INR FX rate2 53.5 51.5 3.9%
Total property income₹5,051m
S$92.7m
₹5,205m
S$101.1m
(3%)
(8%)
Net property income₹4,049m
S$74.4m
₹3,892m
S$75.6m
4%
(2%)
Income available for distribution₹2,925m
S$53.6m
₹2,666m
S$51.8m
10%
3%
Income to be distributed₹2,632m
S$48.2m
₹2,399m
S$46.6m
10%
3%
Income to be distributed (DPU3) ₹2.29
4.19¢
₹2.27
4.40¢
1%
(5%)
Weighted average number of units
(‘000)1,147,574 1,061,553 8%
• Mainly due to net property income
growth and interest income from
investments in Arshiya Panvel, AURUM IT
SEZ and BlueRidge 3;
• partially offset by higher provision for
Singapore GST in 2H FY2020.
• Increase due to lower operational,
maintenance and utilities expenses and
reversal of expected credit loss.
• Lower utilities and carpark income due to
COVID-19 pandemic.
• After retaining 10% of income available
for distribution.
1. a-iTrust financial year end has changed from 31 March to 31 December as announced on 19 July 2019. 2H FY2020 refers to the 6-month period from 1 July 2020 to 31 December 2020. 2H FY2019 refers to the 6-month period from 1 July 2019 to 31 December 2019 and is used solely for comparative purposes only.
2. Average exchange rate for the period.
3. Distribution per unit.
FY2020 results
7
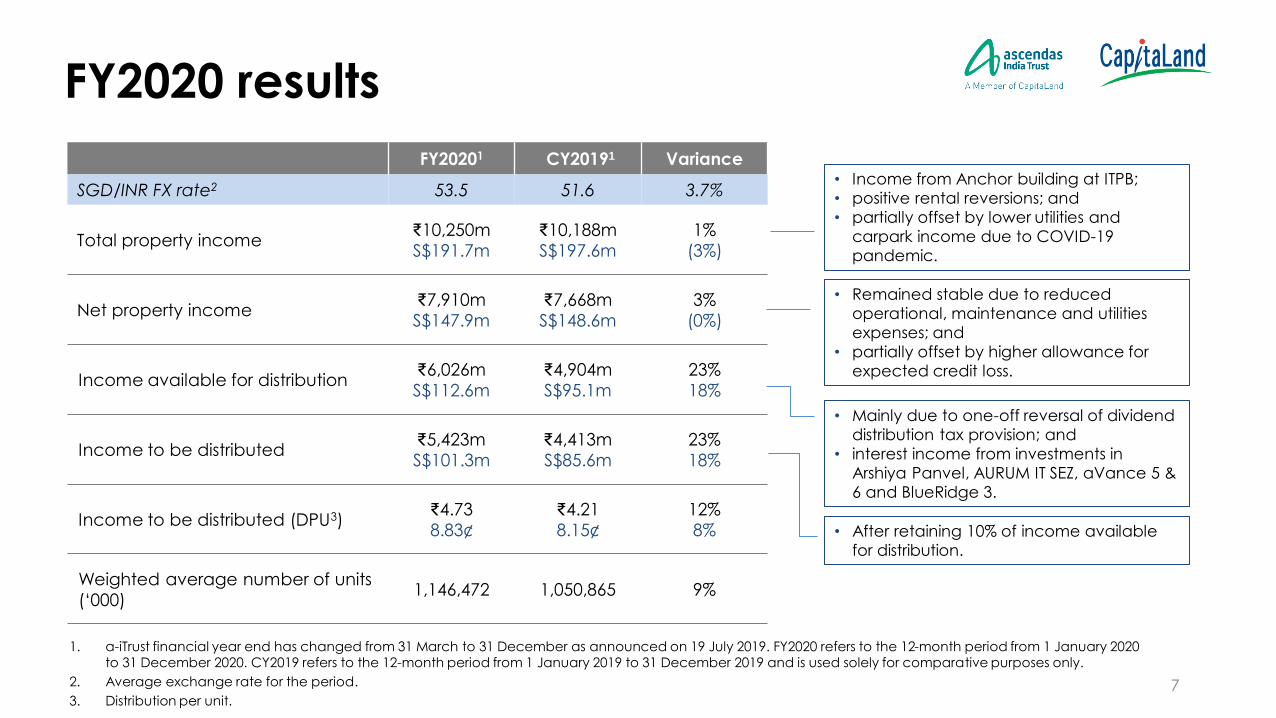
FY20201 CY20191 Variance
SGD/INR FX rate2 53.5 51.6 3.7%
Total property income₹10,250m
S$191.7m
₹10,188m
S$197.6m
1%
(3%)
Net property income₹7,910m
S$147.9m
₹7,668m
S$148.6m
3%
(0%)
Income available for distribution₹6,026m
S$112.6m
₹4,904m
S$95.1m
23%
18%
Income to be distributed₹5,423m
S$101.3m
₹4,413m
S$85.6m
23%
18%
Income to be distributed (DPU3) ₹4.73
8.83¢
₹4.21
8.15¢
12%
8%
Weighted average number of units
(‘000)1,146,472 1,050,865 9%
• Mainly due to one-off reversal of dividend
distribution tax provision; and
• interest income from investments in
Arshiya Panvel, AURUM IT SEZ, aVance 5 &
6 and BlueRidge 3.
• Remained stable due to reduced
operational, maintenance and utilities
expenses; and
• partially offset by higher allowance for
expected credit loss.
• Income from Anchor building at ITPB;
• positive rental reversions; and
• partially offset by lower utilities and
carpark income due to COVID-19
pandemic.
• After retaining 10% of income available
for distribution.
1. a-iTrust financial year end has changed from 31 March to 31 December as announced on 19 July 2019. FY2020 refers to the 12-month period from 1 January 2020 to 31 December 2020. CY2019 refers to the 12-month period from 1 January 2019 to 31 December 2019 and is used solely for comparative purposes only.
2. Average exchange rate for the period.
3. Distribution per unit.

Cumulative Distribution
8
1H FY2020
1 January 2020 to 31 December 2020
4.64¢ per unit
Period
Total YTD 8.83¢ per unit
Distribution details
Period: 1 July 2020 – 31 December 2020
Amount: 4.19¢
Ex-date: 16 February 2021
Payment date: 25 February 2021
With effect from 1 April 2019, a-iTrust’s financial year end was changed from 31 March to 31 December.
Going forward, a-iTrust will make distributions to Unitholders on a semi-annual basis for the six-month period ending 30 June and 31 December of each year.
2H FY2020 4.19¢ per unit

2,3912,628
3,197 3,260
3,654
4,249
4,790
5,827
6,791
7,6687,910
INR million
71.1 70.174.9
69.875.9
91.198.4
123.6
133.8
148.6 147.9
S$ million
Income growth trends
9
Net Property Income (INR) Net Property Income (SGD)13%
CAGR
8%CAGR

0.00
1.00
2.00
3.00
4.00
5.00
6.00
7.00
8.00
9.00
10.00
CY2007 CY2008 CY2009 CY2010 CY2011 CY2012 CY2013 CY2014 CY2015 CY2016 CY2017 CY2018 CY2019 CY202040
50
60
70
80
90
100
110
120
130
Half-yearly DPU since listing
Change since listingINR depreciation against SGD: -52%
SGD DPU3: +61%
1. DPU (income available for distribution) refers to 100% of distributable income. 10% of distributable income was retained starting from 2Q CY2012.2. Average daily spot INR/SGD exchange rate for the period, pegged to 1 August 2007 using data sourced from Bloomberg.3. Last 12 months DPU compared against first 12 months DPU.
INR/SGD exchange rate2
(Indexed)DPU1 (S¢)
10
INR/SGD exchange rate1H 2H

Portfolio valuation summary
1. The independent market valuations for 31 December 2020 and 31 December 2019 were conducted by Savills Property Services (India) Pvt. Ltd. 2. Based on the exchange rate of S$1:₹55.3.3. Based on the exchange rate of S$1:₹52.7.
11
Properties
31 December 20201 31 December 20191
Valuation
(INR mil)
Cap Rate
(%)
Valuation
(INR mil)
Cap Rate
(%)Variance
International Tech Park Bangalore 40,892Office: 8.75
Retail: 9.7537,825
Office: 8.75
Retail: 9.508.1%
International Tech Park Chennai 21,127 8.75 19,677 8.75 7.4%
CyberVale, Chennai 4,052 8.75 4,065 8.75 -0.3%
aVance Hyderabad 10,650 8.75 10,848 8.75 -1.8%
CyberPearl, Hyderabad 3,279 8.75 3,418 8.75 -4.1%
International Tech Park Hyderabad 18,544 8.75 17,778 8.75 4.3%
aVance Pune 9,490 8.75 9,282 8.75 2.2%
Arshiya Panvel warehouses, Mumbai 6,150 8.75 5,698 8.75 7.9%
Portfolio (in INR mil) 114,183 - 108,591 - 5.1%
Portfolio (in SGD mil) 2,0642 - 2,0603 - 0.2%

International Tech Park, Chennai
Capital management

Capital management
13
• The Trustee-Manager’s approach to equity raising is predicated on maintaining a strong balance sheet by keeping the Trust’s gearing ratio at an appropriate level.
• Trustee-Manager does not borrow INR loans onshore in India as it costs less to hedge SGD borrowings to INR-denominated borrowings using cross-currency swaps and derivatives.
Currency hedging strategy
• Trustee-Manager does not hedge equity.
• At least 50% of debt must be denominated in INR.
• Income is repatriated semi-annually from India to Singapore.
• Trustee-Manager locks in the income to be repatriated by buying forward contracts on a monthly basis.
Income
Balance sheet
Income distribution policy
• To distribute at least 90% of its income available for distribution.
• a-iTrust retains 10% of its income available for distribution to provide greater flexibility in growing the Trust.
Funding strategy

Debt maturity profile
14
67.747.0 44.6
80.062.0
45.6
185.4166.6
50.4
37.0
113.3
232.4
211.2
130.4
99.0
FY2021 FY2022 FY2023 FY2024 FY2025
SGD Denominated debt INR Denominated debt
S$ Million
Information as at 31 December 2020.
Effective borrowings: S$786 millionHedging ratioINR: 63% SGD: 37%

Capital structure
15
Indicator As at 31 December 2020
Interest service coverage
(EBITDA/Interest expenses)
4.0 times
(FY2020)
Percentage of fixed rate debt 86%
Percentage of unsecured borrowings 100%
Effective weighted average cost of debt1 5.3%
Gearing limit 50%2
Available debt headroom S$1,079 million
Cash and cash equivalent S$101 million
1. Based on borrowing ratio of 63% in INR and 37% in SGD as at 31 December 2020.2. As announced by MAS on 16 April 2020, the gearing limit was increased from 45% to 50% with immediate effect. 3. As at 31 December 2020, the effective borrowings to net asset ratio and total borrowings less cash and cash equivalent to net asset ratio is 59.4% and 53.8% respectively.
Gearing: 30%3

International Tech Park Hyderabad
Operational review

Office markets updateBangalore (Whitefield)
Chennai (OMR)
Hyderabad (IT Corridor I1)
Source: CBRE Research
Pune (Hinjawadi)
1. Includes HITEC City and Madhapur. 17
1
12.0%
7.2%8.9% 9.7%
13.9%
0.0
1.0
2.0
3.0
4.0
5.0
CY 2016 CY 2017 CY 2018 CY 2019 CY 2020
9.0%
3.3%3.3%
5.8%
12.0%
0.0
1.0
2.0
3.0
CY 2016 CY 2017 CY 2018 CY 2019 CY 2020
Supply (in million sq ft) Gross Absorption (in million sq ft) Vacancy (%)
3.0%
6.2%5.7%
2.6%
5.1%
0.0
1.0
2.0
3.0
CY 2016 CY 2017 CY 2018 CY 2019 CY 2020
9.9%8.6%
6.0% 6.3%
17.6%
0.0
1.0
2.0
CY 2016 CY 2017 CY 2018 CY 2019 CY 2020

Bangalore
34%
Hyderabad
26%
Chennai
22%
Pune
11%
Mumbai
7%
Diversified portfolio
18
Average space per tenant 41,722 sq ft
Portfolio breakdown by base rental
Total number of tenants 289
Customer Base
Largest tenant accounts for
10% of the portfolio base rent
All information as at 31 December 2020.

81%
94%
86%82%
88%
100%
94%97%
95%91%
95%91%
95%
100%
82%
100%
ITPB ITPC CyberVale aVance
Hyderabad
CyberPearl ITPH aVance
Pune
Arshiya
Panvel
Portfolio occupancy
19
1. The newly completed Endeavour building in ITPB is 100% committed, resulting in physical occupancy of 81% and committed occupancy at 94%.2. Excludes Mariner building in ITPH which is being vacated for redevelopment.3. There are no comparable warehouses in the micro-market that the Arshiya Panvel warehouses are located in.4. CBRE market report as at 31 December 2020.
All information as at 31 December 2020.
a-iTrust committed occupancy Market occupancy of peripheral area4
Committed portfolio occupancy: 94%
Arshiya
Panvel
1
a-iTrust physical occupancy
32

11%
28%
8%
16%
7%
21% 21%
0%
5%
10%
15%
20%
25%
30%
ITPB ITPC CyberVale aVance Hyderabad CyberPearl ITPH aVance Pune
FY2020 rental reversion1
20
All information as at 31 December 2020.
Bangalore Chennai Hyderabad Pune
1. Rental reversion for a lease is defined as the percentage change of the new effective gross rent over the preceding effective gross rent. Only new and renewed long-term leases transacted within the last 12 months are taken into account for purpose of calculation of rental reversion here.

21
Spread-out lease expiry profile
All information as at 31 December 2020.
Weighted average lease term:
6.6 yearsWeighted average lease expiry:
3.5 years
Note: Retention rate for the period 1 January 2020 to 31 December 2020 was 53%.
23%
19%
11%
17%
30%
-
50
100
150
200
250
FY2021 FY2022 FY2023 FY2024 FY2025 & beyond
Monthly base rent expiring
(INR mil)
Millio
ns

Quality tenants
22
Top 10 tenants% of base
rents
1 Tata Consultancy Services 10%
2 Arshiya Panvel 7%
3 Renault & Nissan 5%
4 Societe Generale 4%
5 Applied Materials 3%
6 Bank of America 3%
7 Technicolor 2%
8 Cognizant 2%
9 UnitedHealth Group 2%
10 Xerox 2%
Top 10 tenants
accounted for 39% of
portfolio base rent
All information as at 31 December 2020.
Top 5 sub-tenants of Arshiya Panvel% of base
rents
1 Huawei Telecommunications 12%
2 DHL Logistics 9%
3 Shashwat Group 8%
4 ZTE Corporation 5%
5 Rolex Logistics (CISCO) 5%

IT
49%
IT/ITES
36%
Logistics &
warehousing
7%
ITES
4%
Retail & F&B
3%
Others
1%R&D
0.3%
1
1
1
1
IT, Software &
Application
Development and
Service Support
52%
Banking &
Financial Services
10%
Design, Gaming
and Media
7%
Electronics,
Semiconductor &
Engineering
7%
Logistics
7%
Automobile
5%
Others
3%
Healthcare & Pharmaceutical
3%
Telco
2%
Oil & Gas
2%Retail
1% F&B
1%
1
Tenant core business & activity by base rentalDiversified tenant base
231. IT - Information Technology; ITES - Information Technology Enabled Services; R&D - Research & Development; F&B - Food & Beverage.
All information as at 31 December 2020.
Tenant core
businessTenant core
activity

USA
51%
India
30%
France
9%
Japan
2%
Singapore
2%
UK
2%
Others
4%
Tenant country of origin & company structure by base rental
Diversified tenant base
241. Comprises Indian companies with local and overseas operations.2. Comprises Indian companies with local operations only.3. Multinational corporations, including Indian companies with local and overseas operations.
All information as at 31 December 2020.
Country of
origin
1
India Co
13%
MNC
87%
Company
structure
3
2
International Tech Park Chennai
Growth strategy
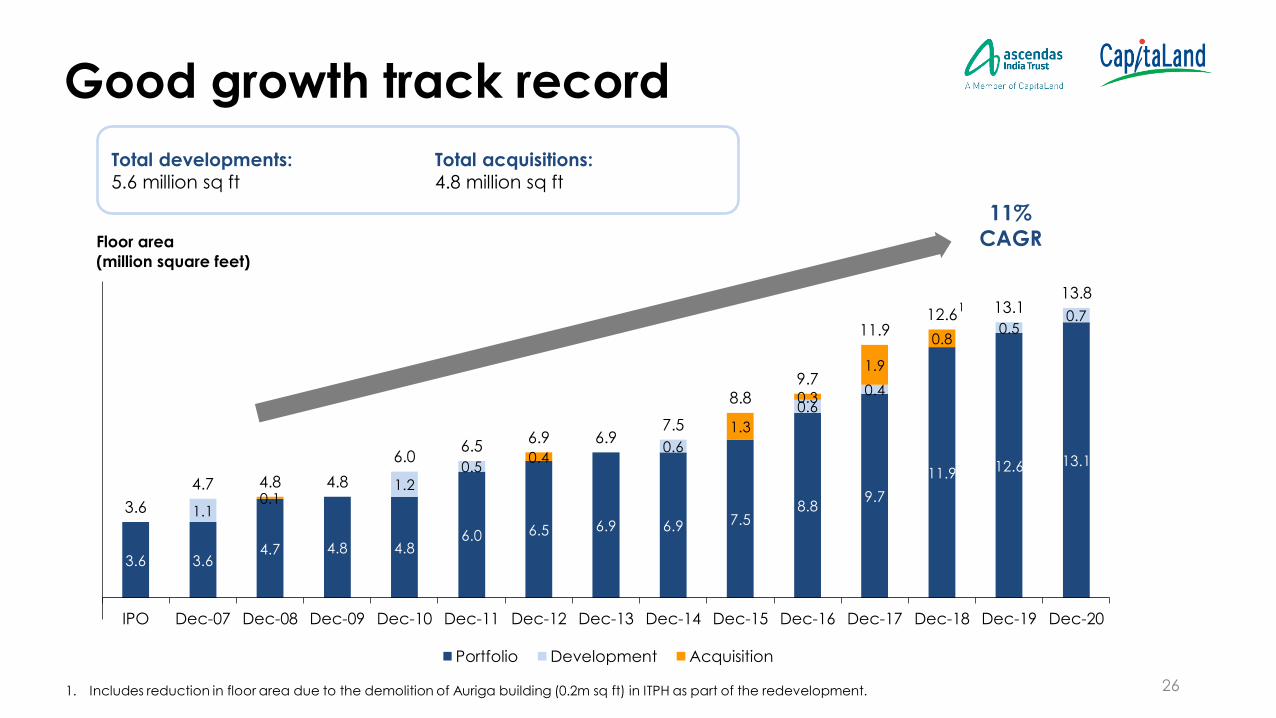
3.6 3.64.7 4.8 4.8
6.0 6.5 6.9 6.9 7.58.8
9.7
11.9 12.6 13.1
1.1
1.2
0.5
0.6
0.60.4
0.50.7
0.1
0.4
1.3
0.3
1.9
0.8
3.6
4.7 4.8 4.8
6.06.5
6.9 6.97.5
8.89.7
11.912.6 13.1
13.8
IPO Dec-07 Dec-08 Dec-09 Dec-10 Dec-11 Dec-12 Dec-13 Dec-14 Dec-15 Dec-16 Dec-17 Dec-18 Dec-19 Dec-20
Floor area
(million square feet)
Portfolio Development Acquisition
Good growth track record
1. Includes reduction in floor area due to the demolition of Auriga building (0.2m sq ft) in ITPH as part of the redevelopment.
Total developments:
5.6 million sq ft
Total acquisitions:
4.8 million sq ft
11% CAGR
26
1

Clear growth strategy
27
• 3.1m sq ft1 in Bangalore
• 4.2m sq ft2 in Hyderabad
• 0.4m sq ft in Chennai
• 2.3m sq ft from CapitaLand
• Ascendas India Growth Programme
• 1.8m sq ft aVance Hyderabad
• 2.1m sq ft aVance Business Hub 2
• 1.4m sq ft AURUM IT SEZ
• 1.8m sq ft BlueRidge 3
Logistics
• 2.8m sq ft3 Arshiya Panvel warehouses
• 3.9m sq ft4 Arshiya Khurja warehouses
• Ascendas-Firstspace platform
1. Includes additional development potential of 1.0m sq ft due to the widening of the road in front of International Tech Park Bangalore and 1.1m sq ft due to revised government regulation.
2. Includes additional development potential of 0.7m sq ft due to revised building height approvals.3. Includes a 7th warehouse under construction (0.3m sq ft).4. Share Purchase Agreement for acquisition of 1 warehouse (0.2m sq ft) executed. Completion of Conditions Precedent delayed.
Growth strategy
Development pipeline
Sponsor assets
3rd party acquisitions
International Tech Park Bangalore
Outlook

13.8
13.8
1.4
1.4
1.8
2.1
1.80.30.2
Dec-20 Growth pipeline
Floor area
(million square feet)
Portfolio ITPH redevelopment - Phase I AURUM IT SEZ aVance 5 & 6
aVance A1 & A2 BlueRidge 3 - Phase 1 & 2 Arshiya Panvel Arshiya Khurja
22.8
Growth based on committed pipeline
29
65%

Growth Pipeline
30
aVance Hyderabad aVance Business Hub 2 AURUM IT SEZ BlueRidge 3 Arshiya Panvel Arshiya Khurja
TOTAL
aVance 5 aVance 6 aVance A1 aVance A2 Building 1 Building 2 Phase 1 Phase 2 7th warehouse 1 warehouse
Floor area (mil sq ft)
1.16 0.64 1.05 1.05 0.60 0.80 1.41 0.43 0.33 0.19 7.66
Time of Completion1
1H 20213
Dec 20173
2H 2023
2H2023
OC5
received1H
20212H
20212H
2023
1H2021
Upon completion of
CP5
N.A.
Expected total consideration2
₹13.5b(S$270m)
₹14.0b(S$278m)
₹9.3b(S$186m)
₹9.8b(S$194m)
₹2.1b6
(S$42m)₹1.0b6
(S$19m)₹49.7b
(S$987m)
Amount disbursed2 ₹8.4b(S$168m)
₹0.5b4
(S$10m)₹4.6b
(S$91m)₹3.3b
(S$65m)₹0.5b
(S$11m)- ₹17.3b
(S$344m)
Remaining commitment2
₹5.1b(S$102m)
₹13.5b(S$268m)
₹4.7b(S$95m)
₹6.5b(S$129m)
₹1.6b(S$31m)
₹1.0b(S$19m)
₹32.4b(S$643m)
1. Refers to building completion. For Arshiya Khurja, completion refers to the acquisition of 1 Grade-A warehouse.
2. Based on exchange rate at the time of investment/announcement. 3. In November 2020, consent has been obtained from Indian authorities for a revised investment structure which will allow a-iTrust to acquire aVance 5 and aVance 6 separately.
4. Excludes disbursement of ₹2.0 billion (S$39 million2) towards refinancing of loan taken by PVPL towards acquisition of additional land in aVance Business Hub 2.5. OC refers to occupancy certificate; CP refers to Conditions Precedent.
6. Net consideration after deduction of security deposit.

Appendix
31
Glossary
Trust properties : Total assets.
Derivative financial
instruments
: Includes cross currency swaps (entered to hedge SGD borrowings into INR), interest rate swaps, options and
forward foreign exchange contracts.
DPU : Distribution per unit.
EBITDA : Earnings before interest expense, tax, depreciation & amortisation (excluding gains/losses from foreign
exchange translation and mark-to-market revaluation from settlement of loans).
Effective borrowings : Calculated by adding/(deducting) derivative financial instruments liabilities/(assets) to/from gross borrowings,
including deferred consideration.
Gearing : Ratio of effective borrowings to the value of Trust properties.
ITES : Information Technology Enabled Services.
INR or ₹ : Indian rupees.
SEZ : Special Economic Zone.
SGD or S$ : Singapore dollars.
Super Built-up Area or SBA : Sum of the floor area enclosed within the walls, the area occupied by the walls, and the common areas such
as the lobbies, lift shafts, toilets and staircases of that property, and in respect of which rent is payable.

Balance sheet
32
As at 31 December 2020 INR SGD
Total assets ₹146.65 billion S$2,651 million
Total borrowings ₹45.00 billion S$814 million
Derivative financial instruments (₹1.52 billion) (S$27 million)
Effective borrowings1 ₹43.48 billion S$786 million
Long term receivables ₹19.25 billion S$348 million
Net asset value ₹59.53 per unit S$1.08 per unit
Adjusted net asset value2 ₹76.20 per unit S$1.38 per unit
1. Calculated by adding/(deducting) derivative financial instruments liabilities/(assets) to/from gross borrowings, including deferred consideration.2. Excludes deferred income tax liabilities of ₹19.9 billion (S$359 million) on capital gains due to fair value revaluation of investment properties.

Development: ITPB pipeline
33
Special Economic Zone2
Taj Vivanta
(Hotel)
Park Square
(Mall)
• Construction of Endeavour building (0.7 million sq ft) has been completed in November 2020.
• Remaining development potential of 3.1 million sq ft1.
Future development potential
1. Includes additional development potential due to the widening of the road in front of International Tech Park Bangalore and revised government regulation.2. Red line marks border of SEZ area.
Aviator
(Multi-tenanted building)
International Tech Park Bangalore
Voyager
(Multi-tenanted building)
Anchor
(Multi-tenanted
building)
Endeavour
(Completed)
Victor
(Multi-tenanted
building)
Growth strategy

Property International Tech Park Bangalore
Floor area 0.68m sq ft
Construction status Completed in November 2020. Tenant handover in progress.
Leasing status 100% pre-leased to a leading IT Services company
Development: Endeavour building, Bangalore
34
Growth strategy

Development: ITPH redevelopment
35
Capella
Vega
Orion
MarinerAuriga
MLCP
Atria
Existing Master Plan (1.5m sq ft1) Proposed Master Plan (5.7m sq ft)
Auditorium
1. Excludes the leasable area of Auriga building (0.2m sq ft) which has been demolished.
Key Highlights
Redevelopment to increase the development potential, rejuvenate the existing park, and leverage strong demand
in Hyderabad:
• Net increase of 4.2m sq ft of leasable area
• Development planned in multiple phases over the next 7 to 10 years
• Construction for Phase I has commenced and foundation work is in progress
BLOCK A BLOCK B
BLOCK C
BLOCK D
BLOCK E
Atria
Phase I Phase I
Growth strategy
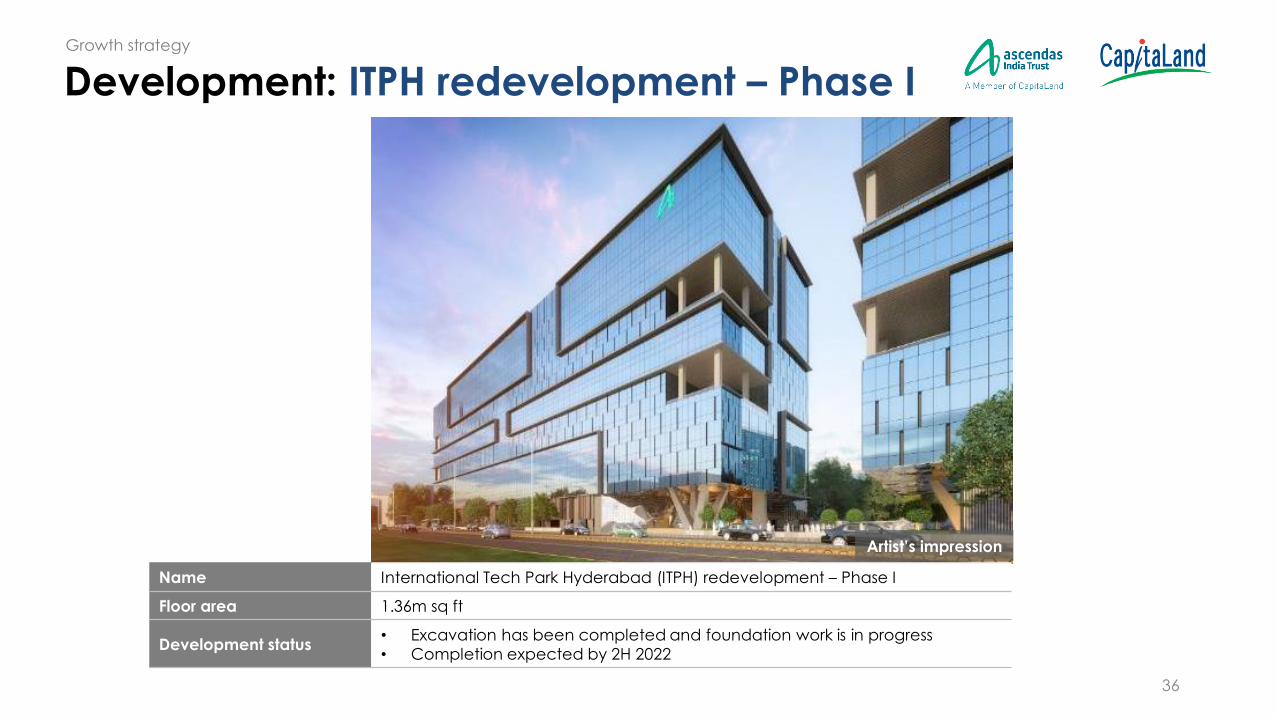
Name International Tech Park Hyderabad (ITPH) redevelopment – Phase I
Floor area 1.36m sq ft
Development status• Excavation has been completed and foundation work is in progress
• Completion expected by 2H 2022
Artist’s impression
Development: ITPH redevelopment – Phase I
36
Growth strategy

Sponsor: Assets in India
37
International Tech Park, Pune
• All 4 phases of construction comprising 2.3 million sq ft is completed and fully leased.
Sponsor presence1
Gurgaon
Chennai
Private fund managed by sponsor
• Ascendas India Growth Programme
• Ascendas India Logistics Programme
Pune
1. Excludes a-iTrust properties.
Growth strategy
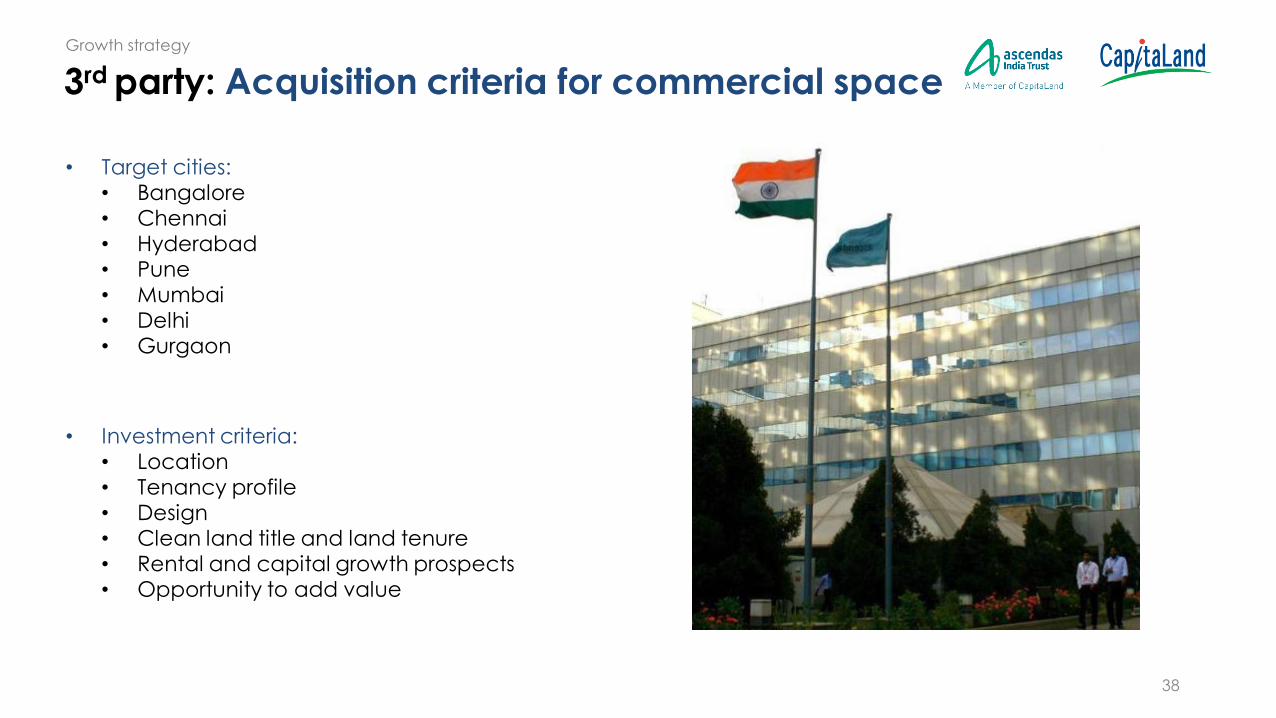
3rd party: Acquisition criteria for commercial space
38
• Target cities:• Bangalore• Chennai• Hyderabad• Pune • Mumbai• Delhi• Gurgaon
• Investment criteria:• Location• Tenancy profile• Design• Clean land title and land tenure • Rental and capital growth prospects • Opportunity to add value
Growth strategy
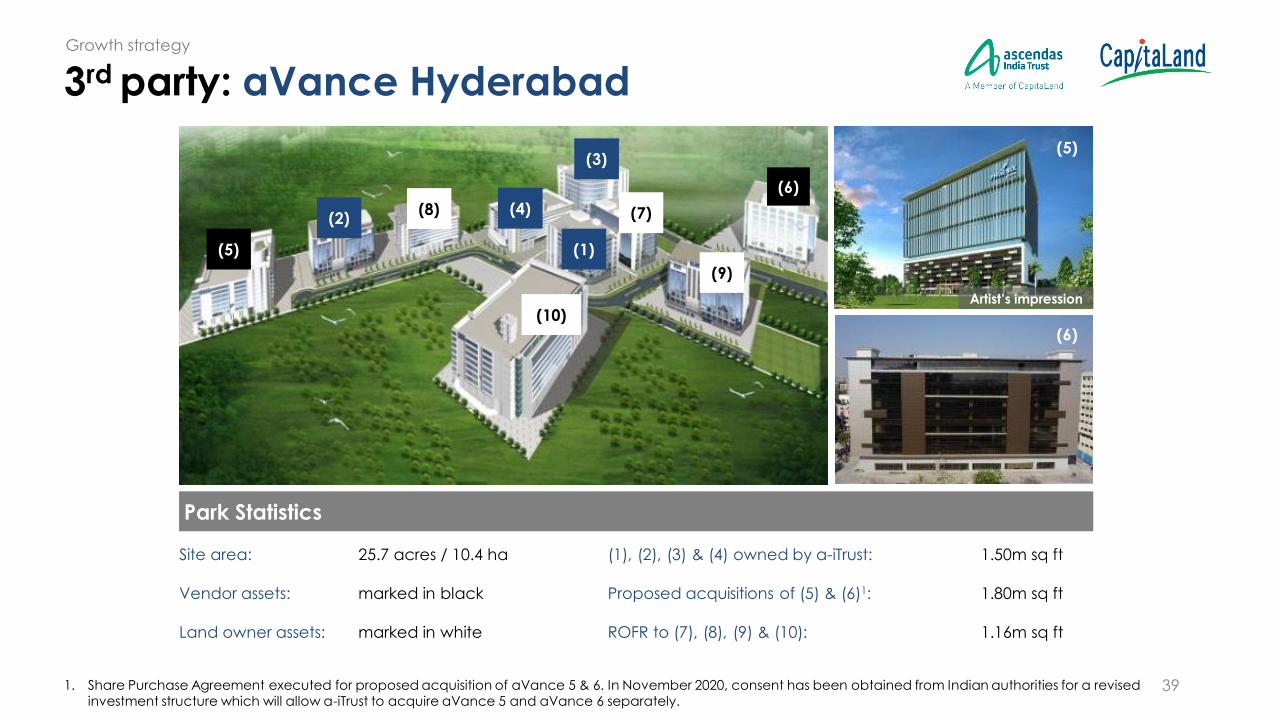
3rd party: aVance Hyderabad
39
Park Statistics
(5)
(6)
(5)
(2)
(1)
(4)
(3)
(8)
(10)
(9)
(7)
Site area: 25.7 acres / 10.4 ha (1), (2), (3) & (4) owned by a-iTrust: 1.50m sq ft
Vendor assets: marked in black Proposed acquisitions of (5) & (6)1: 1.80m sq ft
Land owner assets: marked in white ROFR to (7), (8), (9) & (10): 1.16m sq ft
(6)
1. Share Purchase Agreement executed for proposed acquisition of aVance 5 & 6. In November 2020, consent has been obtained from Indian authorities for a revised investment structure which will allow a-iTrust to acquire aVance 5 and aVance 6 separately.
Artist’s impression
Growth strategy

3rd party: aVance Business Hub 2, Hyderabad
40
Park Statistics
Site area: 14.4 acres / 5.8 haProposed acquisition of
(A1) to (A5)1: 4.53m sq ft
Vendor assets: marked in blackConstruction status: Excavation work commenced
for the project
Land owner assets: marked in white
aVanceHyderabad
1. Master Agreement executed for proposed acquisition of Vendor assets. The total leasable area has been reduced from 5.20m sq ft to 4.53m sq ft due to changes in the Master Plan.
(6)(7) (A1)
(A2) (A3) (A4) (A5)
Artist’s impression
Artist’s impression
Growth strategy

3rd party: AURUM IT SEZ, Navi Mumbai
41
Location Ghansoli, Navi Mumbai
Floor area• Building 1: 0.6m sq ft; Building 2: 0.8m sq ft
• Right of First Refusal on Building 3: up to 1.1m sq ft
Expected completion • Building 1 - Occupancy Certificate received; Building 2 - 1H 2021
Leasing status • Building 1: ~55% pre-committed
Acquisition of
Building 1 & 2Upon completion of each building, and within a period of up to 2 years post completion
Artist’s impression
(3) (2)
(1)
Growth strategy

3rd party: BlueRidge 3, Pune
42
Location Hinjawadi Phase 1, Pune
Floor area Phase 1: 1.4m sq ft; Phase 2: 0.4m sq ft
Expected completion Phase 1: 2H 2021; Phase 2: 2H 2023
Leasing Status Phase 1: 11% pre-committed for long-term space
Construction status
• Construction work in progress for IT Building 1 - Construction of Office
floors 4 to 8 are in progress
• Incubation area in IT Building 1 completed and Occupancy Certificate
has been obtained
Growth strategy
Artist’s impression

Logistics: Arshiya Panvel warehouses, Mumbai
43
Location Panvel, near Mumbai
Site area 24.5 acres / 9.9 ha
Floor area 0.8m sq ft
Forward purchase At least 2.8m sq ft (includes 0.3m sq ft warehouse under construction)
Growth strategy

44
Logistics: Arshiya Khurja warehouse, NCR
Location Khurja, NCR
Site area 4.5 acres / 1.8 ha
Floor area 0.19m sq ft1
Right to acquire 3.85m sq ft
1. Acquisition of the warehouse subject to completion of certain Conditions Precedent as specified in the Share Purchase Agreement.
Growth strategy

World-class IT and logistics parks
45
1. Includes land not held by a-iTrust.2. Only includes floor area owned by a-iTrust. 3. Includes additional development potential due to the widening of the road in front of International Tech Park Bangalore and revised government regulation.4. Includes buildings under construction and additional development potential due to revised building height approvals.
City Bangalore Chennai Hyderabad Pune Mumbai
Property
• Intl Tech Park Bangalore
• Intl Tech Park Chennai
• CyberVale
• Intl Tech Park Hyderabad
• CyberPearl• aVance Hyderabad
• aVance Pune • Arshiya Panvelwarehouses
Type IT Park IT Park IT Park IT Park Warehouse
Site area68.3 acres 33.2 acres 51.2 acres1 5.4 acres 24.5 acres
27.6 ha 13.5 ha 20.5 ha1 2.2 ha 9.9 ha
Completed floor area
5.2m sq ft2 2.8m sq ft 3.4m sq ft2 1.5m sq ft 0.8m sq ft
Number of buildings
12 6 11 3 6
Park population 48,700 36,800 31,500 13,800 -
Land bank(development potential)
3.1m sq ft3 0.4m sq ft 4.2m sq ft4 - -

Lease expiry profile by monthly base rent
46
City FY2021 FY2022 FY2023 FY2024FY2025
& beyondTotal
Bangalore 10.8% 5.4% 1.6% 5.9% 10.4% 34.1%
Chennai 4.8% 6.8% 4.8% 2.3% 7.8% 26.5%
Hyderabad 7.4% 6.3% 3.9% 1.5% 2.6% 21.7%
Pune 0.0% 0.4% 0.4% 0.2% 9.5% 10.5%
Mumbai 0.0% 0.0% 0.0% 7.2% 0.0% 7.2%
Total 23.0% 18.9% 10.8% 17.1% 30.2% 100.0%

121.3 124.4129.9
119.8127.3
141.1148.4
183.0 184.0
197.6191.7
S$ million
4,078
4,658
5,550 5,584
6,1246,579
7,220
8,626
9,336
10,18810,250
INR million
Revenue growth trends
47
Total Property Income (INR) Total Property Income (SGD)10%
CAGR 5%
CAGR
0
25
50
75
100
125
150
175
IPO
De
c 0
7
Jun
08
De
c 0
8
Jun
09
De
c 0
9
Jun
10
De
c 1
0
Jun
11
De
c 1
1
Jun
12
De
c 1
2
Jun
13
De
c 1
3
Jun
14
De
c 1
4
Jun
15
De
c 1
5
Jun
16
De
c 1
6
Jun
17
De
c 1
7
Jun
18
De
c 1
8
Jun
19
De
c 1
9
Jun
20
De
c 2
0
a-iTrust
FTSE STI Index
FTSE ST REIT Index
Bombay SE Realty Index
INR/SGD FX rate
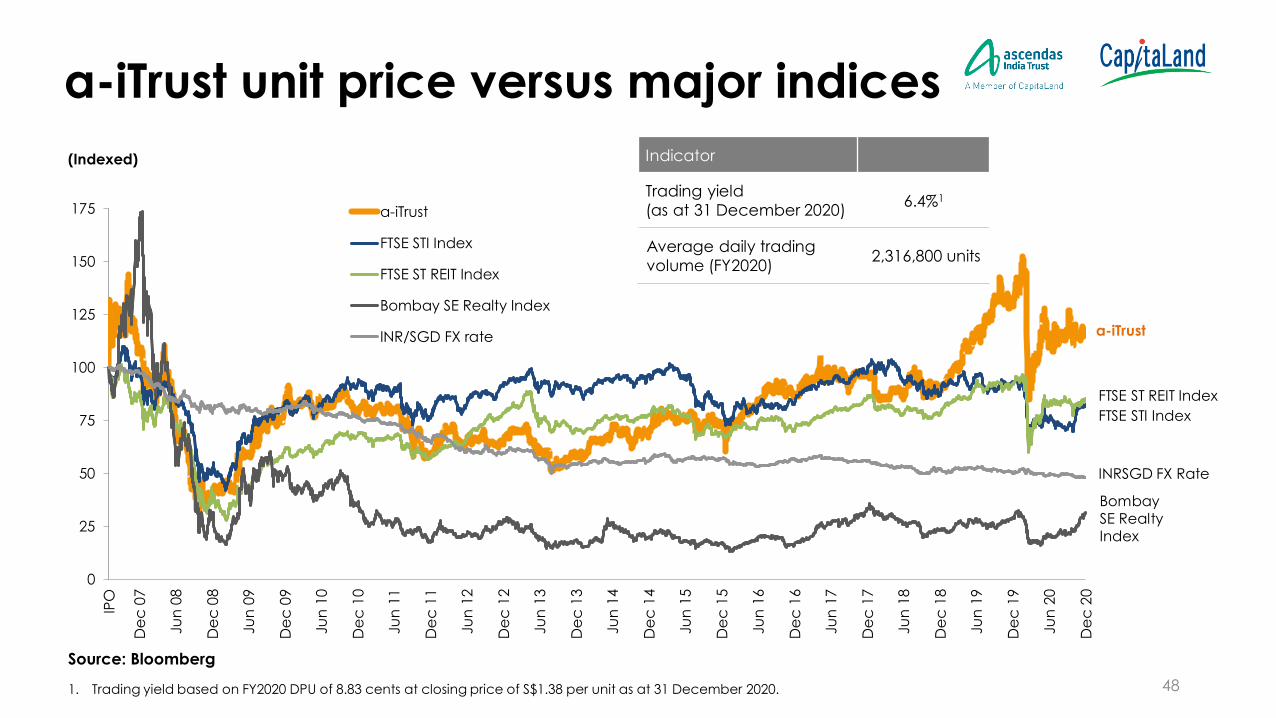
a-iTrust unit price versus major indices
48
Source: Bloomberg
(Indexed)
a-iTrust
FTSE STI Index
FTSE ST REIT Index
INRSGD FX Rate
Bombay SE Realty Index
1. Trading yield based on FY2020 DPU of 8.83 cents at closing price of S$1.38 per unit as at 31 December 2020.
Indicator
Trading yield
(as at 31 December 2020)6.4%1
Average daily trading
volume (FY2020)2,316,800 units
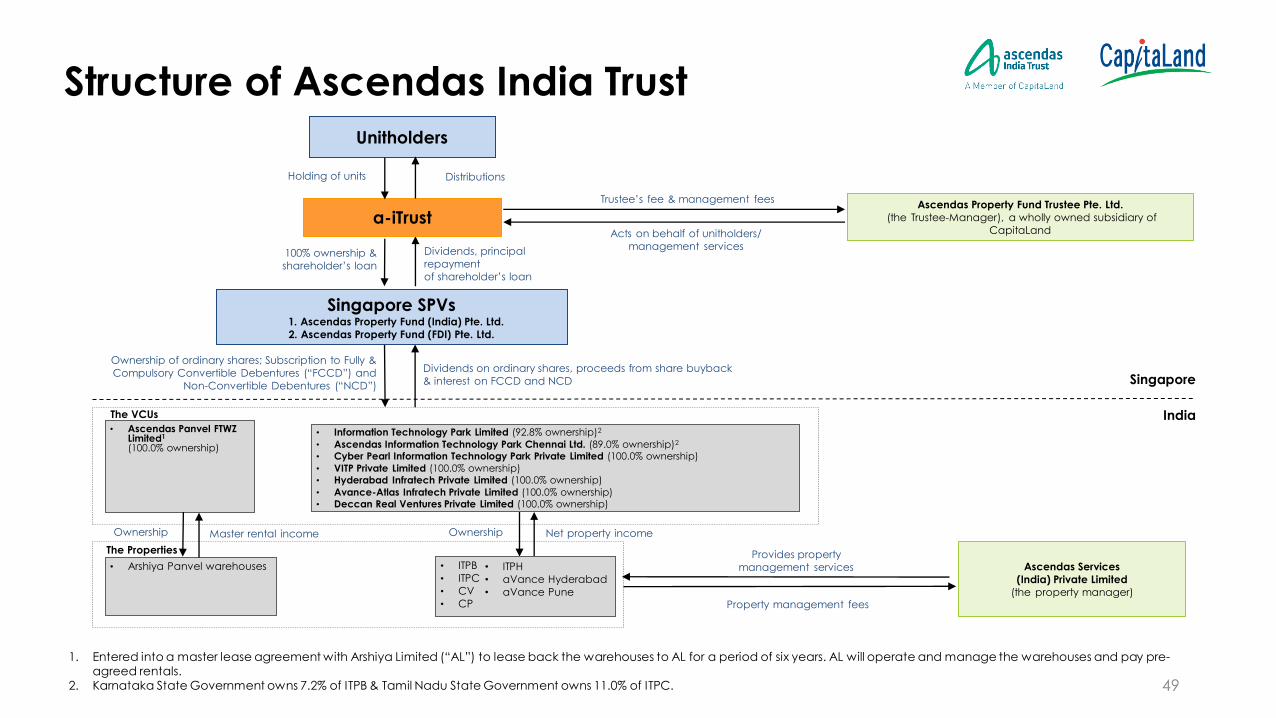
Structure of Ascendas India Trust
49
• Information Technology Park Limited (92.8% ownership)2
• Ascendas Information Technology Park Chennai Ltd. (89.0% ownership)2
• Cyber Pearl Information Technology Park Private Limited (100.0% ownership)
• VITP Private Limited (100.0% ownership)• Hyderabad Infratech Private Limited (100.0% ownership)
• Avance-Atlas Infratech Private Limited (100.0% ownership)• Deccan Real Ventures Private Limited (100.0% ownership)
Unitholders
a-iTrustAscendas Property Fund Trustee Pte. Ltd.
(the Trustee-Manager), a wholly owned subsidiary of
CapitaLand
Singapore SPVs1. Ascendas Property Fund (India) Pte. Ltd.
2. Ascendas Property Fund (FDI) Pte. Ltd.
Ascendas Services
(India) Private Limited
(the property manager)
Holding of units Distributions
Trustee’s fee & management fees
Acts on behalf of unitholders/
management services100% ownership &
shareholder’s loan
Dividends, principal
repayment
of shareholder’s loan
Ownership of ordinary shares; Subscription to Fully &
Compulsory Convertible Debentures (“FCCD”) and
Non-Convertible Debentures (“NCD”)
Dividends on ordinary shares, proceeds from share buyback
& interest on FCCD and NCD
• ITPB
• ITPC
• CV
• CP Property management fees
Provides property
management services
Ownership Net property income
Singapore
India
1. Entered into a master lease agreement with Arshiya Limited (“AL”) to lease back the warehouses to AL for a period of six years. AL will operate and manage the warehouses and pay pre-agreed rentals.
2. Karnataka State Government owns 7.2% of ITPB & Tamil Nadu State Government owns 11.0% of ITPC.
• Ascendas Panvel FTWZLimited1
(100.0% ownership)
The VCUs
The Properties
• Arshiya Panvel warehouses
Ownership Master rental income
• ITPH
• aVance Hyderabad
• aVance Pune

Investor contact
Tan Choon Siang
Chief Financial Officer
Ascendas Property Fund Trustee Pte Ltd
(Trustee-Manager of a-iTrust)
Office: +65 6774 1033
Email: [email protected]
Website: www.a-iTrust.com