ASCE Pipelines 2016 Conference Energy Efficiency...
12
1 ASCE Pipelines 2016 Conference Kansas City, Kansas July 17-20, 2016 Energy Efficiency through Material Selection Derek B. Scott 1 and Maury D. Gaston 2 1 BSME; A.M. ASCE; M. AWWA; M. AWWA C509, C500, C508, C502, Vice-Chair C515; A.M. ASME; Marketing and Technical Manager, AMERICAN Flow Control, A Division of AMERICAN Cast Iron Pipe Company, P.O. Box 2727, Birmingham, Alabama 35202; 205-325- 7863; [email protected]. 2 BSME; M. ASCE; M. AWWA; M. AWWA A21, Chair Sub-committee 1. Manager of Marketing Services, AMERICAN SpiralWeld and AMERICAN Ductile iron Pipe, Divisions of AMERICAN Cast Iron Pipe Company, P.O. Box 2727, Birmingham, Alabama 35202; 205-325-7803; [email protected] Abstract Electricity to pump water through a system is often the utility’s second-highest cost, behind only salaries and wages. Numerous factors affect the cost and amount of electric power required to operate a utility system. Those factors include the volume of water delivered, the efficiency of the pumps, the cost of electricity, the friction associated with the pipe wall, head loss through valves and around fittings, the diameter of the pipe, and other factors. This paper will show users how to calculate the cost to operate a particular system constructed of particular materials while operating at a certain level, and then compare that model to an identical system comprised of different pipe materials and different types of isolation valves. Introduction The United States Department of Energy (DOE) published in its report The Water-Energy Nexus: Challenges and Opportunities, the impact on energy consumption relative to water and wastewater. Although specific data may be limited, the DOE suggests the energy required for water production and distribution consumes 3.0 to 3.5 percent of the total electricity used in the United States. (DOE, 2014) Likewise, the report also estimates the treatment of municipal wastewater consumes in excess of 1 percent of the energy produced. (DOE, 2014) In other words, the general public can reasonably assume more than 5 percent of the electricity used in the United States is associated with water and wastewater. Critical to the well-being of mankind, no option should remain unexamined to responsibly steward that consumption. In water system design, one of the most overlooked pieces of the energy consumption equation is valve and pipe selection. Valves as general isolation devices are considered as part of system hydraulics, but are seldom evaluated with respect to energy consumption. Pipe is often evaluated with respect to only nominal diameter while the different actual diameters between different materials of the same nominal diameter are most often overlooked. Seemingly small differences in pipe inside diameter can yield significant long-term savings of power and money.
Transcript of ASCE Pipelines 2016 Conference Energy Efficiency...
1
ASCE Pipelines 2016 Conference Kansas City, Kansas
July 17-20, 2016
Energy Efficiency through Material Selection
Derek B. Scott 1 and Maury D. Gaston 2
1 BSME; A.M. ASCE; M. AWWA; M. AWWA C509, C500, C508, C502, Vice-Chair C515; A.M.
ASME; Marketing and Technical Manager, AMERICAN Flow Control, A Division of AMERICAN Cast Iron Pipe Company, P.O. Box 2727, Birmingham, Alabama 35202; 205-325-7863; [email protected]. 2 BSME; M. ASCE; M. AWWA; M. AWWA A21, Chair Sub-committee 1. Manager of Marketing Services, AMERICAN SpiralWeld and AMERICAN Ductile iron Pipe, Divisions of AMERICAN Cast Iron Pipe Company, P.O. Box 2727, Birmingham, Alabama 35202; 205-325-7803; [email protected]
Abstract Electricity to pump water through a system is often the utility’s second-highest cost, behind only salaries and wages. Numerous factors affect the cost and amount of electric power required to operate a utility system. Those factors include the volume of water delivered, the efficiency of the pumps, the cost of electricity, the friction associated with the pipe wall, head loss through valves and around fittings, the diameter of the pipe, and other factors. This paper will show users how to calculate the cost to operate a particular system constructed of particular materials while operating at a certain level, and then compare that model to an identical system comprised of different pipe materials and different types of isolation valves. Introduction The United States Department of Energy (DOE) published in its report The Water-Energy Nexus: Challenges and Opportunities, the impact on energy consumption relative to water and wastewater. Although specific data may be limited, the DOE suggests the energy required for water production and distribution consumes 3.0 to 3.5 percent of the total electricity used in the United States. (DOE, 2014) Likewise, the report also estimates the treatment of municipal wastewater consumes in excess of 1 percent of the energy produced. (DOE, 2014) In other words, the general public can reasonably assume more than 5 percent of the electricity used in the United States is associated with water and wastewater. Critical to the well-being of mankind, no option should remain unexamined to responsibly steward that consumption. In water system design, one of the most overlooked pieces of the energy consumption equation is valve and pipe selection. Valves as general isolation devices are considered as part of system hydraulics, but are seldom evaluated with respect to energy consumption. Pipe is often evaluated with respect to only nominal diameter while the different actual diameters between different materials of the same nominal diameter are most often overlooked. Seemingly small differences in pipe inside diameter can yield significant long-term savings of power and money.

2
In our personal lives, we research the operating costs associated with the materials we buy. As a result, we see annual cost-of-energy stickers on water heaters, air conditioners, and virtually every household appliance. For many years, our new cars have had fuel efficiency stickers on their windows. Consumers often willingly seek out and pay more to purchase an energy efficient product. The benefits are even greater if that product lasts longer and costs less to maintain as well as operate. We must examine and evaluate the pipeline materials we specify just as carefully. Our ubiquitous electronic devices consume energy 24/7 whether they are being used or are presumably idle. This is known as “vampire loading.” As the name implies, the device quietly drains energy and money from the owner. The same can and often does occur with water and wastewater utility systems, quietly operating but consuming far more electricity than necessary day after day and year after year, some of which would be preventable if a more careful analysis of material specification had occurred early on. In their 2012 State of the [Water] Industry report, Black and Veatch reports that “Energy accounts for as much as 30% of utility budgets and more than 85% of water utility greenhouse gas emissions.” (Black & Veatch, 2012) This commentary will drill down to the significant energy savings that can be realized when some of the details related to valve and pipe specifications are more carefully considered, contrasted, and compared. The context will be water, but the same benefits apply to wastewater projects. Valve Selection Proper valve selection will depend on whether the application demands a full open and close, or a partial open and close function known as throttling, or modulating. Far and away the vast majority of valve applications are for simple isolation, therefore requiring a full open and close function. Often these types of valves are referred to a multi-turn valves. Gate valves are an ideal example of the most basic type of valve used for isolation. Because of the simplicity and efficiency of the gate valve design, it has for many years been the gold standard for valve applications in the utility industry. Although throttling valves can also be used for isolation, their effectiveness and in most cases their long-term viability must be carefully evaluated. Most throttling valves are of the quarter-turn style design. A quarter-turn style simply means the seating mechanism is always in the waterway and is operated by a 90-degree turn of the seat. Examples of the most common types of quarter-turn valves are butterfly and plug valves. Because of what can be considered as a tenuous nature of the butterfly valve, as well as the inability to allow for cleaning or pigging of an existing line, they are almost exclusively reserved for quarter-turn treated water applications. Conversely, plug valves are typically used for quarter-turn raw wastewater applications.
Figure 1. Typical resilient wedge gate valve with full unobstructed waterway.

3
Looking closer at the design geometries of the quarter-turn valve will no doubt leave the designer with the impression that the inherent characteristics of the design will have a negative impact on flow, since the seating/throttling mechanism remains in the waterway 100 percent of the time. For example, in the case of the butterfly valve, the seat resides in the very center of the flow path effectively splitting the pipeline flow into two distinct paths. This restriction is further compounded by the amount of closure. Whereas in the case of the gate valve, the seating mechanism is completely removed from the waterway when in the open position. Today’s resilient wedge technology also typically provides for a smooth, clean waterway.
Pipe Selection - Diameter Various pipe materials have various characteristics. Inside diameter and Hazen-Williams coefficients of friction are two of particular interest here. Why do nominally same-sized pipe of different materials have different inside diameters? Aren’t two 24-inch (600 mm) pipes of different materials both 24 inches (600 mm)? No, and here’s why: The first national standard for water pipe was developed by the New England Water Works Association in 1926, and it dealt with gray iron pipe, also known as cast iron. (American Water Works Association, 2009) Using 24-inch (600 mm) in this example, the internal diameter was sized at 24 inches (600 mm), and wall thicknesses were calculated using the physical and metallurgical properties of gray iron. This resulted in a 25.80-inch (655.32 mm) outside diameter. The use of iron pipe became so widespread that the outside diameters of iron pipe were adopted as industry standards. Fittings, valves, hydrants, and other pipe joints were sized and designed to mate with iron pipe outside diameters. With the advent of ductile iron in the 1950s and its resultant
stronger and more robust metallurgical and physical properties, the wall could be reduced and the pipe would perform better than gray iron. For the reasons noted above, the outside diameter was held constant and the wall thickness was taken from the inside, resulting in an inside diameter exceeding the nominal diameter. Later, other materials such as asbestos cement, PVC, and HDPE came to market. Those pipe materials’ outside diameters were sized to match the industry O.D. standard originating from iron pipe. (American Water Works Association, 2009) The physical properties of materials such as asbestos cement, PVC, and HDPE are less than gray iron, so the corresponding wall thicknesses were greater than gray iron, resulting in an inside
Figure 2. Typical butterfly valve design with seating mechanism in the center of the waterway.
Figure 3. A 24-inch (600 mm) diameter cement lined ductile iron transmission line being installed.

4
diameter less than the nominal pipe size. Since it all started with an inside diameter equal to nominal and gray iron as a material, any material with physical properties less than gray iron will have a less-than-nominal inside diameter. Similarly, any material with physical properties exceeding gray iron (such as ductile iron), will have a greater-than-nominal inside diameter. Simply stated, since all standard pipe have the same O.D., stronger pipe materials allow larger inside diameters. In the case of the 24-inch (600 mm) example, a class 200 cement lined ductile iron pipe has an inside diameter of 24.95 inches (633.73 mm), and a DR 18 PVC pipe has an inside diameter of 22.76 inches (578.10 mm). In the case of PCCP pipe, governed by AWWA C301, the inside diameter is typically equal to nominal and steel joint rings mate with whatever connection is present, often a flange. Steel pipe, governed by AWWA C200 and sometimes used in the largest diameters, also generally carries the nominal as the inside diameter and its bells, spigots, and flanges are sized as necessary. Table 1 below shows a comparison of inside diameters of various pipe materials.
Nominal Size (inches)
Ductile Iron (1)
PVC (2)
Asbestos
Cement (3)
PCCP (4)
Steel (5)
HDPE (6)
6 6.28 6.09 5.85 - 5.57
8 8.43 7.98 7.85 - 7.31 10 10.46 9.79 10.00 - 8.96
12 12.52 11.65 12.00 - 10.66
14 14.55 13.50 14.00 - 12.35
16 16.61 15.35 16.00 14.05
18 18.69 17.20 - 18.00 15.74
20 20.75 19.06 - 20.00 17.44
24 24.95 22.76 - 24.00 24.00 20.83
30 31.07 28.77 - 30.00 30.00 25.83
36 37.29 34.43 - 36.00 36.00 32.29
42 43.43 40.73 - 42.00 42.00 38.41
48 49.63 46.49 - 48.00 48.00 44.47 (1) From AWWA C150, Table 5. Lowest pressure class with C104 cement mortar lining. (2) Iron o.d., AWWA C900 and C905. DR 18 for 6”-24”, DR 21 for 30”-36”, and DR 25 for 42”-48”. (3) From AWWA C400-93. (4) From AWWA C301. (5) From manufacturers’ information. (6) From AWWA C906. DR 11 for 6”-30”, DR 13.5 for 36”, DR 15.5 for 42”, and DR 17 for 48”.
Figure 4 shows the percentage difference in cross sectional area of ductile iron pipe compared to PVC pipe, based on the inside diameters noted above.
Table 1. Actual inside diameters of various distribution and transmission main pipe materials. (American Water Works Association, 2009)

5
Pipe Selection – Lining To complete the review of pipe characteristics, let’s consider the inside surface. Cement lining was developed by AMERICAN Cast Iron Pipe in 1922 and first supplied as an in situ process with Charleston Public Works in Charleston, South Carolina. (Miller, 1965) It was developed in response to tuberculation, a form of internal corrosion in which minerals in the water stick to the exposed bare iron and tubercles form from the iron. Innovators at AMERICAN discovered that tuberculation would not occur if the pipe were lined with a cement mortar surface. Cement lining of iron pipe was so successful so quickly that it soon became the norm, and a Standard was developed. In 1929, the American Standards Association issued a tentative standard for cement mortar linings. (American Water Works Association, 2013) That standard is today known as AWWA C104, Cement-Mortar Lining for Ductile Iron Pipe and Fittings. The C Factor, or Hazen-Williams coefficient of friction, associated with cement mortar linings is 140. The long-term consistency of 140 has been challenged from time to time, but in situ flow tests have repeatedly confirmed the value. (Ductile Iron Pipe Research Association, 2012) A number of studies confirming this have been published down through the years in Journal AWWA and other publications. Table 2 below shows in-service flow tests of several new and older cement mortar lined iron pipelines.
Figure 4. Percentage differences in cross-sectional area between ductile iron pipe and PVC pipe.

6
Location
Diameter (Nominal inches)
Length (ft)
Age (Years)
Hazen-Williams C Factor
Corder, Missouri 8 21,400 1 145 Bowling Green, Ohio 20 45,600 1 143
Chicago, Illinois 36 7,200 12 151 Safford, Arizona 10 23,200 16 144 Tempe, Arizona 6 1,235 24 144
Seattle, Washington 8 2,686 29 139 Concord, New Hampshire 12 500 36 140
The Hazen-Williams coefficient of friction for PVC pipe is generally agreed to be 150 and is generally agreed to remain constant as well. The higher the C factor, the less friction between the fluid and the surface. To be clear, these energy comparisons credit a more advantageous friction value for PVC pipe as compared to iron pipe, but we will see from the pumping cost calculations that the larger inside diameter of iron pipe more than offsets the lower friction value of PVC pipe. Figure 5 shows the smooth surface of cement lining in iron pipe.
Pumping Costs - Valves An evaluation of the pumping costs through these types of valves can be determined by:
e
QHRTCost
5309= (1)
Where: Q = Flow Rate, GPM (cubic meters/sec) H = Head Loss, feet of water (meters) R = Electricity Rate, Assumption $0.10 per KW T = Yearly Pumping Time, Assumption 8760 hours e = Pump Efficiency, Assumption 0.70 Head loss is found to occur as the fluid travels through a given valve. This change results in a reduction of the fluid’s static pressure, which according to Bernoulli’s Principle varies proportionately with the square of the fluid velocity. The resulting head loss can be determined
Table 2. Flow Tests of In-Service Cement Mortar Lined Iron Pipe.
Figure 5. The surface of cement mortar lined ductile iron.

7
by applying a dimensionless resistance coefficient, k, to the velocity head. To determine the head loss, H, through the valve, the following energy equation can be used (Crane, 2013):
g
kVH
2
2
= (2)
Where: k = Resistance Coefficient (dimensionless) V = Velocity in fps (meters/sec)
g = Acceleration due to gravity, 32.2 ft/sec2 (9.81 meters/sec2 ) For comparative purposes, the velocities used in this paper are slightly greater than 4 fps. Higher velocities will result in greater losses and therefore greater pumping costs through any valve. The velocity of the fluid, V in Equation (2), can be determined by applying the flow of the pipeline in the following equation:
( )
2
4085.0
d
QV = (3)
Where: Q = Flow Rate, GPM (cubic meters/sec) d = Valve Diameter in inches (meters) Using these equations allows the designer to determine the significant differences in head loss, H, and therefore the respective pumping costs attributed to each valve type. By using generally accepted values for the resistance coefficient k, expressed in Equation 2, a representative comparison of the performance between gate valves and butterfly valves results in the pumping costs shown in Table 3. This coefficient can be considered as a unique multiplier of the energy lost due to the inherent inefficiencies of the valve type. Different valve types will have different design characteristics that are directly related to specific levels of resistance and therefore performance relative to pumping cost. In other words, the more obstructive to flow that the valve is as compared to its normally uninterrupted flow, the higher the resistance coefficient. As a rule of thumb, and certainly depending on valve size, the flow coefficient for a butterfly valve can be in the order of 10 times greater than the flow coefficient for a gate valve. In like manner, one can therefore assume the head loss and the pumping costs through a fully open butterfly valve can be approximately 10 times greater than the costs associated with a fully open gate valve. A comparison of pumping costs between gate and butterfly valves is shown in Table 3. To be fair, the initial cost of a gate valve is typically more. However, when the designer considers energy consumption, the difference in initial costs can narrow significantly, leaving other factors such as maintenance and durability, which are outside the purview of this analysis, to enter the equation.

8
Table 3. Comparison of Resilient Wedge Gate Valve and Butterfly Valve Flow Coefficients, Head Loss, and Pumping Costs.
Valve Size (in)
Gate Valve, k
Butterfly Valve, k
Flow, Q (MGD)
Gate Valve, Head Loss,
H (ft.)
Butterfly Valve, Head Loss, H (ft.)
Gate Valve
Annual Pumping Cost ($)
Butterfly Valve Annual
Pumping Cost ($)
20 0.05 0.45 6.3 0.0155 0.1395 15.98 143.85
24 0.05 0.43 8.8 0.0146 0.1254 21.01 180.67
30 0.05 0.43 13.5 0.0141 0.1209 31.07 267.17
36 0.04 0.40 20.0 0.0119 0.1190 38.97 389.71
Pumping Costs - Pipe Pumping costs through a pipeline are a function of power cost, pump efficiency, and head loss as reflected in the following equation:
Pumping Cost = 1.65 HL * Q * (a / E) (4) Where: HL = head loss in feet per thousand feet of pipeline
Q = flow rate in gallons per minute a = power cost in dollars per kilowatt hour E = efficiency of pump system as a fraction of 1
Head Loss in feet per thousand feet of pipeline is determined by:
�� = 1,000 � .�� ����.���1.852 (5)
Where: V = velocity in feet per second C = flow coefficient (C factor) d = actual internal diameter in inches
Using velocity to determine flow rate,
Q = V * 2.448 * d2 (6) Where: V = velocity in feet per second
d = actual pipeline inside diameter in inches A Practical Model Modeled pump efficiencies, electricity costs, and other values in the equations will be the same irrespective of the pipe materials. Power costs vary across the country. Figure 6 shows commercial electric power costs by state as reported by the U.S. Energy Information Administration. (U.S. Energy Information Administration, 2015) Factors related to power costs are regulatory requirements, the cost of fuel to generate the power, etc. A reasonable power cost for an analysis of this nature is $0.10 per kilowatt - hour, ten cents per kW-h.

9
Pump efficiencies vary depending on manufacturer, condition, age, and other factors. A reasonable pump efficiency is 70 percent, and since the same efficiency is used across the board, it’s a uniform variable, just as power cost. Finally, a reasonable modeling velocity is 4 feet per second. In a 24-inch (600 mm) pressure class 200 ductile iron line, that’s 6,095 gallons per minute (0.385 m³/sec) , or roughly 8.8 MGD (33,311 m³/day). (ICENTA, 2016) For our model, we will use a 30,000-foot (914.4 mm), 24-inch (600 mm), cement-lined, class 200 ductile iron pipe with a 24.94-inch (633.48 mm) inside diameter and having 5 resilient wedge gate valves with a Resistance Coefficient of 0.05. A comparison will be made against the same footage of PVC DR 18 pipe with an inside diameter of 22.76-inches (578.10 mm) and a C Factor of 150 and five (5) butterfly valves, employing a Resistance Coefficient of 0.43. Employing the aforementioned power cost of $0.10/kW-h, 6,095 GPM (0.385 m³/sec), and the appropriate coefficients, yields the annual valve pumping costs as shown in Table 4. Table 4 - Comparison of Resilient Wedge Gate Valve and Butterfly Valve Flow Coefficients, Head Loss, and Pumping Costs.
Valve Size (in)
Valve Type
Qty
Flow, Q (GPM)
Resistance Coefficient,
k
Head Loss, H (ft.)
Per Each Annual
Pumping Cost ($)
Total Annual
Pumping Cost ($)
24 Gate 5 6095 0.05 0.0146 21.01 105.04
24 Butterfly 5 6095 0.43 0.1254 180.67 903.33 Annual Savings for Five Gate Valves $798.29
Figure 6. Commercial electric power costs by state.

10
Using the same power cost of $0.10 per kW-h, pump efficiency of 70 percent, and velocity of 4 fps, and applying these equations to 30,000 feet (9,144 m) of 24-inch (600 mm) diameter pipe, the annual pumping cost through the pipe is $76,639. If that same line were made of DR18 PVC with its smaller inside diameter, and even considering its slightly smoother surface, the annual pumping cost would be $105,085. As shown in Table 5, the annual savings for this relatively short line and considering only the pipe is $28,446. Table 5. Annual Pumping Costs for 30,000 Feet of Ductile Iron and for PVC
Comparison of 24-inch Ductile Iron and PVC Pumping Costs
Size Pipe
Material. Length (feet)
GPM
Pipe I.D.
C Factor
Velocity (fps)
Head Loss
Pump Hrs/Day
$ / KWH
Annual Cost
24
Ductile Iron
30,000
6096
24.95
140
4.0
53.3
24
$0.10
$76,639
24
PVC
30,000
6096
22.76
150
4.8
73.2
24
$0.10
$105,085
Ductile Iron Annual Savings $28,446
The difference in pumping cost through resilient wedge gate valves compared to butterfly valves is $159.66 per valve, or $798.29 per year for five valves. Combining the energy savings available from the selection of resilient wedge gate valves and ductile iron pipe as compared to butterfly valves and PVC pipe, an annual savings of $29,139 is realized for this 30,000 foot (9,144 m) - five-valve model. A summary is shown in Table 6. That’s every year for the life of the line. This does not take into account savings from lower maintenance costs, or the likely longer life of the iron line, or the likely savings from not having to remove a butterfly valve for maintenance, and a host of other benefits associated with that specification. This commentary deals with energy, so we will limit our benefits to that arena. Table 6 - Summary of Alternative Annual Energy Costs.
Annual Energy Costs 30,000 Feet of 24-inch Pipe with Five (5) Valves
Ductile Iron Pipe
RW Gate Valves
PVC Pipe
Butterfly Valves
$76,639 $105 $105,085 $798 Total $76,744 $105,883
Annual Savings $29,139
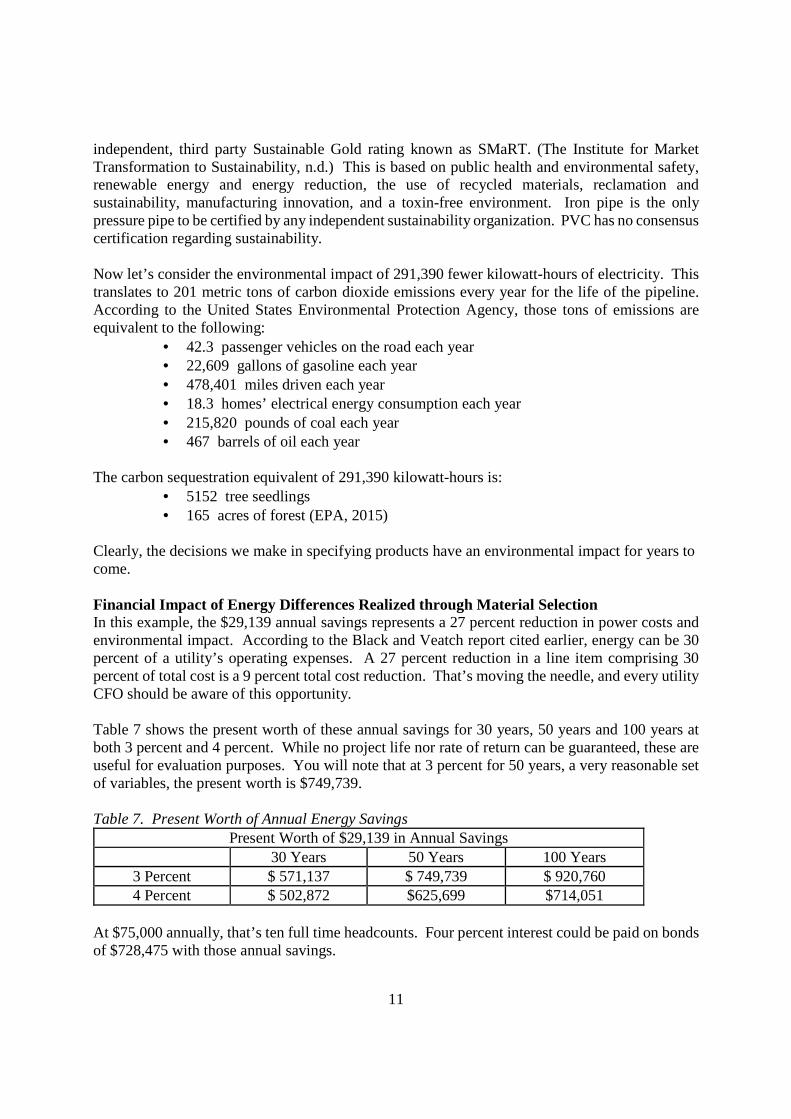
Environmental Impact of Energy Differences Realized through Material Selection The operational differences in cost and power have both financial and environmental impact. This comparative model has a financial savings of $29,139 each year and an energy impact of 291,440 fewer kilowatt-hours each year. Let’s look first at the environmental impact. Before considering operational benefits, note that iron pipe is made of recycled ferrous products, a critical dimension in the sustainability equation. The Institute for Market Transformation to Sustainability has recognized ductile iron pipe with its
11
independent, third party Sustainable Gold rating known as SMaRT. (The Institute for Market Transformation to Sustainability, n.d.) This is based on public health and environmental safety, renewable energy and energy reduction, the use of recycled materials, reclamation and sustainability, manufacturing innovation, and a toxin-free environment. Iron pipe is the only pressure pipe to be certified by any independent sustainability organization. PVC has no consensus certification regarding sustainability. Now let’s consider the environmental impact of 291,390 fewer kilowatt-hours of electricity. This translates to 201 metric tons of carbon dioxide emissions every year for the life of the pipeline. According to the United States Environmental Protection Agency, those tons of emissions are equivalent to the following:
• 42.3 passenger vehicles on the road each year • 22,609 gallons of gasoline each year • 478,401 miles driven each year • 18.3 homes’ electrical energy consumption each year • 215,820 pounds of coal each year • 467 barrels of oil each year
The carbon sequestration equivalent of 291,390 kilowatt-hours is:
• 5152 tree seedlings • 165 acres of forest (EPA, 2015)
Clearly, the decisions we make in specifying products have an environmental impact for years to come. Financial Impact of Energy Differences Realized through Material Selection In this example, the $29,139 annual savings represents a 27 percent reduction in power costs and environmental impact. According to the Black and Veatch report cited earlier, energy can be 30 percent of a utility’s operating expenses. A 27 percent reduction in a line item comprising 30 percent of total cost is a 9 percent total cost reduction. That’s moving the needle, and every utility CFO should be aware of this opportunity. Table 7 shows the present worth of these annual savings for 30 years, 50 years and 100 years at both 3 percent and 4 percent. While no project life nor rate of return can be guaranteed, these are useful for evaluation purposes. You will note that at 3 percent for 50 years, a very reasonable set of variables, the present worth is $749,739. Table 7. Present Worth of Annual Energy Savings
Present Worth of $29,139 in Annual Savings 30 Years 50 Years 100 Years
3 Percent $ 571,137 $ 749,739 $ 920,760 4 Percent $ 502,872 $625,699 $714,051
At $75,000 annually, that’s ten full time headcounts. Four percent interest could be paid on bonds of $728,475 with those annual savings.

12
Conclusion By using full waterway opening resilient wedge gate valves and ductile iron pipe instead of butterfly valves and PVC pipe, this material selection will undoubtedly save significant dollars and energy in the years to come. That’s good financial and environmental stewardship for rate payers and community residents contributing to financial strength and environmental sustainability.
References
American Water Works Association. (2009, September 1). Retrieved from ANSI/AWWA C151/A21.51-09. Page ix.
American Water Works Association. (2013, October 1). Retrieved from ANSI/AWWA C104/A21.4-13. Page ix.
Black & Veatch. (2012). 2012 Strategic Directions in the U.S. Water Utility Industry. Retrieved from Black & Veatch: http://bv.com/docs/default-source/reports-studies/2012_water_utility_survey_book_web.pdf
Crane. (2013). Flow of Fluids Through Valves, Fittings and Pipe - Technical Paper No. 410, Stanford, Connecticut.
DOE. (2014, July). The Water-Energy Nexus: Challenges and Opportunities. Retrieved from Energy.gov: http://energy.gov/downloads/water-energy-nexus-challenges-and-opportunities
Ductile Iron Pipe Research Association. (2012). Cement Mortar Linings for Ductile Iron Pipe, Page 7.
EPA. (2015, October 8). Energy and the Environment. Retrieved from EPA.gov: http://www.epa.gov/energy
ICENTA. (2016). Flow Rate Calculator. Retrieved from http://www.icenta.co.uk/flow-rate-calculator/
Miller, W. T. (1965, June). Durability of Cement Mortar Linings in Cast Iron Pipe. Retrieved from American Water Works Association.
The Institute for Market Transformation to Sustainability. (n.d.). SMaRT Certified. Retrieved from MTS.sustainableproducts.com: http://mts.sustainableproducts.com/index.html
U.S. Energy Information Administration. (2015, December). EIA Electricity Data. Retrieved from EIA.gov: http://www.eia.gov/electricity/