ASAS-SN Bright SN Catalog 2017 - arXiv
14
ASAS-SN Bright SN Catalog 2017 1 The ASAS-SN Bright Supernova Catalog – IV. 2017 T. W.-S. Holoien 1? , J. S. Brown 2,3 , P. J. Vallely 2 , K. Z. Stanek 2,4 , C. S. Kochanek 2,4 , B. J. Shappee 5 , J. L. Prieto 6,7 , Subo Dong 8 , J. Brimacombe 9 , D. W. Bishop 10 , S. Bose 8 , J. F. Beacom 2,4,11 , D. Bersier 12 , Ping Chen 8 , L. Chomiuk 13 , E. Falco 14 , S. Holmbo 15 , T. Jayasinghe 2 , N. Morrell 16 , G. Pojmanski 17 , J. V. Shields 2 , J. Strader 13 , M. D. Stritzinger 15 , Todd A. Thompson 2,4 , P. R. Wo´ zniak 18 , G. Bock 19 , P. Cacella 20 , J. G. Carballo 21 , I. Cruz 23 , E. Conseil 22 , R. G. Farfan 24 , J. M. Fernandez 25 , S. Kiyota 26 , R. A. Koff 27 , G. Krannich 28 , P. Marples 29 , G. Masi 30 , L. A. G. Monard 31 , J. A. Mu˜ noz 32,33 , B. Nicholls 34 , R. S. Post 35 , G. Stone 36 , D. L. Trappett 37 , and W. S. Wiethoff 38 1 The Observatories of the Carnegie Institution for Science, 813 Santa Barbara Street, Pasadena, CA 91101, USA 2 Department of Astronomy, The Ohio State University, 140 West 18th Avenue, Columbus, OH 43210, USA 3 Department of Astronomy and Astrophysics, University of California, Santa Cruz, CA 92064, USA 4 Center for Cosmology and AstroParticle Physics (CCAPP), The Ohio State University, 191 W. Woodruff Ave., Columbus, OH 43210, USA 5 Institute for Astronomy, University of Hawai’i, 2680 Woodlawn Drive, Honolulu, HI 96822, USA 6 N´ ucleo de Astronom´ ıa de la Facultad de Ingenier´ ıa y Ciencias, Universidad Diego Portales, Av. Ej´ ercito 441, Santiago, Chile 7 Millennium Institute of Astrophysics, Santiago, Chile 8 Kavli Institute for Astronomy and Astrophysics, Peking University, Yi He Yuan Road 5, Hai Dian District, Beijing 100871, China 9 Coral Towers Observatory, Cairns, Queensland 4870, Australia 10 Rochester Academy of Science, 1194 West Avenue, Hilton, NY 14468, USA 11 Department of Physics, The Ohio State University, 191 W. Woodruff Ave., Columbus, OH 43210, USA 12 Astrophysics Research Institute, Liverpool John Moores University, 146 Brownlow Hill, Liverpool L3 5RF, UK 13 Department of Physics and Astronomy, Michigan State University, East Lansing, MI 48824, USA 14 Harvard-Smithsonian Center for Astrophysics, 60 Garden St., Cambridge, MA 02138, USA 15 Department of Physics and Astronomy, Aarhus University, Ny Munkegade 120, DK-8000 Aarhus C, Denmark 16 Las Campanas Observatory, Carnegie Observatories, Casilla 601, La Serena, Chile 17 Warsaw University Astronomical Observatory, Al. Ujazdowskie 4, 00-478 Warsaw, Poland 18 Los Alamos National Laboratory, Mail Stop B244, Los Alamos, NM 87545, USA 19 Runaway Bay Observatory, 1 Lee Road, Runaway Bay, Queensland 4216, Australia 20 DogsHeaven Observatory, SMPW Q25 CJ1 LT10B, Brasilia, DF 71745-501, Brazil 21 Observatorio Cerro del Viento-MPC I84, Paseo Condes de Barcelona, 6-4D, 06010 Badajoz, Spain 22 Association Francaise des Observateurs d’Etoiles Variables (AFOEV), Observatoire de Strasbourg, 11 Rue de l’Universite, 67000 Strasbourg, France 23 Cruz Observatory, 1971 Haverton Drive, Reynoldsburg, OH 43068, USA 24 Uraniborg Observatory, cija, Sevilla, Spain 25 Observatory Inmaculada del Molino, Hernando de Esturmio 46, Osuna, 41640 Sevilla, Spain 26 Variable Star Observers League in Japan, 7-1 Kitahatsutomi, Kamagaya, Chiba 273-0126, Japan 27 Antelope Hills Observatory, 980 Antelope Drive West, Bennett, CO 80102, USA 28 Roof Observatory Kaufering, Lessingstr. 16, D-86916 Kaufering, Germany 29 Leyburn & Loganholme Observatories, 45 Kiewa Drive, Loganholme, Queensland 4129, Australia 30 Virtual Telescope Project, Via Madonna de Loco, 47-03023 Ceccano (FR), Italy 31 Kleinkaroo Observatory, Calitzdorp, St. Helena 1B, P.O. Box 281, 6660 Calitzdorp, Western Cape, South Africa 32 Departamento de Astronom´ ıa y Astrof´ ısica, Universidad de Valencia, E-46100 Burjassot, Valencia, Spain 33 Observatorio Astron´ omico, Universidad de Valencia, E-46980 Paterna, Valencia, Spain 34 Mount Vernon Observatory, 6 Mount Vernon Place, 35 Post Observatory, Lexington, MA 02421, USA 36 Sierra Remote Observatories, 44325 Alder Heights Road, Auberry, CA 93602, USA 37 Brisbane Girls Grammar School - Dorothy Hill Observatory, Gregory Terrace, Spring Hill, Queensland 4000, Australia 38 Department of Earth and Environmental Sciences, University of Minnesota, 230 Heller Hall, 1114 Kirby Drive, Duluth, MN. 55812, USA 14 October 2019 MNRAS 484, 1899–1911 (2019) arXiv:1811.08904v2 [astro-ph.HE] 10 Oct 2019
Transcript of ASAS-SN Bright SN Catalog 2017 - arXiv

ASAS-SN Bright SN Catalog 2017 1
The ASAS-SN Bright Supernova Catalog – IV. 2017
T. W.-S. Holoien1?, J. S. Brown2,3, P. J. Vallely2, K. Z. Stanek2,4,C. S. Kochanek2,4, B. J. Shappee5, J. L. Prieto6,7, Subo Dong8, J. Brimacombe9,D. W. Bishop10, S. Bose8, J. F. Beacom2,4,11, D. Bersier12, Ping Chen8,L. Chomiuk13, E. Falco14, S. Holmbo15, T. Jayasinghe2, N. Morrell16,G. Pojmanski17, J. V. Shields2, J. Strader13, M. D. Stritzinger15,Todd A. Thompson2,4, P. R. Wozniak18, G. Bock19, P. Cacella20, J. G. Carballo21,I. Cruz23, E. Conseil22, R. G. Farfan24, J. M. Fernandez25, S. Kiyota26,R. A. Koff27, G. Krannich28, P. Marples29, G. Masi30, L. A. G. Monard31,J. A. Munoz32,33, B. Nicholls34, R. S. Post35, G. Stone36,D. L. Trappett37, and W. S. Wiethoff38
1 The Observatories of the Carnegie Institution for Science, 813 Santa Barbara Street, Pasadena, CA 91101, USA2 Department of Astronomy, The Ohio State University, 140 West 18th Avenue, Columbus, OH 43210, USA3 Department of Astronomy and Astrophysics, University of California, Santa Cruz, CA 92064, USA4 Center for Cosmology and AstroParticle Physics (CCAPP), The Ohio State University, 191 W. Woodruff Ave.,
Columbus, OH 43210, USA5 Institute for Astronomy, University of Hawai’i, 2680 Woodlawn Drive, Honolulu, HI 96822, USA6 Nucleo de Astronomıa de la Facultad de Ingenierıa y Ciencias, Universidad Diego Portales, Av. Ejercito 441, Santiago, Chile7 Millennium Institute of Astrophysics, Santiago, Chile8 Kavli Institute for Astronomy and Astrophysics, Peking University, Yi He Yuan Road 5, Hai Dian District,
Beijing 100871, China9 Coral Towers Observatory, Cairns, Queensland 4870, Australia10 Rochester Academy of Science, 1194 West Avenue, Hilton, NY 14468, USA11 Department of Physics, The Ohio State University, 191 W. Woodruff Ave., Columbus, OH 43210, USA12 Astrophysics Research Institute, Liverpool John Moores University, 146 Brownlow Hill, Liverpool L3 5RF, UK13 Department of Physics and Astronomy, Michigan State University, East Lansing, MI 48824, USA14 Harvard-Smithsonian Center for Astrophysics, 60 Garden St., Cambridge, MA 02138, USA15 Department of Physics and Astronomy, Aarhus University, Ny Munkegade 120, DK-8000 Aarhus C, Denmark16 Las Campanas Observatory, Carnegie Observatories, Casilla 601, La Serena, Chile17 Warsaw University Astronomical Observatory, Al. Ujazdowskie 4, 00-478 Warsaw, Poland18 Los Alamos National Laboratory, Mail Stop B244, Los Alamos, NM 87545, USA19 Runaway Bay Observatory, 1 Lee Road, Runaway Bay, Queensland 4216, Australia20 DogsHeaven Observatory, SMPW Q25 CJ1 LT10B, Brasilia, DF 71745-501, Brazil21 Observatorio Cerro del Viento-MPC I84, Paseo Condes de Barcelona, 6-4D, 06010 Badajoz, Spain22 Association Francaise des Observateurs d’Etoiles Variables (AFOEV), Observatoire de Strasbourg, 11 Rue de l’Universite,
67000 Strasbourg, France23 Cruz Observatory, 1971 Haverton Drive, Reynoldsburg, OH 43068, USA24 Uraniborg Observatory, cija, Sevilla, Spain25 Observatory Inmaculada del Molino, Hernando de Esturmio 46, Osuna, 41640 Sevilla, Spain26 Variable Star Observers League in Japan, 7-1 Kitahatsutomi, Kamagaya, Chiba 273-0126, Japan27 Antelope Hills Observatory, 980 Antelope Drive West, Bennett, CO 80102, USA28 Roof Observatory Kaufering, Lessingstr. 16, D-86916 Kaufering, Germany29 Leyburn & Loganholme Observatories, 45 Kiewa Drive, Loganholme, Queensland 4129, Australia30 Virtual Telescope Project, Via Madonna de Loco, 47-03023 Ceccano (FR), Italy31 Kleinkaroo Observatory, Calitzdorp, St. Helena 1B, P.O. Box 281, 6660 Calitzdorp, Western Cape, South Africa32 Departamento de Astronomıa y Astrofısica, Universidad de Valencia, E-46100 Burjassot, Valencia, Spain33 Observatorio Astronomico, Universidad de Valencia, E-46980 Paterna, Valencia, Spain 34 Mount Vernon Observatory, 6 Mount Vernon Place, Nelson, New Zealand35 Post Observatory, Lexington, MA 02421, USA36 Sierra Remote Observatories, 44325 Alder Heights Road, Auberry, CA 93602, USA37 Brisbane Girls Grammar School - Dorothy Hill Observatory, Gregory Terrace, Spring Hill, Queensland 4000, Australia38 Department of Earth and Environmental Sciences, University of Minnesota, 230 Heller Hall, 1114 Kirby Drive,
Duluth, MN. 55812, USA
14 October 2019
MNRAS 484, 1899–1911 (2019)
arX
iv:1
811.
0890
4v2
[as
tro-
ph.H
E]
10
Oct
201
9

MNRAS 484, 1899–1911 (2019) Preprint 14 October 2019 Compiled using MNRAS LATEX style file v3.0
ABSTRACTIn this catalog we compile information for all supernovae discovered by the All-SkyAutomated Survey for SuperNovae (ASAS-SN) as well as all other bright (mpeak 6 17),spectroscopically confirmed supernovae found in 2017, totaling 308 supernovae. Wealso present UV through near-IR magnitudes gathered from public databases of allhost galaxies for the supernovae in the sample. We perform statistical analyses of ourfull bright supernova sample, which now contains 949 supernovae discovered since 2014May 1, including supernovae from our previous catalogs. This is the fourth of a seriesof yearly papers on bright supernovae and their hosts from the ASAS-SN team, andthis work presents updated data and measurements, including light curves, redshifts,classifications, and host galaxy identifications, that supersede information containedin any previous publications.
Key words: supernovae, general — catalogues — surveys
1 INTRODUCTION
In recent years, large-scale, systematic surveys for super-novae (SNe) and other transient phenomena have becomea cornerstone of modern astronomy. (Significant examplesof such surveys are summarized in Paper III; Holoien et al.2017c). Despite the large number of transient surveys, how-ever, prior to 2013 there was no high-cadence optical sur-vey designed to scan the full observable sky for the bright,nearby transients that are easiest to observe in great detail.While fewer in number, such events provide the opportu-nity to obtain the high-quality observational data needed tohave the largest impact on our understanding of the physicsbehind transient phenomena.
The All-Sky Automated Survey for SuperNovae (ASAS-SN1; Shappee et al. 2014) was created for this purpose.ASAS-SN is designed to survey the entire visible sky at arapid cadence to find the brightest transients. ASAS-SN hasfound many nearby and interesting SNe (e.g., Dong et al.2016; Holoien et al. 2016a; Shappee et al. 2016; Godoy-Rivera et al. 2017; Bose et al. 2018b,a; Vallely et al. 2019),tidal disruption events (TDEs; e.g., Holoien et al. 2014a;Brown et al. 2016, 2017a; Holoien et al. 2016c,b; Prieto et al.2016; Romero-Canizales et al. 2016; Holoien et al. 2018),stellar outbursts (Holoien et al. 2014b; Schmidt et al. 2014;Herczeg et al. 2016; Schmidt et al. 2016), flares from activegalactic nuclei (Shappee et al. 2014), black hole binaries(Tucker et al. 2018), and cataclysmic variable stars (Katoet al. 2014a,b, 2015, 2016).
Each ASAS-SN unit is hosted by the Las CumbresObservatory (Brown et al. 2013) network and consists offour 14-cm telescopes, each with a 4.5× 4.5 degree field-of-view. Until 2017, ASAS-SN comprised two units, each us-ing V -band filters with a limiting magnitude of mV ∼ 17:Brutus, located on Haleakala in Hawaii, and Cassius, lo-cated at Cerro Tololo, Chile (further technical details canbe found in Shappee et al. (2014)). In late 2017, ASAS-SNexpanded with three new units: Paczynski, also located atCerro Tololo, Leavitt, located at McDonald Observatory inTexas, and Payne-Gaposchkin, located in Sutherland, SouthAfrica. Between the five units, ASAS-SN now surveys the
? [email protected] http://www.astronomy.ohio-state.edu/~assassin/
entire visible sky (roughly 30000 square degrees) in lessthan a single night, with weather losses. Further, ASAS-SNswitched to g-band for our new units, increasing our imit-ing magnitude to mg ∼ 18.5. Due to the increased depth,we will be switching our initial 8 telescopes to g-band aswell by the end of 2018. For a more detailed history of theASAS-SN project, see Holoien et al. (2017a) and Shappeeet al. (2014).
All ASAS-SN data are automatically processed and aresearched in real-time. New discoveries are announced pub-licly either upon first detection if the source is judged likelyto be real based on ASAS-SN data alone, or once confirmedthrough follow-up imaging in cases where the first detec-tion is ambiguous. This allows for both rapid discovery andresponse by the ASAS-SN team, as well as by others. ASAS-SN uses an untargeted survey approach and 97% of an-nounced ASAS-SN discoveries have been confirmed spectro-scopically, either by the ASAS-SN team or by public clas-sification efforts via channels such as the Transient NameServer (TNS2) and Astronomer’s Telegrams (ATels). Thismakes the ASAS-SN sample much less biased than manyother SN searches, and it is thus ideal for population stud-ies of nearby SNe and their hosts (e.g., Brown et al. 2018).
This manuscript is the fourth of a series of yearly cat-alogs provided by the ASAS-SN team. We present collectedinformation on all SNe discovered by ASAS-SN in 2017 andtheir host galaxies. We also provide the same informationfor all bright SNe (those with mpeak 6 17) discovered byother professional and amateur astronomers in the sameyear, as we have done with our previous catalogs (Holoienet al. 2017a,b,c). We also include whether ASAS-SN inde-pendently recovered these SNe after their initial discovery,to better quantify the completeness of our survey.
This paper contains updated measurements and analy-sis that are intended to supersede publicly available infor-mation from ASAS-SN webpages, TNS, and discovery andclassification ATels. ASAS-SN continues to participate inthe TNS system to avoid potential confusion over discover-ies, but strongly object to a naming scheme that does notcredit the discoverer, even though this would be trivial toimplement. Throughout this catalog we use the internal sur-vey discovery names for each SN as our primary nomencla-
2 https://wis-tns.weizmann.ac.il/
c© 2019 The Authors

ASAS-SN Bright SN Catalog 2017 3
ture, and we encourage others to do the same to preservethe origins of new transients in future literature.
The catalog is organized as follows: in Section 2 wedescribe the sources of the information presented in thismanuscript and list SNe with updated classifications andredshift measurements. In Section 3, we give statistics onthe SN and host galaxy populations in our full cumu-lative sample, including the discoveries listed in Holoienet al. (2017a,b,c), and discuss overall trends in the sam-ple. Throughout our analyses, we assume a standard ΛCDMcosmology with H0 = 69.3 km s−1 Mpc−1, ΩM = 0.29, andΩΛ = 0.71 for converting host redshifts into distances. InSection 4, we summarize our overall findings and discuss fu-ture directions for the ASAS-SN survey and how they willimpact future discoveries.
2 DATA SAMPLES
The sources of the data collected in our supernova andgalaxy samples are summarized below. All data are pre-sented in Tables 1, 2, 3, and 4.
2.1 The ASAS-SN Supernova Sample
All information for supernovae discovered by ASAS-SN be-tween 2017 January 1 and 2017 December 31 is given inTable 1. As in Holoien et al. (2017a,b,c), we obtained allsupernova names, discovery dates, and host names from ourdiscovery ATels, which are cited in Table 1. Also includedin the table are the IAU names given to each supernovaby TNS, which is the official mechanism for reporting newastronomical transients to the IAU.
We measured all ASAS-SN supernova redshifts fromclassification spectra. For cases where the nominal super-nova host galaxy had a previously measured redshift thatis consistent with the transient redshift, we list the red-shift of the host taken from the NASA/IPAC ExtragalacticDatabase (NED)3. For other cases, we report the redshiftsgiven in the classification telegrams or posted on TNS, withthe exception of those that are updated in this work (seebelow).
Classifications for ASAS-SN supernova discoveries wereretrieved from classification telegrams, which are cited inTable 1 when available, or from TNS, when a classifcationwas not reported in an ATel. We list “TNS” in the “Classifi-cation Telegram” column of the table for such cases. Whenmeasurable from the classification spectra, we also give theapproximate age of the supernova at discovery in days rel-ative to peak. Classifications were typically obtained usingeither the Supernova Identification code (SNID; Blondin &Tonry 2007) or the Generic Classification Tool (GELATO4;Harutyunyan et al. 2008), which both compare observed in-put spectra to template spectra in order to estimate thesupernova age and type.
We present updated redshifts and classifications for a
3 https://ned.ipac.caltech.edu/4 gelato.tng.iac.es
number of ASAS-SN discoveries whose redshifts and clas-sifications differ from previous reports based on an ex-amination of archival classification spectra obtained fromTNS and the Weizmann Interactive Supernova data REPos-itory (WISEREP; Yaron & Gal-Yam 2012). ASASSN-17bb,ASASSN-17ol, and ASASSN-17om have updated redshifts,and ASASSN-17io has an updated type based on archivalspectra. We also report the classifications (and in some cases,redshifts) for a number of supernovae that were not previ-ously publicly classified based on spectra obtained with theWide Field Reimaging CCD Camera (WFCCD) mountedon the Las Campanas Observatory du Pont 2.5-m telescopeand the Fast Spectrograph (FAST; Fabricant et al. 1998)mounted on the Fred L. Whipple Observatory Tillinghast1.5-m telescope. ASAS-SN discoveries with new classifica-tions include ASASSN-17ip, ASASSN-17mf, ASASSN-17oh,and ASASSN-17ot. All updated redshifts and classificationsare available in Table 1.
We used the astrometry.net package (Barron et al. 2008;Lang et al. 2010) to solve astrometry in follow-up images ofASAS-SN supernovae and used Iraf to measure centroidpositions for each SN. This generally gives position errors of<1.′′0 and is substantially more accurate than using ASAS-SN images, which have a 7.′′0 pixel scale, to measure SNpositions. Follow-up imaging used to measure positions wereobtained using the Las Cumbres Observatory 1-m telescopesor by amateur collaborators who work with the ASAS-SNteam. Coordinates measured from follow-up imaging wereannounced in discovery ATels, and we report these coor-dinates in Table 1. The offsets between the SNe and thecenters of their host galaxies are also reported in the Table,and these offsets were calculated using galaxy coordinatesavailable in NED, or measured from archival images in caseswhere a host center was not previously catalogued.
We re-processed ASAS-SN data and measured V -band,host-subtracted light curves for all ASAS-SN supernova dis-coveries spanning 90 days prior to discovery through 250days after discovery. From these light curves we measuredV -band peak magnitudes for each ASAS-SN supernova. Inaddition, as the three new units deployed in 2017 use g-bandfilters, we measured g-band peak magnitudes for each ASAS-SN supernova that was discovered after the new units weredeployed. Both magnitudes are reported in Table 1. In somecases, due to the way ASAS-SN fields were divided betweencameras and because the new units were still building refer-ence images in late 2017, supernovae were only detected in asingle filter. We also report discovery magnitudes in the dis-covery filter measured from the re-subtracted light curves.In some cases, these magnitudes differ from the magnitudesreported in the original discovery ATels or on TNS, as re-processing the data can result in improvements in the pho-tometry. As we did in the previous ASAS-SN catalogs, wedefine the “discovery magnitude” as the supernova’s magni-tude on the date of discovery. For supernovae with enoughdetections in their light curves (for either or both filters),we also performed parabolic fits to the full light curves andestimate peak magnitudes based on the fits. We report thebrighter value between the brightest magnitude measuredfrom the light curve and the peak of the parabolic fit foreach filter as the “peak magnitudes” in Table 1This is doneto provide more accurate peak magnitudes for the few caseswhere the peak of the light curve was not well-covered by
MNRAS 484, 1899–1911 (2019)
4 T. W.-S. Holoien et al.
ASAS-SN data, as was done in the previous ASAS-SN cat-alogs.
As in Holoien et al. (2017a,b,c), all supernovae discov-ered by ASAS-SN in 2017 are included in this catalog, in-cluding those fainter than mV = 17 or mg = 17. When per-forming comparison analyses that are presented in Section 3,we only include those ASAS-SN discoveries with mpeak 6 17so that our sample is consistent with the non-ASAS-SN sam-ple.
2.2 The Non-ASAS-SN Supernova Sample
Table 2 contains information for all SNe discovered by otherprofessional and amateur SN searches between 2017 January1 and 2017 December 31 that are both spectroscopicallyconfirmed and have peak magnitudes of mpeak 6 17.
As in our previous catalogs, the list of non-ASAS-SNdiscoveries was gathered from the “latest supernovae” web-site5 created by D. W. Bishop (Gal-Yam et al. 2013). Thiswebsite compiles discoveries reported via a multitude ofchannels, including TNS and ATels, and links objects re-ported by different searches at different times. It is thus anideal source for information on discoveries from various SNsearches. Some supernova searches are not participating inthe TNS system, so we only use TNS for verifying data onthe latest supernovae website, and not as a primary infor-mation source.
We obtained supernova names, IAU names, discoverydates, coordinates, host offsets, peak reported magnitudes,spectral types, and discovery sources for each supernovae inthe non-ASAS-SN sample from the latest supernovae web-site, when possible. NED was used to gather host galaxynames and redshifts when available, with the SN redshiftson the latest supernovae website being used in other cases.For supernovae without a host offset listed on the website,we took the offset from NED, defining the offset as the angu-lar separation between the coordinates of the host in NEDand the reported SN coordinates.
Some SNe has no host galaxy listed near their posi-tions in NED, but had hosts clearly visible in archival Pan-STARRS data (Chambers et al. 2016). For such cases weused Iraf to measure a centroid position of the host touse to calculate the offset. The host galaxy names given inthis manuscript are the primary names of the galaxies takenfrom NED. These differ in some cases from what is listed onASAS-SN websites or the latest supernovae website.
The magnitudes from the latest supernovae website arereported in different filters from various telescopes, and inmany cases the reported photometry does not necessarilycover the actual peak of the supernova light curve. Forthe purposes of having a more consistent sample of su-pernova peak magnitudes between the ASAS-SN sample,which uses peak magnitudes measured from ASAS-SN data,and the non-ASAS-SN sample, we also produced new, host-subtracted V - and g-band ASAS-SN light curves for everynon-ASAS-SN supernova in the 2017 sample. As we did withthe ASAS-SN sample, we also performed parabolic fits to thelight curves with enough detections, and used the brighterof the brightest measured magnitude and the peak of the fit
5 http://www.rochesterastronomy.org/snimages/
as the “peak magnitude” for each filter, when a supernovawas detected. These peak ASAS-SN V - and g-band magni-tudes are also listed in Table 2 for each supernova that wasdetected. We find that only 9 supernovae from the 2017 non-ASAS-SN sample are not detected in this re-examinationdespite 48 of these supernovae not being recovered duringnormal survey operations. This is likely due to better-qualitylight curves being produced in this new reduction, and thefact that our processing ensures no supernova light is con-tained in the reference image, and thus subtracted from thelight curve.
We performed a similar reduction and peak magnitudemeasurement for supernovae in the 2014-2016 non-ASAS-SN samples, and use only ASAS-SN V -band magnitudeswhen looking at the peak magnitude distribution and sam-ple completeness in Section 3. The ASAS-SN light curves forall supernovae in these samples will be released in a futuremanuscript (Ping et al., in prep.)
As we did with the ASAS-SN sample, we also checkedthe redshifts and classifications of the non-ASAS-SN super-novae using publicly available spectra on TNS and WIS-EREP. Based on our re-examination of these spectra, weupdate the classifications of ATLAS17cpj and ATLAS17evmand the redshift of ATLAS17cpj. In addition, the supernovaSN 2017gfj has a measured redshift of z ∼ 0.072, but hasbeen publicly announced as being hosted in the galaxy UGC11950, which has a redshift of z = 0.020541. This was likelydone because UGC 11950 is the nearest catalogued galaxyto the SN, but based on the redshift discrepancy we believeit likely that SN 2017gfj was actually located in an uncat-alogued background galaxy, and we update the host namein our sample accordingly. We assume the SN redshift ofz ∼ 0.072 for SN 2017gfj in our analyses presented in Sec-tion 3. We report updated types and redshifts in Table 2.
We give the name of the discovery group for all SNediscovered by other professional surveys in Table 2. We use“Amateurs” as the discovery source for supernovae discov-ered by non-professional astronomers, as this allows us todifferentiate this sample of SNe from the ASAS-SN andother professional samples. We include the names of the am-ateurs responsible for these discoveries in the full machine-readable version of Table 2 that is available in the onlineversion of this manuscript so as to properly credit themfor their discoveries. Unlike in previous years, amateurs nolonger account for the second largest number of bright su-pernova discoveries after ASAS-SN, with the ATLAS survey(Tonry 2011; Tonry et al. 2018) now holding that distinc-tion. Amateurs still account for the third largest number ofbright supernova discoveries in 2017, however, showing theyare still a significant source of bright discoveries.
Finally, we also note in Table 2 whether or not non-ASAS-SN supernovae were independently recovered by theASAS-SN team during normal survey operations. This al-lows us to better quantify the impact of ASAS-SN on thediscovery of bright SNe independent of other SN searches.
2.3 The Host Galaxy Samples
For both the ASAS-SN and non-ASAS-SN samples, we col-lected Galactic extinction estimates in the directions of thehost galaxies and near-ultraviolet (NUV) through infrared(IR) host galaxy magnitudes, which we presentin Tables 3
MNRAS 484, 1899–1911 (2019)
ASAS-SN Bright SN Catalog 2017 5
Ia79% (415)
II18% (96)
Ib/Ic3% (15)
ASAS-SN Discoveries (526)
Ia
57% (240)
II
33% (137)
Ib/Ic10% (43)
Non-ASAS-SN Discoveries (420)
Ia
69% (655)
II
25% (233)
Ib/Ic6% (58)
Full Sample (946)
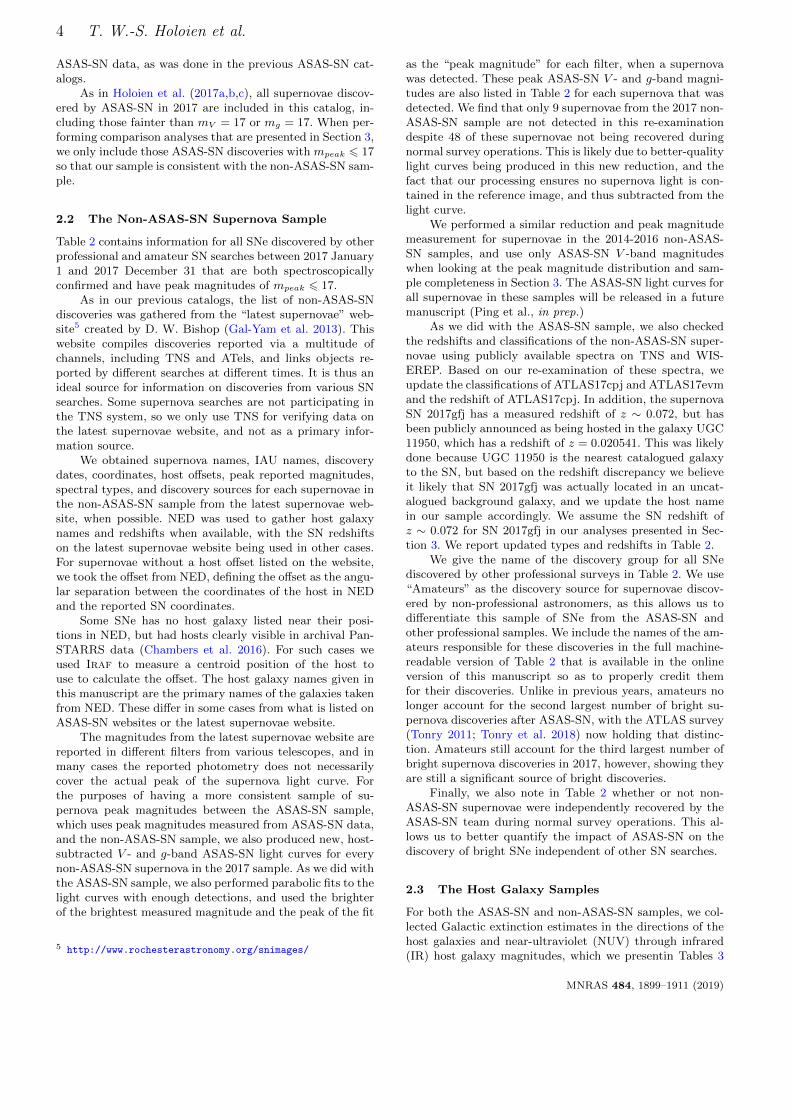
Figure 1. Left Panel : Breakdown by type of ASAS-SN supernova discoveries between 2014 May 01 and 2017 December 31. The
proportion of each type continues to closely match that of the ideal magnitude-limited sample from Li et al. (2011). Center Panel :
The same breakdown for the non-ASAS-SN sample over the the same time period. Right Panel : The type breakdown for our entire SNsample, now totaling 946 supernovae.
This analysis excludes the 3 superluminous SNe in the sample, and includes Type IIb SNe in the “Type II” sample.
and 4. We obtained the values of Galactic AV from Schlafly& Finkbeiner (2011) in the directions of the supernovae fromNED. NUV host magnitudes from the Galaxy Evolution Ex-plorer (GALEX; Morrissey et al. 2007) All Sky Imaging Sur-vey (AIS), optical ugriz magnitudes from the Sloan DigitalSky Survey Data Release 14 (SDSS DR14; SDSS Collabo-ration et al. 2016), NIR JHKS magnitudes from the Two-Micron All Sky Survey (2MASS; Skrutskie et al. 2006), andIR W1 and W2 from the Wide-field Infrared Survey Ex-plorer (WISE; Wright et al. 2010) AllWISE source catalogswere obtained from publicly available online databases.
We adopt J and H filter upper limits correspondingto ther faintest detected host in our combined 2014 − 2017sample (mJ > 17.0, mH > 16.4) for hosts that are not de-tected in 2MASS data. If a host not detected in 2MASS wasdetected in WISE W1 data, we added the mean KS −W1offset from the total sample to the WISE W1 magnitudeto estimate a KS magnitude. This average offset is equalto −0.51 magnitudes with a scatter of 0.04 magnitudes anda standard error of 0.002 magnitudes, matching what wefound when doing the same calculation for the 2014− 2016sample in Holoien et al. (2017c). We adopted an upper limitof mKS > 15.6, equal to the faintest detected KS-band hostmagnitude from our sample, for galaxies not detected in ei-ther 2MASS or WISE data.
3 ANALYSIS OF THE SAMPLE
The total sample of bright SNe discovered by all sourcesbetween 2014 May 01, when ASAS-SN began operationsin the Southern hemisphere, and 2017 December 31 nowincludes 949 SNe, after excluding ASAS-SN discoverieswith mpeak,V > 17.0 and mpeak,g > 17.0 (Holoien et al.2017a,b,c). 56% (528) of these SNe were ASAS-SN discov-eries, 19% (176) were discovered by amateur astronomers,and 26% (245) were discovered by other professional sur-veys. Breaking the sample down by type, 655 were Type IaSNe, 233 were Type II SNe, 58 were type Ib/Ic SNe, and
3 were superluminous SNe. For the purpose of these analy-ses, we include Type IIb SNe in the Type II sample so thatwe can more directly compare with the results of Li et al.(2011), as we have done in our previous catalogs. The objectASASSN-15lh, either an extremely luminous Type I SLSN(Dong et al. 2016; Godoy-Rivera et al. 2017) or a tidal dis-ruption event (Leloudas et al. 2016), is excluded from thefollowing analysis.
The breakdown by type of the ASAS-SN, non-ASAS-SN, and total samples are shown in Figure 1. As (e.g.,Li et al. 2011) predicted for a magnitude-limited sample,Type Ia SNe account for the largest fraction in each of thethree samples. As we have seen in our previous catalogs, theASAS-SN sample continues to match the “ideal magnitude-limited sample” from Li et al. (2011), where there are 79%Type Ia, 17% Type II, and 4% Type Ib/Ic SNe, almost ex-actly. Due to the observing strategies of the various discov-ery sources in the non-ASAS-SN sample not necessarily be-ing magnitude-limited in all cases (e.g., because the surveytargets certain types of galaxies or takes a volume-limitedapproach), the other two samples have higher fractions ofcore-collapse SNe than the ASAS-SN sample.
ASAS-SN accounts for 56% of the bright supernovaein our total sample, and thus remains the dominant sourceof bright supernova discoveries despite new surveys like AT-LAS coming online in 2017. A large fraction of the ASAS-SNsample continues to be discovered shortly after explosion be-cause of our high cadence. Out of 459 ASAS-SN SNe withestimated ages at discovery, 70% (322) were discovered priorto reaching their peak brightness. As we found in Holoienet al. (2017b) and Holoien et al. (2017c), the ASAS-SN sam-ple remains less affected by host galaxy selection effects thanother samples: 24% (127) of ASAS-SN supernovae occurredin catalogued hosts without previously measured redshiftsand an additional 4% (19) occurred in uncatalogued hostsor were hostless. In contrast, 18% (74) of non-ASAS-SN su-pernovae were discovered in known hosts without reportedredshifts, and only 2% (9) were discovered in uncataloguedhosts or were hostless.
MNRAS 484, 1899–1911 (2019)

6 T. W.-S. Holoien et al.
-15 -16 -17 -18 -19 -20 -21 -22 -23 -24 -25 -26
Host Galaxy MKs
0.1
1
10
100O
ffse
t(a
rcse
c)
ASAS-SNOther Prof.Amateurs
-3 -2 -1 0 1
Host Galaxy logL/L?
-15 -16 -17 -18 -19 -20 -21 -22 -23 -24 -25 -26
Host Galaxy MKs
0.1
1
10
100
Off
set
(kpc
)
ASAS-SNOther Prof.Amateurs
-3 -2 -1 0 1
Host Galaxy logL/L?
Figure 2. Upper Panel : The absolute KS host magnitudes for all supernovae in our 2014 − 2017 combined sample compared to the
offsets of the SNe in arcseconds from their host nuclei. The top scale shows a luminosity scale corresponding to the magnitude range onthe bottom scale, assuming M?,KS
= −24.2 (Kochanek et al. 2001). Red stars, black circles, and blue squares denote discoveries from
ASAS-SN, amateurs, and other professional searches, respectively. Triangles in corresponding colors indicate upper limits on the host
galaxy magnitudes for hosts that are not detected in 2MASS or WISE data. Filled points indicate supernovae that were discovered orindependently recovered by ASAS-SN. The median host magnitudes and offsets are indicated with dashed, dotted, and dash-dotted lines
for the ASAS-SN sample, amateur sample, and other professional sample, respectively, in colors that correspond to those of the matching
data points. Lower Panel : The same plot, but with the offset measured in kiloparsecs.
MNRAS 484, 1899–1911 (2019)

ASAS-SN Bright SN Catalog 2017 7
−26−25−24−23−22−21−20−19−18−17−16
Host Galaxy MKS
0.0
0.2
0.4
0.6
0.8
1.0
f SN
AmateursOther Prof.ASAS-SN
0 6 12 18 24 30 36 42 48 54 60
Offset (arcsec)
0.0
0.2
0.4
0.6
0.8
1.0
f SN
AmateursOther Prof.ASAS-SN
1 3 5 7 9 11 13 15 17 19 21 23 25
Offset (kpc)
0.0
0.2
0.4
0.6
0.8
1.0
f SN
AmateursOther Prof.ASAS-SN
Figure 3. Normalized cumulative distributions of host galaxy absolute magnitudes (upper panel), SN offsets from host nuclei in arcsec-
onds (center panel), and SN offsets from host nuclei in kpc (bottom panel) for ASAS-SN discoveries (red), other professional discoveries(blue), and amateur discoveries (black). As is seen in Figure 2, amateur discoveries are biased towards more luminous hosts than profes-sional surveys, and ASAS-SN continues to find supernovae at smaller offsets than either comparison group, regardless of how the offset
is measured.
MNRAS 484, 1899–1911 (2019)
8 T. W.-S. Holoien et al.
2012
Jan.
Mar
.M
ayJu
l.Se
p.N
ov.
2013
Jan.
Mar
.M
ayJu
l.Se
p.N
ov.
2014
Jan.
Mar
.M
ayJu
l.Se
p.N
ov.
2015
Jan.
Mar
.M
ayJu
l.Se
p.N
ov.
2016
Jan.
Mar
.M
ayJu
l.Se
p.N
ov.
2017
Jan.
Mar
.M
ayJu
l.Se
p.N
ov.
Month
0
5
10
15
20
25
30
35
40NSN
/Mon
th
Real-timeAnalysisBegins
BrutusUpgraded
CassiusDeployed
Machine LearningImplemented
Cassius UpgradedPaczynski &
LeavittDeployed
Payne-Gaposchkin
DeployedASAS-SN DiscoveriesRecoveredNot Recovered
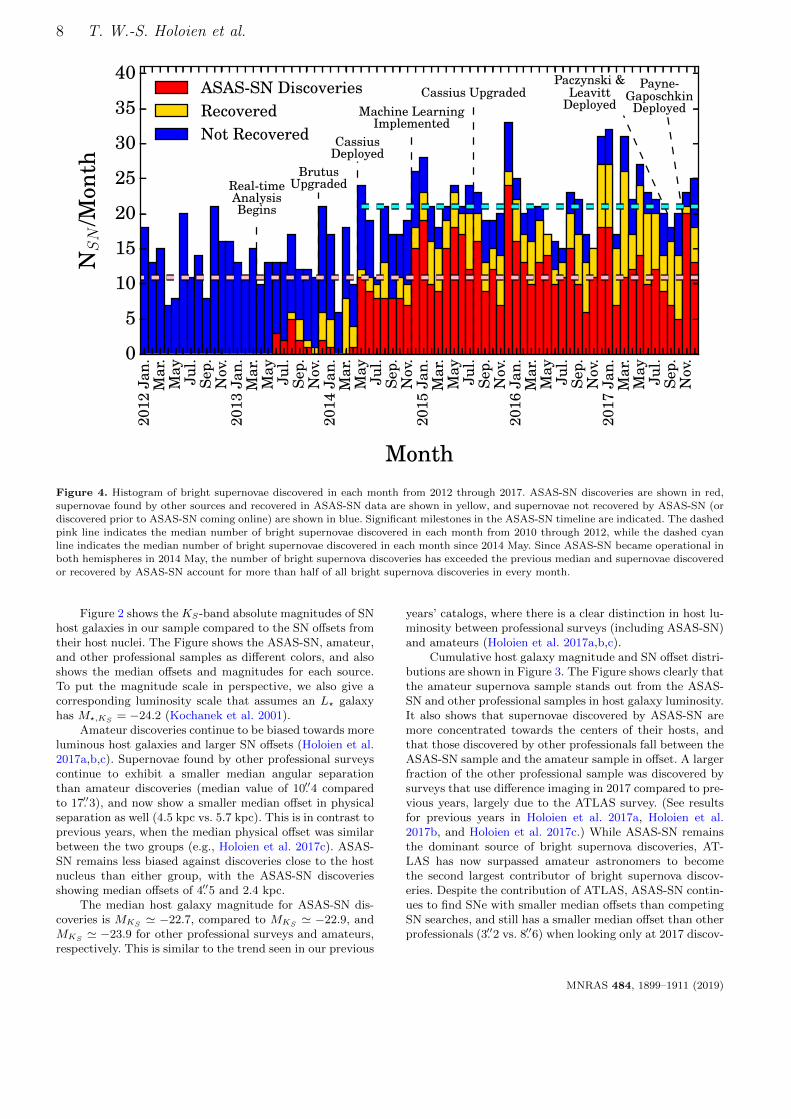
Figure 4. Histogram of bright supernovae discovered in each month from 2012 through 2017. ASAS-SN discoveries are shown in red,supernovae found by other sources and recovered in ASAS-SN data are shown in yellow, and supernovae not recovered by ASAS-SN (or
discovered prior to ASAS-SN coming online) are shown in blue. Significant milestones in the ASAS-SN timeline are indicated. The dashed
pink line indicates the median number of bright supernovae discovered in each month from 2010 through 2012, while the dashed cyanline indicates the median number of bright supernovae discovered in each month since 2014 May. Since ASAS-SN became operational in
both hemispheres in 2014 May, the number of bright supernova discoveries has exceeded the previous median and supernovae discovered
or recovered by ASAS-SN account for more than half of all bright supernova discoveries in every month.
Figure 2 shows the KS-band absolute magnitudes of SNhost galaxies in our sample compared to the SN offsets fromtheir host nuclei. The Figure shows the ASAS-SN, amateur,and other professional samples as different colors, and alsoshows the median offsets and magnitudes for each source.To put the magnitude scale in perspective, we also give acorresponding luminosity scale that assumes an L? galaxyhas M?,KS = −24.2 (Kochanek et al. 2001).
Amateur discoveries continue to be biased towards moreluminous host galaxies and larger SN offsets (Holoien et al.2017a,b,c). Supernovae found by other professional surveyscontinue to exhibit a smaller median angular separationthan amateur discoveries (median value of 10.′′4 comparedto 17.′′3), and now show a smaller median offset in physicalseparation as well (4.5 kpc vs. 5.7 kpc). This is in contrast toprevious years, when the median physical offset was similarbetween the two groups (e.g., Holoien et al. 2017c). ASAS-SN remains less biased against discoveries close to the hostnucleus than either group, with the ASAS-SN discoveriesshowing median offsets of 4.′′5 and 2.4 kpc.
The median host galaxy magnitude for ASAS-SN dis-coveries is MKS ' −22.7, compared to MKS ' −22.9, andMKS ' −23.9 for other professional surveys and amateurs,respectively. This is similar to the trend seen in our previous
years’ catalogs, where there is a clear distinction in host lu-minosity between professional surveys (including ASAS-SN)and amateurs (Holoien et al. 2017a,b,c).
Cumulative host galaxy magnitude and SN offset distri-butions are shown in Figure 3. The Figure shows clearly thatthe amateur supernova sample stands out from the ASAS-SN and other professional samples in host galaxy luminosity.It also shows that supernovae discovered by ASAS-SN aremore concentrated towards the centers of their hosts, andthat those discovered by other professionals fall between theASAS-SN sample and the amateur sample in offset. A largerfraction of the other professional sample was discovered bysurveys that use difference imaging in 2017 compared to pre-vious years, largely due to the ATLAS survey. (See resultsfor previous years in Holoien et al. 2017a, Holoien et al.2017b, and Holoien et al. 2017c.) While ASAS-SN remainsthe dominant source of bright supernova discoveries, AT-LAS has now surpassed amateur astronomers to becomethe second largest contributor of bright supernova discov-eries. Despite the contribution of ATLAS, ASAS-SN contin-ues to find SNe with smaller median offsets than competingSN searches, and still has a smaller median offset than otherprofessionals (3.′′2 vs. 8.′′6) when looking only at 2017 discov-
MNRAS 484, 1899–1911 (2019)
ASAS-SN Bright SN Catalog 2017 9
0 0.01 0.02 0.03 0.04 0.05 0.06 0.07 0.08 0.09 0.10 0.11
Redshift
102030405060708090
100110120
NSN
Type IaType IIType Ib/Ic
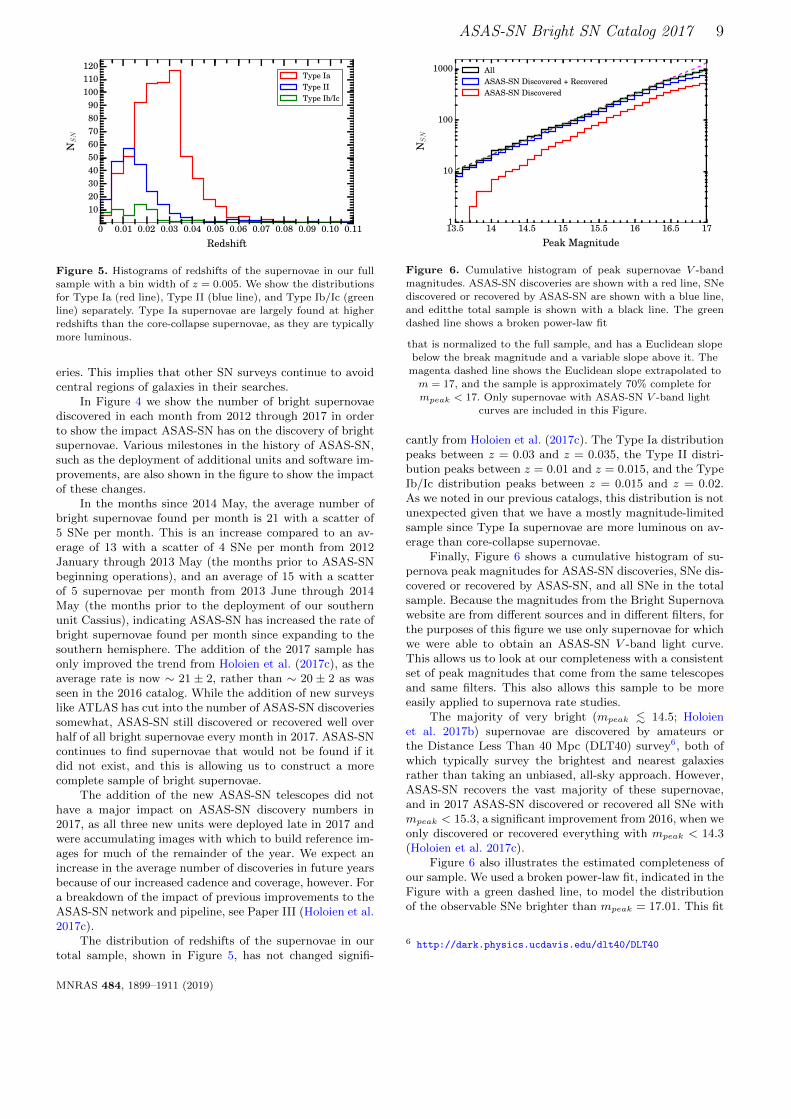
Figure 5. Histograms of redshifts of the supernovae in our full
sample with a bin width of z = 0.005. We show the distributionsfor Type Ia (red line), Type II (blue line), and Type Ib/Ic (green
line) separately. Type Ia supernovae are largely found at higher
redshifts than the core-collapse supernovae, as they are typicallymore luminous.
eries. This implies that other SN surveys continue to avoidcentral regions of galaxies in their searches.
In Figure 4 we show the number of bright supernovaediscovered in each month from 2012 through 2017 in orderto show the impact ASAS-SN has on the discovery of brightsupernovae. Various milestones in the history of ASAS-SN,such as the deployment of additional units and software im-provements, are also shown in the figure to show the impactof these changes.
In the months since 2014 May, the average number ofbright supernovae found per month is 21 with a scatter of5 SNe per month. This is an increase compared to an av-erage of 13 with a scatter of 4 SNe per month from 2012January through 2013 May (the months prior to ASAS-SNbeginning operations), and an average of 15 with a scatterof 5 supernovae per month from 2013 June through 2014May (the months prior to the deployment of our southernunit Cassius), indicating ASAS-SN has increased the rate ofbright supernovae found per month since expanding to thesouthern hemisphere. The addition of the 2017 sample hasonly improved the trend from Holoien et al. (2017c), as theaverage rate is now ∼ 21 ± 2, rather than ∼ 20 ± 2 as wasseen in the 2016 catalog. While the addition of new surveyslike ATLAS has cut into the number of ASAS-SN discoveriessomewhat, ASAS-SN still discovered or recovered well overhalf of all bright supernovae every month in 2017. ASAS-SNcontinues to find supernovae that would not be found if itdid not exist, and this is allowing us to construct a morecomplete sample of bright supernovae.
The addition of the new ASAS-SN telescopes did nothave a major impact on ASAS-SN discovery numbers in2017, as all three new units were deployed late in 2017 andwere accumulating images with which to build reference im-ages for much of the remainder of the year. We expect anincrease in the average number of discoveries in future yearsbecause of our increased cadence and coverage, however. Fora breakdown of the impact of previous improvements to theASAS-SN network and pipeline, see Paper III (Holoien et al.2017c).
The distribution of redshifts of the supernovae in ourtotal sample, shown in Figure 5, has not changed signifi-
13.5 14 14.5 15 15.5 16 16.5 17
Peak Magnitude
1
10
100
1000
NSN
AllASAS-SN Discovered + RecoveredASAS-SN Discovered
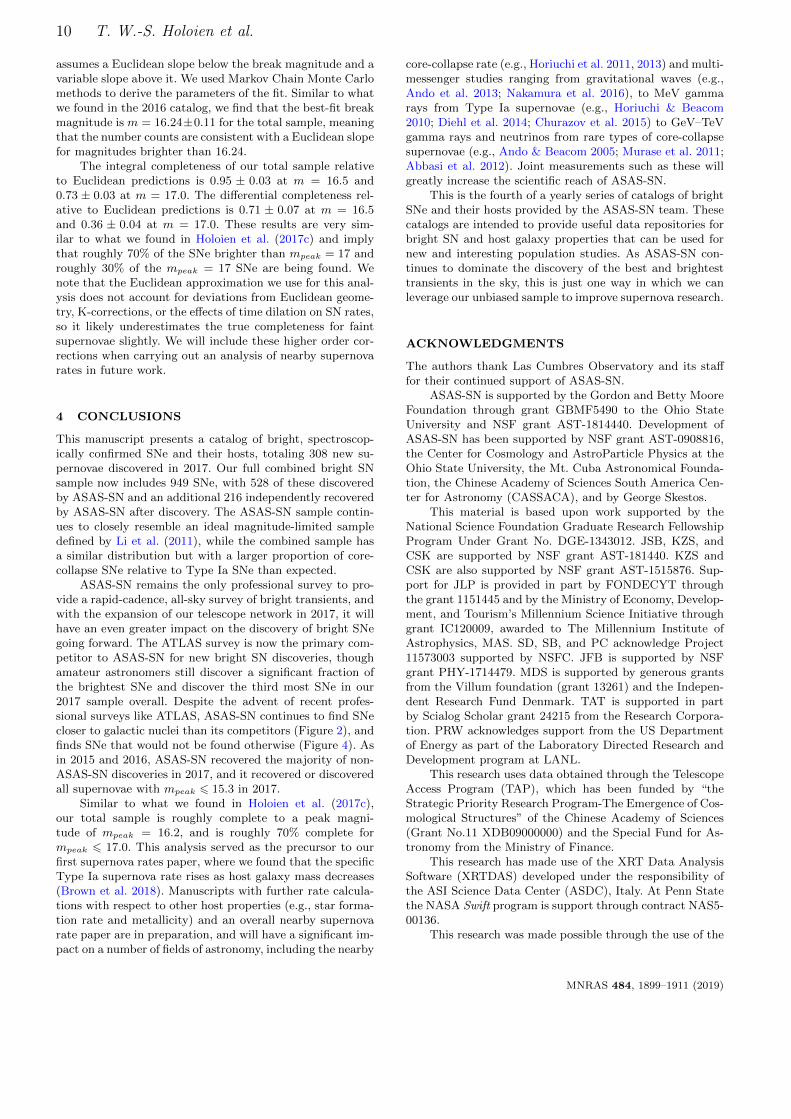
Figure 6. Cumulative histogram of peak supernovae V -bandmagnitudes. ASAS-SN discoveries are shown with a red line, SNe
discovered or recovered by ASAS-SN are shown with a blue line,and editthe total sample is shown with a black line. The green
dashed line shows a broken power-law fit
that is normalized to the full sample, and has a Euclidean slope
below the break magnitude and a variable slope above it. The
magenta dashed line shows the Euclidean slope extrapolated tom = 17, and the sample is approximately 70% complete for
mpeak < 17. Only supernovae with ASAS-SN V -band light
curves are included in this Figure.
cantly from Holoien et al. (2017c). The Type Ia distributionpeaks between z = 0.03 and z = 0.035, the Type II distri-bution peaks between z = 0.01 and z = 0.015, and the TypeIb/Ic distribution peaks between z = 0.015 and z = 0.02.As we noted in our previous catalogs, this distribution is notunexpected given that we have a mostly magnitude-limitedsample since Type Ia supernovae are more luminous on av-erage than core-collapse supernovae.
Finally, Figure 6 shows a cumulative histogram of su-pernova peak magnitudes for ASAS-SN discoveries, SNe dis-covered or recovered by ASAS-SN, and all SNe in the totalsample. Because the magnitudes from the Bright Supernovawebsite are from different sources and in different filters, forthe purposes of this figure we use only supernovae for whichwe were able to obtain an ASAS-SN V -band light curve.This allows us to look at our completeness with a consistentset of peak magnitudes that come from the same telescopesand same filters. This also allows this sample to be moreeasily applied to supernova rate studies.
The majority of very bright (mpeak . 14.5; Holoienet al. 2017b) supernovae are discovered by amateurs orthe Distance Less Than 40 Mpc (DLT40) survey6, both ofwhich typically survey the brightest and nearest galaxiesrather than taking an unbiased, all-sky approach. However,ASAS-SN recovers the vast majority of these supernovae,and in 2017 ASAS-SN discovered or recovered all SNe withmpeak < 15.3, a significant improvement from 2016, when weonly discovered or recovered everything with mpeak < 14.3(Holoien et al. 2017c).
Figure 6 also illustrates the estimated completeness ofour sample. We used a broken power-law fit, indicated in theFigure with a green dashed line, to model the distributionof the observable SNe brighter than mpeak = 17.01. This fit
6 http://dark.physics.ucdavis.edu/dlt40/DLT40
MNRAS 484, 1899–1911 (2019)
10 T. W.-S. Holoien et al.
assumes a Euclidean slope below the break magnitude and avariable slope above it. We used Markov Chain Monte Carlomethods to derive the parameters of the fit. Similar to whatwe found in the 2016 catalog, we find that the best-fit breakmagnitude is m = 16.24±0.11 for the total sample, meaningthat the number counts are consistent with a Euclidean slopefor magnitudes brighter than 16.24.
The integral completeness of our total sample relativeto Euclidean predictions is 0.95 ± 0.03 at m = 16.5 and0.73 ± 0.03 at m = 17.0. The differential completeness rel-ative to Euclidean predictions is 0.71 ± 0.07 at m = 16.5and 0.36 ± 0.04 at m = 17.0. These results are very sim-ilar to what we found in Holoien et al. (2017c) and implythat roughly 70% of the SNe brighter than mpeak = 17 androughly 30% of the mpeak = 17 SNe are being found. Wenote that the Euclidean approximation we use for this anal-ysis does not account for deviations from Euclidean geome-try, K-corrections, or the effects of time dilation on SN rates,so it likely underestimates the true completeness for faintsupernovae slightly. We will include these higher order cor-rections when carrying out an analysis of nearby supernovarates in future work.
4 CONCLUSIONS
This manuscript presents a catalog of bright, spectroscop-ically confirmed SNe and their hosts, totaling 308 new su-pernovae discovered in 2017. Our full combined bright SNsample now includes 949 SNe, with 528 of these discoveredby ASAS-SN and an additional 216 independently recoveredby ASAS-SN after discovery. The ASAS-SN sample contin-ues to closely resemble an ideal magnitude-limited sampledefined by Li et al. (2011), while the combined sample hasa similar distribution but with a larger proportion of core-collapse SNe relative to Type Ia SNe than expected.
ASAS-SN remains the only professional survey to pro-vide a rapid-cadence, all-sky survey of bright transients, andwith the expansion of our telescope network in 2017, it willhave an even greater impact on the discovery of bright SNegoing forward. The ATLAS survey is now the primary com-petitor to ASAS-SN for new bright SN discoveries, thoughamateur astronomers still discover a significant fraction ofthe brightest SNe and discover the third most SNe in our2017 sample overall. Despite the advent of recent profes-sional surveys like ATLAS, ASAS-SN continues to find SNecloser to galactic nuclei than its competitors (Figure 2), andfinds SNe that would not be found otherwise (Figure 4). Asin 2015 and 2016, ASAS-SN recovered the majority of non-ASAS-SN discoveries in 2017, and it recovered or discoveredall supernovae with mpeak 6 15.3 in 2017.
Similar to what we found in Holoien et al. (2017c),our total sample is roughly complete to a peak magni-tude of mpeak = 16.2, and is roughly 70% complete formpeak 6 17.0. This analysis served as the precursor to ourfirst supernova rates paper, where we found that the specificType Ia supernova rate rises as host galaxy mass decreases(Brown et al. 2018). Manuscripts with further rate calcula-tions with respect to other host properties (e.g., star forma-tion rate and metallicity) and an overall nearby supernovarate paper are in preparation, and will have a significant im-pact on a number of fields of astronomy, including the nearby
core-collapse rate (e.g., Horiuchi et al. 2011, 2013) and multi-messenger studies ranging from gravitational waves (e.g.,Ando et al. 2013; Nakamura et al. 2016), to MeV gammarays from Type Ia supernovae (e.g., Horiuchi & Beacom2010; Diehl et al. 2014; Churazov et al. 2015) to GeV–TeVgamma rays and neutrinos from rare types of core-collapsesupernovae (e.g., Ando & Beacom 2005; Murase et al. 2011;Abbasi et al. 2012). Joint measurements such as these willgreatly increase the scientific reach of ASAS-SN.
This is the fourth of a yearly series of catalogs of brightSNe and their hosts provided by the ASAS-SN team. Thesecatalogs are intended to provide useful data repositories forbright SN and host galaxy properties that can be used fornew and interesting population studies. As ASAS-SN con-tinues to dominate the discovery of the best and brightesttransients in the sky, this is just one way in which we canleverage our unbiased sample to improve supernova research.
ACKNOWLEDGMENTS
The authors thank Las Cumbres Observatory and its stafffor their continued support of ASAS-SN.
ASAS-SN is supported by the Gordon and Betty MooreFoundation through grant GBMF5490 to the Ohio StateUniversity and NSF grant AST-1814440. Development ofASAS-SN has been supported by NSF grant AST-0908816,the Center for Cosmology and AstroParticle Physics at theOhio State University, the Mt. Cuba Astronomical Founda-tion, the Chinese Academy of Sciences South America Cen-ter for Astronomy (CASSACA), and by George Skestos.
This material is based upon work supported by theNational Science Foundation Graduate Research FellowshipProgram Under Grant No. DGE-1343012. JSB, KZS, andCSK are supported by NSF grant AST-181440. KZS andCSK are also supported by NSF grant AST-1515876. Sup-port for JLP is provided in part by FONDECYT throughthe grant 1151445 and by the Ministry of Economy, Develop-ment, and Tourism’s Millennium Science Initiative throughgrant IC120009, awarded to The Millennium Institute ofAstrophysics, MAS. SD, SB, and PC acknowledge Project11573003 supported by NSFC. JFB is supported by NSFgrant PHY-1714479. MDS is supported by generous grantsfrom the Villum foundation (grant 13261) and the Indepen-dent Research Fund Denmark. TAT is supported in partby Scialog Scholar grant 24215 from the Research Corpora-tion. PRW acknowledges support from the US Departmentof Energy as part of the Laboratory Directed Research andDevelopment program at LANL.
This research uses data obtained through the TelescopeAccess Program (TAP), which has been funded by “theStrategic Priority Research Program-The Emergence of Cos-mological Structures” of the Chinese Academy of Sciences(Grant No.11 XDB09000000) and the Special Fund for As-tronomy from the Ministry of Finance.
This research has made use of the XRT Data AnalysisSoftware (XRTDAS) developed under the responsibility ofthe ASI Science Data Center (ASDC), Italy. At Penn Statethe NASA Swift program is support through contract NAS5-00136.
This research was made possible through the use of the
MNRAS 484, 1899–1911 (2019)

ASAS-SN Bright SN Catalog 2017 11
AAVSO Photometric All-Sky Survey (APASS), funded bythe Robert Martin Ayers Sciences Fund.
This research has made use of data provided by Astrom-etry.net (Barron et al. 2008; Lang et al. 2010).
This paper uses data products produced by the OIRTelescope Data Center, supported by the Smithsonian As-trophysical Observatory.
Observations made with the NASA Galaxy EvolutionExplorer (GALEX) were used in the analyses presented inthis manuscript. Some of the data presented in this paperwere obtained from the Mikulski Archive for Space Tele-scopes (MAST). STScI is operated by the Association ofUniversities for Research in Astronomy, Inc., under NASAcontract NAS5-26555. Support for MAST for non-HST datais provided by the NASA Office of Space Science via grantNNX13AC07G and by other grants and contracts.
Funding for SDSS-III has been provided by the Al-fred P. Sloan Foundation, the Participating Institutions,the National Science Foundation, and the U.S. Depart-ment of Energy Office of Science. The SDSS-III web siteis http://www.sdss3.org/.
This publication makes use of data products from theTwo Micron All Sky Survey, which is a joint project of theUniversity of Massachusetts and the Infrared Processing andAnalysis Center/California Institute of Technology, fundedby NASA and the National Science Foundation.
This publication makes use of data products from theWide-field Infrared Survey Explorer, which is a joint projectof the University of California, Los Angeles, and the JetPropulsion Laboratory/California Institute of Technology,funded by NASA.
This research is based in part on observations obtainedat the Southern Astrophysical Research (SOAR) telescope,which is a joint project of the Ministerio da Ciencia, Tecnolo-gia, e Inovacao (MCTI) da Republica Federativa do Brasil,the U.S. National Optical Astronomy Observatory (NOAO),the University of North Carolina at Chapel Hill (UNC), andMichigan State University (MSU).
The Liverpool Telescope is operated on the island of LaPalma by Liverpool John Moores University in the SpanishObservatorio del Roque de los Muchachos of the Institutode Astrofisica de Canarias with financial support from theUK Science and Technology Facilities Council.
This research has made use of the NASA/IPAC Ex-tragalactic Database (NED), which is operated by the JetPropulsion Laboratory, California Institute of Technology,under contract with NASA.
REFERENCES
Abbasi R., et al., 2012, A&A, 539, A60
Ando S., Beacom J. F., 2005, Physical Review Letters, 95, 061103Ando S., et al., 2013, Reviews of Modern Physics, 85, 1401
Barron J. T., Stumm C., Hogg D. W., Lang D., Roweis S., 2008,AJ, 135, 414
Blondin S., Tonry J. L., 2007, ApJ, 666, 1024
Bose S., Dong S., Klusmeyer J., Prieto J. L., Shields J., Stanek
K. Z., 2017, The Astronomer’s Telegram, 10047Bose S., et al., 2018a, preprint, (arXiv:1810.12304)
Bose S., et al., 2018b, ApJ, 862, 107Brimacombe J., et al., 2017a, The Astronomer’s Telegram, 9939Brimacombe J., et al., 2017b, The Astronomer’s Telegram, 9951
Brimacombe J., et al., 2017c, The Astronomer’s Telegram, 9965
Brimacombe J., et al., 2017d, The Astronomer’s Telegram, 9998Brimacombe J., et al., 2017e, The Astronomer’s Telegram, 9999
Brimacombe J., et al., 2017f, The Astronomer’s Telegram, 10000
Brown T. M., et al., 2013, PASP, 125, 1031Brown J. S., Shappee B. J., Holoien T. W.-S., Stanek K. Z.,
Kochanek C. S., Prieto J. L., 2016, MNRAS, 462, 3993
Brown J. S., Holoien T. W.-S., Auchettl K., Stanek K. Z.,Kochanek C. S., Shappee B. J., Prieto J. L., Grupe D., 2017a,
MNRAS, 466, 4904
Brown J. S., et al., 2017b, The Astronomer’s Telegram, 9952Brown J. S., et al., 2018, preprint, (arXiv:1810.00011)
Chambers K. C., et al., 2016, preprint, (arXiv:1612.05560)Churazov E., et al., 2015, ApJ, 812, 62
Cikota A., et al., 2017, The Astronomer’s Telegram, 9945
Diehl R., et al., 2014, Science, 345, 1162Dong S., et al., 2016, Science, 351, 257
Drout M. R., Holoien T. W.-S., Shappee B. J., 2017, The As-
tronomer’s Telegram, 10014Fabricant D., Cheimets P., Caldwell N., Geary J., 1998, PASP,
110, 79
Gal-Yam A., Mazzali P. A., Manulis I., Bishop D., 2013, PASP,125, 749
Godoy-Rivera D., et al., 2017, MNRAS, 466, 1428
Harutyunyan A. H., et al., 2008, A&A, 488, 383Herczeg G. J., et al., 2016, preprint, (arXiv:1607.06368)
Holoien T. W.-S., et al., 2014a, MNRAS, 445, 3263Holoien T. W.-S., et al., 2014b, ApJ, 785, L35
Holoien T. W.-S., et al., 2016a, Acta Astron., 66, 219
Holoien T. W.-S., et al., 2016b, MNRAS, 455, 2918Holoien T. W.-S., et al., 2016c, MNRAS, 463, 3813
Holoien T. W.-S., et al., 2017a, MNRAS, 464, 2672
Holoien T. W.-S., et al., 2017b, MNRAS, 467, 1098Holoien T. W.-S., et al., 2017c, MNRAS, 471, 4966
Holoien T. W.-S., Brown J. S., Auchettl K., Kochanek C. S.,
Prieto J. L., Shappee B. J., Van Saders J., 2018, MNRAS,480, 5689
Horiuchi S., Beacom J. F., 2010, ApJ, 723, 329
Horiuchi S., Beacom J. F., Kochanek C. S., Prieto J. L., StanekK. Z., Thompson T. A., 2011, ApJ, 738, 154
Horiuchi S., Beacom J. F., Bothwell M. S., Thompson T. A., 2013,ApJ, 769, 113
Kato T., et al., 2014a, PASJ, 66, 30
Kato T., et al., 2014b, PASJ, 66, 90Kato T., et al., 2015, PASJ, 67, 105
Kato T., et al., 2016, PASJ, 68, 65
Kilpatrick C. D., Pan Y.-C., Foley R. J., Jha S. W., Rest A.,Scolnic D., 2017, The Astronomer’s Telegram, 10032
Kochanek C. S., et al., 2001, ApJ, 560, 566
Krannich G., et al., 2017, The Astronomer’s Telegram, 10022Lang D., Hogg D. W., Mierle K., Blanton M., Roweis S., 2010,
AJ, 139, 1782
Leloudas G., et al., 2016, Nature Astronomy, 1, 0002Li W., et al., 2011, MNRAS, 412, 1441
Masi G., et al., 2017, The Astronomer’s Telegram, 9989Morrissey P., et al., 2007, ApJS, 173, 682
Murase K., Thompson T. A., Lacki B. C., Beacom J. F., 2011,Physical Review D, 84, 043003
Nakamura K., Horiuchi S., Tanaka M., Hayama K., Takiwaki T.,Kotake K., 2016, MNRAS, 461, 3296
Nyholm A., et al., 2017, The Astronomer’s Telegram, 9980Post R. S., et al., 2017a, The Astronomer’s Telegram, 9944
Post R. S., et al., 2017b, The Astronomer’s Telegram, 9948Post R. S., et al., 2017c, The Astronomer’s Telegram, 9957Prieto J. L., et al., 2016, preprint, (arXiv:1609.00013)Romero-Canizales C., Prieto J. L., Chen X., Kochanek C. S.,
Dong S., Holoien T. W.-S., Stanek K. Z., Liu F., 2016,preprint, (arXiv:1609.00010)
MNRAS 484, 1899–1911 (2019)

12 T. W.-S. Holoien et al.
Rui L., Wang X., Xiang D., Wu H., Jia J., Zhai M., Zhang T.,
Zhang J., 2017, The Astronomer’s Telegram, 9997SDSS Collaboration et al., 2016, preprint, (arXiv:1608.02013)
Schlafly E. F., Finkbeiner D. P., 2011, ApJ, 737, 103
Schmidt S. J., et al., 2014, ApJ, 781, L24Schmidt S. J., et al., 2016, ApJ, 828, L22
Shappee B. J., et al., 2014, ApJ, 788, 48
Shappee B. J., et al., 2016, ApJ, 826, 144Skrutskie M. F., et al., 2006, AJ, 131, 1163
Taddia F., et al., 2017, The Astronomer’s Telegram, 9968
Tonry J. L., 2011, PASP, 123, 58Tonry J. L., et al., 2018, PASP, 130, 064505
Tucker M. A., et al., 2018, preprint, (arXiv:1808.07875)Vallely P. J., et al., 2019, arXiv e-prints,
Wright E. L., et al., 2010, AJ, 140, 1868
Yaron O., Gal-Yam A., 2012, PASP, 124, 668
MNRAS 484, 1899–1911 (2019)

ASAS-SN Bright SN Catalog 2017 13
Table
1.
AS
AS
-SN
Su
per
novae
IAU
Dis
covery
Off
set
Age
SN
Nam
eN
am
eD
ate
RA
aD
ec.a
Redsh
ift
mb disc
Vc peak
gc peak
(arc
sec)d
Typ
eat
Dis
c.e
Host
Nam
ef
Dis
covery
AT
el
Cla
ssifi
cati
on
AT
el
ASA
SSN
-17ac
2017ad
2017-0
1-0
4.3
614:3
4:2
6.0
1−
38:2
8:0
9.7
00.0
3332
16.6
16.3
—6.0
9Ia
−6
2M
ASX
J14342552
Bri
macom
be
et
al.
(2017a)
Cik
ota
et
al.
(2017)
ASA
SSN
-17ad
2017ah
2017-0
1-0
4.5
511:1
0:0
1.9
5+
63:3
8:3
4.1
60.0
3286
17.3
15.9
—3.8
2Ia
−11
CG
CG
314-0
11
Post
et
al.
(2017a)
TN
SA
SA
SSN
-17ae
2017ai
2017-0
1-0
4.6
616:1
7:0
2.6
2+
10:4
1:3
6.1
70.0
5027
17.5
17.6
—11.5
0Ia
−3
2M
ASX
J16170338
Post
et
al.
(2017b)
TN
SA
SA
SSN
-17af
2017b
c2017-0
1-0
5.5
112:1
9:5
0.9
0−
06:5
1:2
0.4
50.0
2687
17.0
16.4
—4.4
7Ia
−4
MC
G-0
1-3
2-0
01
Bri
macom
be
et
al.
(2017b)
Cik
ota
et
al.
(2017)
ASA
SSN
-17ai
2017hl
2017-0
1-0
9.6
312:0
7:1
8.8
3+
16:5
0:2
6.0
20.0
2307
17.3
16.7
—4.7
4Ib
−7
KU
G1204+
171
Bro
wn
et
al.
(2017b)
Taddia
et
al.
(2017)
ASA
SSN
-17aj
2017hm
2017-0
1-0
9.6
211:3
3:1
0.5
0−
10:1
3:1
8.3
70.0
2128
16.9
15.8
—25.5
0Ia
−13
MC
G-0
2-3
0-0
03
Bro
wn
et
al.
(2017b)
Taddia
et
al.
(2017)
ASA
SSN
-17am
2017hq
2017-0
1-1
0.6
613:4
9:2
3.8
1+
08:3
0:2
7.6
20.0
3798
17.6
16.5
—2.2
1Ia
18
CG
CG
073-0
79
Post
et
al.
(2017c)
TN
SA
SA
SSN
-17ap
2017je
2017-0
1-0
3.1
100:3
7:3
7.5
9−
34:2
9:4
9.2
40.0
4500
17.4
16.8
—8.9
4Ia
−10
GA
LE
XA
SC
J003737
Bri
macom
be
et
al.
(2017c)
Dro
ut
et
al.
(2017)
ASA
SSN
-17at
2017ln
2017-0
1-1
9.5
411:3
8:3
3.6
6+
25:2
3:5
0.1
70.0
2536
16.7
16.4
—3.0
8Ia
−9
2M
ASX
J11383367
Masi
et
al.
(2017)
Nyholm
et
al.
(2017)
ASA
SSN
-17bb
2017ng
2017-0
1-2
3.6
515:2
0:4
0.7
5+
04:3
9:3
4.4
20.0
3700
16.9
16.7
—1.8
6Ia
−3
2M
ASX
J15204087
Bri
macom
be
et
al.
(2017d)
Dro
ut
et
al.
(2017)
ASA
SSN
-17b
c2017nh
2017-0
1-2
3.3
607:1
0:1
3.5
2+
27:1
2:0
9.9
70.0
6100
17.6
16.8
—6.1
8Ia
12M
ASX
J07101346
Bri
macom
be
et
al.
(2017e)
Rui
et
al.
(2017)
ASA
SSN
-17b
d2017nk
2017-0
1-2
3.6
115:5
9:1
8.4
3+
13:3
6:5
0.8
90.0
3455
17.3
17.1
—3.0
0Ia
32M
ASX
J15591858
Bri
macom
be
et
al.
(2017f)
Dro
ut
et
al.
(2017)
ASA
SSN
-17b
e2017pa
2017-0
1-1
7.0
702:0
3:1
0.5
3−
61:4
1:1
0.6
10.0
4000
17.5
17.0
—0.5
1Ia
−1
2M
ASX
J02031063
Bri
macom
be
et
al.
(2017f)
Bri
macom
be
et
al.
(2017f)
ASA
SSN
-17bh
2017p
o2017-0
1-2
6.6
116:0
3:5
1.7
0+
39:5
9:2
4.1
70.0
3186
16.6
15.8
—14.5
2Ia
−3
CG
CG
223-0
33
Dro
ut
et
al.
(2017)
Kilpatr
ick
et
al.
(2017)
ASA
SSN
-17bn
2017vu
2017-0
1-2
1.4
308:5
9:2
3.9
2−
09:5
2:2
9.3
20.0
4451
17.6
17.0
—0.6
1Ia
−2
2M
ASX
J08592386
Kilpatr
ick
et
al.
(2017)
Kilpatr
ick
et
al.
(2017)
ASA
SSN
-17b
o2017w
b2017-0
1-2
8.5
911:0
1:1
9.5
3+
70:3
9:5
4.7
60.0
3000
16.9
16.3
—1.9
1Ia
−9
2M
ASX
J11011991
Kra
nnic
het
al.
(2017)
Kra
nnic
het
al.
(2017)
ASA
SSN
-17bp
2017w
i2017-0
1-2
9.0
502:0
2:0
8.6
3−
17:5
9:5
6.3
60.0
5100
17.2
17.0
—3.4
5Ia
7G
AL
EX
ASC
J020208
Kra
nnic
het
al.
(2017)
Bose
et
al.
(2017)
ASA
SSN
-17b
q2017xx
2017-0
1-2
7.5
107:2
5:3
8.2
1+
59:0
0:0
9.6
30.0
4000
17.6
16.4
—1.5
1Ia
19
GA
LE
XA
SC
J072538
Kra
nnic
het
al.
(2017)
Kra
nnic
het
al.
(2017)
ASA
SSN
-17br
2017xy
2017-0
1-2
9.6
315:5
2:0
0.3
1+
66:1
8:5
5.2
70.0
2600
17.1
18.1
—3.7
1II
P10
GA
LE
XA
SC
J155200
Kra
nnic
het
al.
(2017)
Kilpatr
ick
et
al.
(2017)
ASA
SSN
-17bs
2017yh
2017-0
1-3
0.6
617:5
2:0
6.1
3+
21:3
3:5
7.8
20.0
2040
16.5
15.9
—13.0
2Ia
−8
IC1269
Kilpatr
ick
et
al.
(2017)
Bose
et
al.
(2017)
This
table
isavailable
init
senti
rety
ina
machin
e-r
eadable
form
inth
eonline
journ
al.
Ap
ort
ion
issh
ow
nhere
for
guid
ance
regard
ing
its
form
and
conte
nt.
aR
ight
asc
ensi
on
and
declinati
on
are
giv
en
inth
eJ2000
ep
och.
bD
iscovery
magnit
udes
are
V-
org-b
and
magnit
udes
from
ASA
S-S
N,
dep
endin
gon
the
cam
era
use
dfo
rdis
covery
.c
Peak
V-
and
g-b
and
magnit
udes
are
measu
red
from
ASA
S-S
Ndata
.d
Off
set
indic
ate
sth
eoff
set
of
the
sup
ern
ova
inarc
seconds
from
the
coord
inate
sof
the
host
nucle
us,
taken
from
NE
D.
eD
iscovery
ages
are
giv
en
indays
rela
tive
top
eak.
All
ages
are
appro
xim
ate
and
are
only
list
ed
ifa
cle
ar
age
was
giv
en
inth
ecla
ssifi
cati
on
tele
gra
m.
e“2M
ASSX
”and
“G
AL
EX
ASC
”host
nam
es
have
been
abbre
via
ted
due
tosp
ace
const
rtain
ts.
Table
2.
Non
-AS
AS
-SN
Su
per
novae
IAU
Dis
covery
Off
set
SN
Nam
eN
am
eD
ate
RA
aD
ec.a
Redsh
ift
mb peak
Vc peak
gc peak
(arc
sec)d
Typ
eH
ost
Nam
eD
iscovere
dB
ye
Recovere
d?f
AT
LA
S17abh
2017ae
2017-0
1-0
4.2
902:0
5:5
0.6
2+
18:2
2:3
0.2
30.0
22000
16.4
16.2
—4.7
4Ia
GA
LE
XA
SC
J020550
AT
LA
SY
es
2017hr
2017hr
2017-0
1-0
6.6
912:0
6:2
7.3
9+
28:0
8:1
9.7
00.0
29300
16.6
17.0
—1.3
8Ia
SD
SS
J120627.4
6A
mate
urs
Yes
PS17hj
2017jd
2017-0
1-0
9.2
123:3
4:3
6.4
7−
04:3
2:0
4.3
20.0
07368
14.6
——
1.2
6Ia
IC5334
Pan-S
TA
RR
SN
o2017hn
2017hn
2017-0
1-0
9.4
113:0
7:3
9.4
6+
06:2
0:1
4.6
00.0
23853
16.1
15.8
—4.6
6Ia
UG
C08204
Am
ate
urs
Yes
AT
LA
S17ajn
2017lv
2017-0
1-1
4.6
311:4
4:2
6.5
4−
28:2
7:2
7.2
20.0
28717
17.0
16.7
—18.4
8Ia
ESO
440-G
001
AT
LA
SY
es
MA
ST
ER
OT
J081506.1
3+
381123.3
—2017-0
1-1
6.0
208:1
5:6
.13
+38:1
1:2
3.3
00.0
54000
16.9
16.6
—11.3
5Ia
2M
ASX
J08150520
MA
ST
ER
No
AT
LA
S17air
2017jl
2017-0
1-1
6.2
200:5
7:3
1.9
0+
30:1
1:0
6.8
30.0
16331
14.6
15.3
—5.8
8Ia
2M
ASX
J00573150
AT
LA
SY
es
2017m
f2017m
f2017-0
1-2
1.0
914:1
6:3
1.0
+39:3
5:1
2.0
20.0
25678
16.0
15.9
—12.6
IaN
GC
5541
Am
ate
urs
Yes
PT
SS-1
7dfc
2017m
s2017-0
1-2
1.7
110:2
6:4
2.3
7+
36:4
0:5
0.6
20.0
24639
15.6
15.7
—5.2
2Ia
SD
SS
J102641.9
9P
TSS
Yes
AT
LA
S17akw
2017nt
2017-0
1-2
3.2
123:5
3:3
1.1
3+
03:4
4:0
8.1
80.0
38800
16.8
——
34.3
8Ia
-91T
SST
SL
2J235328.8
9A
TL
AS
No
AT
LA
S17alb
2017ns
2017-0
1-2
3.3
102:4
9:1
0.3
6+
14:3
6:0
2.4
80.0
27900
16.7
——
2.8
8Ia
2M
ASX
J02491020
AT
LA
SN
oA
TL
AS17am
z2017pn
2017-0
1-2
6.3
104:4
6:2
4.5
9−
11:5
9:1
8.2
50.0
14000
16.5
15.8
—0
IIP
Uncata
logued
AT
LA
SN
oA
TL
AS17auc
2017zd
2017-0
1-2
6.6
413:3
2:4
2.0
9−
21:4
8:0
4.3
50.0
2947
15.9
15.9
—1.3
8Ia
2M
ASX
J13324217
AT
LA
SY
es
AT
LA
S17axb
2017adj
2017-0
1-3
0.6
513:4
3:2
3.2
5−
19:5
6:3
7.1
30.0
30000
16.9
16.1
—3.8
4Ia
GA
LE
XA
SC
J134322
AT
LA
SY
es
Gaia
17aiq
2017ati
2017-0
2-0
6.4
309:4
9:5
6.7
0+
67:1
0:5
9.5
60.0
1305
16.0
16.2
—38.6
IIb
KU
G0945+
674
Gaia
Yes
DLT
17h
2017ahn
2017-0
2-0
8.3
610:3
7:1
7.4
5−
41:3
7:0
5.2
70.0
09255
15.8
15.3
—40.3
2II
NG
C3318
DLT
40
Yes
MA
ST
ER
OT
J083256.9
2-0
35128.1
2017cgr
2017-0
2-1
1.9
308:3
2:5
6.9
2−
03:5
1:2
8.1
00.0
30584
16.5
16.5
—5.8
2Ia
2M
ASX
J08325728
MA
ST
ER
Yes
PS17bbn
2017avj
2017-0
2-1
4.5
813:0
5:3
.01
+53:3
9:3
3.2
10.0
29037
17.0
16.7
—19.4
4Ia
-91bg
CG
CG
270-0
47
Pan-S
TA
RR
SY
es
iPT
F17aub
2017aub
2017-0
2-1
5.3
06:4
0:2
4.7
0+
64:3
3:0
2.7
50.0
16000
17.0
16.9
—10.0
2II
CG
CG
308-0
36
PT
FN
oA
TL
AS17bam
2017avl
2017-0
2-1
6.3
205:2
0:4
7.0
8+
03:1
5:2
4.5
50.0
27426
16.4
16.4
—23.4
6Ia
CG
CG
421-0
34
AT
LA
SY
es
This
table
isavailable
init
senti
rety
ina
machin
e-r
eadable
form
inth
eonline
journ
al.
Ap
ort
ion
issh
ow
nhere
for
guid
ance
regard
ing
its
form
and
conte
nt.
bR
ight
asc
ensi
on
and
declinati
on
are
giv
en
inth
eJ2000
ep
och.
cM
agnit
udes
are
taken
from
D.
W.
Bis
hop’s
Bri
ght
Sup
ern
ova
websi
te,
as
desc
rib
ed
inth
ete
xt,
and
may
be
from
diff
ere
nt
filt
ers
.d
All
V−
and
g−
band
peak
magnit
udes
are
measu
red
from
ASA
S-S
Ndata
for
case
sw
here
the
sup
ern
ova
was
dete
cte
d.
eO
ffse
tin
dic
ate
sth
eoff
set
of
the
sup
ern
ovae
inarc
seconds
from
the
coord
inate
sof
the
host
nucle
us,
taken
from
NE
D.
f“A
mate
urs
”in
dic
ate
sdis
covery
by
any
num
ber
of
non-p
rofe
ssio
nal
ast
ronom
ers
,as
desc
rib
ed
inth
ete
xt.
gIn
dic
ate
sw
heth
er
the
sup
ern
ova
was
indep
endentl
yre
covere
din
ASA
S-S
Ndata
or
not.
MNRAS 484, 1899–1911 (2019)

14 T. W.-S. Holoien et al.
Table
3.
AS
AS
-SN
Su
per
nova
Host
Gala
xie
s SN
SN
SN
Off
set
Gala
xy
Nam
eR
edsh
ift
Nam
eT
yp
e(a
rcse
c)
AV
am
NU
Vb
muc
mgc
mrc
mic
mzc
mJd
mH
dm
KS
d,e
mW
1m
W2
2M
ASX
J14342552-3
828081
0.0
3332
ASA
SSN
-17ac
Ia6.0
90.2
80
——
——
——
13.5
60.0
712.7
40.0
712.4
10.1
112.8
30.0
212.8
70.0
3C
GC
G314-0
11
0.0
3286
ASA
SSN
-17ad
Ia3.8
20.0
32
19.7
00.1
216.0
50.0
114.2
90.0
013.5
10.0
013.1
20.0
012.8
60.0
011.8
90.0
211.1
80.0
410.8
70.0
511.3
10.0
211.3
60.0
22M
ASX
J16170338+
1041359
0.0
5027
ASA
SSN
-17ae
Ia11.5
00.1
66
19.0
20.0
717.8
10.0
416.4
10.0
015.7
60.0
015.4
00.0
015.1
70.0
214.4
60.1
213.7
00.1
213.2
50.1
814.1
00.0
713.9
80.0
4M
CG
-01-3
2-0
01
0.0
2687
ASA
SSN
-17af
Ia4.4
70.1
02
16.9
20.0
2—
——
——
11.8
80.0
311.1
30.0
410.8
50.0
611.3
80.0
211.3
70.0
2K
UG
1204+
171
0.0
2307
ASA
SSN
-17ai
Ib4.7
40.1
29
17.5
00.0
416.6
00.0
115.5
50.0
015.0
90.0
014.8
80.0
014.6
60.0
113.8
10.0
513.0
90.0
712.9
70.0
913.0
90.0
312.9
50.0
3M
CG
-02-3
0-0
03
0.0
2128
ASA
SSN
-17aj
Ia25.5
00.1
14
17.8
00.0
3—
——
——
12.3
70.0
411.6
70.0
511.2
70.0
811.8
00.0
211.7
70.0
2C
GC
G073-0
79
0.0
3798
ASA
SSN
-17am
Ia2.2
10.0
77
17.1
70.0
416.2
20.0
114.5
30.0
013.7
10.0
013.3
30.0
012.9
80.0
012.1
80.0
411.4
40.0
511.1
80.0
812.0
50.0
212.1
30.0
3G
AL
EX
ASC
J003737.2
0-3
42957.7
0.0
4500
ASA
SSN
-17ap
Ia8.9
40.0
37
19.4
30.0
5—
——
——
>17.0
>16.4
15.4
40.0
6*
15.9
50.0
515.9
40.1
42M
ASX
J11383367+
2523532
0.0
2536
ASA
SSN
-17at
Ia3.0
80.0
75
—16.8
30.0
115.3
80.0
014.6
60.0
014.2
70.0
014.0
10.0
012.8
50.0
312.1
80.0
511.8
00.0
612.1
50.0
211.5
70.0
22M
ASX
J15204087+
0439331
0.0
3000
ASA
SSN
-17bb
Ia1.8
60.1
21
19.0
70.0
818.4
90.0
617.1
70.0
116.6
10.0
116.2
70.0
116.0
60.0
114.9
00.0
814.3
00.1
013.9
70.1
513.9
40.0
313.8
40.0
42M
ASX
J07101346+
2712041
0.0
6100
ASA
SSN
-17b
cIa
6.1
80.1
69
——
——
——
13.2
60.0
312.6
20.0
512.2
80.0
612.7
10.0
412.7
20.0
52M
ASX
J15591858+
1336487
0.0
3455
ASA
SSN
-17b
dIa
3.0
00.1
29
17.4
20.0
216.4
60.0
115.6
50.0
015.2
40.0
015.0
00.0
014.8
10.0
113.6
10.0
612.9
30.0
712.4
60.1
012.5
50.0
412.2
70.0
32M
ASX
J02031063-6
141105
0.0
4000
ASA
SSN
-17b
eIa
0.5
10.0
96
21.3
20.2
8—
——
——
12.9
80.0
412.2
60.0
511.9
00.0
812.1
20.0
212.1
70.0
2C
GC
G223-0
33
0.0
3186
ASA
SSN
-17bh
Ia14.5
20.0
38
18.9
90.0
6—
——
——
>17.0
>16.4
>15.6
——
2M
ASX
J08592386-0
952291
0.0
4451
ASA
SSN
-17bn
Ia0.6
10.1
01
21.0
80.2
1—
——
——
12.7
00.0
312.0
30.0
311.6
90.0
511.8
40.0
211.8
00.0
22M
ASX
J11011991+
7039548
0.0
3000
ASA
SSN
-17b
oIa
1.9
10.0
68
18.1
40.0
5—
——
——
14.8
10.0
814.2
20.1
113.8
70.1
313.8
00.0
313.6
90.0
3G
AL
EX
ASC
J020208.7
3-1
75958.3
0.0
5100
ASA
SSN
-17bp
Ia3.4
50.0
75
18.6
80.0
417.8
60.0
216.9
20.0
116.6
30.0
116.4
10.0
116.3
00.0
2>
17.0
>16.4
14.2
70.0
5*
14.7
80.0
314.5
30.0
5G
AL
EX
ASC
J072538.1
4+
590010.5
0.0
4000
ASA
SSN
-17b
qIa
1.5
10.1
36
21.5
90.3
6—
——
——
14.2
40.0
513.5
50.0
713.2
00.0
813.8
30.0
313.8
10.0
4G
AL
EX
ASC
J155200.1
6+
661851.6
0.0
2600
ASA
SSN
-17br
IIP
3.7
10.0
75
——
——
——
>17.0
>16.4
15.0
70.0
5*
15.5
80.0
315.7
30.0
7IC
1269
0.0
2040
ASA
SSN
-17bs
Ia13.0
20.2
43
16.1
10.0
1—
——
——
11.8
30.0
311.1
90.0
510.8
90.0
611.9
50.0
211.8
20.0
2
This
table
isavailable
init
senti
rety
ina
machin
e-r
eadable
form
inth
eonline
journ
al.
Ap
ort
ion
issh
ow
nhere
for
guid
ance
regard
ing
its
form
and
conte
nt.
Uncert
ain
tyis
giv
en
for
all
magnit
udes,
and
inso
me
case
sis
equal
tozero
.a
Gala
cti
cexti
ncti
on
taken
from
Schla
fly
&F
inkb
ein
er
(2011).
bN
om
agnit
ude
islist
ed
for
those
gala
xie
snot
dete
cte
din
GA
LE
Xsu
rvey
data
.c
No
magnit
ude
islist
ed
for
those
gala
xie
snot
dete
cte
din
SD
SS
data
or
those
locate
douts
ide
of
the
SD
SS
footp
rint.
dFor
those
gala
xie
snot
dete
cte
din
2M
ASS
data
,w
eass
um
ean
upp
er
lim
itof
the
fain
test
gala
xy
dete
cte
din
each
band
from
our
sam
ple
.e
KS
-band
magnit
udes
mark
ed
wit
ha
“*”
indic
ate
those
est
imate
dfr
om
the
WIS
EW
1-b
and
data
,as
desc
rib
ed
inth
ete
xt.
Table
4.
Non
-AS
AS
-SN
Su
per
nova
Host
Gala
xie
s
SN
SN
SN
Off
set
Gala
xy
Nam
eR
edsh
ift
Nam
eT
yp
e(a
rcse
c)
Aa V
mb N
UV
mc u
mc g
mc r
mc i
mc z
md J
md H
md,e
KS
mW
1m
W2
GA
LE
XA
SC
J020550.5
30.0
22000
AT
LA
S17abh
Ia4.7
40.2
03
21.2
60.2
720.2
50.2
218.3
60.0
217.7
10.0
217.3
50.0
117.1
30.0
4>
17.0
>16.4
15.1
70.0
6*
15.6
80.0
415.7
90.1
3SD
SS
J120627.4
6+
280820.6
0.0
29300
2017hr
Ia1.3
80.0
61
—21.4
90.1
320.4
80.0
319.5
80.0
219.1
40.0
218.8
10.0
5>
17.0
>16.4
15.6
90.0
7*
16.2
00.0
616.0
40.1
7IC
5334
0.0
07368
PS17hj
Ia1.2
60.1
14
16.9
60.0
415.2
20.0
113.4
70.0
012.7
00.0
012.2
80.0
011.9
60.0
011.0
20.0
210.3
40.0
210.1
10.0
410.5
10.0
210.5
80.0
2U
GC
08204
0.0
23853
2017hn
Ia4.6
60.0
91
17.3
50.0
416.0
30.0
114.5
40.0
013.7
90.0
013.3
80.0
013.0
60.0
011.9
00.0
411.1
70.0
510.8
60.0
811.2
60.0
311.1
50.0
2E
SO
440-G
001
0.0
28717
AT
LA
S17ajn
Ia18.4
80.2
06
17.4
00.0
5—
——
——
13.2
90.0
612.5
70.0
712.3
60.1
112.7
90.0
312.8
50.0
32M
ASX
J08150520+
3811205
0.0
54000
MA
ST
ER
OT
J081506
Ia11.3
50.1
01
18.9
40.0
616.9
50.0
315.4
60.0
114.7
70.0
014.2
80.0
013.9
90.0
113.8
00.0
613.1
60.0
912.6
60.0
913.3
20.0
413.1
00.0
42M
ASX
J00573150+
3011098
0.0
16331
AT
LA
S17air
Ia5.8
80.2
01
19.2
10.0
818.2
00.0
416.7
20.0
016.0
30.0
015.7
10.0
015.4
70.0
114.7
40.0
914.1
90.1
413.8
80.1
414.0
60.0
314.0
40.0
4N
GC
5541
0.0
25678
2017m
fIa
12.6
0.0
30
15.8
40.0
2—
——
——
11.1
70.0
110.4
30.0
210.0
70.0
211.0
00.0
310.8
20.0
2SD
SS
J102641.9
9+
364053.2
0.0
24639
PT
SS-1
7dfc
Ia5.2
20.0
27
19.0
10.0
618.2
30.0
317.0
90.0
116.6
70.0
116.4
40.0
116.3
40.0
3>
17.0
>16.4
14.5
90.0
6*
15.1
00.0
415.1
30.0
8SST
SL
2J235328.8
9+
034400
0.0
38800
AT
LA
S17akw
Ia-9
1T
34.3
80.1
36
—21.9
60.2
720.4
20.0
319.2
40.0
218.6
90.0
218.3
20.0
4>
17.0
>16.4
14.4
80.0
6*
14.9
90.0
414.3
00.0
52M
ASX
J02491020+
1436036
0.0
27900
AT
LA
S17alb
Ia2.8
80.2
99
19.5
10.1
1—
——
——
13.3
10.0
412.5
70.0
412.2
30.0
712.2
90.0
312.2
40.0
3U
ncata
logued
0.0
14000
AT
LA
S17am
zII
P0
0.3
84
——
——
——
>17.0
>16.4
14.8
40.0
5*
15.3
50.0
315.1
90.0
72M
ASX
J13324217-2
148034
0.0
2947
AT
LA
S17auc
Ia1.3
80.2
32
19.3
40.1
0—
——
——
13.6
60.0
512.9
00.0
512.5
60.0
913.0
60.0
413.0
50.0
4G
AL
EX
ASC
J134322.9
70.0
30000
AT
LA
S17axb
Ia3.8
40.3
00
20.9
60.3
3—
——
——
>17.0
>16.4
13.6
10.0
5*
14.1
20.0
313.9
80.0
4K
UG
0945+
674
0.0
1305
Gaia
17aiq
IIb
38.6
0.3
27
——
——
——
>17.0
>16.4
14.6
70.0
5*
15.1
80.0
314.9
10.0
6N
GC
3318
0.0
09255
DLT
17h
II40.3
20.2
12
——
——
——
10.0
70.0
29.4
10.0
39.1
00.0
310.3
50.0
210.2
30.0
22M
ASX
J08325728-0
351295
0.0
30584
MA
ST
ER
OT
J083256
Ia5.8
20.1
00
20.4
10.1
417.3
20.0
215.4
70.0
014.6
40.0
014.2
50.0
013.9
60.0
012.7
00.0
412.1
20.0
511.8
20.0
912.1
10.0
212.1
70.0
2C
GC
G270-0
47
0.0
29037
PS17bbn
Ia-9
1bg
19.4
40.0
52
18.5
00.0
616.4
10.0
114.6
00.0
013.8
30.0
013.4
10.0
013.1
10.0
012.3
40.0
311.6
40.0
411.3
40.0
611.6
70.0
211.6
70.0
2C
GC
G308-0
36
0.0
16000
iPT
F17aub
II10.0
20.2
29
17.5
90.0
316.4
40.0
215.1
10.0
014.4
90.0
014.1
80.0
013.9
80.0
113.3
30.0
512.7
30.0
812.4
80.1
013.2
10.0
313.1
30.0
3C
GC
G421-0
34
0.0
27426
AT
LA
S17bam
Ia23.4
60.3
19
—16.6
10.0
114.6
90.0
013.7
60.0
013.3
20.0
012.9
90.0
011.8
60.0
311.1
80.0
310.8
40.0
611.1
70.0
211.1
90.0
2
This
table
isavailable
init
senti
rety
ina
machin
e-r
eadable
form
inth
eonline
journ
al.
Ap
ort
ion
issh
ow
nhere
for
guid
ance
regard
ing
its
form
and
conte
nt.
Uncert
ain
tyis
giv
en
for
all
magnit
udes,
and
inso
me
case
sis
zero
.“M
AST
ER
”su
pern
ova
nam
es
and
“G
AL
EX
ASC
”gala
xy
nam
es
have
been
abbre
via
ted.
aG
ala
cti
cexti
ncti
on
taken
from
Schla
fly
&F
inkb
ein
er
(2011).
bN
om
agnit
ude
islist
ed
for
those
gala
xie
snot
dete
cte
din
GA
LE
Xsu
rvey
data
.c
No
magnit
ude
islist
ed
for
those
gala
xie
snot
dete
cte
din
SD
SS
data
or
those
locate
douts
ide
of
the
SD
SS
footp
rint.
dFor
those
gala
xie
snot
dete
cte
din
2M
ASS
data
,w
eass
um
ean
upp
er
lim
itof
the
fain
test
gala
xy
dete
cte
din
each
band
from
our
sam
ple
.e
KS
-band
magnit
udes
mark
ed
wit
ha
“*”
indic
ate
those
est
imate
dfr
om
the
WIS
EW
1-b
and
data
,as
desc
rib
ed
inth
ete
xt.
MNRAS 484, 1899–1911 (2019)