AS THE WORLD CHURNS, D0W 20,000, 21,000, 22,000 that "The American job machine continues - ......
12
This issue: Stock Performance Pages 2-3 Portfolio Review Pages 4-5 Fundamentals Pages 6-7 Portfolio HI-Lites Pages 8-9 Under the Spotlight Page 10 Fastenal Page 11 AbbVie Page 12 Express Scripts Editor: Ingrid R. Hendershot, CFA September 2017 Volume 24 Issue 3 As the world churns during the muggy dog days of summer, headlines have been horri- ble…fiery rhetoric with North Korea, terror in Barcelona and chaos in Charlottesville. The recent total solar eclipse provided a welcome respite from all the bad news. Despite a flood of adverse world events and the continued dysfunction in Washington, the Dow Jones Industrial Average continues to hit record highs and has crossed three major milestones this year. Every time the Dow hits another big round number such as 20,000, 21,000 and now 22,000, we hear many pundits predicting a market top. However, low interest rates, low unemployment and the most synchronized global growth in a decade continue to propel the stock market higher. ADP recently report- ed that "The American job machine continues to operate in high gear. Job gains are broad- based across industries and company sizes." Second quarter earnings season was sunny with many HI-quality companies reporting double-digit growth. Fastenal, a harbinger of future economic activity, returned to double- digit sales growth during the quarter, driven by an improvement in underlying market de- mand (see p. 10). MasterCard reported strong growth as consumer confidence around the world improved and consumers charged ahead with their purchases. Priceline booked double-digit sales and earnings growth thanks to robust summer travel around the globe. Alphabet, Google’s parent, reported a 21% increase in revenues due to strong prevailing winds in mobile search while Apple reported double-digit earnings growth as the firm gears up for the launch of the iPhone 8 supercycle. Indeed, as a result of the strong first half, many of our companies increased the altitude of their earnings guidance for the full year. Other HI-quality companies with a tidal wave of strong cash flows continued to raise their dividends during the quarter, including a sweet 21% increase by The Cheesecake Fac- tory, a 9% boost in the dividend paycheck by Paychex, a 6% dividend elevation by Unit- ed Technologies and a healthy 7% dividend hike by Walgreens Boots Alliance. After a long streak of calm in the stock market without a major sell-off, the market’s roller coaster ride has recently picked up speed. On Aug. 10, 2017, the Dow dropped 200 points due to the tensions between the U.S. and North Ko- rea. However, just 12 days later, the Dow regis- tered its biggest gain in four months closing up nearly 200 points on news that tax reform ef- forts might actually be gaining traction. We know that market corrections and bear mar- kets will occur in the future, but we cannot pre- dict when they will happen. Typically, a market correction of at least 10% occurs every couple of years while a bear market claws the market down 20% or more about once every five years. We prepare in advance for the inevitable downdrafts in the stock market by prudently setting asset allocations consistent with a cli- ent’s investment needs, risk-tolerance and in- vestment time horizon. We also invest in HI- quality companies that can easily weather Mr. Market’s periodic hurricanes. We closely moni- tor and focus on the individual business funda- mentals and valuations of the companies we own. Many of our stocks currently appear rea- sonably valued which bodes well for a jet stream of solid returns over the long term. When black clouds do occasionally appear, long-term investors who remain rational when Mr. Market gets emotional have benefited great- ly by investing in HI-quality businesses. Prior to the recent eclipse, America's last Pacific-to- Atlantic total solar eclipse occurred in 1919, when the Dow hit a record high of 120. Since then, despite a Great Depression, two world wars, financial panics, oil shocks and countless other market earthquakes, the Dow is now hov- ering around 22,000. Although short-term set- backs will occur on the Dow’s ascent, we fore- cast that by the time of the total lunar eclipse in 2040, long-term investors may not need eclipse glasses to see the Dow top 100,000, a very bright pot of gold at the end of the rainbow! AS THE WORLD CHURNS, D0W 20,000, 21,000, 22,000...
Transcript of AS THE WORLD CHURNS, D0W 20,000, 21,000, 22,000 that "The American job machine continues - ......

This issue: Stock Performance Pages 2-3 Portfolio Review Pages 4-5 Fundamentals Pages 6-7 Portfolio HI-Lites Pages 8-9 Under the Spotlight Page 10 Fastenal
Page 11 AbbVie Page 12 Express Scripts
Editor: Ingrid R. Hendershot, CFA September 2017 Volume 24 Issue 3
As the world churns during the muggy dog days of summer, headlines have been horri-ble…fiery rhetoric with North Korea, terror in Barcelona and chaos in Charlottesville. The recent total solar eclipse provided a welcome respite from all the bad news. Despite a flood of adverse world events and the continued dysfunction in Washington, the Dow Jones Industrial Average continues to hit record highs and has crossed three major milestones this year. Every time the Dow hits another big round number such as 20,000, 21,000 and now 22,000, we hear many pundits predicting a market top. However, low interest rates, low unemployment and the most synchronized global growth in a decade continue to propel the stock market higher. ADP recently report-ed that "The American job machine continues to operate in high gear. Job gains are broad-based across industries and company sizes." Second quarter earnings season was sunny with many HI-quality companies reporting double-digit growth. Fastenal, a harbinger of future economic activity, returned to double-digit sales growth during the quarter, driven by an improvement in underlying market de-mand (see p. 10). MasterCard reported strong growth as consumer confidence around the world improved and consumers charged ahead with their purchases. Priceline booked double-digit sales and earnings growth thanks to robust summer travel around the globe. Alphabet, Google’s parent, reported a 21% increase in revenues due to strong prevailing winds in mobile search while Apple reported double-digit earnings growth as the firm gears up for the launch of the iPhone 8 supercycle. Indeed, as a result of the strong first half, many of our companies increased the altitude of their earnings guidance for the full year. Other HI-quality companies with a tidal wave of strong cash flows continued to raise their dividends during the quarter, including a sweet 21% increase by The Cheesecake Fac-tory, a 9% boost in the dividend paycheck by Paychex, a 6% dividend elevation by Unit-
ed Technologies and a healthy 7% dividend hike by Walgreens Boots Alliance. After a long streak of calm in the stock market without a major sell-off, the market’s roller coaster ride has recently picked up speed. On Aug. 10, 2017, the Dow dropped 200 points due to the tensions between the U.S. and North Ko-rea. However, just 12 days later, the Dow regis-tered its biggest gain in four months closing up nearly 200 points on news that tax reform ef-forts might actually be gaining traction. We know that market corrections and bear mar-kets will occur in the future, but we cannot pre-dict when they will happen. Typically, a market correction of at least 10% occurs every couple of years while a bear market claws the market down 20% or more about once every five years. We prepare in advance for the inevitable downdrafts in the stock market by prudently setting asset allocations consistent with a cli-ent’s investment needs, risk-tolerance and in-vestment time horizon. We also invest in HI-quality companies that can easily weather Mr. Market’s periodic hurricanes. We closely moni-tor and focus on the individual business funda-mentals and valuations of the companies we own. Many of our stocks currently appear rea-sonably valued which bodes well for a jet stream of solid returns over the long term. When black clouds do occasionally appear, long-term investors who remain rational when Mr. Market gets emotional have benefited great-ly by investing in HI-quality businesses. Prior to the recent eclipse, America's last Pacific-to-Atlantic total solar eclipse occurred in 1919, when the Dow hit a record high of 120. Since then, despite a Great Depression, two world wars, financial panics, oil shocks and countless other market earthquakes, the Dow is now hov-ering around 22,000. Although short-term set-backs will occur on the Dow’s ascent, we fore-cast that by the time of the total lunar eclipse in 2040, long-term investors may not need eclipse glasses to see the Dow top 100,000, a very bright pot of gold at the end of the rainbow!
AS THE WORLD CHURNS, D0W 20,000, 21,000, 22,000...

Page 2 Hendershot Investments, Sept. 2017
STOCK PERFORMANCE Stock-Symbol
Business
Purchase Date(a) Price(b)
Price 8-25-17
Total (c) Return
Advice*
Comment
AbbVie-ABBV Pharmaceuticals 03-09-10 12-03-10
28.57 24.59
72.48 195% BUY Generated double-digit earnings growth in second quarter
Accenture-ACN Consulting 03-06-12 59.95 129.39 144% HOLD Free cash flow up 20% YTD to $2.7 billion
Alphabet, Cl A-GOOGL Alphabet, Cl A-GOOGL Alphabet, Cl C-GOOG
Technology
06-10-11 06-08-15 06-10-11
256.38 546.47 254.89
930.50 915.89
107% 259%
BUY
Free cash flow up 5% in first half to $12 billion; ended the half with $95
billion of cash
Apple-AAPL Computers, iPhones 09-07-10 36.97 159.86 360% HOLD 3Q EPS up 18%; ended the quarter with $261.5 billion in cash
Automatic Data Processing-ADP
Human capital mgmt. 03-09-16 85.62 104.59 25% HOLD Trimming position (see p. 4)
Baxter International-BAX Healthcare 09-09-09
30.86
61.51 102% HOLD Expects to generate $1.1 billion in free cash flow in 2017
Becton Dickinson-BDX Medical technology 03-13-02
36.74
198.57 501% HOLD Expects double-digit EPS growth in fiscal 2017
Berkshire Hathaway-BRKB
Insurance/diversified 12-28-94! 03-10-00 03-17-00
21.56 27.45 34.13
179.60 574% HOLD Free cash flow more than doubled in first half to $21.5 billion; ended
quarter with nearly $100 billion cash
Biogen-BIIB Biotechnology 09-09-15 286.19 285.06 0% BUY Repurchased $782 million of its own shares in 2Q
Bioverativ-BIVV Hemophilia products 09-09-15 48.15 55.61 15% BUY Raised 2017 sales growth outlook to 23%-25%
Brown-Forman-BFB Liquor 03-10-00 5.32 50.41 1,030% HOLD Generated a cheery 49% return on equity in fiscal 2017
Canadian National Railway-CNI
Railroad 06-28-15 58.05 79.60 41% BUY 2Q revenues +17% and EPS +24%
Cheesecake Factory-CAKE
Restaurants 09-02-16 51.25 41.63 -17% HOLD Increased dividend 21%
Cisco Systems-CSCO Internetworking 03-12-97
5.78 31.44 663% HOLD Ended fiscal 2017 with $70.5 billion in cash; dividend yields 3.7%
Cognizant Tech.-CTSH IT consulting 09-07-12 33.43 69.78 109% BUY Raised 2017 sales growth outlook to 9%-10% with EPS at least $3.67
Express Scripts-ESRX Healthcare mgmt. 12-13-96 03-09-11
1.18 53.99
60.79 164% BUY Free cash flow +92% in first half to $2 billion
F5 Networks-FFIV Network technology 09-09-15 121.84 117.60 -3% BUY $1.2 billion in cash and no long-term debt as of 3Q end
FactSet Research-FDS Financial information 03-14-14 104.42 159.27 58% BUY Annual client retention was greater than 92%
Fastenal-FAST Industrial supplies 03-10-00 06-10-14
4.89 50.50
41.46 19% BUY Adding to position (see p. 10)
Fluor-FLR Engineering 12-08-08 03-11-09 09-07-12
51.15 37.42 54.91
37.77 -16% HOLD Lowered 2017 EPS outlook to $1.40-$1.70
Gentex-GNTX Auto mirrors 12-08-15 16.29 17.94 14% BUY Authorized new 15 million share repurchase program
Genuine Parts-GPC Diversified distributor 03-10-00 09-09-15
20.81 84.10
83.30 34% BUY Expanded share repurchase program by 15 million shares; dividend yields 3.2% with the dividend increased for
61 consecutive years
*All recommendations made in this newsletter may not be suitable for every account, depending on an individual’s investment objective, risk-tolerance and financial situation. It should not be assumed that recommendations will be profitable or will equal the performance of securities listed here or recommended in the past. Clients should contact Hendershot Investments, Inc. if there are any changes in your financial situation or investment objectives, or if you wish to impose, add or modify any reasonable restrictions to the management of your account. (a) Date purchased for Hendershot IRA. See personal trading restrictions footnote on page 3. ! Received BRKB shares following acquisition of FlightSafety Int’l in Dec ‘96 and Int’l Dairy Queen in Jan ‘98 ( b) Price includes commissions paid. (c) Total return includes dividends. NI-Net Income, Q-quarter, H-half, YTD-year-to-date, ROE-return on equity

www.hendershotinvestments.com Page 3
(continued) Stock-Symbol
Business
Purchase Date(a) Price(b)
Price 8-25-17
Total (c) Return
Advice*
Comment
Hormel Foods-HRL Food 06-14-01 6.01 31.34 512% HOLD Acquiring Fontanini Italian Meats and Sausages for $425 million
Johnson & Johnson-JNJ Healthcare products 03-10-00 35.48 131.68 361% HOLD Raised sales and earnings outlook for 2017, reflecting recent acquisitions
3M-MMM Diversified 03-07-07 73.70 202.13 218% HOLD Free cash flow +41% in 2Q to $1.3 billion
MasterCard-MA Global payments 09-05-14 76.45 132.75 76% HOLD 2Q revenue +13%, EPS +24%
Maximus-MMS Business services 06-02-16 57.54 59.36 3% HOLD Free cash flow more than doubled YTD to $206 million
Microsoft-MSFT Software 06-07-07 12-03-10
30.16 26.94
72.82 191% HOLD Generated a 29% return on equity in 2017; ended year with $133 billion in cash
Nike-NKE Shoes and apparel 03-07-17 56.55 53.90 -4% BUY Generated 34% return on equity in 2017
Oracle-ORCL Software 09-05-13 32.32 49.24 59% HOLD Generated a 17% return on equity in 2017
Paychex-PAYX Payroll processing 12-03-10 08-31-11
29.49 27.28
56.22 135% HOLD Increased dividend 9%
PepsiCo-PEP Food and beverages 03-14-14 81.89 115.85 71% HOLD Expects to generate $7 billion in free cash flow in 2017
Polaris-PII Vehicles/snowmobiles/motorcycles
09-09-15 12-08-15
129.09 98.76
94.65 -20% HOLD Expects double-digit sales and EPS growth in 2017
Priceline Group-PCLN Online travel bookings 12-12-12 12-10-14
629.62 1,119.68
1793.48 105% BUY 2Q sales +18%, EPS +24%; ended quarter with $16.6 billion in cash
Qualcomm-QCOM Wireless technologies 06-06-13 62.83 52.03 -6% HOLD Dividend yields 4.3%
Ross Stores-ROST Off-price retailer 06-08-17 61.70 59.38 -4% BUY Expects double-digit EPS growth to $3.16-$3.23 in fiscal 2017
Starbucks-SBUX Coffee retailer 06-14-14 37.26 54.36 53% BUY Acquiring remaining 50% stake in Chinese joint venture for $1.3 billion
Stryker-SYK Medical technology 03-11-09 32.09 139.88 363% HOLD Acquiring NOVADAQ for $701 million
T. Rowe Price-TROW Investment mgmt. 08-31-11 09-05-14
53.98 80.59
83.90 38% HOLD Generated double-digit revenue and earnings growth in second quarter
The TJX Companies-TJX Off-price retailer 06-12-00 09-09-15
5.09 72.35
71.67 50% BUY HomeGoods sales increased 17% in 2Q; launched new store brand, HomeSense
United Parcel Service-UPS Package delivery 05-27-05 06-09-06 08-31-11
74.92 79.57 67.90
113.40 84%
BUY 2Q revenue +8% and EPS +11%; dividend yields 2.9%
United Technologies-UTX Diversified-building systems/aerospace
09-10-01 33.44 115.07 317% BUY Increased dividend 6% and has paid a dividend every year since 1936
Walgreens Boots Alliance-WBA
Drugstores 09-12-08 06-08-17
36.38 81.83
81.13 19% BUY Increased dividend 7%, marking 42nd consecutive dividend increase
Walt Disney-DIS Media/Entertainment 09-02-16 94.43 102.41 10% BUY Acquiring additional 42% stake in BAMTech for $1.58 billion
Wabtec-WAB Railway products 12-08-15 73.57 70.20 -4% HOLD Backlog +10% to $4.5 billion
Westwood Holdings-WHG Investment mgmt. 12-08-11 08-10-15
35.88 59.72
60.04 39% BUY 2Q revenue +9%, EPS +20%; dividend yields 4.1%
PERSONAL TRADING RESTRICTIONS FOR PRINCIPALS AND EMPLOYEES I take a long-term position in each stock recommended in this newsletter. Having earned the Chartered Financial Analyst (CFA) designation, I fully subscribe to the Code of Ethics and Standards of Professional Conduct of the CFA Institute. Accordingly, transactions for client accounts have priority over personal and employee transactions. To avoid any conflict of interest and to be fair to both my individual clients and subscribers, personal and employee trading is restricted to just four weeks a year. Personal and employee trading will occur only during the week following distribution of the newsletter to subscribers unless otherwise approved by the Chief Compliance Officer. The week following distribution of the newsletter will be measured as five business days after the mailing date of the newsletter. Positions may be purchased or sold for individually managed client accounts at any time and without regard to recommendations made in this newsletter.

Page 4 Hendershot Investments, Sept. 2017
owned 8% of ADP largely in deriva-tives. In connection with ADP’s 2017 annual meeting, ADP reported that Mr. Ackman was seeking effec-tive control of ADP through five Board seats as well as a CEO change. In response, ADP issued a state-ment, "Since Carlos Rodriguez be-came CEO nearly six years ago, ADP's total shareholder return of 202% is well in excess of the S&P 500 TSR of 128% -- and is many multiples of Pershing's TSR of 29%. We believe our current Board has an effective balance of leadership continuity and fresh perspectives that will help us to continue this strong track record of delivering value to shareholders while suc-cessfully executing on our 'All in on HCM' strategy." Pershing replied that they were not seeking the replacement of the CEO but did nominate three candi-dates for the ADP board, including Bill Ackman. Ackman then made a 168 slide presentation describing ADP as a “lethargic and inefficient sleeping giant” and said if the com-pany were optimally managed, ADP’s value could increase 101%-132% in less than four years. ADP responded, “We strongly disa-gree with many of the assertions made by Mr. Ackman in today's presentation, which betrays a fun-damental lack of understanding of the current state of ADP's business and strategy. He presented nothing that has not previously been ana-lyzed by the Board and manage-ment. ADP has also consistently delivered on its commitment to re-turn capital to shareholders -- demonstrated by $11.3 billion in share buybacks and dividends over the past five fiscal years and annual dividend increases for the last 42 years." ADP’s board voted unani-mously not to nominate any of Per-shing Capital Management’s three
PORTFOLIO REVIEW
DIVIDENDS
Since the last issue, the following dividends per share were received: AbbVie ($.64), Apple ($.63), ADP ($.60), Baxter ($.16), Becton Dickinson ($.73), Brown-Forman ($.20), Canadian National ($.32), Cheesecake Factory ($.24), Cisco ($.30), Cognizant ($.20), FactSet Research ($.60), Fastenal ($.32), Fluor ($.21), Gentex ($.10), Genuine Parts ($.70), Hormel Foods ($.20), Johnson & Johnson ($.84), MasterCard ($.22), Maximus ($.05), Microsoft ($.40), 3M ($1.18), Oracle ($.20), Paychex ($.50), Pepsi ($.80), Polaris ($.60), Qualcomm ($.60), Starbucks ($.30), Stryker ($.43), T. Rowe Price ($.60), TJX ($.31), United Parcel Services ($.83), United Technologies ($.70), Walgreen ($.40), Wabtec ($.10), Walt Disney ($.80) and Westwood Holdings ($.62).
candidates for election. However, ADP continued, “The Board is always open to good ideas regardless of their source. We look forward to en-gaging substantively with investors about ways to build on our success and continue delivering sustainable value to ADP shareholders." ADP’s board and Ackman have a meeting scheduled for Sept. 5 to engage in further discussions. Stay tuned for more on the battle between ADP and Ackman, the activist. As we vote the proxies for the annual meeting, our support will lie with ADP management as we believe that will be in the best interest of long-term shareholders. That being said, Ack-man’s activity caused ADP’s stock price to spike. As a result, we cur-rently believe ADP’s stock price ap-pears fully valued, so we plan to trim back our position. During the past year, ADP has provided a 25% total return.
******* With the profits from Automatic Data Processing, we plan to add to our Fastenal position (see p. 10). Per-sonal and employee purchases will be made during the week following distribution of this newsletter. (See Personal Trading restrictions in the box on p. 3.)
Automatic Data Processing (ADP) reported fourth quarter revenues rose 6% to $3.1 billion with net in-come down 6% to $265.8 million and EPS down 5% to $.59. Fourth quarter earnings were impacted by a contraction in margins as the com-pany is investing in product, sales and service including dual operation costs related to the service align-ment initiative. Client retention im-proved 60 basis points during the quarter but declined 50 basis points for the full year to 90%. For the full fiscal 2017 year, reve-nues rose 6% to $12.4 billion with net income up 16% to $1.7 billion and EPS up 18.5% to $3.85. World-wide new business bookings de-clined a disappointing 5% during the year to $1.65 billion due to uncer-tainty coming from Washington around healthcare reform and tough comparisons with the prior year bookings. Return on shareholders’ equity for the year was an impres-sive 43.6%. Free cash flow increased 9% during the year to $1.9 billion. During the year, ADP paid $995 million in divi-dends and repurchased $1.3 billion of its own shares. Management’s outlook for fiscal 2018 is for revenue growth of 5% to 6%, which assumes renewed growth in worldwide new business bookings of 5% to 7% from clients in 110 countries around the world. ADP expects reported EPS to decline 1% to 3% with adjusted EPS expected to increase 2% to 4%. Interest on funds held for clients is expected to increase 11% due to anticipated growth in average client funds bal-ances and a higher average yield earned on these balances. After ADP reported its financial re-sults for 2017, along came Bill Ack-man, the hedge fund manager of Pershing Square Capital Manage-ment, who stated he beneficially
AUTOMATIC DATA PROCESSING AND ACKMAN, THE ACTIVIST

www.hendershotinvestments.com Page 5
(continued)
REALIZED GAINS AND LOSSES OVER THE LAST 12 MONTHS
COMPANY DATE PURCHASED
DATE SOLD
GAIN/LOSS
COMMENT*
ABBOTT 03/09/10 12/03/10
06/08/17 06/08/17
+77% +106%
Significantly increased debt and fully valued, sold position
BAXTER INTERNATIONAL 09/09/09 03/14/14
06/08/17 06/08/17
+93% +61%
Fully valued, trimmed position
CISCO SYSTEMS 06/09/06 03/07/17 +70% Fully valued, trimmed position
COMPUTER PROGRAMS AND SYSTEMS
03/12/13 09/02/16 -52% Sold position due to higher debt, lower earnings and cash flow and a cut in the dividend following an acquisition
F5 NETWORKS 09/09/15 03/07/17 +17% Fairly valued, trimmed position
FASTENAL 06/10/14 03/07/17 +2% Fairly valued, trimmed position
GILEAD SCIENCES 12/03/10 09/05/14
03/07/17 03/07/17
+271% -32%
Sold position as business fundamentals deteriorated with sales and earnings declining and debt rising
MICHAEL KORS 03/12/15 03/07/17 -45% Sold position as business fundamentals deteriorated with sales and earnings declining
MICROSOFT 06/07/07 09/02/16 +92% Fully valued, trimmed position
PAYCHEX 12/03/10 09/02/16 +107% Fully valued, trimmed position
SHIRE PLC 06/03/16 09/02/16 +1% Received shares as part of Baxalta acquisition, sold position due to debt-laden balance sheet and full valuation
Hendershot Investments, Inc. Investment Advisory Services Founded in 1994, Hendershot Investments’ personalized portfolio management service exists to help you improve your long-term fi-nancial success and to conserve and grow your wealth. To that end, we invest in high-quality, well-managed companies at reasonable valuations and hold them for the long term. We extend a big “thank you” for the many client and subscriber referrals, as a referral is the biggest compliment you can pay us!
We find great businesses at reasonable prices through extensive research.
As long-time students of the stock market, we have developed valuation models to assess the relative merits of HI-quality companies. We scour annual reports, SEC filings and news to independently deter-mine company valuations, thereby avoiding the pitfalls of herd-mentality investing. Quarterly earnings conference calls with management keep us abreast of corporate developments and give us insight into the heartbeat of corporate leadership.
We adhere steadfastly to rigor-ous buy and sell disciplines.
Our number one rule on the buy side is “Don’t overpay for a stock.” We want to buy with a margin of safety. We would rather pay a “fair price for a great business than a great price for a fair business.”
As Philip Fisher stated, “If the job has been done correctly when a stock is purchased, the time to sell is almost never.”
We believe in patient investing for the long term.
Quintessential investor, Ben Graham, de-scribed the stock market in the short term as an imperfect voting machine where stock prices are based partly on emotion and partly on reason. In the long term, the stock market is a weighing machine where prices are driven by fundamentals. For this reason, we are willing to wait pa-tiently until Mr. Market recognizes the value of our HI-quality firms.
Our Investment Discipline
*A stock meets our price target by reaching its near-term full value based on its expected price range over the next 12-18 months (see pages 6 and 7). When a stock reaches our price target, we generally sell half the position and reinvest the proceeds into other promising opportunities. The remaining shares are held for further potential long-term gains as intrinsic value grows over time. Stocks are also sold if business fundamentals deteriorate or better investment opportunities are available.

Page 6 Hendershot Investments, Sept. 2017
COMPANY SYMBOL
EXP. ** PRICE
RANGE
PRICE 8-25-17
This year
Actual EPS
Next year Est. EPS
Current
P/E
PRICE/ BOOK VALUE
PRICE/ SALES
DIV.
YIELD
SALES 4-YR
CAGR*
EPS 4-YR
CAGR*
Return
on Equity
Cash/ Equity
Debt/
Equity
Current
Ratio
SALES (000)
AAPL 116-178
159.86 $8.31 $9.02 18.1 6.2 3.8 1.6% 8% 7% 36% 198% 68% 1.4x $215,639,000
ABBV 73-96 72.48 3.63 4.63 17.8 19.2 4.5 3.5 9% 2% 28% 100+ 100+ 1.4 25,638,000
ACN 108-138
129.39 6.45 5.42 22.9 9.8 2.4 1.9 4% 14% 54% 41 0 1.2 32,822,723
ADP 79-102 104.59 3.85 3.81 27.4 11.8 4.0 2.2 7% 8% 33% 70 50 2.0 12,379,000
BAX 48-67 61.51 .72 1.90 70.7 3.7 3.4 1.0 4% -1% 60% 42 38 3.0 9,968,000
BDX 167-219
198.57 4.49 5.15 57.7 3.6 3.6 1.5 13% -4% 13% 110 148 5.6 12,483,000
BF.B 44-57 50.41 2.61 1.71 29.5 14.3 5.1 1.4 0% 6% 49% 13 123 2.4 4,011,000
BIIB 299-378
285.06 16.93 18.49 18.7 5.3 5.3 - 20% 31% 31% 48 51 2.1 11,448,000
BIVV 51-78 55.61 4.07 2.92 13.2 8.8 6.8 - n/a n/a 16% 20 0 2.0 887,400
BRK.B ! 150-190
179.60 10,693 10,985 26.2 1.5 2.1 - 8% 9% 6% n/a n/a n/a 215,825,000
CAKE 48-74 41.63 2.83 2.67 14.6 3.0 0.8 2.8 6% 12% 23% 10 0 0.6 2,275,719
CNI 72-99 79.60 4.67 5.45 15.7 4.0 5.0 1.7 32% 11% 24% 1 58 0.6 12,037,000
CSCO 25-35 31.44 1.90 1.93 16.5 2.4 3.3 3.7 0% 1% 15% 107 39 3.0 48,005,000
CTSH 61-84 69.78 2.55 3.30 22.4 3.9 3.1 .9 16% 10% 14% 44 7 3.4 13,487,000
DIS 92-131 102.41 5.73 5.88 18.1 3.9 3.0 1.5 7% 16% 23% 20 44 1.0 55,632,000
ESRX 68-88 60.79 5.39 5.49 10.6 2.2 0.4 - 2% 32% 21% 15 88 0.7 100,287,500
FAST 42-58 41.46 1.73 1.92 22.8 6.0 3.0 3.1 6% 5% 26% 6 22 5.5 3,962,036
FDS 163-205
159.27 8.19 7.30 18.7 11.9 5.6 1.4 9% 19% 66% 37 109 2.0 1,127,092
FFIV 116-165
117.60 5.38 6.01 19.6 6.3 3.8 - 10% 12% 31% 104 0 1.6 1,995,034
FLR 42-64 37.77 2.00 1.50 47.2 1.7 0.3 2.2 -9% -7% 9% 68 49 1.5 19,036,500
GNTX 17-25 17.94 1.19 1.27 13.4 2.6 3.1 2.2 11% 19% 18% 41 5 4.4 1,678,925
GOOGL!! 889-1214
930.50 27.85 30.60 33.1 4.3 7.1 - 18% 13% 14% 69 3 6.0 90,272,000
GPC 86-117 83.30 4.59 4.73 18.0 3.7 0.8 3.2 4% 3% 22% 6 17 1.3 15,339,713
PORTFOLIO FUNDAMENTALS
** Exp. price range—the expected price range for the stock in the next 12-18 months based on our valuation models and the historical trading range of the stock over the last five years. If the current price is below the low end of the expected range, the stock appears undervalued. If the current stock price is above the high end of the expected range, the stock appears overvalued. The expected price range will change based upon company developments. Highlighted stocks appear undervalued or are new additions. !Berkshire price is for the class B shares, the class A shares approximate 1500 times the B shares. !!GOOGL (the original class A share price is used for the table. GOOGL will typically trade slightly higher than the Class C non-voting shares (GOOG).

www.hendershotinvestments.com Page 7
COMPANY SYMBOL
EXP. ** PRICE
RANGE
PRICE 8-25-17
This Year
Actual EPS
Next Year Est. EPS
Current
P/E
PRICE/ BOOK VALUE
PRICE/ SALES
DIV.
YIELD
SALES 4-YR
CAGR*
EPS 4-YR
CAGR*
Return
on Equity
Cash/ Equity
Debt/
Equity
Current
Ratio
SALES (000)
HRL 31-42 31.34 1.64 1.55 19.3 3.5 1.7 2.2% 4% 15% 20% 13% 5% 2.5x $9,523,224
JNJ 110-144
131.68 5.93 7.18 22.3 4.9 4.9 2.6% 2% 11% 24% 18 38 1.3 71,890,000
MA 113-152
132.75 3.69 4.40 32.9 24.2 13.1 .7 10% 14% 72% 119 91 1.7 10,776,000
MMM 158-213
202.13 8.16 8.94 23.0 10.4 4.0 2.3 0% 7% 49% 25 95 2.2 30,109,000
MMS 46-69 59.36 2.69 3.12 16.7 4.3 1.6 .3 23% 25% 24% 12 2 2.1 2,403,360
MSFT 51-69 72.82 2.71 3.21 26.9 7.8 6.2 2.1 4% 1% 29% 184 105 2.5 89,950,000
NKE 48-67 53.90 2.51 2.42 21.5 3.5 2.6 1.3 8% 17% 34% 48 27 3.1 34,350,000
ORCL 41-54 49.24 2.21 2.42 22.3 3.7 5.4 1.5 0% -1% 17% 122 89 3.1 37,728,000
PAYX 48-62 56.22 2.25 2.37 25.0 10.3 6.4 3.6 8% 10% 42% 40 0 2.1 3,151,300
PCLN 1711-2510
1,793.48 42.65 71.77 38.1 7.6 8.2 - 20% 11% 22% 143 65 2.2 10,743,006
PEP 100-125
115.85 4.36 5.15 24.5 13.1 2.6 2.8 -1% 3% 56% 137 249 1.3 62,799,000
PII 78-111 94.65 3.27 4.48 39.6 7.0 1.3 2.5 9% -7% 25% 15 123 1.2 4,516,629
QCOM 45-65 52.03 3.81 2.21 19.9 2.5 3.3 4.3 5% 6% 18% 121 62 2.9 23,554,000
ROST 61-85 59.38 2.83 3.23 19.6 8.1 1.7 1.1 7% 12% 41% 45 14 1.6 12,866,757
SBUX 56-78 54.36 1.90 2.07 27.5 13.4 3.7 1.8 13% 21% 48% 64 67 1.4 21,315,900
SYK 120-156
139.88 4.35 5.32 31.2 5.2 4.6 1.2 7% 6% 17% 37 66 2.8 11,325,000
TJX 83-107 71.67 3.46 3.93 20.3 10.2 1.4 1.7 6% 8% 51% 65 49 1.6 33,183,744
TROW 73-95 83.90 4.75 5.66 22.8 3.9 4.8 2.7 9% 9% 24% 56 0 2.8 4,222,900
UPS 109-133
113.40 3.87 6.01 27.8 77.1 1.6 2.9 3% 47% 100% 100+ 100+ 1.1 60,906,000
UTX 107-142
115.07 6.13 6.58 17.6 3.1 1.6 2.4 3% 6% 20% 31 79 1.4 57,244,000
WAB 78-110 70.20 3.34 3.24 24.7 2.6 2.3 .7 5% 6% 14% 13 75 1.6 2,931,188
WBA 77-99 81.13 3.82 5.00 15.8 2.8 0.7 2.0 13% 12% 14% 39 46 1.3 117,351,000
WHG 54-72 60.04 2.77 3.34 18.8 3.5 4.3 4.1 12% 14% 16% 59 0 5.4 123,021
(continued)
* CAGR-Compound Annual Growth Rate. n/a-not applicable due to financial stock or equity less than zero. Estimated EPS reflects consensus earnings estimate for current fiscal year. The valuation measures (P/E, price-to-book value, price-to-sales and dividend yield) are calculated using the closing price on the date listed in column 3. Balance sheet ratios (cash/equity, debt/equity and current ratio) reflect the latest quarterly financial statements. Return on equity and sales figures are as of the company’s most recent fiscal year end.

Page 8 Hendershot Investments, Sept. 2017
During the past three months, the S&P 500 index rose 1% on encouraging earnings news. The following HI-quality stocks all generated 8% or better gains during the same period.
T. Rowe Price reported second quarter net revenues rose 12% to $1.2 billion with net income up 84% to $373.9 million and EPS up 90% to $1.50. Last year’s results included a nonrecurring charge of $100.7 million related to the Dell appraisal rights matter, which reduced EPS by $.39. Excluding this charge, net earnings would still have increased a strong 23% with EPS charging 27% higher. Investment advisory fees increased 13% during the quarter as ending assets under management (AUM) increased 16% to $903.6 billion. The $42 billion increase in AUM was due to $3.7 billion in net cash inflows and $38.3 billion in net market appreciation during the quarter. T. Rowe Price’s stock price also grew at a double-digit rate during the past three months by jumping 20%. Hold.
Biogen reported second quarter revenues rose 6% to $3.1 billion with EPS down 15% to $4.07. Earnings were impacted by a $120 million charge related to an acquisition. During the second quarter, Biogen repurchased about 2.9 million shares of its common stock for $782 million at an average price of about $269.65 per share. Biogen increased its full year 2017 revenue guidance to $11.5 billion to $11.8 billion related to faster than anticipated adoption of SPINRAZA, a new drug approved for spinal muscular atrophy. Biogen’s stock rose a healthy 14% during the past three months. Buy.
Polaris reported second quarter revenues rose 21% to $1.4 billion with EPS sliding 11% to $.97. Sales increased substantially due to the Transamerican Auto Parts (TAP) acquisition. Earnings were impacted negatively by costs related to the wind down of Victory Motorcycles and TAP acquisition costs. Polaris increased its full year 2017 sales guidance with adjusted sales expected to increase 12% to 14% and adjusted EPS expected in the range of $4.35 to $4.50, representing 25% to 29% growth over depressed adjusted EPS of $3.48 in 2016. Polaris’ stock price revved up a 12% gain during the past three months as the company restarts its growth engine. Hold.
MasterCard reported second quarter revenue rose 13% to a record $3.1 billion with EPS up 24% to $1.10. During the first half, the company paid $474 million in dividends and repurchased $1.9 billion of its own shares. Consumer confidence around the world appears to be improving with steady growth seen in the United States amid low unemployment and low interest rates. Europe is expecting 2% GDP growth this year with consumer confidence high, especially in Germany and Spain. Despite Brexit, U.K. sales have increased 5%, and Asia is seeing strong growth, especially in India. Mexico continues to report solid growth with consumer and business confidence improving in Brazil. Over the past three years, MasterCard has charged up a 76% total return. Hold.
Oracle reported fiscal 2017 revenues rose 3% to $37.7 billion with EPS up 7% to $2.21. Return on shareholders’ equity for the year was a solid 17.2%. During the year, the company paid $2.6 billion in dividends and repurchased a net $1.4 billion of its own shares. Oracle expects EPS growth to accelerate in fiscal 2018 with double-digit EPS growth expected for the full year. Over the past four years, Oracle has delivered a 59% total return. Hold.
Berkshire Hathaway reported the company’s $17.7 billion increase in net worth during the first half was due to the company’s $8.3 billion in net earnings and about $9.4 billion of gains in other comprehensive income primarily related to changes in unrealized investment appreciation. Free cash flow more than doubled during the first half of the year to $21.5 billion, due primarily to the big boost to float from an insurance deal with AIG. Berkshire ended the quarter with nearly $100 billion in cash. Berkshire Hathaway’s stock is up more than sixfold over the last 17 years. Hold.
Westwood Holdings reported second quarter revenues rose 9% to $33.8 million with net income jumping 35% to $7.8 million. Assets under management totaled $22.6 billion as of quarter end. Westwood ended the quarter with a debt-free balance sheet and more than $88 million in cash. The dividend currently yields a hefty 4% as the company returns most of its free cash flow to shareholders. Westwood’s stock price has increased 67% over the last six years. Buy.
PORTFOLIO HI-LITES QUARTERLY
MOVERS AND SHAKERS
POLARIS RESTARTING ENGINE
T. ROWE PRICE DOUBLE-DIGIT GROWTH
ORACLE 17% RETURN ON EQUITY
BERKSHIRE HATHAWAY STRONG CASH FLOW
WESTWOOD HOLDINGS 4% DIVIDEND YIELD
MASTERCARD DOUBLE-DIGIT GROWTH
BIOGEN BUYING BACK SHARES

www.hendershotinvestments.com Page 9
(continued)
Alphabet reported second quarter revenues rose 21%, or 23% on a constant currency basis, to $26 billion with net income and EPS each declining 28% to $3.5 billion and $5.01, respectively. These results reflect a $2.7 billion fine by the European Commission related to Google’s display and ranking of shopping search results infringing on European competition law. Excluding the substantial fine, net income and EPS would have risen about 28% during the quarter thanks to strong underlying worldwide growth in mobile search and YouTube. Revenue growth was broad-based on a geographic basis with strong double-digit growth generated in all major geographic regions. Aggregate paid clicks increased 52% with the aggregate cost per click declining 23% due to the shift to mobile search. Other Bets revenues rose 34% during the quarter to $248 million driven by Nest, Fiber and Verily with the operating loss narrowing to $772 million. Headcount increased 14% over the prior year period to 75,606 Googlers as the company continues to invest in the cloud, YouTube and home hardware. Alphabet recently entered a partnership with WalMart so that WalMart products can be purchased through voice with the Assistant on Google Home or on the Google Express website or app. Free cash flow increased 5% during the first half of the year to $12 billion with Alphabet ending the quarter with $95 billion of cash and investments on its fortress balance sheet with 61% of the cash held outside of the U.S. During the first half, Alphabet repurchased $3.7 billion of its own shares. Management is optimistic that artificial intelligence will solve complex problems in medicine and science and sees tremendous growth in Google cloud. Buy.
Gentex reported second quarter sales rose 5% to $443 million with EPS up 3% to $.31. The 5% growth in net sales was driven by a 6% increase in auto-dimming mirror unit shipments despite overall automotive light vehicle production in the company’s primary regions declining by approximately 1%. Gentex expects product mix to improve in the second half of the year based on orders and the release of new products. During the second quarter, the company repurchased 2.2 million of its shares. With a strong balance sheet with more than $800 million in cash and minimal long-term debt as of quarter end, Gentex’s Board of Directors recently authorized the purchase of an additional 15 million shares of its common stock. Buy.
Genuine Parts reported second quarter sales motored ahead 5% to $4.1 billion with EPS increasing 1% to $1.29. Management was encouraged by the steady sales growth in each of the company’s four distribution businesses with the strongest growth generated in the Industrial and Electrical segments. Genuine Parts’ balance sheet is a key company strength with the flexibility and capacity to support future growth. During the first half of the year, Genuine Parts repurchased $154 million of its own shares and recently announced an expansion of its share repurchase program by an additional 15 million shares. Genuine Parts also paid $197 million in dividends year-to-date. The company has increased its dividend for 61 consecutive years. The dividend currently yields an industrial-sized 3.3%. Full year 2017 EPS guidance was revised to $4.70-$4.75. Buy.
The Cheesecake Factory reported second quarter revenues rose 2%, with comparable store sales down .5%, to $569.9 million and net income dipping 1% to $38.2 million with EPS flat at $.78 compared to the prior year period. The quarter came in softer than expected with weak sales trends attributed to uncertainty on the part of many consumers and unfavorable weather in the East and Midwest. The company plans to open as many as eight company-owned restaurants in fiscal 2017 as well as up to four international restaurants under licensing agreements. Given the stability of the company’s cash flows and positive long-term prospects for the business, the board increased the quarterly dividend a sweet 21% to $.29 per share. During the second quarter, the company repurchased 400 million of its own shares at a cost of $21.3 million at an average price of $53.25 per share with the company planning to repurchase about $125 million of its shares for the full fiscal 2017 year as management plans to return substantially all of its free cash flow to shareholders through dividends and share repurchases. Given the continued softness in restaurant industry spending and an increasingly competitive business environment, management lowered their outlook for sales and earnings for the full year with comparable store sales now expected to decline 1% for the full year and 2017 EPS expected in the range of $2.62 to $2.70, representing a disappointing 5% to 7% decline in earnings per share from the prior year. The stock price has pulled back and appears undervalued, but we will be carefully watching for growth to resume before taking another slice. Hold.
QUARTERLY RATING CHANGE FROM HOLD TO BUY
ALPHABET DOUBLE-DIGIT GROWTH
GENTEX EXPANDS BUYBACK
QUARTERLY RATING CHANGE FROM BUY TO HOLD
CHEESECAKE FACTORY INCREASES DIVIDEND 21%
GENUINE PARTS EXPANDS BUYBACK

Page 10 Hendershot Investments, Sept. 2017
50TH ANNIVERSARY Fastenal started as a partnership among five friends in 1967 with the idea of pre-packaging automotive fasteners to be sold in vending machines. With a poor response to the vending concept, the company instead opened a single store in Winona, Minnesota, to sell its fasteners. From this single store, the company has grown rapidly with more than 2,500 stores selling a broad range of industrial and construction supplies in all 50 states and more than 20 countries. Celebrating its 50th anniversary, the company has now come full circle with its vending concept thanks to strong customer response for its FAST Solutions (industrial vending machines) today with an installed base of more than 66,000 vending devices. Sales from industrial vending machines grew at double-digit rates in the second quarter with the goal of signing 22,000 vending devices in 2017.
SECOND QUARTER RESULTS Fastenal reported second quarter revenues rose 11% to $1.1 billion with net income and EPS each hammering up 13% gains to $148.9 million and $.52, respectively. The increase in net sales returned the company to double-digit sales growth and was driven by higher unit sales from an improvement in underlying market demand as Fastenal gained market share. Daily sales of fastener products, representing 36% of sales, grew 7.9% during the quarter while non-fastener products, representing 64% of sales, jumped 12.2%. Gross profit margin improved 30 basis points to 49.8% during the quarter due to changes in product and customer mix and progress in supply chain initiatives.
UNDER THE SPOTLIGHT FASTENAL (FAST—$41.46)
2001 Theurer Blvd., Winona, MN 55987 www.fastenal.com
STRONG CASH FLOW Free cash flow increased 43% during the first half of the year to $236 million due primarily to the improvement in net earnings and a reduction in capital expenditures. For the full year, the outlook for capital expenditures was increased to $127 million from previous guidance of $119 million due to higher anticipated spending on supply chain and information technology. During the first half, Fastenal paid $185 million in dividends and repurchased $57 million of its own shares, including 1.3 million shares purchased in the second quarter at an average price of $43.62 per share. The board of directors recently announced a new five million share repurchase program. The firm’s conservative balance sheet provides management with the financial flexibility to invest in the business, increase the dividend and use excess cash to repurchase shares. The dividend has grown at a 13% compound annual rate over the last four years, excluding a $.50 per share special dividend paid in 2012. Fastenal’s dividend currently yields a solid 3.1%.
FRUGAL AND PROFITABLE Over the years, Fastenal has built a reputation as one of the most frugal companies in America. Bob Kierlin, one of the company’s original founders, instilled a no-frills sensibility into the company culture with the company’s ongoing mission to slash non-essential costs at every level of the company. This has resulted in high profitability for Fastenal with return on shareholders’ equity averaging a superb 25% over the last decade. With the marketplace in North America for industrial supplies estimated to be in excess of $140 billion, Fastenal is well positioned for future solid growth. As the manufacturing economy improves, the company’s end markets remain positive with sales accelerating throughout the second quarter. Seeing success in all of their growth drivers, management appeared upbeat about prospects for the remainder of the year. Long-term investors should fasten Fastenal into their portfolio. Fastenal is a HI-quality firm with highly profitable operations and strong cash flows with a frugal management team expanding the share repurchase program and paying a 3% dividend. Buy.
Fastenal engages in the wholesale distribution of industrial and construction supplies in the United States, Canada, and internationally. It offers fasteners and other industrial and construction supplies primarily under the Fastenal name. The company ’s fastener products include threaded fasteners, such as bolts, nuts, screws, studs, and related washers, which are used in manufactured products and building projects, as well as in the maintenance and repair of machines and structures. It also offers miscellaneous supplies and hardware.
Fiscal Year December
4-YR CAGR
2016
2015
2014
2013
2012
Sales (000,000)
6.0% $3,962.0 $3,869.2 $3,773.5 $3,326.1 $3,133.6
Net Income (000,000)
4.4% $499.5 $516.4 $494.2 $448.6 $420.5
EPS 5.1% $1.73 $1.77 $1.66 $1.51 $1.42
Dividend 12.8% $1.20 $1.12 $1.00 $.80 $.74
Profit Margin 12.6% 13.3% 13.1% 13.5% 13.4%

www.hendershotinvestments.com Page 11
LEADING BIOTECH AbbVie is a leading biotechnology company that was formed in 2013 following its separation from Abbott Laboratories. (Financial results for 2013 through 2016 reflect the higher expenses associated with operating as an independent company as well as one-time acquisition and R&D charges.) AbbVie's products are focused on treating conditions such as chronic autoimmune diseases in gastroenterology, rheumatology and dermatology; oncology, including blood cancers; virology, including hepatitis C (HCV) and human immunodeficiency virus (HIV); neurological disorders, such as Parkinson's disease and multiple sclerosis; metabolic diseases, including thyroid disease and complications associated with cystic fibrosis; as well as other serious health conditions. HUMIRA is the company’s leading biologic therapy approved to treat a variety of autoimmune diseases. HUMIRA accounted for 63% of the company’s revenues in 2016. In addition to dedicating research and development resources to further expand indications for HUMIRA, AbbVie also has invested more than $27 billion in acquisitions in the last four years. As a result, AbbVie has a promising pipeline of new medicines, including more than 50 investigational programs in clinical development across such important medical specialties as immunology, virology, oncology and neurology, with additional targeted investment in cystic fibrosis and women's health. AbbVie is on track to launch more than 20 new products through 2020 with the pipeline having the potential to deliver nearly $30 billion in sales.
UNDER THE SPOTLIGHT ABBVIE (ABBV-$72.48)
1 North Waukegan Road, North Chicago, IL 60064 www.abbvie.com
SECOND QUARTER RESULTS AbbVie reported 2017 second quarter sales increased a solid 8% to $6.9 billion with net income up 19% to $1.9 billion and EPS up 21% to $1.19. Adjusted net earnings and EPS increased 10.5% and 12.7%, respectively. Global HUMIRA sales increased a healthy 13.7% to $4.7 billion despite increasing competition from new classes of drugs and biosimilars. In the U.S., HUMIRA sales grew 18% to $3.2 billion while international HUMIRA sales grew 5.5% to $1.5 billion, including a 3.6% unfavorable impact from foreign exchange. IMBRUVICA, AbbVie’s drug to treat leukemia, generated net revenues of $626 million during the second quarter, with U.S. sales of $528 million and international profit sharing of $98 million for the quarter, reflecting growth of 42.6%. AbbVie made significant progress on its pipeline during the quarter including positive top-line results from its new drug to treat severe rheumatoid arthritis and phase 2 studies for patients with Crohn’s disease. After second quarter earnings were released, AbbVie announced that the European Commission (EC) granted marketing authorization for MAVIRET®, a once
-daily, ribavirin-free treatment for adults with chronic hepatitis C virus (HCV) infection across all major genotypes. MAVIRET is a new, 8-week treatment for patients who comprise the majority of the estimated 71 million people worldwide living with hepatitis C.
LONG-TERM FINANCIAL GOALS AbbVie outlined long-term financial objectives which position the firm for strong performance. AbbVie expects to deliver double-digit adjusted EPS growth on average through 2020 with total company sales of about $37 billion expected by 2020. The company also expects significant margin expansion, targeting a 2020 operating margin greater than 50% with an average of 100-200 basis points of improvement per year. Management is committed to returning cash to shareholders through a strong and growing dividend. The company announced a 12% increase in the dividend for fiscal 2017 and a new $5 billion share repurchase program. The dividend currently yields a healthy 3.6%. AbbVie’s outlook for 2017 EPS is in the range of $4.55-$4.65, reflecting strong double-digit growth. Long-term investors may want to inject AbbVie into their portfolio, a HI-quality biotech firm with double-digit growth and a healthy dividend. Buy.
AbbVie is a global, research-driven biopharmaceutical company committed to developing innovative advanced therapies for some of the world's most complex and critical conditions. The company's mission is to use its expertise, dedicated people and unique approach to innovation to markedly improve treatments across four primary therapeutic areas: immunology, oncology, virology and neuroscience. In more than 75 countries, AbbVie employees are working every day to advance health solutions for people around the world.
Fiscal Year December
4-YR CAGR
2016
2015
2014
2013
2012
Sales (000,000)
8.7% $25,638 $22,859 $19,960 $18,790 $18,380
Net Income (000,000)
3.1% $5,953 $5,144 $1,774 $4,128 $5,275
EPS 2.0% $3.63 $3.13 $1.10 $2.56 $3.35
Dividend - $2.35 $2.10 $1.75 $2.00 -
Profit Margin 23.2% 22.5% 8.9% 22.0% 28.7%
Page 12 Hendershot Investments, Sept. 2017
SUBSCRIPTION INFORMATION Hendershot Investments is published quarterly by Hendershot Investments, Inc., 11321 Trenton Court, Bristow, VA 20136. Phone: (703)-361-6130. Subscription price: $50 per year. Photocopying, reproduction or quotation is strictly prohibited without written permission. Information presented here was obtained from sources believed to be reliable but accuracy and completeness and opinions based on this information are not guaranteed. It should not be assumed that recommendations will be profitable or will equal the performance of securities listed here or recommended in the past. All data, information and opinions expressed are subject to change without notice. Further information on companies mentioned in this newsletter is available upon request.
SUBSCRIPTION INFORMATION Hendershot Investments is published quarterly by Hendershot Investments, Inc., 11321 Trenton Court, Bristow, VA 20136. Phone: (703)-361-6130. Subscription price: $50 per year. Photocopying, reproduction or quotation str ictly prohibited without wr itten permission. Information presented here was obtained from sources believed to be reliable but accuracy and completeness and opinions based on this information are not guaranteed. It should not be assumed that recommendations will be profitable or will equal the performance of securities listed here or recommended in the past. All data, information and opinions expressed are subject to change without notice. Further information on companies mentioned in this newsletter is available upon request.
SUBSCRIPTION INFORMATION Hendershot Investments is published quarterly by Hendershot Investments, Inc., 11321 Trenton Court, Bristow, VA 20136. Phone: (703)-361-6130. Subscription price: $50 per year. Photocopying, reproduction or quotation is strictly prohibited without written permission. Information presented here was obtained from sources believed to be reliable but accuracy and completeness and opinions based on this information are not guaranteed. It should not be assumed that recommendations will be profitable or will equal the performance of securities listed here or recommended in the past. All data, information and opinions expressed are subject to change without notice. Further information on companies mentioned in this newsletter is available upon request.
UNDER THE SPOTLIGHT
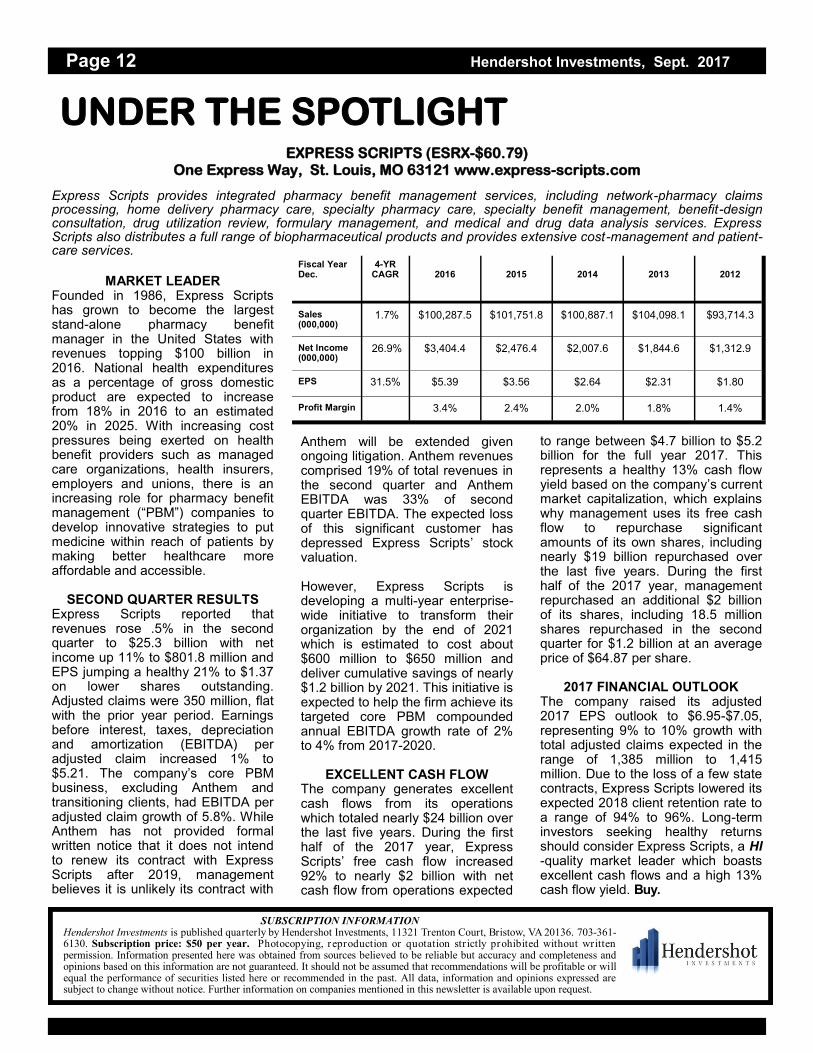
MARKET LEADER Founded in 1986, Express Scripts has grown to become the largest stand-alone pharmacy benefit manager in the United States with revenues topping $100 billion in 2016. National health expenditures as a percentage of gross domestic product are expected to increase from 18% in 2016 to an estimated 20% in 2025. With increasing cost pressures being exerted on health benefit providers such as managed care organizations, health insurers, employers and unions, there is an increasing role for pharmacy benefit management (“PBM”) companies to develop innovative strategies to put medicine within reach of patients by making better healthcare more affordable and accessible.
SECOND QUARTER RESULTS Express Scripts reported that revenues rose .5% in the second quarter to $25.3 billion with net income up 11% to $801.8 million and EPS jumping a healthy 21% to $1.37 on lower shares outstanding. Adjusted claims were 350 million, flat with the prior year period. Earnings before interest, taxes, depreciation and amortization (EBITDA) per adjusted claim increased 1% to $5.21. The company’s core PBM business, excluding Anthem and transitioning clients, had EBITDA per adjusted claim growth of 5.8%. While Anthem has not provided formal written notice that it does not intend to renew its contract with Express Scripts after 2019, management believes it is unlikely its contract with
Anthem will be extended given ongoing litigation. Anthem revenues comprised 19% of total revenues in the second quarter and Anthem EBITDA was 33% of second quarter EBITDA. The expected loss of this significant customer has depressed Express Scripts’ stock valuation. However, Express Scripts is developing a multi-year enterprise-wide initiative to transform their organization by the end of 2021 which is estimated to cost about $600 million to $650 million and deliver cumulative savings of nearly $1.2 billion by 2021. This initiative is expected to help the firm achieve its targeted core PBM compounded annual EBITDA growth rate of 2% to 4% from 2017-2020.
EXCELLENT CASH FLOW The company generates excellent cash flows from its operations which totaled nearly $24 billion over the last five years. During the first half of the 2017 year, Express Scripts’ free cash flow increased 92% to nearly $2 billion with net cash flow from operations expected
to range between $4.7 billion to $5.2 billion for the full year 2017. This represents a healthy 13% cash flow yield based on the company’s current market capitalization, which explains why management uses its free cash flow to repurchase significant amounts of its own shares, including nearly $19 billion repurchased over the last five years. During the first half of the 2017 year, management repurchased an additional $2 billion of its shares, including 18.5 million shares repurchased in the second quarter for $1.2 billion at an average price of $64.87 per share.
2017 FINANCIAL OUTLOOK The company raised its adjusted 2017 EPS outlook to $6.95-$7.05, representing 9% to 10% growth with total adjusted claims expected in the range of 1,385 million to 1,415 million. Due to the loss of a few state contracts, Express Scripts lowered its expected 2018 client retention rate to a range of 94% to 96%. Long-term investors seeking healthy returns should consider Express Scripts, a HI-quality market leader which boasts excellent cash flows and a high 13% cash flow yield. Buy.
SUBSCRIPTION INFORMATION Hendershot Investments is published quarterly by Hendershot Investments, 11321 Trenton Court, Bristow, VA 20136. 703-361-6130. Subscription price: $50 per year. Photocopying, reproduction or quotation str ictly prohibited without written permission. Information presented here was obtained from sources believed to be reliable but accuracy and completeness and opinions based on this information are not guaranteed. It should not be assumed that recommendations will be profitable or will equal the performance of securities listed here or recommended in the past. All data, information and opinions expressed are subject to change without notice. Further information on companies mentioned in this newsletter is available upon request.
EXPRESS SCRIPTS (ESRX-$60.79) One Express Way, St. Louis, MO 63121 www.express-scripts.com
Express Scripts provides integrated pharmacy benefit management services, including network-pharmacy claims processing, home delivery pharmacy care, specialty pharmacy care, specialty benefit management, benefit-design consultation, drug utilization review, formulary management, and medical and drug data analysis services. Express Scripts also distributes a full range of biopharmaceutical products and provides extensive cost-management and patient-care services.
Fiscal Year Dec.
4-YR CAGR
2016
2015
2014
2013
2012
Sales (000,000)
1.7% $100,287.5 $101,751.8 $100,887.1 $104,098.1 $93,714.3
Net Income (000,000)
26.9% $3,404.4 $2,476.4 $2,007.6 $1,844.6 $1,312.9
EPS 31.5% $5.39 $3.56 $2.64 $2.31 $1.80
Profit Margin 3.4% 2.4% 2.0% 1.8% 1.4%