
Articles - JALT Publications
30
Articles An EFL Readability Index James Dean Brown University of Hawai 'i This study explores readability and its relationship to the doze passage performance of EFL students. Fifty reading passages were made into 30-item doze passages by deleting every 12th word. Each passage was then analyzed for two sets of independent variables chosen to investigate how well they predict EFL Difficulty. The first set was made up of various first language readability indices and the second set was made up of quantifiable linguistic characteristics of the passages, such as the percent of function words, number of syllables per sentence and so forth. Correlational, factor, and multiple- regression analyses indicated that the first language readability indices were only weakly related to EFL Difficulty. However, the analysis of linguistic characteristics indicated clear groupings among the variables. In addition, when the number of syllables per sentence, the average frequency of lexical items elsewhere in the passage, the percent of words with seven or more letters, and the percent of function words were combined, they were highly related to EFL Difficulty. These results are discussed in terms of their implications for the development of an EFL readability index. C-;;(rA TQo A ,:;iUW L, c-;;( rA L"C, A ':1!ffl L, L "C, -f(1) L t.:o 1. c -:) "C (1) 'J - 1::" 'J r -( Flesch- Kincaid, Fry, Gunning, Fog, and modified Gunning-Fog) 2. (tltmim(1)!5 *, 1 (1) r c -:) "C (1) 'J - 'J r -( -il5£fItlJ 1;1:, C -;;(r A I- Q)*ft*,: J: -:) c '=> t.:tJ f , 2 (1) ,: ?1t'''C 1;1:, Lt.:o a) (1)ffrollt, b) c) 7)(!FJ;J,J:.Q) d) c!:Q)fIij ,: 1;1:, Q .: C nffilim ttt.:o .: tt '=> $, 91-0011 c L "C I: Q0 JALT Journal, Vol. 20, No.2, November, 1998 7
Transcript of Articles - JALT Publications

Articles
An EFL Readability Index
James Dean Brown University of Hawai 'i
This study explores readability and its relationship to the doze passage performance of EFL students. Fifty reading passages were made into 30-item doze passages by deleting every 12th word. Each passage was then analyzed for two sets of independent variables chosen to investigate how well they predict EFL Difficulty. The first set was made up of various first language readability indices and the second set was made up of quantifiable linguistic characteristics of the passages, such as the percent of function words, number of syllables per sentence and so forth. Correlational, factor, and multipleregression analyses indicated that the first language readability indices were only weakly related to EFL Difficulty. However, the analysis of linguistic characteristics indicated clear groupings among the variables. In addition, when the number of syllables per sentence, the average frequency of lexical items elsewhere in the passage, the percent of words with seven or more letters, and the percent of function words were combined, they were highly related to EFL Difficulty. These results are discussed in terms of their implications for the development of an EFL readability index. *~~I;I:, 8*A!A:m~'ll#(1)~)(lft~lfc ~ C-;;(rA ~*B*c(1)mJ~~:,?"l"C~~
TQo 50(1)~)(t:-7;; ~ A ,:;iUW L, -ftt~tt12mH~':30fSFJi'(1)~FJi't:-G:'tt.:~ c-;;( rA ~ ~50001'J:$:L, 18~(1)8*A*~~~m~'lll~,298~~tlU~#c L"C, ~~~':7 ;;~A~;iUWL~~c-;;(rA~~1?~?4~~0*~,~~c-;;(rA~(1).~~~
~r A ~ ':1!ffl Lt.:~)(1).~lfc:itx., .:tt~f:f~~ltc L, *(1)2fi!:.~!!DL~ltC L "C, -f(1) IJU~ ~~* L t.:o 1. iJJmJ1t:g-~: c -:) "C (1) 'J - ~ 1::" 'J r -( -il~fItI(Flesch, FleschKincaid, Fry, Gunning, Fog, and modified Gunning-Fog) 2. ;5it)(J:.(1)1tt:fil:ii]'~~ffim (tltmim(1)!5 ~Q~~, l)(~~~(1)~~lt, l)(~~~~(1).mlt,.m(1)Wm.lf~~) c(1)~IJU~
*, ~T~*, lIlruHf}~*(1)*ft*, 1 (1) r iJJmlB't:g-~: c -:) "C (1) 'J - ~ ~ 'J r -( -il5£fItlJ 1;1:, ~ C -;;(r A I- Q)*ft*,: J: -:) "C~~ttt.: r!A:)(.~}jfJ c 1;I:~ij"'mJ~ Ltpim~ '=> tt~
tJ~-:) t.:tJf , 2 (1) r~)(J:.(1)iltfa:iiJ~~ffifilJ ,: ?1t'''C 1;1:, ltUi:.Q)~lt(1)m~.g-b-\ttJf",*
~"l*ft*~~ Lt.:o ~,:, a) l)(~t.: ~ (1)ffrollt, b) .gli(1).~WmMUJf, c) 7)(!FJ;J,J:.Q) .!I1mQ)6~Q~1~, d) tI~mQ)!5~Q~l~, (1)4,?(1)3t:fil:ii]'~ffftac r~)(."'}jfJ c!:Q)fIij
,: 1;1:, ~"'mJ.f;f.nt~ Q .: C nffilim ~ ttt.:o .: tt '=> (1).aMH:~-? $, *1OOi~I;I:, 91-0011 c L "C (1)!A::t.~IJf~JEni1:(1)fiJf~nrPJ I: ?1t'''C~~T Q 0
JALT Journal, Vol. 20, No.2, November, 1998
7

8 JALT JOURNAL
T he doze procedure first appeared in the literature when Taylor (1953) investigated its value as a device for estimating the readability of materials used in public education. Research has
also investigated the effectiveness of the doze procedure as a measure of reading ability for native speakers of English, and, in the 1970s, a number of studies also explored the effectiveness of cloze as a measure of overall ESIJEFL proficiency (for overviews on doze research, see Alderson, 1978; Oller, 1979). After brief discussion of these developments, this paper will review efforts that have gone on in both the first and second language readability literatures.
Cloze and Readability
In the first language literature, numerous studies indicate that doze scores are moderately to highly correlated with various standardized reading comprehension tests (Bormuth, 1965, 1967; Crawford, 1970; Gallant, 1965; Ransom, 1968, Ruddell; 1964; Weaver & Kingston, 1963) with correlation coefficients ranging from .25 to .95 (see Brown, 1978 for a more detailed summary). These results indicate that doze scores can provide reasonable estimates of reading comprehension ability for native speakers of English, at least as measured by standardized reading comprehension tests. As mentioned, the connection between cloze and readability was an issue when the cloze procedure was frrst introduced by Taylor (1953). Other studies including Taylor (1957), Bormuth (1966, 1968), Miller and Coleman (1967), Bickley, Ellington, & Bickley (1970), Moyle (970), and Ransom (968) all indicated that doze was to some degree related to readability. Furthermore, in the second language literature, even more numerous studies indicate that doze, if carefully developed, can be a sound measure of overall English language proficiency (Alderson, 1979, 1980; Bachman, 1985; Brown, 1980, 1984, 1988b; Conrad, 1970; Darnell, 1970; Hinofotis, 1980; Irvine, Atai & Oller, 1974; Mullen, 1979; Oller, 1972a & b; Oller & Inal, 1971; Revard, t'990; Stubbs & Tucker, 1974) with coefficients ranging from .43 to .91.
However, other researchers have criticized the use of doze procedures, especially as a criterion-measure in readability studies. As Carrell 0987, p. 25) pointed out:
... doze procedure can be, and often is, misused as a criterion. The most common abuse is to use only one of the n forms of a fIxed-ratio, every nth deletion format, to collect criterion data. Studies have shown that all n forms of and every nth fixed-ratio deletion doze are seldom equal in difficulty.

BROWN 9
Carrell's artide does not make dear which studies have shown that different nth word deletion patterns seldom produce equal difficulties. Indeed, based on sampling theory, it would be reasonable to expect variations in difficulty such that the difficulties would only rarely be the same. The issue is not if they will differ but rather the degree to which
. they will differ beyond expectations within statistical sampling theoryan issue that, to my knowledge, has not been addressed in the literature.
Another critique, Carver 0977-1978, p. 31 ), felt that doze was not a good criterion measure for readability indices because it depended on the ability level of the particular group of students involved. As he put it:
Superficially, it may appear that doze would proVide an acceptable estimate of material difficulty level (Ld). Yet the cloze measure has an inherent disadvantage which precludes its being used as [a] standard for measuring language-knowledge difficulty of the material (Ld). Cloze is a rubber yardstick because the doze difficulty estimate depends both upon the abifity level of the particular group which was administered the doze test, as well as the difficulty level of the material.
Carver's view condemns the value of doze to pinpoint actual grade level difficulty of passages. However, it ignores the benefits to be derived from basing readability estimates on human performance and, in fact, doe~ not condemn the usefulness of doze to estimate the relative difficulty of passages.
Kintsch and Vipond 0979, p. 337) offer further criticism: The doze procedure ... is probably actually misleading. It measures the statistical redundancy of a text, which is a far cry from its comprehensibility. By that score, a high-order statistical approximation of English that nevertheless constitutes incomprehensible gibberish would be preferred to a well-organized text with less predictable local patterns.
In fact, if a doze passage were based on highly redundant "incomprehensible gibberish," as suggested by Kintsch and Vipond, it would be reasonable to expect students to score relatively poorly on it. Cziko (978) provided evidence of this when he showed that, in French, students performed significantly better on a normal doze passage than they did on one that had the sentences scrambled. Furthermore, Kintsch and Vipond provide no support for their contention that the doze procedure only measures statistical redundancy. Indeed, as noted above, research indicates that doze assesses general reading comprehension for native speakers and overall English language proficiency for ESL/ EFL students. However, little indication exists in the literature on doze that researchers have any more specific ideas on what doze measuresredundancy or otherwise. The point is that, even if one accepts the notion that doze principally assesses the students' abilities to deal with

10 JALT JOURNAL
redundancy, it can be argued (as I have elsewhere, see Brown, 1986) on the basis of the work of Goodman (1967) and Smith (1975, 1978) that the use of redundancy and prediction in taking a doze test may be very similar to what goes on in the reading process.
Readability Indices
First language readability
literally hundreds of readability indices have been created over the years. For overviews of the first language readability literature see Chall (1958), Klare (1963, 1984), or Zakaluk and Samuels (988). For a review of the many uses to which readability indices have been put, see Fry (1987).
An entire literature discusses the effectiveness of these frrst language readability indices. However, one study (Brown, Chen, & Wang, 1984) was particularly influential in making me think that such readability indices might work. That study showed a strong degree of relationship between the Fry readability estimates and grade levels as determined by nativespeaker performance. In that study, the Fry scale for SRA kit cards was compared with the grade levels previously established by the author of the kits (based on the performance of North American elementary school children). Table 1 shows the results of this comparison.
Table 1 gives the results for the 3A and 4A SRA kits, as labeled, to the left. The grade levels for each color within the kits are given in the second column. Each color designates the cards in one grade (or half grade) level as established by the performance of native-speaker students on those cards. Each color contains 12 to 14 cards. The statistics for the Fry scale readability estimates for the cards in each color are given in the four columns to the right The mean Fry index for each color/grade level is fairly dose to the actual grade level of the cards as established by student petformance. Clearly, a strong relationship can be seen between the mean grade levels as estimated using the Fry scale and the grade levels as established on the basis of students' petformances.
However, the Fry scale estimates shown in Table 1 are averages across 12 to 14 cards in each color and considerable variation exists in Fry readability indices among the cards within any given color/grade level as indicated by the standard deviation (SD), as well as by the low and high statistics given to the right of the table. Nonetheless, these results dearly indicate that an index like the Fry scale does have a striking relationship with the difficulty level of the materials for native speakers of English.
The first language readability indices of focus in this study are the Flesch reading ease formula (Flesch, 1948), the Flesch-Kincaid readabil-

BROWN 11
Table 1: The Accuracy of First Language Readability Estimates Using the Fry Scale (Adapted From Brown, Chen, & Wang, 1984)
Passage Grades Established Fry Scale Estimate
SRA By Student Kit Performance Mean SD Low - High
3A 3.5 3.22 1.20 2 - 6 4.0 4.56 1.42 3 - 6 4.5 5.56 0.88 4 - 7 5.0 6.44 0.73 5 - 7 6.0 7.11 0.93 6 - 8 7.0 8.22 2.17 6 - 13 8.0 8.67 1.50 6 - 10 9.0 9.56 1.67 6 - 12
10.0 10.22 1.48 7 - 12 11.0 10.11 2.15 6 - 12
4A 8.0 8.56 1.13 6 - 10 9.0 9.44 0.88 8 - 10
10.0 10.44 1.74 9 - 14 11.0 11.11 1.83 7 - 13 12.0 12.56 1.51 11 - 16 13.0 13.11 3.30 9 - 17 14.0 13.25 1.98 9 - 15
ity index (as described in Klare, 1984), the Fry readability index (see Fry, 1985), as well as the Gunning index, the Fog count, and a modified version of the Gunning-Fog readability index (see Larson, 1987).
Second language readability
In contrast to the vast amount of work that has been done on first language readability indices, very little has been done with regard to readability indices specifically designed for second language students. (For an excellent overview of readability issues directly related to ESU EFL teaching, see Carrell, 1987.)
I was able to find only a few studies wherein readability was investigated in languages other than English. A readability formula was developed for Vietnamese (Nguyen & Henkin, 1982), and the Fry formula was applied to Spanish texts (Gilliam, Pena, & Mountain, 1980). In addition, Klare (1963, pp. 98-99, 272-274) surveyed nine other early studies of readability indices for French, German, Japanese, and Spanish.
12 JALT JOURNAL
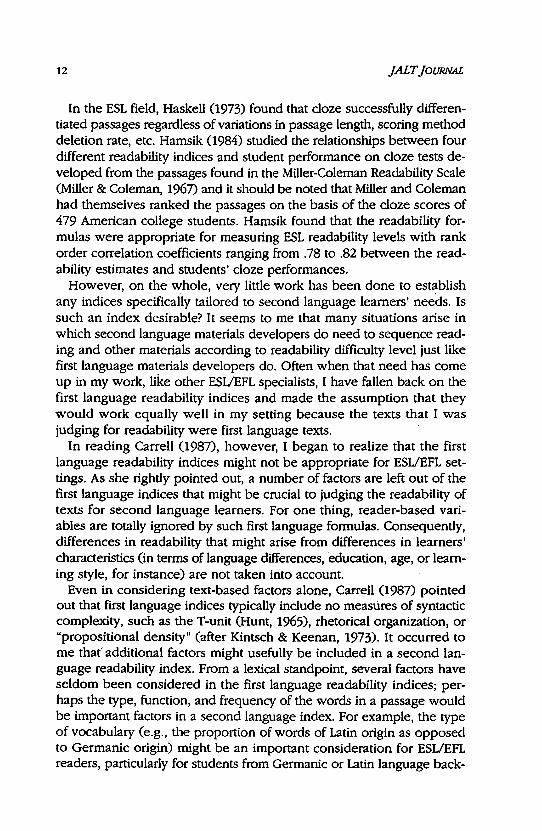
In the ESL field, Haskell (1973) found that cloze successfully differentiated passages regardless of variations in passage length, scoring method deletion rate, etc. Hamsik (1984) studied the relationships between four different readability indices and student performance on cloze tests developed from the passages found in the Miller-Coleman Readability Scale (Miller & Coleman, 1967) and it should be noted that Miller and Coleman had themselves ranked the passages on the basis of the cloze scores of 479 American college students. Hamsik found that the readability formulas were appropriate for measuring ESL readability levels with rank order co~elation coefficients ranging from .78 to .82 between the readability estimates and students' cloze performances.
However, on the whole, vety little work has been done to establish any indices specifically tailored to second language learners' needs. Is such an index desirable? It seems to me that many situations arise in which second language materials developers do need to sequence reading and other materials according to readability difficulty level just like first language materials developers do. Often when that need has come up in my work, like other ESVEFL specialists, I have fallen back on the first language readability indices and made the assumption that they would work equally well in my setting because the texts that I was judging for readability were first language texts.
In reading Carrell (1987), however, I began to realize that the first language readability indices might not be appropriate for ESVEFL settings. As she rightly pointed out, a number of factors are left out of the first language indices that might be crucial to judging the readability of texts for second language learners. For one thing, reader-based variables are totally ignored by such first language formulas. Consequently, differences in readability that might arise from differences in learners' characteristics (in terms of language differences, education, age, or learning style, for instance) are not taken into account.
Even in considering text-based factors alone, Carrell (1987) pointed out that frrst language indices typically include no measures of syntactic complexity, such as the T-unit (Hunt, 1965), rhetorical organization, or "propositional density" (after Kintsch & Keenan, 1973). It occurred to me thal' additional factors might usefully be included in a second language readability index. From a lexical standpoint, several factors have seldom been considered in the first language readability indices; perhaps the type, function, and frequency of the words in a passage would be important factors in a second language index. For example, the type of vocabulaty (e.g., the proportion of words of Latin origin as opposed to Germanic origin) might be an important consideration for ESUEFL readers, particularly for students from Germanic or Latin language back-

BROWN 13
grounds or even for students from other language groups. The frequency of the vocabulary items within the passage itself (Le., the redundancy), or the frequency of the vocabulary items in the language might also be important factors in second language readability. What about the type of passage? For instance, could important differences exist in the readability of straight prose passages in cOl1trast to dialogs, or other types of texts? What about extra-textual factors? Do accompanying illustrations, diagrams, and charts make a passage more readable for second language students? What about language specific factors like the number of words in the language of the students that are loan words from English?
Purpose of this Study
These and many other questions ultimately lead to the study that is being reported here. To answer such questions, I decided to focus on two central issues. One purpose was to investigate the relationship between frrst language readability estimates and actual passage difficulties as established by EFL learners. In other words, I wanted to find out whether those indices were adequate for distinguishing EFL readability levels. A second purpose was to explore a wide range of textual and extra-textual characteristics which might help to predict the relative difficulty that EFL students have with different passages. In the process, every effort was made to keep an open mind so that the data would guide me into discovering any existing patterns rather than the other way around. Nevertheless, the following exploratory, open-ended research questions were posed at the outset of this study:
1. Are randomly selected doze tests reliable and valid tools for gathering data on the linguistic text variables that may be related to passage difficulty?
2. To what degree are traditional first language readability indices related to the average doze scores for the same passages (when they are administered to EFL students)?
3. What combination of linguistic text variables best predicts passage difficulty for EFL students?
4. How can this combination of linguistic text variables be used as an EFL Difficulty Estimate?
5. How does the EFL Difficulty Estimate compare to existing first language indices?
Since this research was exploratory in nature, the alpha level for all statistical decisions was set at a conservative < .01.

14 JALT JOURNAL
Method
Participants
This study focused on the performance of 2,298 japanese university students who were all native speakers of japanese. The participants, selected as intact EFL classes from 18 different colleges and universities across japan, ranged in age from 18 to 24 and included 880 females and 1,418 males. A total of fifty cloze procedures were administered such that all students were randomly assigned across all testing sessions to their particular doze passages. This was done so that the results of the different groups could reasonably be assumed to be equivalent across the fifty doze procedures. An average of 45.96 students took each cloze, with a range of 42 to 50.
One problem with this study is that it focuses entirely on the performance of university students in japan. Thus the results can only be generalized to japanese university students. However, the fact that only one nationality was used can also be considered a strength of the study. In many studies in North America and other ESL settings, students with a variety of language backgrounds are mixed together. The results of such studies are difficult to interpret, at best, and cannot reasonably be generalized beyond the single institution in which the data were gathered. In addition, while the participants in this study are not a random sample of all japanese university students, the sample is at least fairly large and homogeneous with regard to the nationality, language background, and educational level of the students.
Materials
The doze procedures used here were based on texts which had been randomly selected from fIfty randomly chosen books in the adult reading section of the Leon County Public Library in Tallahassee, Florida. A page was randomly chosen from each book and the actual passages were isolated by backing up to a logical starting point for a 400 to 450 word passage. Thus the passages were not 100 percent arbitrary. They were selected so that they would form sensible semantic units. Some passages were somewhat longer than 450 words because the stopping point was also determined by logical stopping pOints. In fact, the fifty passages ranged in length from 366 to 478 words with an average of 412.1 words per passage. The result was a set of fifty passages selected such that they can be assumed to represent the passages that would be encountered in the books found in a U.S. public library.
Once a passage was selected j eveIY 12th word was deleted (for a total of thirty blanks) in order to create doze procedures. The 12th word

BROWN 15
deletion pattern was used instead of the more traditional 7th word deletion pattern to make the items far enough apart so that performance on one item would minimally affect performance on other items. Generally, one sentence was left intact at the beginning of each passage and one or more sentences were unmodified at the end of each passage. Blanks were placed at the top of each passage for the student's name, sex, age, native language, and country of passport. Directions explained what the students must do to fill in the blanks and how the blanks would be scored. The net result was a set of ftfty doze procedures (see the Appendix for an example of the directions and 12 doze test items taken from Test A in the pilot study reported in Brown, 1989).
The reliability estimates for the doze tests used in this study indicate that most of the doze tests were reasonably reliable, with values in the .70 to .80 range. However, the reliability estimates ranged considerably from one exceptionally low one of .172 to a high of .869 (for more details, see Brown, 1992 or 1993). The average of all fifty reliability estimates (using the Fisher z transformation) was .70. These reliability estimates are important in that the results of the study can be no more reliable than the measures upon which they are based.
A second very short ten-item doze procedure was also created on the basis of the pretesting reported in Brown (1989). This cloze was modified using procedures similar to those described in Brown (1988b) so that only blanks that had proven very effective from an item analysis point of view were deleted. The purpose of this short doze was to provide a common measure for making comparisons across the fifty groups of students.
The Importance of Randomization
Before moving to a description of the procedures used in this study, I would like to briefly discuss the importance of the notion of randomization. The passages were selected randomly from a public library and the blanks were selected on a semi-random basis (evety 12th word). Based on sampling theory, the theoretical justification for this study depends on the notion that the fifty 30-item cloze procedures constitute a collection of fifty texts which are representative of all of the texts in the Leon County Public Libraty. The representativeness of these passages appears to be supported by study of the lexical frequencies. The lexical frequencies of the fifty passages were counted and compared to the frequencies published for the "Brown" corpus (Kucera & Francis, 1967; Francis & Kucera, 1982) and after being logarithmically transformed (for an explanation of the appropriateness of this transformation, see Carroll, 19(7) were found to correlate at .93. Thus based on sampling theoty and comparison of the lexical fre-
16 JALT JOURNAL
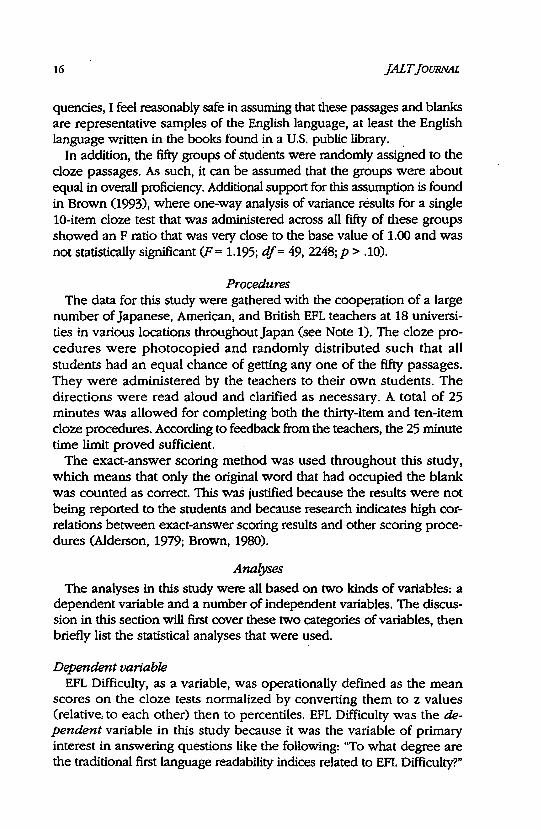
quencies, I feel reasonably safe in assuming that these passages and blanks are representative samples of the English language, at least the English language written in the books found in a U.S. public library. .
In addition, the fIfty groups of students were randomly assigned to the doze passages. As such, it can be assumed that the groups were about equal in overall proficiency. Additional support for this assumption is found in Brown (1993), where one-way analysis of variance results for a single 10-item doze test that was administered across all fifty of these groups showed an F ratio that was very close to the base value of 1.00 and was not statistically significant (F= 1.195; dl= 49, 2248;p > .10).
Procedures The data for this study were gathered with the cooperation of a large
number of Japanese, American, and British EFL teachers at 18 universities in various locations throughout Japan (see Note 1). The doze procedures were photocopied and randomly distributed such that all students had an equal chance of getting anyone of the fifty passages. They were administered by the teachers to their own students. The directions were read aloud and darified as necessary. A total of 25 minutes was allowed for completing both the thirty-item and ten-item cloze procedures. According to feedback from the teachers, the 25 minute time limit proved sufficient.
The exact-answer scoring method was used throughout this study, which means that only the original word that had occupied the blank was counted as correct. This was justified because the results were not being reported to the students and because research indicates high correlations between exact-answer scoring results and other scoring procedures (Alderson, 1979; Brown, 1980).
Analyses
The analyses in this study were all based on two kinds of variables: a dependent variable and a number of independent variables. The discussion in this section will first cover these two categories of variables, then briefly list the statistical analyses that were used.
Dependent variable EFL Difficulty, as a variable, was operationally defined as the mean
scores on the doze tests normalized by converting them to z values (relative, to each other) then to percentiles. EFL Difficulty was the dependent variable in this study because it was the variable of primary interest in answering questions like the follOWing: "To what degree are the traditional first language readability indices related to EFL DiffiCUlty?"

BROWN 17
and "What linguistic variables can best be combined to predict EFL Difficulty?" In other words, EFL Difficulty was the dependent variable because it was measured "to determine what effect, if any, the other types of variables may have on it" (Brown, 1988a, p. 10).
Independent variables The independent variables in this study were chosen because, in
one way or another, they were factors which were potentially related to the EFL Difficulty dependent variable and because they were quantifiable in some way or other. In other words, the independent variables were selected because they might statistically explain, at least in part, the varying difficulty levels of the doze passages in this study. Only ten independent variables have survived to be part of this report; these fall into two subcategories: (a) six first language readability indices and (b) four second language linguistic predictor variables (that is, those four linguistic variables that proved to have meaningful, yet nonredundant relationships with the dependent variable).
The clearest way to explain the first language readability indices is to provide the formulas that define them. For instance, the formula for the Flesch reading ease index is as follows:
1. Flesch Reading Ease Formula (Flesch, 1948)
= 206.835 - .846 (syllables/words) - 1.015 (words/sentences)
This formula simply means that you must calculate the average number of syllables per word (syllables/words) and the average number of words per sentence (words/sentences). Next, multiply the average number of syllables per word by .846 and subtract the result from 206.835. From that result, subtract 1.015 times the average number of words per sentence. The other readability indices work in similar manner:
2. Flesch-Kincaid Index (as cited in Klare, 1984)
= .39 (words/sentences) + 11.8 (syllables/words) - 15.59
3. Fry Grade Level (Fry, 1977, or 1985)
= on the Fry reading graph, the grade value at the point where the coordinates for sentences per 100 words and syllables per 100 words cross
4. Gunning Index (as cited in Carrell, 1987)
= .4 (words/sentences + % of words over two syllables)

18 JALT JOURNAL
5. Fog Count (as cited in Carrell, 1987)
[easy words + 3 (hard words) - 3J
sentences
2
6. Gunning-Fog Index (Larson, 1987)
t __ lO_n_g_W~O_rd_s_/_se_n_t_e_n_c_es __ j . = words/sentences + 100 x cIs/
wor sentences
A large number of second language linguistic predictor variables were also investigated in this study. Some of the simplest counts were the number of characters per word, syllables per word, syllables per sentence, words per sentence, syllables per paragraph, words per paragra ph, and sentences per paragraph. Two measures of syntactic complexity were also included: words per T-unit (see Hunt, 1965; Gaies, 1980) and syllables per T-unit. Some lexical frequency variables were also added (as average frequencies): average frequency of the deleted words elsewhere in the cloze blanks, average frequency of the deleted words elsewhere in the passage in which they were found, average frequency of deleted words elsewhere in the 50 passages of this study, and average frequency of the deleted words in the Brown corpus (see Kucera & Francis, 1967; Francis & Kucera, 1982). Other lexical variables were calculated as percents: the percent of long words (seven or more letters), percent of function words, percent of Germanic root words. In addition, several leamer-related variables were calculated as percents: percent of loan words to Japanese (based on Miura, 1979), and percent of Japanese Ministry of Education basic 507 words that junior high school students should know. Rhetorical organization was not studied here, but passage type was (Le., whether the passage was straight prose or included a dialog). Finally, the presence or absence of illustrations (including pictures or diagrams) was an extra-textual variable that was considered.
Many of the variables and readability indices in this study were quantified and calculated using three software programs: Scandinavian PC Systems (1988), Que Software (1990), and PC-Style by Button (1986).
Out of all of the variables examined in this study, only a small subset survived. The surviving variables were selected on the basis of correlation, factor, and regression analyses as being orthogonal and most important in predicting EFL Difficulty. This does not mean that the other variables had no value, but rather that, in comparison to those variables

BROWN 19
that survived, they were relatively less important in predicting passage difficulty for Japanese university students. In other words, the relative importance of the above listed variables might have been quite different if the students had been different (Le., had been older, had been Spanish speakers, etc.).
Of the three types of variables suggested by Carrell (987), syntactic complexity (using T-units) and leamer-related variables did not turn out to be very strongly related to EFL Difficulty in this particular study (as they were operationalized here). However, syllables per sentence and the percent of long words, which are both factors that show up in many of the traditional indices, did prove to be useful predictors of the relative difficulty of the passages for Japanese university students. In addition, two other factors related to the frequency and type of lexis were introduced in this study; these two variables, passage frequency and percent of function words, are not variables associated with traditional readability indices, but they did tum out to be useful in predicting the relative difficulty that students had with the ftfty passages involved here.
To be specific, the subset of variables which survived to be included in the ensuing analyses are the following:
1. Syll/Sent The average number of syllables found in the sentences in each passage.
2. Pass Freq The average frequency with which the correct answers in the 30 blanks appeared elsewhere in the passage.
3. % Long Words The percent of words that contained seven or more letters in the passages.
4. % Func Words The percent of function words among the 30 deleted words in each passage. The remaining words were content words. Function words included articles, prepositions, conjunctions, and auxiliaries. Content words included nouns, pronouns, verbs, adjectives and adverbs.
Statistical analyses The statistical analyses in this study included descriptive statistics for
the fifty cloze tests and for the dependent and independent variables just described. At certain points Pearson product-moment correlation coefficients were used to investigate the degree of relationship between various pairs of the variables in this study. Factor analysis techniques, including principal components analysis and Varimax rotation, were used to investigate the degree to which variables were orthogo-

20 JALT JOURNAL
nal (independent of each other). Finally, multiple regression analysis was used to investigate the degree to which combinations of the independent variables listed above could be used to predict the EFL DifficUlty dependent variable.
Results
The descriptive statistics for the fifty sets of doze passages are given in Table 2, which describes the overall test characteristics for all fifty doze tests in terms of the mean, standard deviation (SD), minimum score obtained (MIN), maximum score (MAX), the number of participants who took the particular doze (N), and the internal consistency reliability of the test (using the odd-even split-half method adjusted by the Spearman-Brown formula for full test reliability). In addition, the EFL Difficulty levels are reported in the column furthest to the right. Recall that these EFL Difficulty levels are simply the means converted to standardized percentiles (for passages relative to each other).
One salient result which surfaces in Table 2 is that the means of the fIfty cloze tests range from 1.020 to 9.918. For reasons that are explained above, the groups can be assumed to be about equal in overall profidency. Therefore, the variation among the means reported in Table 2 surely indicates considerable variation in the difficulty of the passages rather than differences in profidency among the groups. Note that, for tests with 30 items each, these means are fairly low. However, such low means are common for doze tests which have been scored by the exact-answer method.
Notice also the wide range of standard deviations, from a low of 1.247 to a high of 4.435. Such a range of standard deviations suggests considerable variation in the degree to which the students' scores were dispersed around the means on these doze tests. The minimum (MIN) and maximum (MAX) indicate similar variations with the minimum ranging from 0 to 4 and the maximum ranging from 3 to 21. The number of participants on each doze passage also ranged from 42 to 50. The reliability of the 50 doze tests likewise varied considerably. Notice that the lowest internal consistency reliability was .172, while the highest was .869. Finally, the EFL Difficulty levels show the difficulty of each of the passages relative to all other passages in percentile terms with the most difficult having the highest percentiles.
Table 3 focuses on the statistical characteristics of the first language readability indices examined in this study. Notice that, rather than being arranged by passage number as they were in the previous table, the passages are arranged here from the most difficult to the easiest as indicated by the EFL Difficulty in the second column. The remaining

BROWN 21
Table 2: Descriptive Statistics for 50 Cloze Passages
EFL Passage Mean SD Min Max N Reliability Diff.
01 5.229 3.164 0 15 48 0.708 30.15 02 4.208 3.421 0 13 47 0.858 48.40 03 2.021 2.126 0 10 48 0.735 83.40 04 7.543 3.866 2 16 46 0.803 5.59 05 3.979 2.787 0 13 47 0.734 52.39 06 5.106 3.230 0 14 47 0.803 32.28 07 6.140 3.407 0 16 43 0.825 17.36 08 3.156 2.270 0 8 45 0.457 67.00 09 2.848 2.458 0 11 46 0.773 71.90 10 2.543 2.310 0 8 46 0.825 76.42 11 5.935 3.358 0 16 46 0.742 20.05 12 8.980 3.967 0 21 47 0.789 1.22 13 2.870 1.714 0 8 46 0.503 71.57 14 3.234 2.503 0 9 47 0.682 65.91 15 9.180 3.416 4 18 49 0.683 0.96 16 1.360 1.411 0 6 48 0.650 89.80 17 1.383 1.247 0 5 46 0.348 89.62 18 1.020 1.086 0 3 50 0.500 92.36 19 4.760 2.881 0 10 50 0.701 38.21 20 4.375 3.238 0 15 47 0.855 45.22 21 9.918 4.435 0 19 48 0.840 0.37 22 3.702 2.858 0 11 47 0.841 57.53 23 3.638 2.401 0 11 43 0.646 58.71 24 2.957 2.259 0 9 47 0.436 70.19 25 5.362 2.740 0 12 46 0.627 28.10 26 2.681 1.559 0 5 47 0.172 74.54 27 2.340 2.723 0 13 47 0.869 79.39 28 2.581 2.170 0 8 43 0.574 76.11 29 2.318 1.768 0 7 44 0.640 79.67 30 9.563 3.284 3 16 48 0.715 0.59 31 3.783 3.078 0 15 46 0.832 55.96 32 3.833 2.525 0 9 42 0.770 55.17 33 2.136 1.866 0 6 44 0.633 81.86 34 5.867 2.918 0 13 45 0.819 20.90 35 6.630 3.662 0 17 45 0.719 12.30 36 5.000 2.054 0 9 46 0.505 34.09 37 5.458 3.657 0 13 48 0.767 26.76 38 1.708 1.567 0 8 48 0.746 86.65 39 2.511 1.977 0 9 47 0.648 77.04 40 3.488 1.897 0 9 43 0.659 61.41 41 2.870 2.507 0 10 43 0.764 71.57 42 4.409 3.099 0 18 44 0.811 44.43 43 1.432 1.452 0 7 44 0.190 89.25 44 3.239 2.521 0 10 46 0.673 65.54 45 6.548 3.874 0 16 42 0.788 12.92 46 2.163 1.816 0 7 47 0.307 81.59 47 3.791 2.328 0 11 43 0.685 55.96 48 2.690 2.121 0 11 42 0.738 74.54 49 4.564 2.808 0 11 49 0.748 41.48 50 2.488 2.697 0 12 45 0.774 77.34

22 JALT JOURNAL
Table 3: First Language Readability Estimates for 50 Passages
EFL Flesch Flesch- Fry Gunning Fog Gunning-Passage o iff. Kincaid Fog
18 92.36 9.69 12.7 12 6.06 9.70 40 16 89.80 8.90 13.0 9 8.99 15.72 50 17 89.62 15.60 20,4 14 9.78 18.83 58 43 89.25 11.51 13.9 10 9.72 15.16 43 38 86.65 11.01 12.9 11 8.13 12.95 42 03 83,40 2.83 4.8 3 3.25 3.51 21 33 81.86 13.82 16.3 12 11.01 20.82 59 46 81.59 8.78 11.2 9 5.80 8.50 34 29 79.67 13.58 16.0 11 11.00 17.25 46 27 79.39 9.36 10.0 9 7.20 11.02 38 50 77.34 18.51 21.3 15 13,48 25.35 64 39 77.04 5.09 6.7 6 5.81 7.54 27 10 76,42 11.86 15.2 10 9.61 15.76 46 28 76.11 12.00 14,4 14 8.23 14,48 49 26 74.54 13.95 16.6 14 9.05 16.67 54 48 74.54 8.51 11.2 8 6.95 11.59 44 09 71.90 12.30 15.3 12 9.34 16.11 49 41 71.57 12.26 14.3 12 9.33 15,47 47 13 71.57 10.65 12.1 10 8.83 13.53 40 24 70.19 10.69 13.1 10 8.95 13.61 40 08 67.00 8,46 11.2 8 7.83 11,43 36 14 65.91 4.79 8.5 6 4.26 5,45 27 44 65.54 11.60 13.9 11 7.81 12.69 43 40 61,41 5.69 8.1 6 5,47 7.53 30 23 58.71 11,45 13.9 13 7.35 12.54 46 22 57.53 8.97 10.8 9 7.16 10.67 37 47 55.96 9.99 11.9 9 8.24 12.70 40 31 55.96 8.13 11.6 10 5.26 8.09 37 32 55.17 7.80 9.6 8 5.94 8.13 30 05 52.39 11.00 13.9 10 6.57 10.38 40 02 48,40 10.71 13.5 13 6.07 10.04 42 20 45.22 8.30 10.8 8 7.03 10.24 35 42 44.43 7.10 9.1 8 5.19 7.17 31 49 41.48 7.59 10.3 7 8.19 12.00 37 19 38.21 8.27 10.2 8 6.40 9,42 35 36 34.09 7.88 11.3 8 5.82 9.37 40 06 32.28 5.18 7.0 6 4.11 5.22 27 01 30.15 6.78 9.6 7 6.15 8.65 32 25 28.10 7.72 10.2 7 7.09 9.69 31 37 26.76 6.03 8.6 2 6.81 9.26 31 34 20.90 10.69 12.8 10 8,48 13.38 42 11 20.05 2.71 5.0 3 3.05 3.22 20 07 17.36 9.37 9.9 10 6.07 10.08 43 45 12.92 8,47 11.1 8 6.72 10.06 36 35 12.30 3.69 4.8 4 4.09 4.79 22 04 05.59 5.95 7.6 6 6,41 8,41 28 12 01.22 8.59 11.0 10 5.67 8.09 32 15 00.96 9.69 12.0 10 6.41 9.98 38 30 00.59 4.63 6.5 5 5.08 6.03 22 21 00.37 4.74 7.5 5 4.85 5.91 24

BROWN 23
columns give the readability estimates for each passage using the Flesh, Flesch-Kincaid, Fry, Gunning, Fog, and Gunning-Fog indices. Notice that all of the indices except the Gunning-Fog index are on scales that resemble the grades in U.S. public schools. Notice also that, in some cases, they are fairly comparable across indices. In addition, note that the indices indicate similar relative difficulties for the passages. In other words, a passage that appears to be relatively easy on one index is also relatively easy on the other ones, while a passage that appears to be relatively difficult on one index is also relatively difficult on the others.
Table 4 shows the simple correlation coefficients above the diagonal (a line drawn from the upper left value of 1.00 to the lower right value of 1.00) and coefficients of determination below the diagonal for all possible pairs of the first language readability estimates used in this study. The coefficients of determination are calculated by squaring the correlation coefficient, and they indicate the percent of overlapping variance between the two variables involved. Thus the correlation coefficient of .48 shown above the diagonal in Table 4 between the Fry index and Observed EFL Difficulty can be interpreted as indicating that 23 percent (.48 S x 100 = .2304 x 100 = 23.04, or about 23 percent) of the variance in EFL Difficulty is accounted for by the Fry index. These squared values are shown below the diagonal.
Notice that the coefficients of determination are mostly fairly high with the lowest being .49 and the highest being .96. These relatively high coefficients indicate that the first language readability indices (vari-
Table 4: Correlation Coefficients (Above the Diagonal) and Correlation Coefficients for First Language Readability Indices and EFL Difficulty
A. Observed EFL Difficulty 1.00 0.74 0.50 0.52 0.48 0.50 0.54 0.55
B. ESL Diff. Estimate 0.55 1.00 0.70 0.72 0.66 0.66 0.70 0.73
1. Flesch 0.25 0.49 1.00 0.98 0.92 0.89 0.93 0.95
2. Flesch-Kincaid 0.27 0.52 0.96 1.00 0.90 0.87 0.92 0.95
3. Fry 0.23 0.44 0.85 0.81 1.00 0.70 0.78 0.88
4. Gunning 0.25 0.44 0.79 0.76 0.49 1.00 0.98 0.87
5. Fog 0.29 0.49 0.86 0.85 0.61 0.96 1.00 0.95
6. Gunning-Fog 0.30 0.53 0.90 0.90 0.77 0.76 0.90 1.00
A B 1 2 3 4 5 6

24 JALT JOURNAL
abies 1 through 6 in the table) are all fairly highly related to each other. In other words, they are lining up the relative difficulty of the passages in very similar ways.
The long thin rectangle (on the left side) outlines those coefficients of determination which show the percent of relationship between the various first language readability estimates and the obsetved performance of Japanese students on the cloze passages, as represented by the obsetved EFL Difficulty percentiles (variable A). It turns out that the first language indices overlap between 23 and 30 percent (depending on which one is examined) with the variance in obsetved EFL Difficulties. In short, these first language readability indices account for less than thirty percent of the variance in the obselVed EFL Difficulty levels.
A large number of linguistic variables were also examined for relationship to EFL Difficulty. Four of these variables were selected on the basis of factor analysis as being orthogonal: syllables per sentence, average frequency elsewhere in the passage of the words that had been deleted, the percent of long words of seven letters or more, and the percent of function words. When combined, they proved to be the best predictors of obsetved EFL Difficulty. The descriptive statistics for these four independent (predictor) variables and the dependent (predicted) variable, EFL Difficulty, are shown in Table 5.
Table 5: Descriptive Statistics for the Predicted and Predictor Variables
Variable Mean SD Minimum Maximum
Predicted EFL Difficulty 53.02 28.12 .37 92.36
Predictor SylVSent 36.95 12.62 15.57 76.63 Pass Freq 6.96 0.59 5.66 8.82 % Long Words 20.52 5.94 9.89 34.33 % Func Words 31.55 8.17 13.33 50.00
The degree to which the independent variables listed in the previous paragraph were collectively related to EFL Difficulty was investigated using multiple-regression analysis. The assumptions underlying multiple regression were checked and found to be met. A forward-stepping multiple-regression analysis was calculated for the four variables regressed against EFL Difficulty. The results of this regression analysis

BROWN
Table 6: Stepwise Regression Analysis of Four Independent Variables Predicting the EFL Difficulty Dependent Variable
Prob Value To Add/Remove: 0.1000
Dependent Variable: EFL Difficulty
Step 1 MR:;;: .5506 MRS:;;: 0.3032 Added Syll/Sent Step 2 MR = .6699 MRS = 0.4487 Added Pass Freq Step 3 MR = .7168 MRS = 0.5138 Added % Long Words Step 4 MR:;;: .7418 MRS:;;: 0.5502 Added % Func Words
RegreSSion Standardized Standard Variable Coefficient Coefficient Error T Prob
Syll/Sent 0.7823 0.351189 0.2793 2.8014 0.0075 Pass Freq -126.1770 -0.520334 27.3129 -4.6197 0.0000 % Long Words 1.2878 0.272007 0.6117 2.1051 0.0409 % Func Words 0.7596 0.220810 0.3982 1.9076 0.0628
Estimated Constant Term: 38.7469 Standard Error Of Estimate: 19.6800
25
are presented in Tables 6 and 7. Table 6 shows the technical results of the regression analysis including the progressive additivity of the multiple correlation (MR) and multiple coefficient of determination (MR5:). Note that the overall analysis of variance results were deleted for economy of space, but F:;;;; 13.7618, df 4, 45, P < .00001. For each independent variable, Table 6 also gives the regression coefficients, standardized coefficients, individual standard errors, t value at entry, and the probability associated with t. Finally, the constant, and an overall standard error of estimate for the predicted values of EFL Difficulty are given in the lower-left corner. Table 7 illustrates the progressive
Table 7: Summary of the Variables Contributing to the Stepwise Regression Coefficients
Dependent c: Independent Variables Variable MR MRS
Pass Diff = Syll/Sent .55 .30 Pass Diff:;;: Syll/Sent + Pass Freq .67 .45 Pass Diff = SylVSent + Pass Freq + % Long Words .72 .51 Pass Diff = Syll/Sent + Pass Freq + % Long Words + % Func Words .74 .55

26 jALT JOURNAL
additivity of the variables and the associated multiple correlations (MR) and the multiple coefficients of determination (M~.
These results indicate that the combination of Syll/Sent + Pass Freq +
% Long Words + % Func Words taken together produce a multiplecorrelation (MR) of .74 and a corresponding MRS: of .55. This means that the combination of Simple countable independent variables taken together predicts about 55 percent of the variance in the performance of Japanese students on the 50 cloze passages in this study. In other words, the results here indicate that each of the independent variables separately is related to EFL Difficulty and that, taken together, they account for 55 percent of the variance in EFL Difficulty.
Discussion
The discussion will now return to the original five research questions. The implications of these findings for second language readability estimation will then be covered in the Conclusions section.
1. Are randomly selected doze tests reliable and valid tools for gathering data on the linguistic text variables that may be related to passage diffiCUlty?
Based on Table 2, the doze passages used in this study appear on average to be moderately reliable at .70 using the adjusted Split-half method, but also, individual tests can clearly vary considerably in reliability from .172 to .869. To some degree, such variation in reliability appears to be related to the magnitude of the means and standard deviations involved. However, all of these variations in descriptive statistics and reliability could conceivably have occurred by chance alone.
For the purposes of this study, the validity of the flfty doze passages will be considered from a fairly common-sense point of view. First, the doze passages were created from books which were randomly selected from a public library, and the items for each passage were selected semi-randomly (Le., every 12th word deletion). Based on sampling theory, the passages can be said to be a representative sample of the language found in the books in the library from which they were taken, and the items can be said to provide a representative sample of the blanks that could be created in the language contained in the passages. Since the validity of a test can be defined as the degree to which it is measuring what it purports to be measuring, it seems reasonable to daim a high degree of content validity for these doze passage items because they can be said to be representative samples of the universe of all possible items (after Cronbach, 1970) if that universe is defined as Single-word
BROWN 27
blanks created in the written language which is found in a U.S. public library. For much more discussion of the reliability and validity of these passages, see Brown (1993); for an ovetview of test reliability and validity issues, see Brown (1996).
2. To what degree are traditional first language readability indices related to the average doze scores for the same passages when they are administered to EFL students?
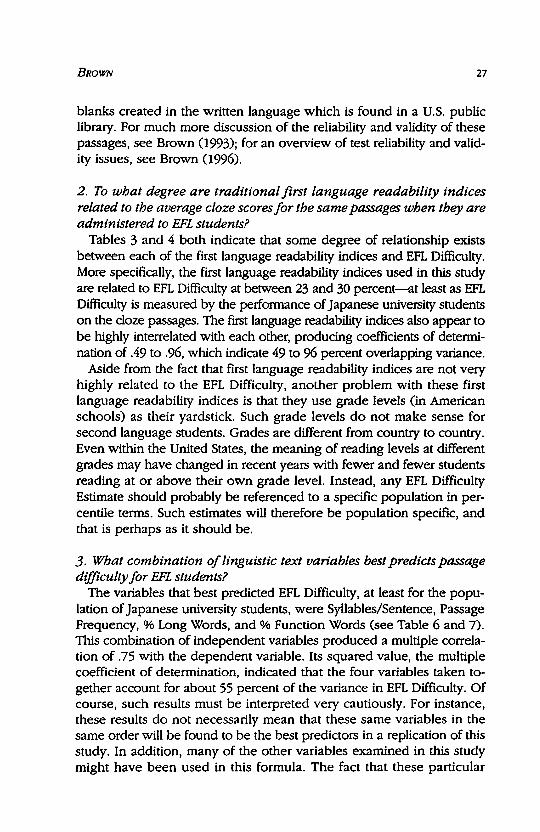
Tables 3 and 4 both indicate that some degree of relationship exists between each of the first language readability indices and EFL Difficulty. More specifically, the first language readability indices used in this study are related to EFL Difficulty at between 23 and 30 percent-at least as EFL Difficulty is measured by the performance of Japanese university students on the doze passages. The first language readability indices also appear to be highly interrelated with each other, producing coefficients of determination of.49 to .96, which indicate 49 to 96 percent overlapping variance.
Aside from the fact that first language readability indices are not very highly related to the EFL Difficulty, another problem with these first language readability indices is that they use grade levels (in American schools) as their yardstick. Such grade levels do not make sense for second language students. Grades are different from country to country. Even within the United States, the meaning of reading levels at different grades may have changed in recent years with fewer and fewer students reading at or above their own grade level. Instead, any EFL Difficulty Estimate should probably be referenced to a specific population in percentile terms. Such estimates will therefore be population specific, and that is perhaps as it should be.
3. What combination of linguistic text variables best predicts passage difficuftyforEFLstudents?
The variables that best predicted EFL Difficulty, at least for the population of Japanese university students, were Syllables/Sentence, Passage Frequency, % Long Words, and % Function Words (see Table 6 and 7). This combination of independent variables produced a multiple correlation of .75 with the dependent variable. Its squared value, the multiple
. coefficient of determination, indicated that the four variables taken together account for about 55 percent of the variance in EFL Difficulty. Of course, such results must be interpreted very cautiously. For instance, these results do not necessarily mean that these same variables in the same order will be found to be the best predictors in a replication of this study. In addition, many of the other variables examined in this study might have been used in this formula. The fact that these particular

28 JALT JOURNAL
variables were chosen was based on a factor analysis, which indicated that four orthogonal factors existed in the correlation matrix of dozens of independent variables. For those four factors, the variables listed above were the ones most strongly correlated with the factor.
4. How can this combination of linguistic text variables be used as an EFL DifficUlty Estimate? .
Like many of the first language readability indices, the EFL Difficulty Estimate can be calculated by using a regression equation. In this case, the regression equation for predicting a single dependent variable (Y) takes the form of a constant (a) and four independent variables (Xl to X4) with their associated slopes (b1 to b4). Such an equation would take the following general form:
Y = a + b1X1 + b2X2 + b3X3 + b4X4
In more familiar terms, the regression equation for predicting, or estimating, the single dependent variable (EFL Difficulty) is formed by using the constant (shown to be 38.7469 shown in Table 6), as well as the four slopes (called regression coefficients in Table 6) and the values for each of the four independent variables (Syllables/Sentence, Passage Frequency, % Long Words, % Function Words). The equation in this case would take the following form:
EFL Difficulty Estimate = 38.7469 + (.7823 x Syll/Sent) + (-126.1770 x Pass Freq) + (1.2878 x % Long Words) + (.7596 x % Func Words)
For instance, the equation for the EFL Difficulty Estimate for Passage 43 (where Syll/Sent = 76.63; Pass Freq = .41; % Long Words = 19.22; and % Func Words = 23.33) would be as follows:
EFL Difficulty Estimate = 38.7469 + (.7823 x 76.63) + (-126.1770 x .41) + {1.2878 x 19.22) + (.7596 x 23.33)
EFL Difficulty Estimate = 38.7469 + (59.9476) + (-51.7326) + (23.7515) + {17.7215)
EFL Difficulty Estimate = 89.4349 89.43
Obviously such an EFL Difficulty Estimate is not easy to calculate. The counts that are necessary and the computations are not only laborious,

BROWN 29
but are also very prone to calculation errors if done by hand. However, computer software could no doubt be developed to do the job quickly and efficiently. Examples of similar software include Scandinavian PC Systems (1988), Que Software (1990) and PC-Style by Button (1986). All three of these software packages produce frrst language readability indices, and no doubt, a similar software package could easily be programmed to count the necessary linguistic elements and calculate an EFL Difficulty Estimate like the one shown here.
5. How does the EFL Difficulty Estimate compare to existingfirst language indices?
The most variance in EFL Difficulty that was accounted for by any of the first language readability indices was 30 percent. The ESL Difficulty Estimates, on the other hand, were correlated with the EFL Difficulties at .74, which indicates that 55 percent (.742 = .5476 x 100 = about 55) of the variance in Passage Difficulties was accounted for. In other words, the EFL Difficulty Estimates accounted for more than half of the variance in Passage Difficulties. Another way to look at this issue is that the EFL Difficulty Estimates accounted for nearly twice as much variance in Passage Difficulties as did the frrst language readability indices. In short, the EFL Difficulty Estimate was much more strongly related to Passage Difficulty than any of the first language readability indices.
However, the EFL Difficulty Estimate is not without its own problems. It is still only a moderately good predictor, as indicated by the multiple coefficient of determination. Another way to think about the accuracy of predictions offered by the EFL Difficulty Estimate is to consider the standard error of estimate, which is shown to be 19.68 at the bottom of Table 6. 1his statistic indicates a confidence intetval around the predicted values within which the estimates can be expected to fall 68 percent of the time. In practical terms, this means that the estimates can be expected to be inaccurate by as much as 19.68 points 68 percent of the time.
Conclusions
In general terms, the results of this study indicate that a variety of frrst language readability indices for a set of 50 passages were only weakly correlated with the average performances of Japanese university students on cloze versions of those same passages. In other words, the frrst language indices were only weakly related to EFL Difficulty (no more than 30 percent related). The EFL Difficulty Estimate provided in this paper had a higher degree of association (about 55 percent related). Although the EFL Difficulty Estimate is not easy to calculate, it does

30 JAIT JOURNAL
account for more of the variance in EFL Difficulty than the traditional first language readability formulas. Perhaps ESVEFL readability formulas will necessarily be more complex than their first language counterparts. And perhaps higher order linguistic and student variables like those used in this study are needed.
In addition, because of the controversy surrounding the doze procedure as a criterion measure for readability indices, it might be better to think of the EFL Difficulty Estimate developed in this project as a sort of dozability index, or indication of the degree of proficiency needed to successfully fill in blanks in a doze format. Surely some association exists between the EFL Difficulty Estimate provided here and some aspect of the relative difficulty of the doze passages used. Since doze passages are well-established measures of overall ESI/EFL proficiency, the EFL Difficulty Estimate might best be viewed as a measure of the overall difficulty of passages with respect to the ESI/EFL proficiency needed to comprehend them.
The primary point is not that this particular index is the magical answer to detennining the readability of passages for use in ESVEFL curricula and materials, but rather that such an index can be created, one that is more highly related to the performance of second language learners than are the first language readability indices. A second point is that such an index may necessarily indude some reference to lexical variables, in this case, the average percent of long words (seven or more letters), the average percent of function words, and the average frequency of the word elsewhere in the passage. A third point is that EFI/ESL readability might best be estimated separately for students from different language backgrounds. Perhaps different variables in different combinations with different weightings will work better or worse in predicting the readability of passages for speakers of different languages. Thus a strategy similar to the one employed in this study could be used to constantly improve the readability estimates for speakers of different languages as we learn more and more about what makes text difficult for students to process.
Suggestions for Future Research As is often the case in research of this sort, more questions were
raised in the process of doing the study than were answered. The following research questions are provided in the hope that other researchers will pursue this line of inquiry:
1. What differences and similarities would occur if this study were replicated at other institutions in Japan? With students from other language groups? With students at other levels of study? Or other ages?

BROWN
2. What other linguistic text or extra-textual variables might be included in such research? How well would they predict EFL Difficulty?
3. What hierarchies of difficulty are found at the passage level for any of the linguistic variables (separately or combined) that would have implications for second language acquisition research?
Acknowledgments
31
I would like to thank all of those colleagues who helped at various stages of this project by administering the c/oze procedures at Dokkyo University, Fukuoka Teachers' College, Fukuoka University of Education, Fukuoka Women ~ University, International Christian University, International University of Japan, Kanazawa University, Kansei Gakuin University, Melfi University, Saga University, Seinan Gakuin University, Soai University, Sophia University, Tokyo University of Agriculture and Technology, Toyama College of Foreign Languages, Toyama University, Toyo Women'sJuniorCollege, and Waseda University. I would also !tke to thank Dr. Ian Richardson (currently a professor at King Saud University in Abha, Kingdom of Saudi Arabia) for his help in selecting and creating the c/oze procedures used here. I must also thank Dr. Thom Hudson for his careful readings and comments on an earlier version of this paper.
James Dean (jD'') Brown. Professor on the graduate faculty of the Department of ESL at the University of Hawai'i at Manoa, has published numerous articles on language testing and curriculum development and books on statistical language studies. curriculum development, and language testing. He has co-edited books on testing in Japan, testing pragmatics. performance testing and classroom testing.
Notes
1. Note that the dependent variable, Passage Difficulty was normalized by transforming it to a percentile scale (using the areas under the curve in the z distribution). The Passage Frequency variable was transformed in all analyses using a standard log transformation (see Chatterjee & Price. 1977, pp. 27-38. or Neter & Wasserman, 1974, pp. 121-130). This was necessary to correct for a curvilinear relationship with the dependent variable. Further justification for these transformations is based on Carroll (967). who found that word-frequency counts are lognormally distributed.
2. One concern whenever performing regression analysis is that the rather rigorous assumptions and design conditions be met. One of these assumptions is that the dependent and independent variables must be normally distributed. In order to achieve normality and linearity two of the variables were transformed as pointed out in footnote 2. Table 5 indicates that. as analyzed, all of the variables in the regression analysis were reasonably normal in distribution. In addition, the relationships of each of the independent

32 jALT JOURNAL
variables was found to be linear with Passage Difficulty (the dependent variable). Multicollinerarity was avoided by using factor analysis in the selection process with the goal of maximizing the orthogonality of the dependent variables. The assumption of heteroscedasticity was checked by examining the scatterplots of each variable with residuals; it was not found to be a problem. In addition, the Durbin-Watson statistic turned out to be 1.4 indicating that autocorrelation was not an issue (Chatterjee & Price, 1977, 127). However, one final problem is more worrisome. The units of analysis, doze passages, were only 50 in number. Thus the N-size for the regression was only 50, and, with four dependent variables, this may not be large enough. No hard and fast rule exists about this matter, yet this is a problem that readers should keep in mind while interpreting the results of the present study.
References Alderson, J. C. (978). A study of the cloze procedure with native and non-native
speakers of English. Unpublished doctoral dissertation, University of Edinburgh. Alderson, J. C. (979). Scoring procedures for use on c10ze tests. In C. A. Yorio,
K. Perkins, & J. Schachter (Eds.) On TESOL '79 (pp. 193-205). Washington, DC: TESOL.
Alderson, J. C. (980). Native and non-native speaker performance on doze tests. Language Learning, 30, 59-76.
Bachman,1. F. (1985). Performance on doze tests with fIXed-ratio and rational deletions. TESOL Quarterly, 19, 535-555.
Bickley, A. c., Ellington, B. J., & Bickley, R. T. (970). The doze procedure: A conspectus. Journal of Reading Behavior, 2, 232-234.
Bormuth, J. R. (1965). Validities of grammatical and semantic dassifications of doze test scores. In J. A. Figurel (Ed.), Reading and Inquiry (pp. 283-285). Newark, DE: International Reading Associates.
Bormuth, J. R. (1966). Readability: A new approach. Reading Research Quarterly, 1, 79-132.
Bormuth, J. R. (967). Comparable doze and multiple-choice comprehension tests scores. Journal of Reading, 10, 291-299.
Bormuth, J. R. (968). The doze readability procedure. Elementary English, 36, 429-436.
Brown, J. D. (1978). Correlational study of four methods for: scoring cloze tests. Unpublished MA thesis, University of California, Los Angeles.
Brown, J. D. (1980). Relative merits of four methods for scoring doze tests. Modern LanguageJournal, 64, 311-317.
Brown, J. D. (1983a). A doser look at doze: Part I - validity. In J. W. Oller Jr. (Ed.) Issues in Language Testing (pp. 237-243). Rowley, MA: Newbury House.
Brown, J. D. (1983b). A closer look at doze: Part II - reliability. In J. W. Oller Jr. (Ed.) Issues in Language Testing (pp. 243-250). I~owley, MA: Newbury House.
Brown, J. D. (1984). A doze is a doze is a doze? In J. Handscombe, R. A. Orem, & B. P. Taylor (Eds.), On TESOL '83 (pp. 109-119). Washington, DC:

BROWN 33
TESOL. Brown, j. D. (1986). Cloze procedure: A tool for teaching reading. TESOL
Newsletter, 20 (5), 1 & 7. Brown, j. D. (1988a). Understanding research in second language learning: A
teacher's guide to statistics and research design. London: Cambridge University Press.
Brown, J. D. 0988b). Tailored doze: Improved with dassical item analysis techniques. Language Testing, 5, 19-31.
Brown,j. D. (1989). Cloze item difficulty.JALTJournal, II, 46-67. Brown, j. D. (1992). What text characteristics predict human performance on
doze test items. [n the Proceedings of the Third Conference on Language Research inJapan (pp. 1-26). Urasa, Yamato-gun, Niigata-ken: International University Japan.
Brown, J. D. (1993). What are the characteristics of "natural" doze tests? Language Testing, 10, 93-116.
Brown, j. D. (1996). Testing in language programs. Upper Saddle River, NJ: Prentice Hall.
Brown, j. D., Chen, Y., & Wang, Y. (1984). An evaluation of native-speaker self-access reading materials in an EFL setting. RELCJournal, 15, 75-84.
Button, j. (986). PC-Style: The program that has a way with words. Grand Prairie, TX: Lone Star Software.
Carrell, P. L. (1987). Readability in ESL. Reading in a Foreign Language, 4, 21-40.
Carroll, j. B. (1967). On sampling from a lognormal model of word-frequency distribution. [n H. Kucera & W.N. Francis, Computational analysts of presentday Engltsh (pp. 406-413). PrOVidence, R[: Brown University.
Carver, R. P. 0977-1978). Toward a theory of reading comprehension and reading. Reading Research Quarterly, 13, 8-63.
Chall, J. S. (958). Readability: An appraisal of research and application. Columbus, OH: Ohio State University.
Chatterjee, S., & Price, B. (1977). Regression analysts by example. New York: John Wiley & Sons.
Conrad, C. (970). The cloze procedure as a measure of Engltsh proficiency. Unpublished master's theSiS, University of California, Los Angeles.
Crawford, A. (970). The cloze procedure as a measure of reading comprehension of elementary level Mexican-American and Anglo-American children. Unpublished doctoral dissertation, University of California, Los Angeles.
Cronbach, L. J. (970). Essentials ofpsychological testing (pp. 145-146). New York: Harper & Row.
Cziko, G. (1978). Differences in first- and second-language reading: The use of syntactic, semantic and discourse constraints. The Canadian Modern language ReView, 34, 473-489.
Darnell, D. K. (1970). Clozentropy: A procedure for testing English language proficiency of fmeign students. Speech Monographs, 37, 36-46.
Flesch, R. (948). A new readability yardstick. Journal of Applied Psychology, 32, 221-233.

34 JALT JOURNAL
Francis, W. N., & Kucera, H. (1982). Frequency analysis of English usage: Lexicon and grammar. Boston, MA: Houghton Mifflin.
Fry, E. B. (1977). Fry's readability graph: Clarifications, validity, and extension to level 17. journal of Reading, 21, 242-252.
Fry, E. B. (1985). The NEW reading teacher's book of lists. Englewood Cliffs, NJ: Prentice-Hall.
Fry, E. B. (1987). The varied uses of readability measurement today. journal of Reading, 30, 338-343.
Gaies, S. J. (1980). T-unit analysis in second language research: Applications, problems and limitations. TESOL Quarterly, 14, 53-60.
Gallant, R. (1965). Use of doze tests as a measure of readability in the primary grades. In J. A. Figurel (Ed.), Reading and inquiry (pp. 286-287). Newark, DE: International Reading Association.
Gilliam, B., Pena, S. C., & Mountain, L. (980). The Fry graph applied to Spanish readability. The Reading Teacher, 33, 426-430.
Goodman, K. S. (1967). Reading: A psychological guessing game. journal of the Reading Specialist, 6, 126-135.
Hamsik, M. J. (984). Reading, readability, and the ESL reader. Unpublished doctoral dissertation, Florida State University, Tallahassee, FL.
Haskell, J. (1973). Refining the cloze testing and scoring procedures for use with ESL students. Unpublished doctoral dissertation, Columbia UniverSity, New York.
Hinofotis, F. B. (980). Cloze as an alternative method of ESL placement and proficiency testing. In J. W. Oller Jr. & K. Perkins (Eds.), Research in language testing (pp. 121-128). Rowley, MA: Newbury House.
Hunt, K. W. (1965). Grammatical structures written at three grade levels. Champaign, IL: National Council of Teachers of English.
Irvine, P., Atai, P., & Oller, J. W. Jr. (1974). Cloze, dictation, and the test of English as a foreign language. Language Learning, 24, 245-252.
Kintsch, W., & Keenan, J. M. (1973). Reading rate and retention as a function of the number of propositions in the base structures of sentences. Cognitive Psychology,5,257-274.
Kintsch, W., & Vipond, D. (1979). Reading comprehension and readability in educational practice and psychological theory. In L.G. Nilsson (Ed.), Perspectives on memory research (pp. 329-365). Hillsdale, NJ: Lawrence Erlbaum.
Klare, G. R. (1963). The measurement a/readability. Ames, IA: Iowa State University .
Klare, G. R. (1984). Readability. In R. Barr, M. L. Kamil, & P. Mosenthal (Eds.), Handbook o/reading research (pp. 681-744). New York: Longman.
Kucera, H., & Francis, W. N. (1967). Computational analysis of present-day English. Providence, RI: Brown University.
Larson, R. (1987). How Readability was created. In Scandinavian PC Systems. Readability program for the IBM pc, XT and AT (pp. 8-1 to 8-20). Rockville, MD: Scandinavian PC Systems.
Miller, G. R., & Coleman, E. B. (1967). A set of thirty-six prose passages calibrated for compleXity. journal 0/ Verbal Learning and Verbal BehaVior, 6,

BROWN 3S
851-854. Miura, A. (979). English loanwords Injapanese. Rutland, Vf: Tuttle. Moyle, D. (970). Readability-the use of doze procedure. In J. Merrit (Ed.),
Reading and the curriculum (pp. 159-168). London: Ward Lock Educational. Mullen, K. (979). More on doze tests as tests of proficiency in English as a
second language. In E. J. Briere & F. B. Hinofotis (Eds.), Concepts in language testing: Some recent studies (pp. 21-32). Washington, DC: TESOL.
Neter, J., & Wasserman, W. (974). Applied linear statistical models: Regression analysts, analysis of variance, and experimental design. Homewood, IL: Irwin.
Nguyen, L. T., & Henkin, A. B. (1982). A readability formula for Vietnamese. journal of Reading, 26, 243-251.
Oller, J. W. Jr. 0972a). Dictation as a test of ESL proficiency. In H. B. Allen & R. N. Campbell (Eds.), Teaching English as a second language: A book of readings (pp. 346-354). New York: McGraw-Hili.
Oller, J. W. Jr. 0972b). Scoring methods and difficulty levels for doze tests of proficiency in English as a second language. Modern Language journal, 56, 151-158.
Oller, J. W. Jr. (1979). Language tests at school: A pragmattc approach. London: Longman.
Oller, J. W. Jr., & Inal, N. (971). A doze test of English prepOSitions. TFSOL Quarterly, 5, 315-326.
Que Software. (1990). Right writer: Intelltgent grammar checker. Carmel, IN: Que Software.
Ransom, P. E. (968). Determining reading levels of elementary school children by doze testing. In). A. Figurel (Ed.), Forging ahead In reading (pp. 477-482). Newark, DE: International Reading Association.
Revard, D. (990). Tat/oring the cloze toftt: Improvement oJcloze tests through classical Item analysts. Unpublished scholarly paper, University of Hawaii at Manoa, Honolulu.
Ruddell, R. B. (964). A study of the doze comprehension technique in relation to structurally controlled reading material. Improvement of Reading Through Classroom Practice, 9, 298-303.
Scandinavian PC Systems. (1988). Readabtltty program Jor the IBM PC, XT and AT. Rockville, MD: Scandinavian PC Systems.
Smith, F. (975). Comprehension and learning. New York: Holt, Rinehart, & Winston.
Smith, F. (1978). Understanding Reading (3rd ed.). New York: Holt, Rinehart, & Winston.
Stevens, K. C. (980). Readability formulae and McCall-Crabbs Standard Test Lessons in Reading, The Reading Teacher, 33, 413-415.
Stubbs, J. B., & Tucker, G. R. (974). The doze test as a measure of ESL proficiency for Arab students. Modern Languagejournal, 58, 239-241.
Taylor, W. L. (1953). Cloze procedure: A new tool for measuring readability. Journalism Quarterly, 30, 414-438.
Taylor, W. L. (1957). "Cloze" readability scores as indices of individual differences in comprehension and aptitude. journal of Applied Psychology, 41, 19-26.

36 JALT JOURNAL
Weaver, W. W., & Kingston, A. J. (1963). A factor analysis of the c10ze procedure and other measures of reading and language ability. Journal of Communication, 13, 252-261.
Zakaluk, B. L., & Samuels, S. J. (1988). Readabtltty: Its past, present, andfuture. Newark, DE: International Reading Association.
(Received November 16, 1997; revised January 27, 1998)
Appendix: Example of a Ooze Passage (Brown, 1989)
Name, ____________ Native Language. _______ _
(Last) (First) Sex, ________ Age, _____ Country of Passport, ______ _
Directions 1. Read the passage quickly to get the general meaning. 2. Write only one word in each blank. Contractions (example: don't and
possessives (John's bicycle) are one word. 3. Check your answers. Note: Spelling will not count against you as long as the scorer can read the word.
Example: The boy walked up the street. He stepped on a piece of ice. He fell (1) , but he didn't hurt himself.
A Father and Son Michael Beal was just out of the service. His father had helped him get his
job at Western. The (1) few weeks Mike and his father had lunch together almost every (2) . Mike talked a lot about his father. He was worried about (3) hard he was working, holding down two jobs.
"You know," Mike (4) , "before I went in the service my father could do just (5) anything. But he's really kind of tired these days. Working two (6) takes a lot out of him. He doesn't have as much (7) . I tell him that he should stop the second job, but (8) won't listen.
During a smoking break, Mike introduced me to his (9) . Bill mentioned that he had four children. I casually remarked that (10), ____ _ hoped the others were better than Mike. He took my joking (11) ____ _ and, putting his arm on Mike's shoulder, he said, "I'll be (12) if they turn out as well as Mike." (test continues)