ART 101 - Amazon Web Services
16
ART 101 Training Handbook CONTENTS Intro to ART Reports ................................................................................................................................ 1 Service DQ – ALL PROGRAMS ............................................................................................................. 4 Entry Exit DQ ............................................................................................................................................ 7 O&O ......................................................................................................................................................... 11 APPENDICES Appendix A: Sorting in Excel ................................................................................................................ 12 Appendix B: Filtering in Excel ............................................................................................................. 14 Questions? Contact the ServicePoint Helpline at 503.970.4408 or [email protected] http://web.multco.us/sun/servicepoint
Transcript of ART 101 - Amazon Web Services

ART 101 Training Handbook
CONTENTS
Intro to ART Reports ................................................................................................................................ 1
Service DQ – ALL PROGRAMS ............................................................................................................. 4
Entry Exit DQ ............................................................................................................................................ 7
O&O ......................................................................................................................................................... 11
APPENDICES Appendix A: Sorting in Excel ................................................................................................................ 12
Appendix B: Filtering in Excel ............................................................................................................. 14
Questions? Contact the ServicePoint Helpline at 503.970.4408 or [email protected] http://web.multco.us/sun/servicepoint

Revised 11.21.17 Questions? Contact the ServicePoint Helpline at 503.970.4408 or [email protected]
INTRODUCTION TO ART REPORTS Advanced Reporting Tool (ART) is the program that allows us to pull information out of ServicePoint in the form of
customized reports. ART reports can be used for monitoring data quality, measuring program outcomes, managing
workflow, or other handy tools for your program needs.
Finding the Reports You Need All reports can be found by opening the Public
Folder, followed by the Multnomah County
folder. To open a folder, click on the triangle
next to the folder name.
To get into ART, click on the
Reports tab on the left hand menu,
or click to quick link in the top right
corner of your screen
The Most Frequently Used ART Folders:
Your ART Inbox
Data Quality (DQPs, etc.)
Program Outputs & Outcomes (O&Os)
SUN Community Schools
User Reports (Community Services)
User Reports (SUN Service System)

Revised 11.21.17 Questions? Contact the ServicePoint Helpline at 503.970.4408 or [email protected]
Scheduling vs. Viewing Reports There are two different ways to pull reports from ART, ‘Scheduling’ a report and ‘Viewing’ a report:
Scheduling an ART Report Viewing an ART Report
RECOMMENDED IN MOST CASES
Faster processing time
Allows user to save a report in their ART inbox
and access again later
Allows user to schedule reports at a repeated
interval (weekly, monthly, quarterly, etc.)
Allows user to send reports to the ART inboxes of
other ART users
Slower processing time
Allows users to edit reports (edits will be lost after
exiting ART)
Allows users to use input controls to filter their
reports (only available on select reports)
How to Schedule a Report
Click the magnifying glass to the left of the report name
Click ‘Schedule Report’
Enter Report Prompts: Prompts can vary, but typically include:
EDA Provider: If you have multi-program access, enter the program you’re looking for. Otherwise, leave blank.
Provider/School(s): Click ‘Provider’ or ‘School(s)’ then click ‘Select.’ Choose your program (same program as above).
Begin Date: Set as the beginning of the time period you want to look at.
End Date: Set as the day after the end of your reporting period. Otherwise, your last day of data will not be included.
Effective Date: Change to tomorrow’s date – this tells ART how current you want your data to be.
Click ‘Next’
Select Report Format (either excel or PDF)
Select Interval (either once or repeated)
* Start and End Dates here refer to how long you want your report to keep showing up in your inbox *
Click ‘Send’ and report will appear in your ART inbox in several minutes

Revised 11.21.17 Questions? Contact the ServicePoint Helpline at 503.970.4408 or [email protected]
How to View a Report
Click the magnifying glass to the left of the report name
Click ‘View Report’
Enter Report Prompts: Prompts can vary, but typically include:
EDA Provider: If you have multi-program access, enter the program you’re looking for. Otherwise, leave blank.
Begin Date: Set as the beginning of the time period you want to look at.
End Date: Set as the day after the end of your reporting period. Otherwise, your last day of data will not be included.
Effective Date: Change to tomorrow’s date – this tell ART how current you want your data to be.
Provider/School(s): To select your program, follow the steps below:
How to Save a Report
Click the drop down arrow next to the ‘Document’ button
Hover over ‘Save to my computer as’
Select the file type you want
NOTE: Using ‘Save report to my computer as’ allows you to save only the current tab you’re looking at. ‘Save to my computer as’ will save the entire report (all tabs).
Click the word ‘Provider’ or
‘School(s)’
Wait for provider list to refresh
Find your provider in the list and
click to highlight it
Click the arrow to pull it over to the box on the right
(Repeat steps 3 & 4 to pull a
report on multiple providers)
Click ‘Run Query’
NOTE: If the ‘Run Query’ button is
faded and won’t let you click,
that means you’ve forgotten a
prompt above

Revised 5.8.17 Questions? Contact the ServicePoint Helpline at 503.970.4408 or [email protected]
Services Data Quality (DQ) – ALL Programs The Services DQ report shows all active clients who have not had a Service Transaction recorded in ServicePoint for at least 90 days as well as any clients who have services without a program entry, or services that fall outside of an entry/exit episode. This report can be used to support the validity and reliability of your program’s data. Review this report every other month as part of your ongoing data quality efforts.
Folder Path in ART:
Public Folder Multnomah County Data Quality (DQPs, etc.) Service DQ – ALL PROGRAMS
‘Schedule’ the Report with the Following Prompts:
EDA Provider: skip this prompt Provider(s): Use Select button to choose your programs Enter Effective Date: today’s date, or date in the future Start Date: first date of timeframe you want to review Day AFTER End Date: one day after the end of the timeframe you want to review
Click Next
Select Excel as report format
Set interval (one time or recurring)
Reading the Services DQ – ALL Programs (The notes below also appear at the top of the report.)
SCENARIO #1- Clients below have had NO SERVICES for 90+ Days
Only active (non-exited) clients will appear on this report
‘Entry Household ID’ - a number will only appear if there is more than 1 household member
An Entry Date shaded yellow means the client has overlapping entries - Contact the ServicePoint Helpline
‘Last Service Date’ - no date here means client has no services entered by this provider
‘Days Since Last Service’ - will be shaded blue if more than 6 months and red if more than a year
Ideally your report will show ZERO clients. Clients who appear either need to be
caught up on data entry in ServicePoint, or they need to be exited.

Revised 5.8.17 Questions? Contact the ServicePoint Helpline at 503.970.4408 or [email protected]
Next Steps in Data Clean-up for clients with no services in 90 days: If the services need to be updated, enter those services for each month as you normally would.
Clients may appear on this report because their name is not being checked to be included in the service transactions
their family members receive. Check for that scenario before exiting the client.
Clients who have exited and re-entered the program, but have no services entered yet for their current entry will also
appear on this report. Once you enter their current services, they will not appear again.
If the client has not been receiving services, exit them as of their LAST SERVICE DATE (not current date).
SCENARIO #2 - Clients below have SERVICES but NO PROGRAM ENTRY SOLUTION: ADD A PROGRAM ENTRY Click ‘Add Entry/Exit’ button to create a new entry to your program. Set the Entry Date back to the EARLIEST Service Date
NOTE: If the client’s household already has a program entry, add him or her to that entry. In a family member’s profile, click the pencil next to the appropriate program entry. Then click ‘Include Additional Household Members’ and search for the client you’d like to add.
NOTE: If the client had a service recorded by mistake, remove incorrect services by Viewing Entire Service History and deleting the Need that’s associated with the incorrect service*

Revised 5.8.17 Questions? Contact the ServicePoint Helpline at 503.970.4408 or [email protected]
SCENARIO #3 – Clients below have SERVICES OUTSIDE of their Program Entry
Dates
SOLUTION: EXTEND ENTRY/EXIT DATES TO INCLUDE ALL SERVICES
If the service date falls BEFORE the Entry Date, back date the entry by clicking the pencil next to the entry date and changing the entry date in the first window. NOTE: When backdating Entry/Exit dates, you will lose the responses to all questions. We recommend printing a screenshot of the entry page to make it easier to re-answer all of the questions.
If the service date falls LESS THAN 90 DAYS AFTER the Exit Date, simply click the pencil next to the exit date and changing the exit date to match the last service date in the first window. You will not lose responses to exit questions if you are changing to a later date.
If the service date falls MORE THAN 90 DAYS AFTER the Exit Date, create a new program entry as of that service date.
NOTE: If the client had a service recorded by mistake, remove incorrect services by Viewing Entire Service History and
deleting the Need that’s associated with the incorrect service*
*Whenever you enter a service for a client, ServicePoint generates a corresponding Need. In order to remove the service, you MUST delete the Need.

Questions? Contact the ServicePoint Helpline at 503.970.4408 or [email protected] Revised 5.8.17
ENTRY/EXIT DATA QUALITY REPORT The Entry/Exit Data Quality Report flags a number of issues with client records and/or their program entries/exits including*:
1. Missing Entry/Exit data
2. Clients who have a service entered, but no program entry
3. Households that have multiple members, but only one person was entered into a program
4. Clients who don’t have a Household set up in their profiles
5. Clients who are outside the age range for a particular program
6. Two many or too few Household members identified as the Head of Household
7. Clients who have overlapping entries, or entries are within 90 days of each other
8. Clients who have program entry dates that happened before they were born
* The issues flagged in each report are specific to that program. You may not see the entire list above when you run a
report.
This report can be used to support the validity and reliability of your program’s data. Review this report every other month as part of your ongoing data quality efforts.
Folder Path in ART: Public FolderMultnomah CountyData Quality (DQPs, etc.)Entry Exit DQ – Your Program Name
‘Schedule’ the Report with the Following Prompts:
EDA Provider: Leave blank unless instructed otherwise Provider(s): Your program’s Provider Name in ServicePoint Start Date: First date of the reporting period
Day AFTER End Date: Last date of the reporting period + 1 day Enter Effective Date: Change to tomorrow’s date
Click Next
Select Excel as report format
Set interval (one time or recurring) *Schedule this report bi-monthly to monitor data quality*
NOTE: For recurring reports, the end date and effective date should be set far into the future.
All Entry/Exit Data Quality Reports will have a Summary tab.
The MISSING Data and other tabs will provide you with more details
about what data is missing and for whom.
Total # of active households, active clients, and clients by subgroup (HoH, Adults, School-Age)
For each required Entry question:
Population for whom that question is required
Total # missing that question
% of clients missing that question
The same for all required Exit questions
Ideally the MISSING Count and MISSING % columns will be empty, indicating that all required questions have been answered. Less than 5% missing data is acceptable.

Questions? Contact the ServicePoint Helpline at 503.970.4408 or [email protected] Revised 5.8.17
SCENARIO #2 – Client is missing a program entry
SOLUTION: ADD A PROGRAM ENTRY Click ‘Add Entry/Exit’ button to create a new entry into your program. Set the Entry Date back to at least the same date as the EARLIEST date client received services from your program.
NOTE: If someone else in the client’s household already has an entry into your program, add your client to that entry instead of creating a completely new entry. In a family member’s profile, click the pencil next to the appropriate program entry. Then click ‘Include Additional Household Members’ and search for the client you’d like to add. Or, follow the steps in Scenario #3 below.
SCENARIO #3 – Household has multiple members, but only one was entered into a
program SOLUTION: ADD ADDITIONAL HOUSEHOLD MEMBERS TO THE ORIGINAL ENTRY.
In the Head of Household’s profile, click the pencil next to the appropriate program entry. Then click ‘Include Additional Household Members’ and search for the client you’d like to add.
Check off the additional family members you’d like to include in the entry and click Continue.
Remember to fill out the entry assessment for the new
family member!

Questions? Contact the ServicePoint Helpline at 503.970.4408 or [email protected] Revised 5.8.17
NOTE: Any additional Household members added to an existing Program Entry using the steps above will be enrolled with the same Entry Date as the existing Program Entry. If you have an additional Household member you’d like to add to an existing Program Entry but with a different Entry Date than the existing Program Entry, please contact the ServicePoint Helpline for assistance: 503-970-4408 or [email protected]
SCENARIO #4 - Clients who don’t have a Household set up on their profiles SOLUTION: BUILD A HOUSEHOLD, STARTING FROM THE HEAD OF HOUSEHOLD’S PROFILE.
Once the Household is set up, review case file and make sure that all family members who are receiving services have
been included in all Program Entries and Services.
SCENARIO #5 - Clients who are outside the age range for a particular program
SOLUTION: DOUBLE CHECK THE DATE OF BIRTH OF THE CLIENT. If the DOB/age is correct and the client is actually outside of the age range for your program, delete their entry into your program by using the garbage can icon in the Entry/Exit Tab. Make sure you do this step from the Client Profile of the client whose Program Entry you want to delete.
SCENARIO #6 - Too many or too few Household members identified as the Head of Household
SOLUTION: REVIEW YOUR PROGRAM ENTRY AND CHANGE ANSWERS TO “RELATIONSHIP TO HEAD OF HOUSEHOLD” QUESTION.
Relationship to Head of Household is a question in many program entries. This error is NOT related to the Household you built in a client’s profile; this error is looking at how you answered the Relationship to Head of Household question in the Program Entries of one or more clients in a Household.
Each household must have and should only have ONE person designated as the Head of Household (Self – head of household)
Other Household members should be designated as one of the other options: Head of household’s child, Head of household’s spouse or partner, Head of household’s other relation, Other: non-relation member, Data not collected.

Questions? Contact the ServicePoint Helpline at 503.970.4408 or [email protected] Revised 5.8.17
SCENARIO #7 – Clients who have overlapping entries, or are within 90 days of each other
SOLUTION: CONSOLIDATE INTO ONE ENTRY
Review earlier program entry and confirm that all required data is there
Check the Client Count icon to make sure the same HH members were included on each entry
Keep one program entry using the EARLIEST ENTRY DATE and the LATEST EXIT DATE (if exited) and DELETE any other program entries by using the Garbage Can icon
Check that all service dates fall within the program Entry and Exit dates
DELETE the extra program entry by using the Garbage Can icon next to the exit date in the Entry/Exit tab.
NOTE: Deleting a Program Entry from a Head of Household’s profile will not remove it from the profiles of the other members of the Household. You must enter each Household members’ profile individually and delete the Program Entry from their record’s Entry/Exit tab.
SCENARIO #8 - Clients who have program entry dates that happened before they were born
NOTE: Typically this scenario occurs with babies born during program enrollment. If it’s actually the DOB that is incorrect, leave the Entry Date unchanged and simply update the client’s DOB.
SOLUTION: CHANGE THE ENTRY DATE FOR ONE CLIENT ONLY TO MATCH THEIR DOB If the DOB is incorrect, simply change it in the client’s program entry. If the DOB is correct and it’s a child who was born during a family’s enrollment, follow these steps:
Click the pencil next to the client’s program entry date
At the first screen, uncheck every HH member’s name except for the client in question
Type in the correct entry date (their DOB) and Save and Continue
Inside the program entry, confirm that you only changed the entry date for the correct client

Revised 4.25.14 Questions? Contact the ServicePoint Helpline at 503.970.4408 or [email protected]
OUTPUTS & OUTCOMES REPORT (O&O) The Outputs & Outcomes report shows the target outcomes for your program as well as your current progress towards those goals. This report can be used to monitor your program’s contractual compliance. Review this report QUARTERLY to make sure you will meet your annual program targets.
Folder Path in ART:
Public Folder Multnomah County Program Outputs & Outcomes (O&Os) FY14 O&Os your program (there are 2 pages of choices)
‘Schedule’ the Report with the Following Prompts:
EDA Provider: if you have multi-program access, enter the program you’re looking for
Provider: same program as above Begin Date: first day of the fiscal year End Date: last day of the quarter +1
Click Next
Select Excel or PDF as report format
Set interval (one time or recurring)
Reading the O&O
Program name or service category
Text describing program measure
Target number or percentage, defined by program contract
The actual number of clients being counted in the measure (Ex: Your program outcomes measure the number of clients who exit, and their exit destination. Your report may say “8/12 exited to permanent housing”. That means that 12 clients were exited and 8 of those moved into permanent housing; Numerator does not include “Don’t Know or Refused”).
Ideally you will run this report once each quarter (September, January, April & July). Use this tool to plan and
monitor your progress towards annual targets and overall contractual compliance.
NOTES:
* SUN Service System and Community Services Program Specialists review this report quarterly and communicate with your agency administrators about progress towards targets outlined in your program contract.
* If this report has the words “Last Manual Update” in the title, it means that there are certain tallies that need to be calculated and added to the report by hand. If you have any numbers that are faded/grayed out, please contact us to have that figure manually updated.

Revised 4.25.14 Questions? Contact the ServicePoint Helpline at 503.970.4408 or [email protected]
SORTING DATA IN EXCEL Sorting the data will change the order in which the records are displayed, but each row will be kept together so that the data is correctly maintained. Suppose that you want to sort the data by Head of Household. To sort based on this column: Open your Excel spreadsheet.
Select “Sort” from the Data ribbon.
The following dialog box appears. Tell Excel to Sort by Head of Household by selecting this variable from the drop-down menu list, and also note that you are asked whether you wish to sort in an ascending or descending order. Here, we will sort from Head of Household to non-Head of Household.
Click OK, and Excel returns the data sorted by whether or not the person is the Head of Household.
NOTE: You can sort by more than one variable. For example, suppose that you wanted to also sort by Days Since Last Service. Once again, select “Sort” from the Data ribbon. In the upper-left-hand corner of the dialog box that appears, click “Add Level” and then choose the following:

Revised 4.25.14 Questions? Contact the ServicePoint Helpline at 503.970.4408 or [email protected]
The data should now appear as follows:
CUSTOM SORTING
When you sort data with Excel, it is done by default alphabetically, numerically, or by date. Sometimes, you may have items in your list that you would like sorted in a different way.
For example, let’s start with the original dataset (i.e., before sorting by Head of Household or Days Since Last Service). Suppose you want to sort by the variable SUN Service System Contract. Furthermore, you want to sort the variables in this order: Region 4, Culturally-Specific, None.
From the Sort dialog box, select “Custom List.”
Enter the following in the List Entries section of the Custom Lists box:
Click “Add” to select the order of your variables. Click ‘OK’ and your data should appear sorted as you requested.

Revised 4.24.14 Questions? Contact the ServicePoint Helpline at 503.970.4408 or [email protected]
FILTERING DATA IN EXCEL
A filter allows you to quickly and easily subset your data. In other words, you can view only those records that meet certain criteria. To create a filter in Excel:
Highlight all of the columns in your spreadsheet.
Select ‘Filter’ from the Data ribbon.
You will now see a drop-down arrow on each column header. These drop-down arrows allow you to choose what items in that column you’d like to filter out.
For Example: If you’d like to see only the clients that have a household type of Female Single Parent, click on the Household Type drop-down arrow and select only ‘Female Single Parent.’
Revised 4.24.14 Questions? Contact the ServicePoint Helpline at 503.970.4408 or [email protected]
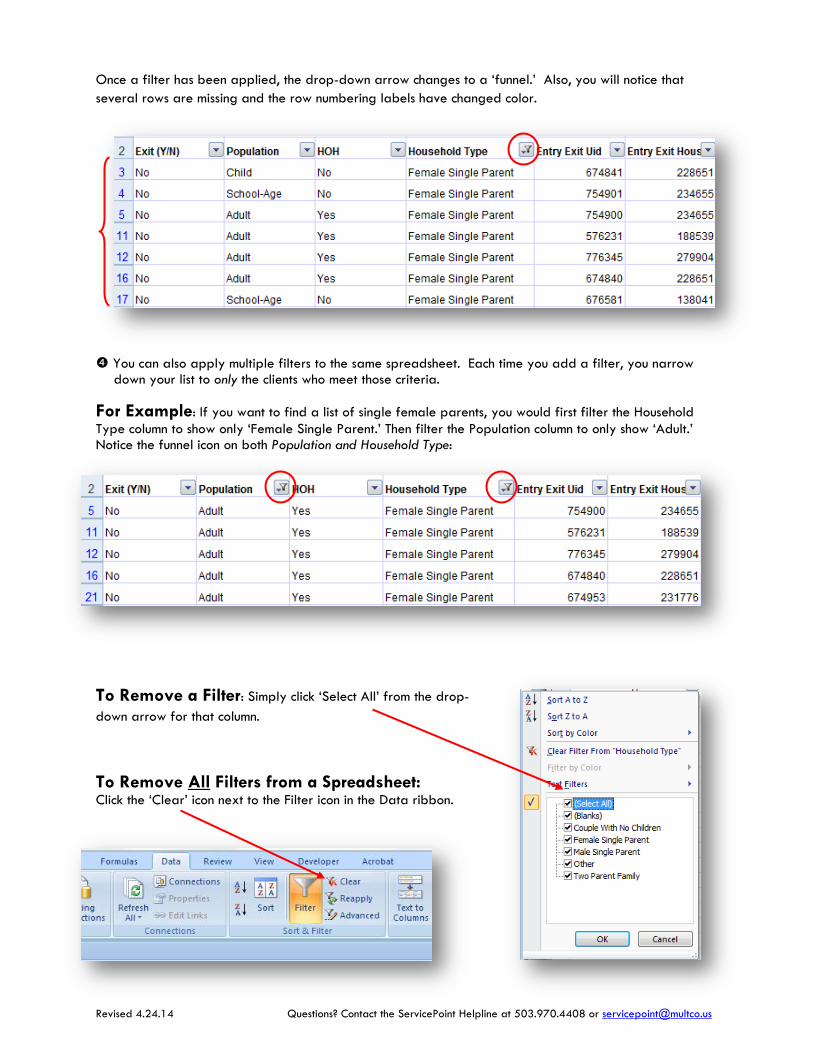
Once a filter has been applied, the drop-down arrow changes to a ‘funnel.’ Also, you will notice that several rows are missing and the row numbering labels have changed color.
You can also apply multiple filters to the same spreadsheet. Each time you add a filter, you narrow down your list to only the clients who meet those criteria.
For Example: If you want to find a list of single female parents, you would first filter the Household Type column to show only ‘Female Single Parent.’ Then filter the Population column to only show ‘Adult.’ Notice the funnel icon on both Population and Household Type:
To Remove a Filter: Simply click ‘Select All’ from the drop-down arrow for that column.
To Remove All Filters from a Spreadsheet: Click the ‘Clear’ icon next to the Filter icon in the Data ribbon.