ars.els-cdn.com · Web viewof capsaicin-induced changes (1 µM, puff applied) in cytosolic Ca2+...
9
Supplementary data 1.1. Supplementary Table siControl siNCLX Significa nce, p Resting Potential -61 ± 2 mV -65 ± 1 mV ns, p=0.09 R in 840 ± 164 MΩ 665 ± 54 MΩ ns, p = 0.2 AP Threshold -19 ± 3 mV -16.8 ± 1.7 mV ns, p=0.484 AP/ramp 14.2 ± 5.2 mV 9.2 ± 3 mV ns, p=0.2 Supplementary Table 1. Values and statistical comparison of the passive properties (resting potential and input resistance, R in ) and excitable parameters (threshold for action potential and number of action potentials per current ramp) of nociceptor-like neuron transfected with either siControl (n=7) or siNCLX (n=13). Unpaired t- test. 1
Transcript of ars.els-cdn.com · Web viewof capsaicin-induced changes (1 µM, puff applied) in cytosolic Ca2+...

Supplementary data
1.1. Supplementary Table
siControl siNCLX Significance,
p
Resting Potential -61 ± 2 mV -65 ± 1 mV ns, p=0.09
Rin 840 ± 164 MΩ 665 ± 54 MΩ ns, p = 0.2
AP Threshold -19 ± 3 mV -16.8 ± 1.7 mV ns, p=0.484
AP/ramp 14.2 ± 5.2 mV 9.2 ± 3 mV ns, p=0.2
Supplementary Table 1. Values and statistical comparison of the passive properties (resting potential
and input resistance, Rin) and excitable parameters (threshold for action potential and number of action
potentials per current ramp) of nociceptor-like neuron transfected with either siControl (n=7) or
siNCLX (n=13). Unpaired t-test.
1

1.2. Supplementary Figures
Supplementary Figure 1. Ca2+ induced-Ca2+ release from ryanodine- and IP3-sensitive internal
stores is not involved in the TRPV1/NCLX crosstalk. Representative traces (left) of capsaicin-
induced changes (1 µM, puff applied) in cytosolic Ca2+ indicator Fura-2 AM fluorescence, in
nociceptor-like DRG neurons co-transfected with either siControl (black) or siNCLX (red) and treated
with10 M Ryanodine, 10 M Xestospongine C and 100 M 2-APB (see Methods). Note, decrease in
amplitude and influx of [Ca2+]C, in neurons transfected with siNCLX. Right, Mean ± SEM of changes
in amplitude (peak (F- F0)/F0), and cytosolic Ca2+ influx rate (ΔF/s). nsiControl = 30; nsiNCLX = 25. **
p<0.05, ***p<0.001. Student's t-test.
2

Supplementary Figure 2. siMCU impairs mitochondrial Ca2+ influx. A. Mitochondrial Ca2+
transients in HEK293T cells transfected with either siControl or siMCU following a puff application of
1 µM capsaicin (indicated by arrow). B. Mean ± SEM of mitochondrial Ca2+ influx and efflux rate
(ΔF/s) in siControl (black, n=120) and siMCU (red, n=95). ** p < 0.01; Student's t-test.
3

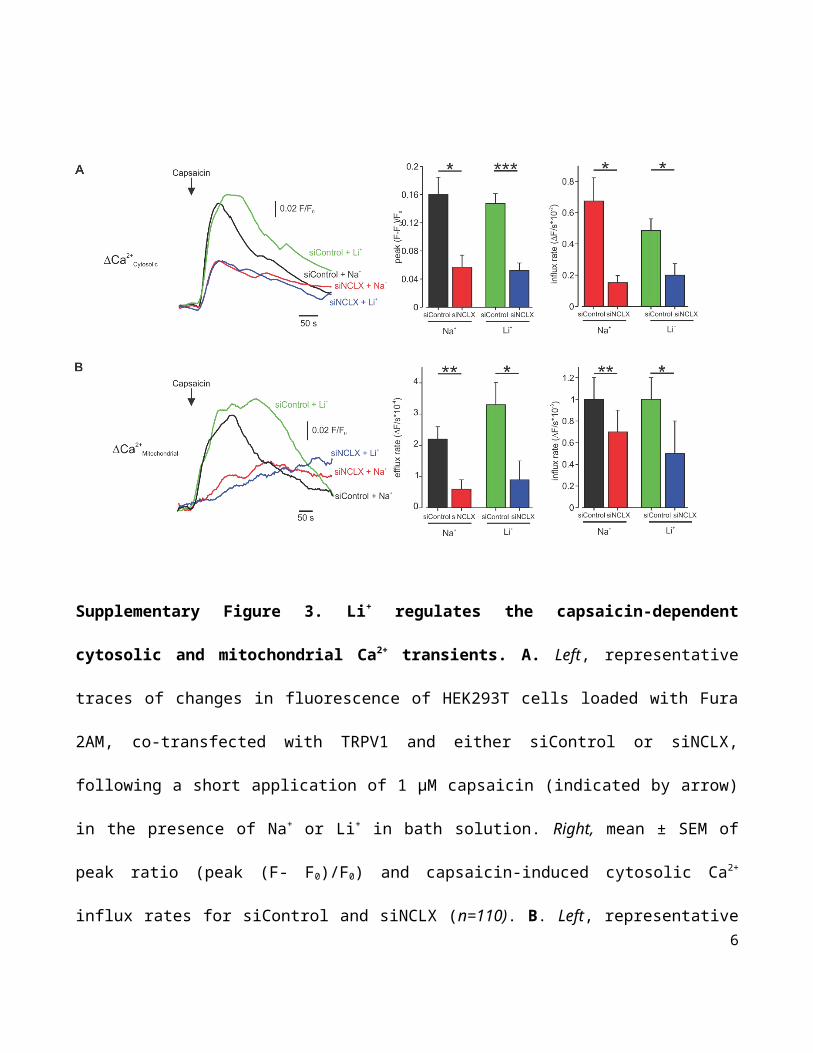
Supplementary Figure 3. Li+ regulates the capsaicin-dependent cytosolic and mitochondrial Ca2+
transients. A. Left, representative traces of changes in fluorescence of HEK293T cells loaded with
Fura 2AM, co-transfected with TRPV1 and either siControl or siNCLX, following a short application
of 1 µM capsaicin (indicated by arrow) in the presence of Na+ or Li+ in bath solution. Right, mean ±
SEM of peak ratio (peak (F- F0)/F0) and capsaicin-induced cytosolic Ca2+ influx rates for siControl and
siNCLX (n=110). B. Left, representative traces of changes in mitochondrial Ca2+ indicator Rhod-2 AM
fluorescence, following application of 1 µM capsaicin in the presence of Na+ or Li+ , in bath solution,
imaged from HEK293T cells co-transfected with TRPV1 and either siControl or siNCLX. Right, mean
± SEM of mitochondrial Ca2+ influx and efflux rate (ΔF/s) recorded from HEK293T cells co-transfected
with TRPV1 and either siControl or siNCLX (n=100). * p<0.05, Student's t-test.
4

Supplementary Figure 4. Co-localization of TRPV1-YFP and Mito-Cherry. Fluorescent confocal
images of HEK293T cells co-transfected with TRPV1-YFP and Mito-Cherry. Magnification X100.
Scale bar 5 µm.
5
Supplementary Figure 5. Capsaicin does not affect the mitochondrial membrane potential in
naïve HEK293T cells. Left, normalized representative fluorescent traces of the mitochondrial
membrane potential in HEK293T cells transfected either with TRPV1 or empty vector (pcDNA).
Right, quantification of changes in fluorescence after application of 10µM capsaicin in HEK293T cells
with or without TRPV1 expression (n=84). FCCP was added at the end of each experiment, to calibrate
for mitochondrial membrane potential.
6