Around the World The World Dairy Situation - Dairy · PDF file(all categories included) ......
7
1 Annual Na(onal Workshop for Dairy Economists and Policy Analysts Session IV: Status and Opportunities for Dairy Sectors Around the World The World Dairy Situation Véronique Pilet, CNIEL, France Milwaukee, May 1, 2014 World dairy production (all categories included) Geographic breakdown of world milk production in 2013 (millions of tonnes) World total: 782 million tonnes Europe 215 27% EU-27 156 Russia 31 Ukraine 12 Belarus 6 Asia 303 39% India 141 China 48 Pakistan 39 Turkey 18 Africa 46 6% Sudan 8 Egypt 6 Kenya 4 Central America 17 2% Mexico 11 N. America 100 13% United States 92 Canada 9 S. America 70 9% Brazil 35 Argentina 11 Colombia 6 Oceania 29 4% New Zealand 20 Australia 9 FAO Food Outlook November 2013, IDF, DCANZ for NZ
Transcript of Around the World The World Dairy Situation - Dairy · PDF file(all categories included) ......

1
Annual Na(onal Workshop for Dairy Economists and Policy Analysts
Session IV: Status and Opportunities for Dairy Sectors Around the World
The World Dairy Situation Véronique Pilet, CNIEL, France
Milwaukee, May 1, 2014
World dairy production (all categories included)
Geographic breakdown of world milk production in 2013 (millions of tonnes)
World total: 782 million tonnes
Europe 215 27% EU-27 156 Russia 31 Ukraine 12 Belarus 6
Asia 303 39% India 141 China 48 Pakistan 39 Turkey 18 Africa 46
6% Sudan 8 Egypt 6 Kenya 4
Central America 17 2% Mexico 11
N. America 100 13% United States 92 Canada 9
S. America 70 9% Brazil 35 Argentina 11 Colombia 6
Oceania 29 4% New Zealand 20 Australia 9
FAO Food Outlook November 2013, IDF, DCANZ for NZ

2
Regional dynamics
Evolu(on of dairy produc(on (all categories included) 2008 to 2013
World total: + 89 million tonnes
Europe + 0 Mt
Asia + 55 Mt
Africa + 10 Mt South America + 13 Mt
Oceania + 4 Mt
CNIEL / IDF, FAO Food Outlook Mt: million tonnes
North & Central America + 7 Mt
Recent production trends by the major suppliers in 2013
Recent production tendencies among major suppliers of the world market
United States Production
12 months 2013: + 0.7% 3 months 2014: +1.0%
Australia Production
12 months 2013: -4.7% 2 months 2014: +2.5%
EU - 27 Deliveries
12 months 2013: + 1.1% 2 months 2014: +4.7%
Argentina Deliveries 12 months 2013: -5.7%
3 months 2014: +1.0%
CNIEL / USDA, Dairy Australia, EU Commission, CLAL, ZMB
New Zealand Deliveries
12 months 2013: -1.5% 2 months 2014: +9.3%
3
5
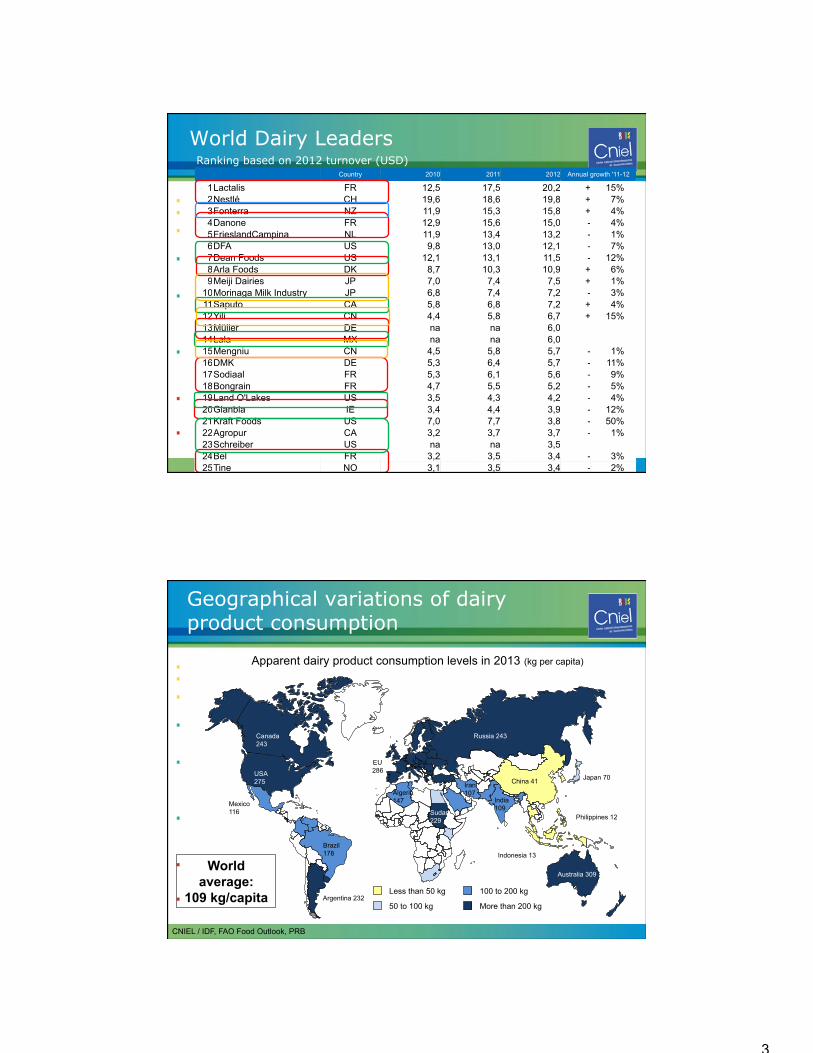
World Dairy Leaders Country 2010 2011 2012 Annual growth '11-12
1 Lactalis FR 12,5 17,5 20,2 + 15% 2 Nestlé CH 19,6 18,6 19,8 + 7% 3 Fonterra NZ 11,9 15,3 15,8 + 4% 4 Danone FR 12,9 15,6 15,0 - 4% 5 FrieslandCampina NL 11,9 13,4 13,2 - 1% 6 DFA US 9,8 13,0 12,1 - 7% 7 Dean Foods US 12,1 13,1 11,5 - 12% 8 Arla Foods DK 8,7 10,3 10,9 + 6% 9 Meiji Dairies JP 7,0 7,4 7,5 + 1%
10 Morinaga Milk Industry JP 6,8 7,4 7,2 - 3% 11 Saputo CA 5,8 6,8 7,2 + 4% 12 Yili CN 4,4 5,8 6,7 + 15% 13 Müller DE na na 6,0 14 Lala MX na na 6,0 15 Mengniu CN 4,5 5,8 5,7 - 1% 16 DMK DE 5,3 6,4 5,7 - 11% 17 Sodiaal FR 5,3 6,1 5,6 - 9% 18 Bongrain FR 4,7 5,5 5,2 - 5% 19 Land O'Lakes US 3,5 4,3 4,2 - 4% 20 Glanbia IE 3,4 4,4 3,9 - 12% 21 Kraft Foods US 7,0 7,7 3,8 - 50% 22 Agropur CA 3,2 3,7 3,7 - 1% 23 Schreiber US na na 3,5 24 Bel FR 3,2 3,5 3,4 - 3% 25 Tine NO 3,1 3,5 3,4 - 2%
Ranking based on 2012 turnover (USD)
Geographical variations of dairy product consumption
Apparent dairy product consumption levels in 2013 (kg per capita)
CNIEL / IDF, FAO Food Outlook, PRB
Less than 50 kg
50 to 100 kg
100 to 200 kg
More than 200 kg
China 41
India 109
Indonesia 13
Japan 70
Philippines 12
Iran 107 Algeria
147 Mexico 116
Argentina 232
Brazil 178
USA 275
Canada 243
EU 286
Russia 243
World average:
109 kg/capita
Australia 309
Sudan 229
4
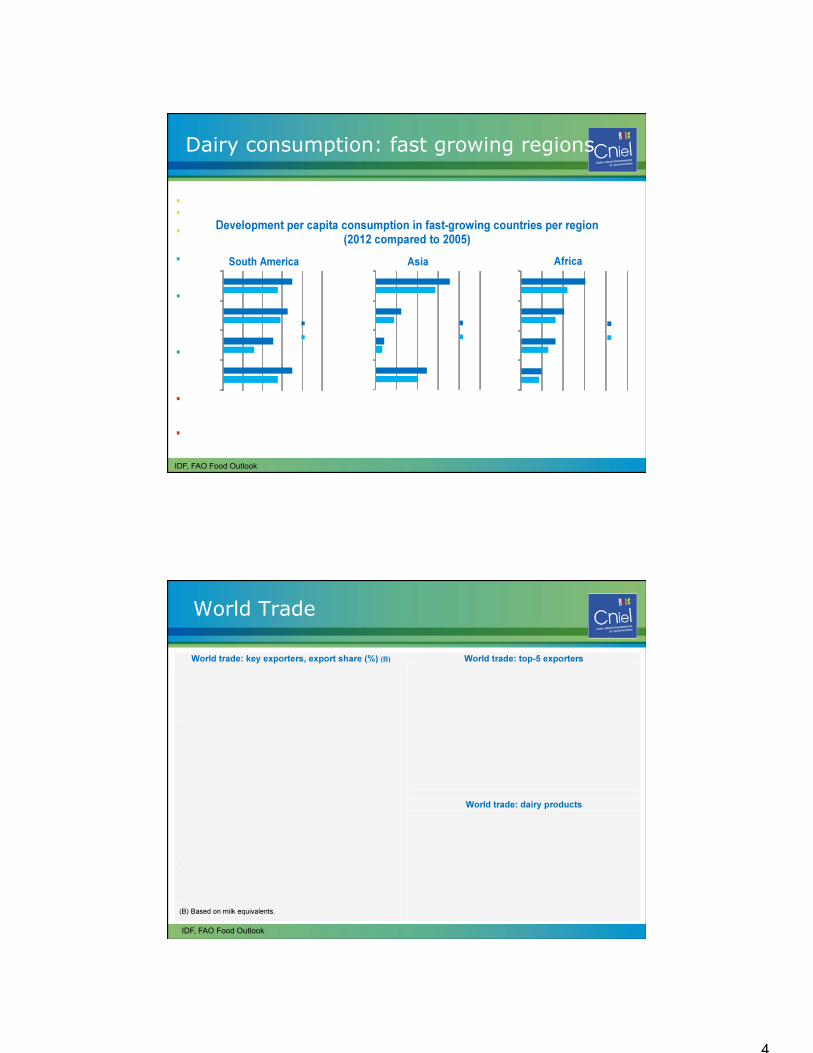
Dairy consumption: fast growing regions
IDF, FAO Food Outlook
World Trade
IDF, FAO Food Outlook

5
*Russian imports do not account for volumes originating from Belarus NB: Evolution of imports based on volume
CNIEL / Ubifrance, national customs
United States Imports 12 months
2013 Cheese : -4% Caseins : -4%
Japan Imports 12 months
2013 Cheese : +1%
China Imports 12 months 2013
SMP : +40% WMP : +53% Whey : +15%
Russia Imports* 12 months
2013 Butter : +20% Cheese : +3%
Brazil Imports 12 months 2013
WMP : -23% Cheese : +14%
Demand is sustained on main markets
Recent import tendencies on substantial markets
Algeria Import 12 months 2013
SMP: +6% WMP: -25%
Presence on the world market
Recent export tendencies among major suppliers of the world market
NB: Evolution of exports on a volume basis
CNIEL / USDA, Dairy Australia, Commission, ZMB, Ubifrance, national customs
Australia Exports: 12 months 2013 Skim milk powder: -29%
Whole milk powder: -11% Cheese: +1%
United States Exports: 12 months in 2013
Skim milk powder: +25% Cheese: +22%
Argentina Exports: 12 months 2013 Whole milk powder: -10%
Cheese: -6%
EU - 27 Exports: 12 months in 2013
Skim milk powder: -21% Whole milk powder: -3%
Butter: +0% Cheese: +3% Whey: +5%
New Zealand Exports: 12 months in 2013
Skim milk powder: + 0% Whole milk powder: +2%
Butter: -3% Butter oil: +2% Cheese: -10%
6
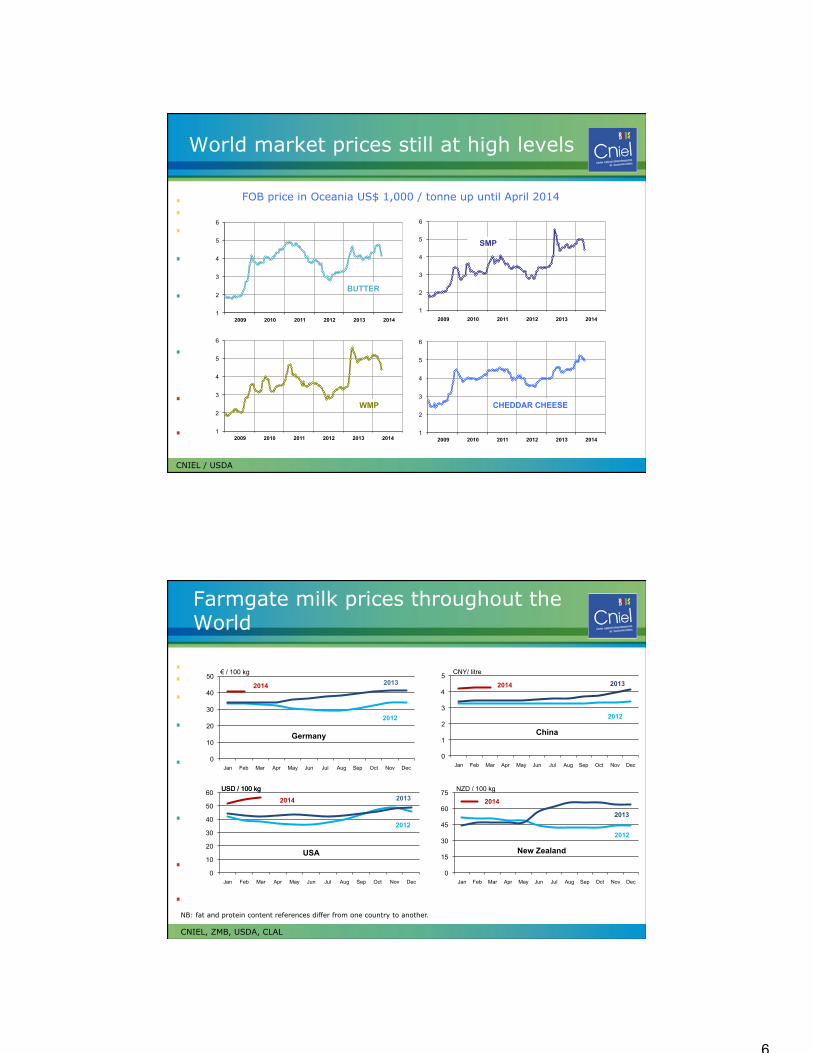
World market prices still at high levels
FOB price in Oceania US$ 1,000 / tonne up until April 2014
CNIEL / USDA
1
2
3
4
5
6
2009 2010 2011 2012 2013 2014
WMP
1
2
3
4
5
6
2009 2010 2011 2012 2013 2014
BUTTER
1
2
3
4
5
6
2009 2010 2011 2012 2013 2014
SMP
1
2
3
4
5
6
2009 2010 2011 2012 2013 2014
CHEDDAR CHEESE
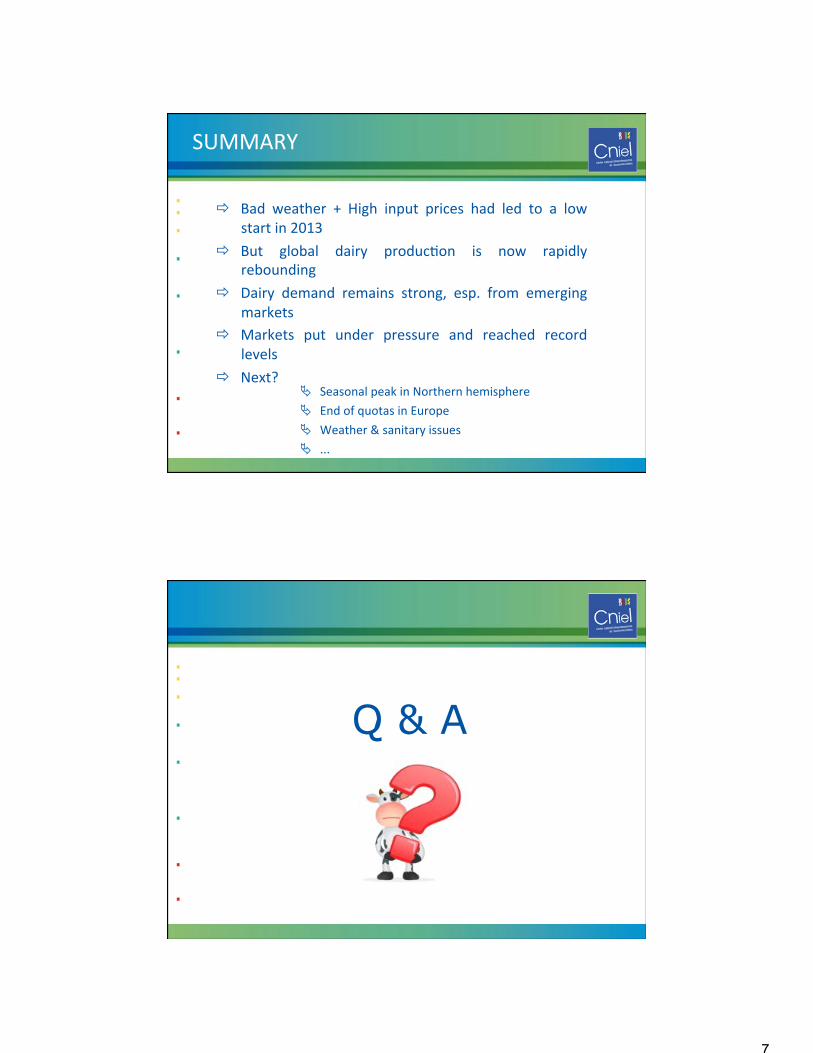
Farmgate milk prices throughout the World
NB: fat and protein content references differ from one country to another.
CNIEL, ZMB, USDA, CLAL
0
10
20
30
40
50
Jan Feb Mar Apr May Jun Jul Aug Sep Oct Nov Dec
€ / 100 kg 2013
Germany
2012
2014
0
1
2
3
4
5
Jan Feb Mar Apr May Jun Jul Aug Sep Oct Nov Dec
CNY/ litre
2013
China
2012
2014
0
10
20
30
40
50
60
Jan Feb Mar Apr May Jun Jul Aug Sep Oct Nov Dec
USD / 100 kg USD / 100 kg
2012
USA
2013 2014
0
15
30
45
60
75
Jan Feb Mar Apr May Jun Jul Aug Sep Oct Nov Dec
NZD / 100 kg
2013
New Zealand
2014
2012
7
! Bad weather + High input prices had led to a low start in 2013
! But global dairy produc(on is now rapidly rebounding
! Dairy demand remains strong, esp. from emerging markets
! Markets put under pressure and reached record levels
! Next?
SUMMARY
" Seasonal peak in Northern hemisphere
" End of quotas in Europe " Weather & sanitary issues
" ...
Q & A