Are Queenslanders meeting Australian dietary guidelines · Are Queenslanders meeting the Australian...
22
Are Queenslanders meeting the Australian Dietary Guidelines? Daily diets and total energy intake October 2018
Transcript of Are Queenslanders meeting Australian dietary guidelines · Are Queenslanders meeting the Australian...
Are Queenslanders meeting the Australian Dietary Guidelines?
Daily diets and total energy intake
October 2018
Are Queenslanders meeting the Australian Dietary Guidelines? - ii -
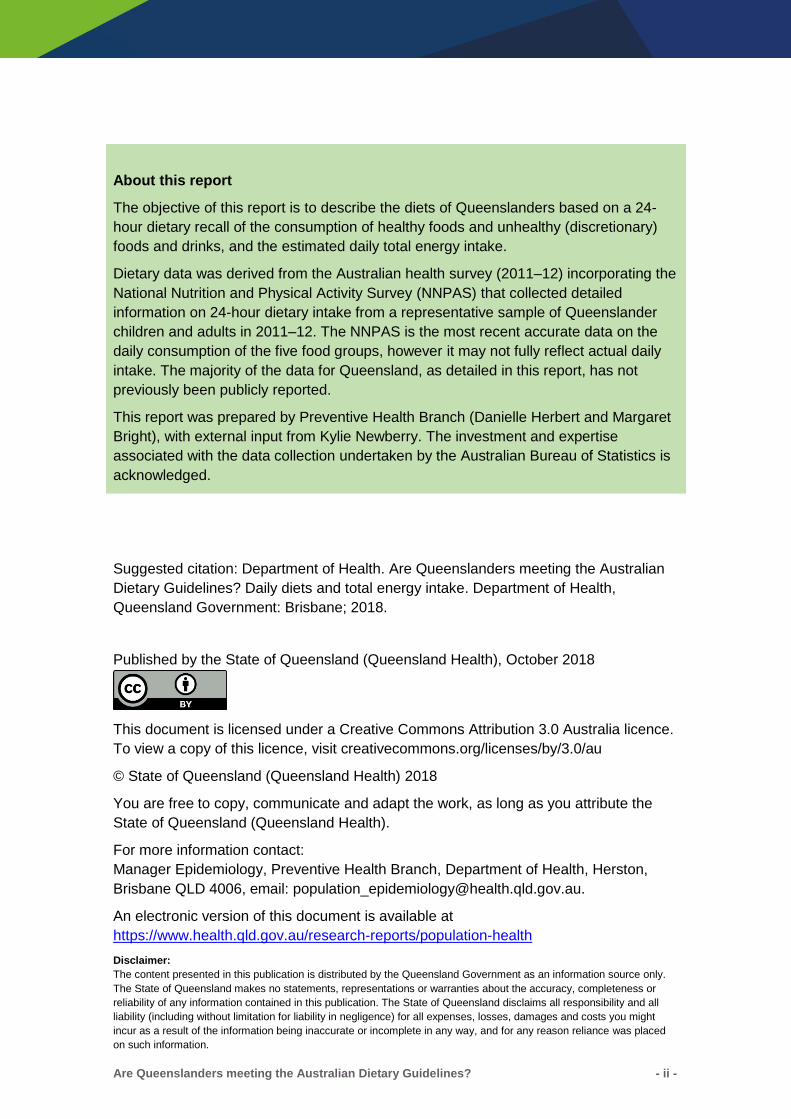
About this report
The objective of this report is to describe the diets of Queenslanders based on a 24-
hour dietary recall of the consumption of healthy foods and unhealthy (discretionary)
foods and drinks, and the estimated daily total energy intake.
Dietary data was derived from the Australian health survey (2011–12) incorporating the
National Nutrition and Physical Activity Survey (NNPAS) that collected detailed
information on 24-hour dietary intake from a representative sample of Queenslander
children and adults in 2011–12. The NNPAS is the most recent accurate data on the
daily consumption of the five food groups, however it may not fully reflect actual daily
intake. The majority of the data for Queensland, as detailed in this report, has not
previously been publicly reported.
This report was prepared by Preventive Health Branch (Danielle Herbert and Margaret
Bright), with external input from Kylie Newberry. The investment and expertise
associated with the data collection undertaken by the Australian Bureau of Statistics is
acknowledged.
Suggested citation: Department of Health. Are Queenslanders meeting the Australian
Dietary Guidelines? Daily diets and total energy intake. Department of Health,
Queensland Government: Brisbane; 2018.
Published by the State of Queensland (Queensland Health), October 2018
This document is licensed under a Creative Commons Attribution 3.0 Australia licence.
To view a copy of this licence, visit creativecommons.org/licenses/by/3.0/au
© State of Queensland (Queensland Health) 2018
You are free to copy, communicate and adapt the work, as long as you attribute the
State of Queensland (Queensland Health).
For more information contact:
Manager Epidemiology, Preventive Health Branch, Department of Health, Herston,
Brisbane QLD 4006, email: [email protected].
An electronic version of this document is available at
https://www.health.qld.gov.au/research-reports/population-health
Disclaimer:
The content presented in this publication is distributed by the Queensland Government as an information source only.
The State of Queensland makes no statements, representations or warranties about the accuracy, completeness or
reliability of any information contained in this publication. The State of Queensland disclaims all responsibility and all
liability (including without limitation for liability in negligence) for all expenses, losses, damages and costs you might
incur as a result of the information being inaccurate or incomplete in any way, and for any reason reliance was placed
on such information.
Are Queenslanders meeting the Australian Dietary Guidelines? - iii -
Contents
Summary ............................................................................................................ iv
Background ........................................................................................................ 1
Australian Dietary Guidelines ............................................................................... 1
Health benefits and recommended daily serves of five food groups ..................... 2
Daily consumption of the five food groups .......................................................... 3
Young children (2–4 years) .................................................................................. 3
Children (5–17 years) .......................................................................................... 4
Adults (18–64 years) ............................................................................................ 5
Older adults (65 years and older) ......................................................................... 5
Additional daily consumption of unhealthy foods .................................................. 6
Is healthy food consumption the same for everyone? ........................................ 10
Daily total energy intake ................................................................................... 11
Decreased daily energy intake (1995 to 2011–12) ............................................. 11
Contribution of unhealthy foods to daily energy intake ....................................... 12
Children: selected key statistics for unhealthy food consumption ....................... 13
Adults: selected key statistics for unhealthy food consumption .......................... 14
References ....................................................................................................... 18
Figures Figure 1 Proportion meeting the recommended daily consumption of the five food groups from
healthy and unhealthy foods, by age groups, Queensland, 2011–12 ..................................... 8 Figure 2 Proportion meeting recommended daily consumption of the five food groups from
healthy and unhealthy foods, children and adults, Queensland, 2011–12 ............................. 9 Figure 3 Average daily total energy intake, kilojoules, Queensland .................................................... 11 Figure 4 Proportion of daily total energy from discretionary foods, Queensland, 2011–12 ................. 12
Tables Table 1 Recommended average daily number of serves from the five food groups, children
and adults, Australia ............................................................................................................... 1 Table 2 Proportion meeting recommended daily consumption of the five food groups from
healthy and unhealthy foods, children and adults, Queensland, 2011–12 ............................. 7 Table 3 Kilojoules per serve of the five food groups .......................................................................... 11 Table 4 Proportion of Queenslanders consuming selected discretionary ‘sometimes’ foods in
the previous 24 hours, 2011–12 ........................................................................................... 15 Table 5 Proportion of Queenslanders consuming selected 100% discretionary foods and
drinks in the previous 24 hours, 2011–12 ............................................................................. 16
Are Queenslanders meeting the Australian Dietary Guidelines? - iv -
Summary
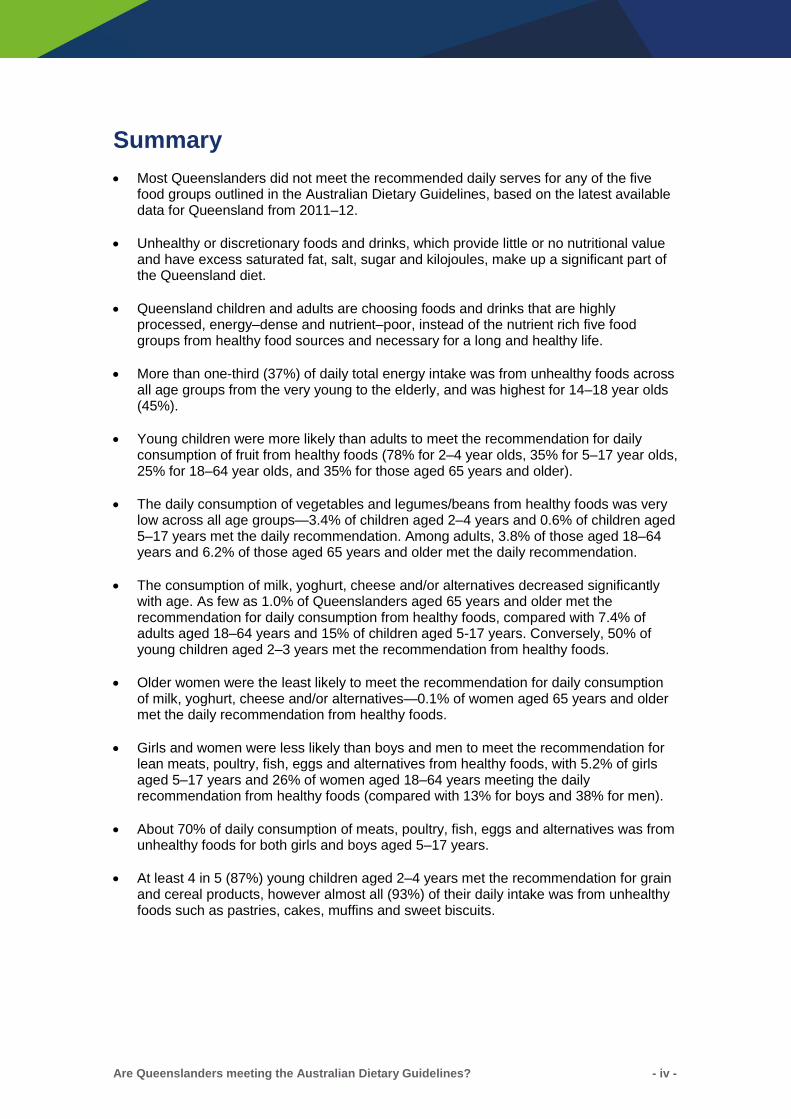
• Most Queenslanders did not meet the recommended daily serves for any of the five food groups outlined in the Australian Dietary Guidelines, based on the latest available data for Queensland from 2011–12.
• Unhealthy or discretionary foods and drinks, which provide little or no nutritional value and have excess saturated fat, salt, sugar and kilojoules, make up a significant part of the Queensland diet.
• Queensland children and adults are choosing foods and drinks that are highly processed, energy–dense and nutrient–poor, instead of the nutrient rich five food groups from healthy food sources and necessary for a long and healthy life.
• More than one-third (37%) of daily total energy intake was from unhealthy foods across all age groups from the very young to the elderly, and was highest for 14–18 year olds (45%).
• Young children were more likely than adults to meet the recommendation for daily consumption of fruit from healthy foods (78% for 2–4 year olds, 35% for 5–17 year olds, 25% for 18–64 year olds, and 35% for those aged 65 years and older).
• The daily consumption of vegetables and legumes/beans from healthy foods was very low across all age groups—3.4% of children aged 2–4 years and 0.6% of children aged 5–17 years met the daily recommendation. Among adults, 3.8% of those aged 18–64 years and 6.2% of those aged 65 years and older met the daily recommendation.
• The consumption of milk, yoghurt, cheese and/or alternatives decreased significantly with age. As few as 1.0% of Queenslanders aged 65 years and older met the recommendation for daily consumption from healthy foods, compared with 7.4% of adults aged 18–64 years and 15% of children aged 5-17 years. Conversely, 50% of young children aged 2–3 years met the recommendation from healthy foods.
• Older women were the least likely to meet the recommendation for daily consumption of milk, yoghurt, cheese and/or alternatives—0.1% of women aged 65 years and older met the daily recommendation from healthy foods.
• Girls and women were less likely than boys and men to meet the recommendation for lean meats, poultry, fish, eggs and alternatives from healthy foods, with 5.2% of girls aged 5–17 years and 26% of women aged 18–64 years meeting the daily recommendation from healthy foods (compared with 13% for boys and 38% for men).
• About 70% of daily consumption of meats, poultry, fish, eggs and alternatives was from unhealthy foods for both girls and boys aged 5–17 years.
• At least 4 in 5 (87%) young children aged 2–4 years met the recommendation for grain and cereal products, however almost all (93%) of their daily intake was from unhealthy foods such as pastries, cakes, muffins and sweet biscuits.

Are Queenslanders meeting the Australian Dietary Guidelines? - 1 -
Background
Food is vital for life and provides us with energy, protein, vitamins, minerals and essential fats, enabling us to live, grow and develop. The right amounts of nutrients required for good health and wellbeing is achieved through consuming a variety of foods. Eating a nutritious and balanced diet has numerous health benefits. Good nutrition provides protection against chronic diseases, disability and premature death. It maintains a healthy weight, physical and mental health, resistance to infection and quality of life. A considerable burden is placed on the health and wellbeing of Queenslanders from consuming unhealthy diets—high in energy, saturated fat, added sugars and salt. Combined dietary factors were the second largest cause of death and disability in Queensland in 20111,2, and accounted for 15% of the health gap between Indigenous and non-Indigenous Australians.2 Dietary factors contribute to high rates of obesity with two-thirds of adults and one-quarter of children being overweight or obese in 2014–15.3 The global burden of diet-related disease is evident in the high prevalence of chronic conditions such as obesity, type 2 diabetes, cardiovascular disease, some cancers, dental disease and osteoporosis.4 The objective of this report is to describe the diets of Queenslanders based on a 24-hour dietary recall of the consumption of healthy foods and unhealthy (discretionary) foods and drinks, and the estimated total daily energy intake. This report builds on the previous reporting of Queenslanders consuming high levels of unhealthy foods that provide excess
energy (kilojoules) and have little or no nutritional value.5 The majority of the data for Queensland, as detailed in this report, has not previously been publicly reported.
Australian Dietary Guidelines
The Australian Dietary Guidelines 2013 apply the best available evidence to promote and maintain good health and decrease the risk of chronic disease.6 The Guidelines recommend Australians enjoy a wide variety of healthy and nutritious foods from the five food groups every day and to drink plenty of water. The Guidelines define the number of serves of each food group to be consumed every day in order to support good health and decrease the risk of developing diet-related diseases.6,7 The recommended daily serves of each food group varies by sex, age group and energy needs at different life stages for children and adults (Table 1).6,7
Table 1 Recommended average daily number of serves from the five food groups, children and adults, Australia6,7
Age Fruit Vegetables, legumes
and beans
Milk, yoghurt, cheese
Lean meat and
alternatives
Grain (cereal) foods
Boys 2–3 1 2.5 1.5 1 4 4–11 1.5–2 4.5–5 2–2.5 1.5–2.5 4–5 12–18 2 5.5 3.5 2.5 6–7
Men 19–70 2 5.5–6 2.5 2.5–3 6 >70 2 5 3.5 2.5 4.5
Girls 2–3 1 2.5 1.5 1 4 4–11 1.5–2 4.5–5 1.5–3 1.5–2.5 4 12–18 2 5 3–3.5 2.5 5–7
Women 19–70 2 5 2.5–4 2–2.5 4–6 >70 2 5 4 2 3
Note: Recommended serves vary for women who are pregnant or breastfeeding.
Are Queenslanders meeting the Australian Dietary Guidelines? - 2 -
Health benefits and recommended daily serves of five food groups
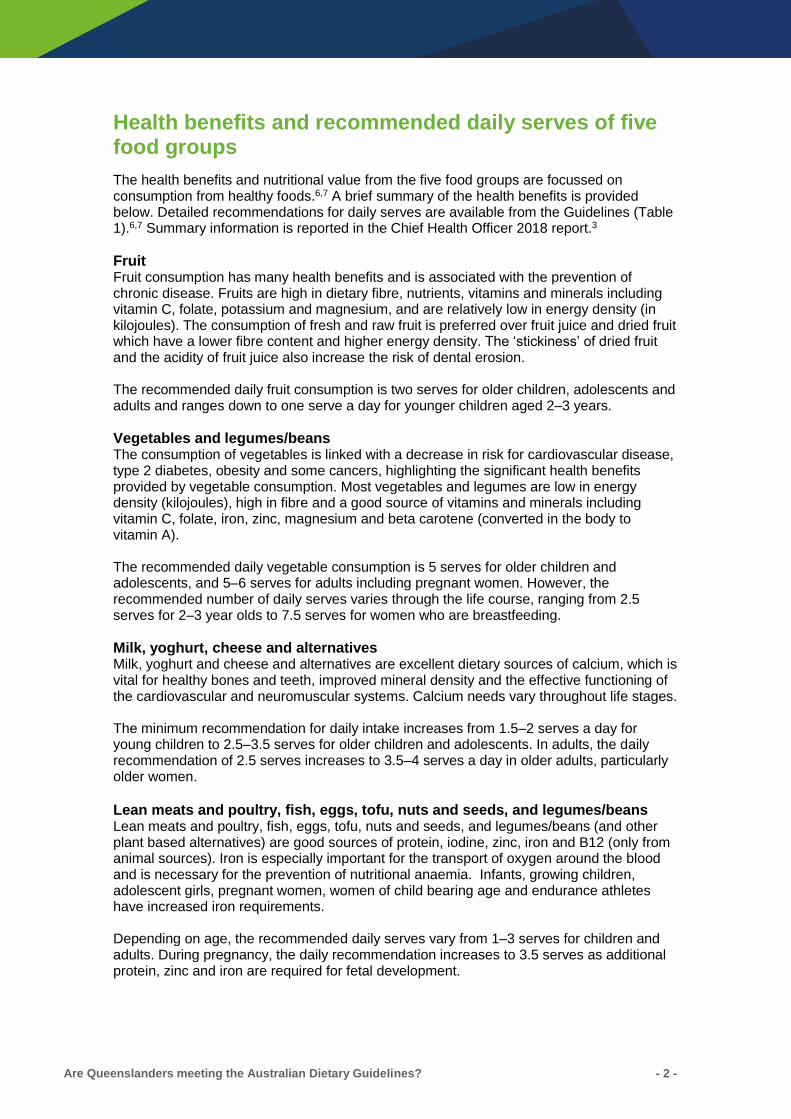
The health benefits and nutritional value from the five food groups are focussed on consumption from healthy foods.6,7 A brief summary of the health benefits is provided below. Detailed recommendations for daily serves are available from the Guidelines (Table 1).6,7 Summary information is reported in the Chief Health Officer 2018 report.3
Fruit Fruit consumption has many health benefits and is associated with the prevention of chronic disease. Fruits are high in dietary fibre, nutrients, vitamins and minerals including vitamin C, folate, potassium and magnesium, and are relatively low in energy density (in kilojoules). The consumption of fresh and raw fruit is preferred over fruit juice and dried fruit which have a lower fibre content and higher energy density. The ‘stickiness’ of dried fruit and the acidity of fruit juice also increase the risk of dental erosion. The recommended daily fruit consumption is two serves for older children, adolescents and adults and ranges down to one serve a day for younger children aged 2–3 years.
Vegetables and legumes/beans The consumption of vegetables is linked with a decrease in risk for cardiovascular disease, type 2 diabetes, obesity and some cancers, highlighting the significant health benefits provided by vegetable consumption. Most vegetables and legumes are low in energy density (kilojoules), high in fibre and a good source of vitamins and minerals including vitamin C, folate, iron, zinc, magnesium and beta carotene (converted in the body to vitamin A). The recommended daily vegetable consumption is 5 serves for older children and adolescents, and 5–6 serves for adults including pregnant women. However, the recommended number of daily serves varies through the life course, ranging from 2.5 serves for 2–3 year olds to 7.5 serves for women who are breastfeeding.
Milk, yoghurt, cheese and alternatives Milk, yoghurt and cheese and alternatives are excellent dietary sources of calcium, which is vital for healthy bones and teeth, improved mineral density and the effective functioning of the cardiovascular and neuromuscular systems. Calcium needs vary throughout life stages. The minimum recommendation for daily intake increases from 1.5–2 serves a day for young children to 2.5–3.5 serves for older children and adolescents. In adults, the daily recommendation of 2.5 serves increases to 3.5–4 serves a day in older adults, particularly older women.
Lean meats and poultry, fish, eggs, tofu, nuts and seeds, and legumes/beans Lean meats and poultry, fish, eggs, tofu, nuts and seeds, and legumes/beans (and other plant based alternatives) are good sources of protein, iodine, zinc, iron and B12 (only from animal sources). Iron is especially important for the transport of oxygen around the blood and is necessary for the prevention of nutritional anaemia. Infants, growing children, adolescent girls, pregnant women, women of child bearing age and endurance athletes have increased iron requirements. Depending on age, the recommended daily serves vary from 1–3 serves for children and adults. During pregnancy, the daily recommendation increases to 3.5 serves as additional protein, zinc and iron are required for fetal development.
Are Queenslanders meeting the Australian Dietary Guidelines? - 3 -
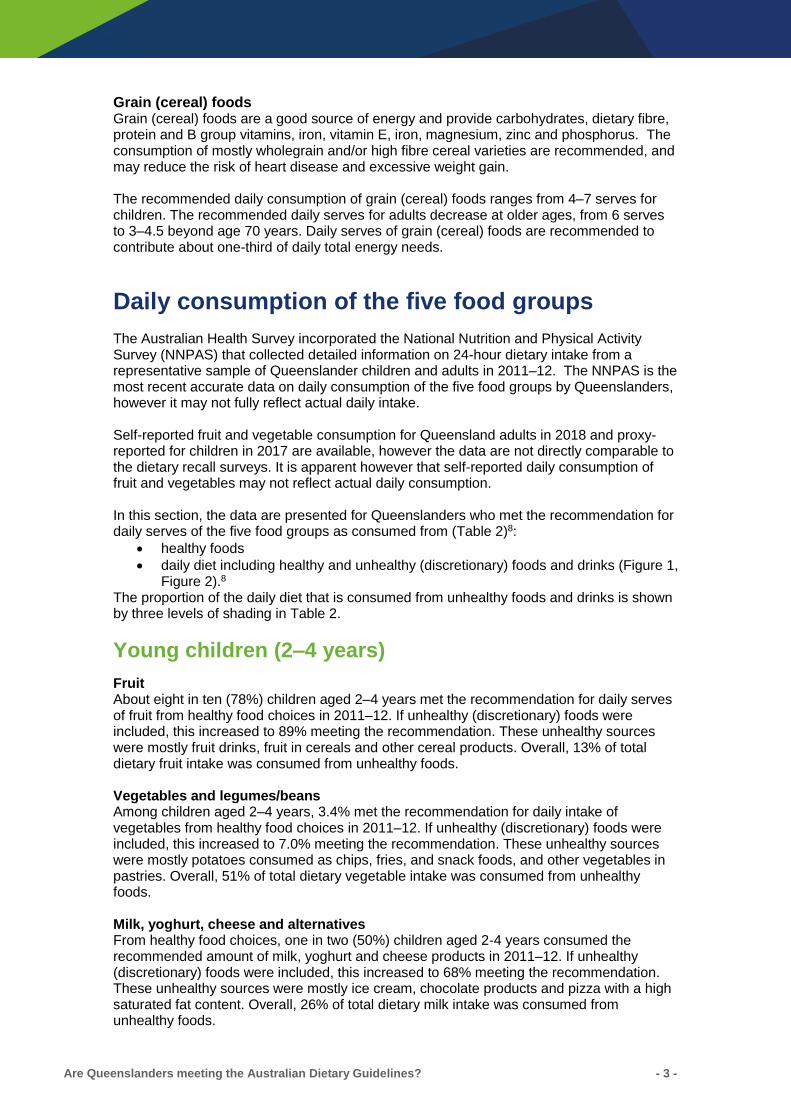
Grain (cereal) foods Grain (cereal) foods are a good source of energy and provide carbohydrates, dietary fibre, protein and B group vitamins, iron, vitamin E, iron, magnesium, zinc and phosphorus. The consumption of mostly wholegrain and/or high fibre cereal varieties are recommended, and may reduce the risk of heart disease and excessive weight gain. The recommended daily consumption of grain (cereal) foods ranges from 4–7 serves for children. The recommended daily serves for adults decrease at older ages, from 6 serves to 3–4.5 beyond age 70 years. Daily serves of grain (cereal) foods are recommended to contribute about one-third of daily total energy needs.
Daily consumption of the five food groups
The Australian Health Survey incorporated the National Nutrition and Physical Activity Survey (NNPAS) that collected detailed information on 24-hour dietary intake from a representative sample of Queenslander children and adults in 2011–12. The NNPAS is the most recent accurate data on daily consumption of the five food groups by Queenslanders, however it may not fully reflect actual daily intake. Self-reported fruit and vegetable consumption for Queensland adults in 2018 and proxy-reported for children in 2017 are available, however the data are not directly comparable to the dietary recall surveys. It is apparent however that self-reported daily consumption of fruit and vegetables may not reflect actual daily consumption. In this section, the data are presented for Queenslanders who met the recommendation for daily serves of the five food groups as consumed from (Table 2)8:
• healthy foods
• daily diet including healthy and unhealthy (discretionary) foods and drinks (Figure 1, Figure 2).8
The proportion of the daily diet that is consumed from unhealthy foods and drinks is shown by three levels of shading in Table 2.
Young children (2–4 years)
Fruit About eight in ten (78%) children aged 2–4 years met the recommendation for daily serves of fruit from healthy food choices in 2011–12. If unhealthy (discretionary) foods were included, this increased to 89% meeting the recommendation. These unhealthy sources were mostly fruit drinks, fruit in cereals and other cereal products. Overall, 13% of total dietary fruit intake was consumed from unhealthy foods. Vegetables and legumes/beans Among children aged 2–4 years, 3.4% met the recommendation for daily intake of vegetables from healthy food choices in 2011–12. If unhealthy (discretionary) foods were included, this increased to 7.0% meeting the recommendation. These unhealthy sources were mostly potatoes consumed as chips, fries, and snack foods, and other vegetables in pastries. Overall, 51% of total dietary vegetable intake was consumed from unhealthy foods. Milk, yoghurt, cheese and alternatives From healthy food choices, one in two (50%) children aged 2-4 years consumed the recommended amount of milk, yoghurt and cheese products in 2011–12. If unhealthy (discretionary) foods were included, this increased to 68% meeting the recommendation. These unhealthy sources were mostly ice cream, chocolate products and pizza with a high saturated fat content. Overall, 26% of total dietary milk intake was consumed from unhealthy foods.
Are Queenslanders meeting the Australian Dietary Guidelines? - 4 -
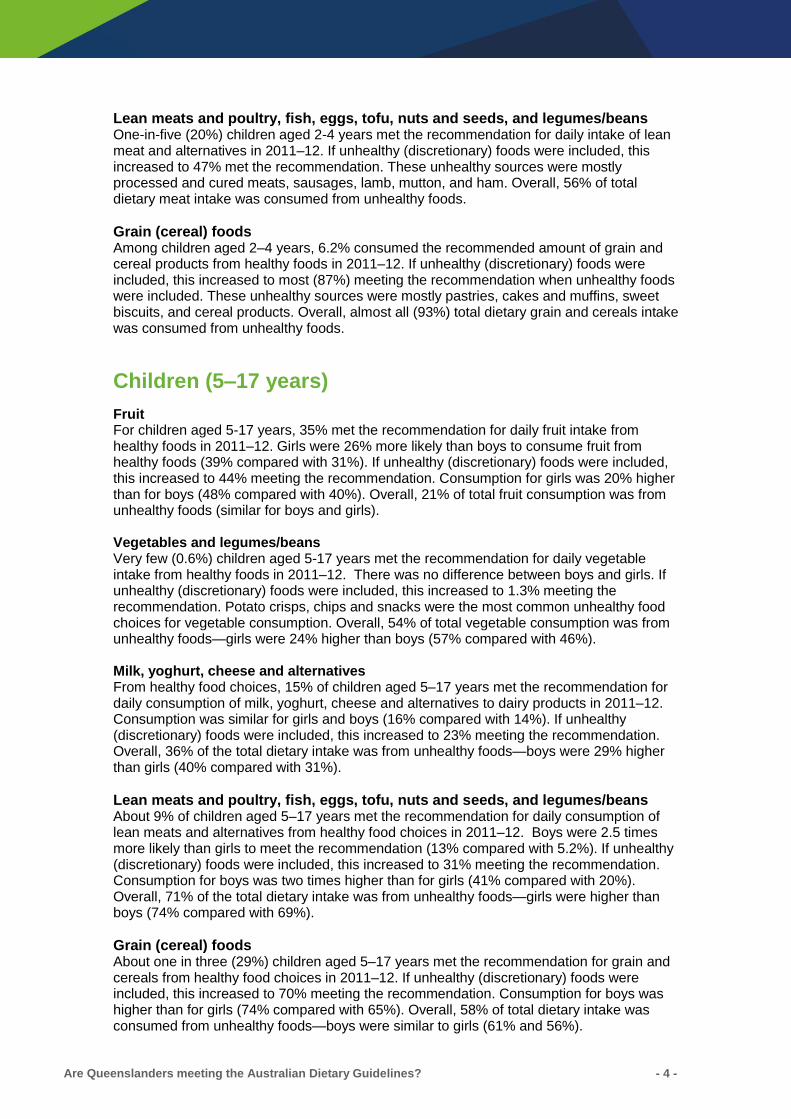
Lean meats and poultry, fish, eggs, tofu, nuts and seeds, and legumes/beans One-in-five (20%) children aged 2-4 years met the recommendation for daily intake of lean meat and alternatives in 2011–12. If unhealthy (discretionary) foods were included, this increased to 47% met the recommendation. These unhealthy sources were mostly processed and cured meats, sausages, lamb, mutton, and ham. Overall, 56% of total dietary meat intake was consumed from unhealthy foods.
Grain (cereal) foods Among children aged 2–4 years, 6.2% consumed the recommended amount of grain and cereal products from healthy foods in 2011–12. If unhealthy (discretionary) foods were included, this increased to most (87%) meeting the recommendation when unhealthy foods were included. These unhealthy sources were mostly pastries, cakes and muffins, sweet biscuits, and cereal products. Overall, almost all (93%) total dietary grain and cereals intake was consumed from unhealthy foods.
Children (5–17 years)
Fruit For children aged 5-17 years, 35% met the recommendation for daily fruit intake from healthy foods in 2011–12. Girls were 26% more likely than boys to consume fruit from healthy foods (39% compared with 31%). If unhealthy (discretionary) foods were included, this increased to 44% meeting the recommendation. Consumption for girls was 20% higher than for boys (48% compared with 40%). Overall, 21% of total fruit consumption was from unhealthy foods (similar for boys and girls). Vegetables and legumes/beans Very few (0.6%) children aged 5-17 years met the recommendation for daily vegetable intake from healthy foods in 2011–12. There was no difference between boys and girls. If unhealthy (discretionary) foods were included, this increased to 1.3% meeting the recommendation. Potato crisps, chips and snacks were the most common unhealthy food choices for vegetable consumption. Overall, 54% of total vegetable consumption was from unhealthy foods—girls were 24% higher than boys (57% compared with 46%). Milk, yoghurt, cheese and alternatives From healthy food choices, 15% of children aged 5–17 years met the recommendation for daily consumption of milk, yoghurt, cheese and alternatives to dairy products in 2011–12. Consumption was similar for girls and boys (16% compared with 14%). If unhealthy (discretionary) foods were included, this increased to 23% meeting the recommendation. Overall, 36% of the total dietary intake was from unhealthy foods—boys were 29% higher than girls (40% compared with 31%).
Lean meats and poultry, fish, eggs, tofu, nuts and seeds, and legumes/beans About 9% of children aged 5–17 years met the recommendation for daily consumption of lean meats and alternatives from healthy food choices in 2011–12. Boys were 2.5 times more likely than girls to meet the recommendation (13% compared with 5.2%). If unhealthy (discretionary) foods were included, this increased to 31% meeting the recommendation. Consumption for boys was two times higher than for girls (41% compared with 20%). Overall, 71% of the total dietary intake was from unhealthy foods—girls were higher than boys (74% compared with 69%).
Grain (cereal) foods About one in three (29%) children aged 5–17 years met the recommendation for grain and cereals from healthy food choices in 2011–12. If unhealthy (discretionary) foods were included, this increased to 70% meeting the recommendation. Consumption for boys was higher than for girls (74% compared with 65%). Overall, 58% of total dietary intake was consumed from unhealthy foods—boys were similar to girls (61% and 56%).

Are Queenslanders meeting the Australian Dietary Guidelines? - 5 -
Adults (18–64 years)
Fruit One in four (25%) adults aged 18–64 years met the recommendation for daily fruit intake from healthy foods in 2011–12. If unhealthy (discretionary) foods were included, this increased to 29% meeting the recommendation. Consumption for men was 48% higher than for women (34% compared with 23%). Overall, 12% of total fruit intake was consumed from unhealthy foods. Vegetables and legumes/beans Few (3.8%) adults aged 18–64 years met the recommendation for daily vegetable consumption from healthy foods in 2011–12. Although consumption remained low, women were higher than men (4.6% compared with 2.9%). If unhealthy (discretionary) foods were included, this increased to 6% meeting the recommendation. Overall, 38% of total vegetable intake was consumed from unhealthy foods—men were 51% higher than women (47% compared with 31%). Milk, yoghurt, cheese and alternatives From the consumption of healthy foods, 7.4% of adults aged 18-64 years met the recommendation for milk, yoghurt, cheese and/or alternatives in 2011–12. Men were 4.4 times more likely than women to meet the recommendation (12% compared with 2.7%). If unhealthy (discretionary) foods were included, this increased to 13% meeting the recommendation. Consumption for men was 2.9 times more likely than for females (20% compared with 6.9%). Overall, 44% of total dietary intake was consumed from unhealthy foods—women were higher than males (61% compared with 38%).
Lean meats and poultry, fish, eggs, tofu, nuts and seeds, and legumes/beans One-third (32%) of adults aged 18–64 years met the recommendation for lean meats and alternatives as consumed from healthy foods —men were more likely than women (38% compared with 26% in 2011–12). If unhealthy (discretionary) foods were included, this increased to 56% meeting the recommendation—consumption was higher for men than women (66% compared with 47%). Overall, 43% of total dietary intake was consumed from unhealthy foods—there was no difference between males and females.
Grain (cereal) foods From the consumption of healthy grains and cereals, 15% of adults aged 18–64 years met the recommendation for daily consumption—men were twice as likely as women (21% compared with 10% in 2011–12). If unhealthy (discretionary) foods were included, this increased to 34% meeting the recommendation. Consumption for men was almost two times higher than women (45% compared with 24%). Overall, 54% of total dietary intake was consumed from unhealthy foods.
Older adults (65 years and older)
Fruit One-third (35%) of adults aged 65 years and older met the recommendation for daily fruit consumption from healthy food choices in 2011–12. More men than women met the recommendation (38% compared with 33%). If unhealthy (discretionary) foods were included, this increased to 41% meeting the recommendation. Consumption for men was higher than women (45% compared with 37%). Overall, 14% of total dietary intake was consumed from unhealthy foods—17% for men and 11% for women.

Are Queenslanders meeting the Australian Dietary Guidelines? - 6 -
Vegetables and legumes/beans Few (6.2%) adults aged 65 years and older met the recommendation for daily vegetables consumed from healthy foods in 2011–12. Men were twice as likely as women (8.6% compared with 4.0%). If unhealthy (discretionary) foods were included, this increased to 6.6% meeting the recommendation. Consumption for men was twice that for women (9.2% compared with 4.3%). Overall, 6.1% of total dietary intake was consumed from unhealthy foods—men and women were similar (6.5% and 7.0% respectively). Milk, yoghurt, cheese and alternatives Very few (1.0%) adults aged 65 years and older met the recommendation for daily consumption of milk, yoghurt, cheese and/or alternatives from healthy foods in 2011–12. The vast majority of those who met the recommendation were males (2.0% compared with 0.1% of women). If unhealthy (discretionary) foods were included, this increased to 2.2% meeting the recommendation (4.3% of males compared with 0.2% of females). Overall, more than half (55%) of total dietary intake was from unhealthy foods—similar for men and women (54% compared with 50%).
Lean meats and poultry, fish, eggs, tofu, nuts and seeds, and legumes/beans One-third (31%) of adults aged 65 years and older met the recommendation for lean meats and poultry, fish, eggs and alternatives from healthy foods in 2011–12. If unhealthy (discretionary) foods were included, this increased to 53% meeting the recommendation. Consumption for men was higher than women (57% compared with 48%). Overall, 41% of total dietary intake was consumed from unhealthy foods—women were higher than men (45% compared with 37%).
Grain (cereal) foods Almost half (47%) of adults aged 65 years and older met the recommendation for the daily consumption of grain and cereal products from healthy foods in 2011–12. Women were more likely than men (55% compared with 39%). If unhealthy (discretionary) foods were included, this increased to two-thirds (65%) of adults meeting the recommendation (69% of women and 60% of men). Overall, 27% of total dietary intake was consumed from unhealthy foods—men were higher than women (36% compared with 20%).
Additional daily consumption of unhealthy foods
The Guidelines highlight the need to limit the intake of unhealthy (discretionary) foods and drinks that are energy–dense and nutrient–poor, and are often high in saturated fat, added sugar and salt, or alcohol. These unhealthy foods and drinks provide little or no nutritional benefit and are recommended to either be consumed in small amounts or not at all (also referred to as 100% discretionary).6 Although unhealthy foods may provide added variety to a diet, especially for social, cultural and family celebrations, the limited nutritional value of these foods means they are an unnecessary part of a healthy diet.
From the typical Australian diet, common examples of unhealthy or discretionary foods include9:
• potato chips, crisps and other fatty and/or salty snack foods • sausages and processed meats, savoury pastries and pies, commercial burgers • cream, butter and spreads that are high in saturated fat • most cakes, sweet, pastries and desserts • chocolate, confectionary, ice-cream and other ice confections • sugar sweetened soft drinks and cordials, sports and energy drinks • alcoholic drinks (100% discretionary).
The differences in consumption of the five food groups from healthy and unhealthy foods are shown for four age groups across the lifespan (Table 2, Figure 1, Figure 2).

Are Queenslanders meeting the Australian Dietary Guidelines? - 7 -
Table 2 Proportion meeting recommended daily consumption of the five food groups
from healthy and unhealthy foods, children and adults, Queensland, 2011–128
Children
Five food groups Total
foods
Healthy
foods
Unhealthy
foods
Total
foods
Healthy
foods
Unhealthy
foods
Fruit Persons 89 78 12 44 35 9.1
Males n.a. n.a. n.a. 40 31 8.8
Females n.a. n.a. n.a. 48 39 9.5
Vegetables and Persons 7.0 3.4 3.6 1.3 0.6 0.7
legumes/beans Males n.a. n.a. n.a. 1.1 0.6 0.5
Females n.a. n.a. n.a. 1.4 0.6 0.8
Milk, yoghurt, cheese Persons 68 50 17 23 15 8.3
and/or alternatives Males n.a. n.a. n.a. 23 14 9.2
Females n.a. n.a. n.a. 23 16 7.3
Lean meats and poultry, Persons 47 20 26 31 9.0 22
fish, eggs, tofu, nuts, Males n.a. n.a. n.a. 41 13 28
seeds, and legumes/beans Females n.a. n.a. n.a. 20 5.2 15
Grain (cereal) products Persons 87 6.2 81 70 29 41
Males n.a. n.a. n.a. 74 29 45
Females n.a. n.a. n.a. 65 29 36
Adults
Five food groups Total
foods
Healthy
foods
Unhealthy
foods
Total
foods
Healthy
foods
Unhealthy
foods
Fruit Persons 29 25 3.4 41 35 5.7
Males 34 30 4.1 45 38 7.6
Females 23 21 2.6 37 33 4.0
Vegetables and Persons 6.1 3.8 2.3 6.6 6.2 0.4
legumes/beans Males 5.5 2.9 2.6 9.2 8.6 0.6
Females 6.7 4.6 2.1 4.3 4.0 0.3
Milk, yoghurt, cheese Persons 13 7.4 5.8 2.2 1.0 1.2
and/or alternatives Males 20 12 7.4 4.3 2.0 2.3
Females 6.9 2.7 4.2 0.2 0.1 0.1
Lean meats and poultry, Persons 56 32 24 53 31 22
fish, eggs, tofu, nuts, Males 66 38 28 57 36 21
seeds, and legumes/beans Females 47 26 20 48 27 22
Grain (cereal) products Persons 34 15 19 65 47 18
Males 45 21 24 60 39 21
Females 24 10 14 69 55 14
Up to one third (0-33%) of the total food group consumed from unhealthy foods
Between one third and up to two thirds (34-65%) of the total food group consumed from unhealthy foods
Two thirds or more (66-100%) of the total food group consumed from unhealthy foods
n.a. not available Percentages may not add due to rounding.
% meeting recommendation % meeting recommendation
2-4 years 5-17 years
% meeting recommendation % meeting recommendation
18-64 years 65+ years

Are Queenslanders meeting the Australian Dietary Guidelines? - 8 -
Figure 1 Proportion meeting the recommended daily consumption of the five food groups
from healthy and unhealthy foods, by age groups, Queensland, 2011–128
a) Fruit
78
35
25
35
12
9.1
3.4
5.7
2-4
5-17
18-64
65+
Healthy
Unhealthy
b) Vegetables and legumes/beans
3.4
0.6
3.8
6.2
3.6
0.7
2.3
0.4
2-4
5-17
18-64
65+
Healthy
Unhealthy
c) Milk, yoghurt, cheese and alternatives
50
15
7.4
1.0
17
8.3
5.8
1.2
2-4
5-17
18-64
65+
Healthy
Unhealthy
d) Lean meats and alternatives
20
9.0
32
31
26
22
24
22
2-4
5-17
18-64
65+
Healthy
Unhealthy
e) Grain (cereal) foods
6.2
29
15
47
81
41
19
18
2-4
5-17
18-64
65+
Healthy
Unhealthy
Are Queenslanders meeting the Australian Dietary Guidelines? - 9 -
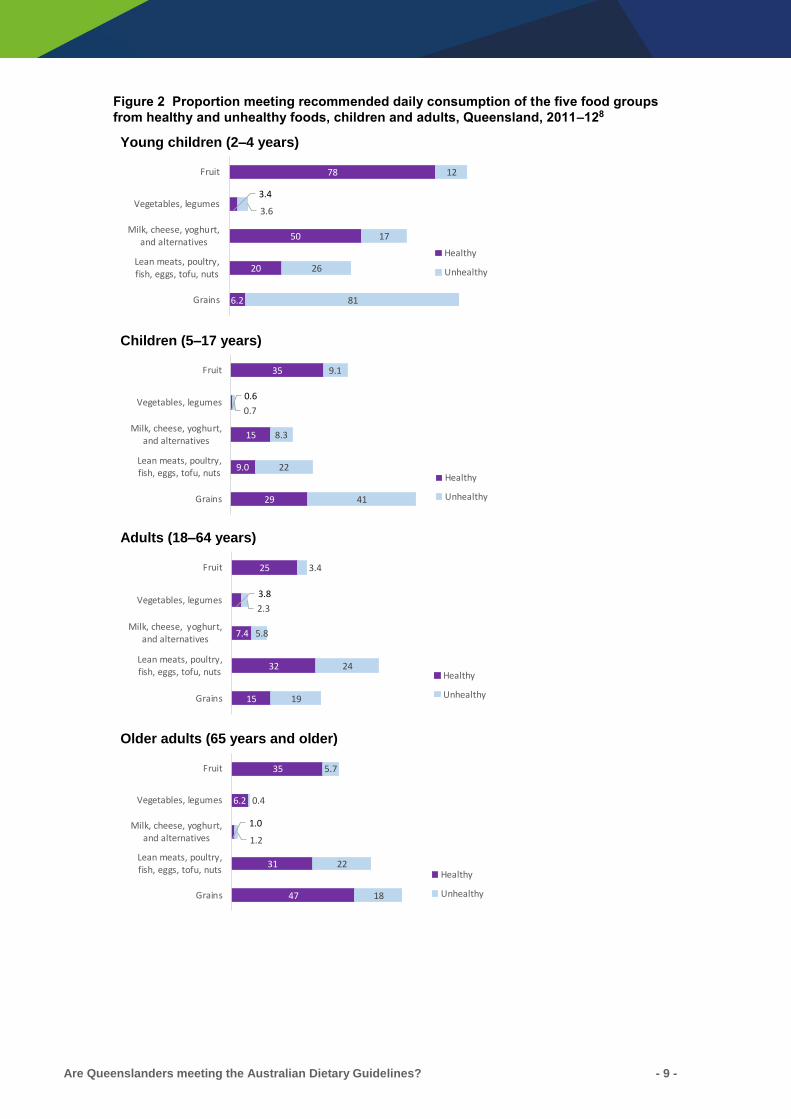
Figure 2 Proportion meeting recommended daily consumption of the five food groups
from healthy and unhealthy foods, children and adults, Queensland, 2011–128
Young children (2–4 years)
78
3.4
50
20
6.2
12
3.6
17
26
81
Fruit
Vegetables, legumes
Milk, cheese, yoghurt,and alternatives
Lean meats, poultry,fish, eggs, tofu, nuts
Grains
Healthy
Unhealthy
Children (5–17 years)
35
0.6
15
9.0
29
9.1
0.7
8.3
22
41
Fruit
Vegetables, legumes
Milk, cheese, yoghurt,and alternatives
Lean meats, poultry,fish, eggs, tofu, nuts
Grains
Healthy
Unhealthy
Adults (18–64 years)
25
3.8
7.4
32
15
3.4
2.3
5.8
24
19
Fruit
Vegetables, legumes
Milk, cheese, yoghurt,and alternatives
Lean meats, poultry,fish, eggs, tofu, nuts
Grains
Healthy
Unhealthy
Older adults (65 years and older)
35
6.2
1.0
31
47
5.7
0.4
1.2
22
18
Fruit
Vegetables, legumes
Milk, cheese, yoghurt,and alternatives
Lean meats, poultry,fish, eggs, tofu, nuts
Grains
Healthy
Unhealthy
Are Queenslanders meeting the Australian Dietary Guidelines? - 10 -
Is healthy food consumption the same for everyone?
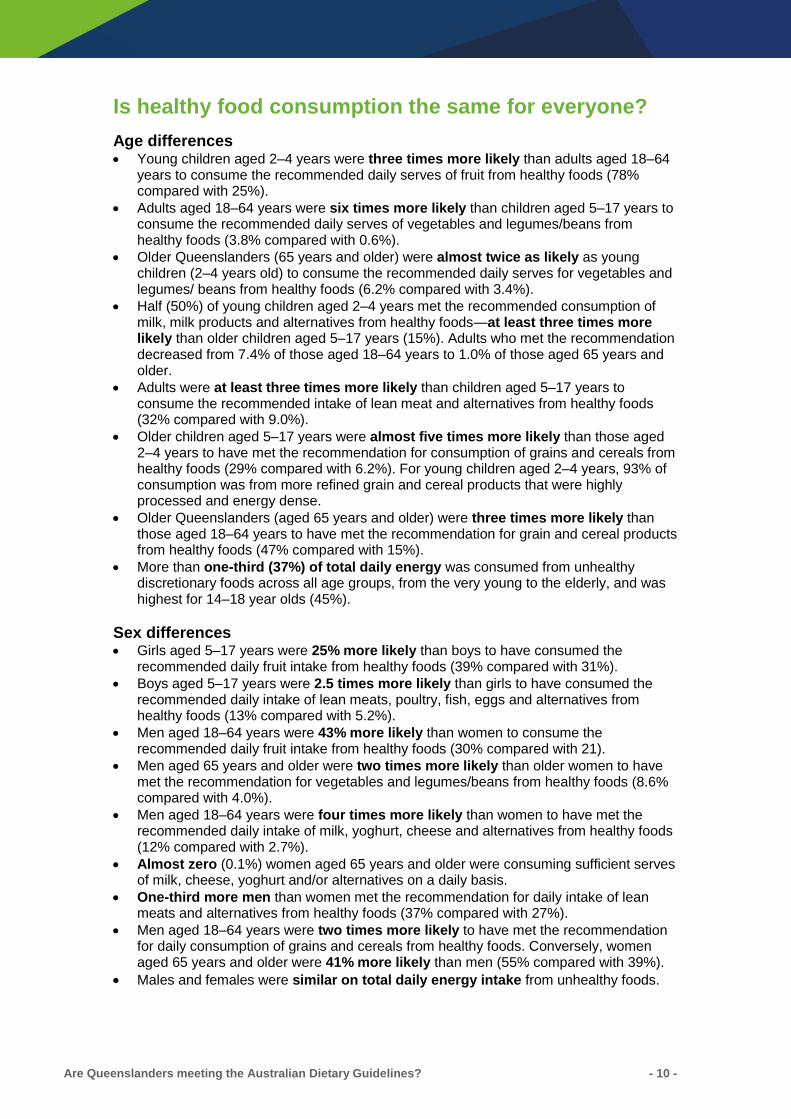
Age differences • Young children aged 2–4 years were three times more likely than adults aged 18–64
years to consume the recommended daily serves of fruit from healthy foods (78% compared with 25%).
• Adults aged 18–64 years were six times more likely than children aged 5–17 years to consume the recommended daily serves of vegetables and legumes/beans from healthy foods (3.8% compared with 0.6%).
• Older Queenslanders (65 years and older) were almost twice as likely as young children (2–4 years old) to consume the recommended daily serves for vegetables and legumes/ beans from healthy foods (6.2% compared with 3.4%).
• Half (50%) of young children aged 2–4 years met the recommended consumption of milk, milk products and alternatives from healthy foods—at least three times more likely than older children aged 5–17 years (15%). Adults who met the recommendation decreased from 7.4% of those aged 18–64 years to 1.0% of those aged 65 years and older.
• Adults were at least three times more likely than children aged 5–17 years to consume the recommended intake of lean meat and alternatives from healthy foods (32% compared with 9.0%).
• Older children aged 5–17 years were almost five times more likely than those aged 2–4 years to have met the recommendation for consumption of grains and cereals from healthy foods (29% compared with 6.2%). For young children aged 2–4 years, 93% of consumption was from more refined grain and cereal products that were highly processed and energy dense.
• Older Queenslanders (aged 65 years and older) were three times more likely than those aged 18–64 years to have met the recommendation for grain and cereal products from healthy foods (47% compared with 15%).
• More than one-third (37%) of total daily energy was consumed from unhealthy discretionary foods across all age groups, from the very young to the elderly, and was highest for 14–18 year olds (45%).
Sex differences • Girls aged 5–17 years were 25% more likely than boys to have consumed the
recommended daily fruit intake from healthy foods (39% compared with 31%).
• Boys aged 5–17 years were 2.5 times more likely than girls to have consumed the recommended daily intake of lean meats, poultry, fish, eggs and alternatives from healthy foods (13% compared with 5.2%).
• Men aged 18–64 years were 43% more likely than women to consume the recommended daily fruit intake from healthy foods (30% compared with 21).
• Men aged 65 years and older were two times more likely than older women to have met the recommendation for vegetables and legumes/beans from healthy foods (8.6% compared with 4.0%).
• Men aged 18–64 years were four times more likely than women to have met the recommended daily intake of milk, yoghurt, cheese and alternatives from healthy foods (12% compared with 2.7%).
• Almost zero (0.1%) women aged 65 years and older were consuming sufficient serves of milk, cheese, yoghurt and/or alternatives on a daily basis.
• One-third more men than women met the recommendation for daily intake of lean meats and alternatives from healthy foods (37% compared with 27%).
• Men aged 18–64 years were two times more likely to have met the recommendation for daily consumption of grains and cereals from healthy foods. Conversely, women aged 65 years and older were 41% more likely than men (55% compared with 39%).
• Males and females were similar on total daily energy intake from unhealthy foods.

Are Queenslanders meeting the Australian Dietary Guidelines? - 11 -
Daily total energy intake
The recommended dietary patterns using daily serves of the five food groups provide sufficient energy (kilojoules, kJ) for children and adults of average height with sedentary to moderate activity levels (Table 3).7 Additional serves are recommended where the daily energy needs are higher for those who are more active or taller, including older children and adolescents. Table 3 Kilojoules per serve of the five food groups7
Healthy foods: five food groups Kilojoules per serve
Fruit 350 Vegetables 100–250 Legumes/beans 350 Milk, yoghurt, cheese and alternatives 500–600 Lean meat, poultry, fish, eggs, tofu, nuts/seeds, legumes/beans 500–600 Grain (cereal) foods 500
Other foods Unsaturated spreads and oils 250 Discretionary food choices 600
Decreased daily energy intake (1995 to 2011–12)
For Queenslanders aged 2 years and older, the average daily total energy intake decreased from about 9,300 kilojoules (kJ) per day in 1995 to about 8,500 kJ per day (8% decrease) in 2011–12 (Figure 3).8 The decrease was greater for males than females:
• males from about 10,800 kJ to about 9,600 kJ (11% decrease)
• females from about 7,600 kJ to about 7,400 kJ (3% decrease). For children aged 2–18 years, daily total energy intake decreased from about 9,000 kJ per day in 1995 to about 8,000 kJ per day (11% decrease) in 2011–12. The decrease was greater for males than females:
• males: from about 10,200 kJ to about 8,400 kJ (18% decrease)
• females: from about 7,800 kJ to 7,700 kJ (2% decrease). For adults aged 19 years and older, daily total energy intake decreased from about 9,300 kJ in 1995 to about 8,700 kJ (7% decrease) in 2011–12. The decrease was greater for males than females:
• males: from about 11,000 kJ to about 10,000 kJ (9% decrease)
• females: from about 7,600 kJ to 7,400 kJ (3% decrease). Note: Reporting bias and/or under-reporting may exist between 1995 and 2011–12.
Figure 3 Average daily total energy intake, kilojoules, Queensland8
a) 1995 b) 2011–12
0
2,000
4,000
6,000
8,000
10,000
12,000
14,000
2-3 4-8 9-13 14-18 19-30 31-50 51-70 71+
Mea
n d
ail
y en
ergy
in
take
(kJ
)
Males Females Persons
0
2,000
4,000
6,000
8,000
10,000
12,000
14,000
2-3 4-8 9-13 14-18 19-30 31-50 51-70 71+
Mea
n d
ail
y en
ergy
in
take
(kJ
)
Males Females Persons
Are Queenslanders meeting the Australian Dietary Guidelines? - 12 -
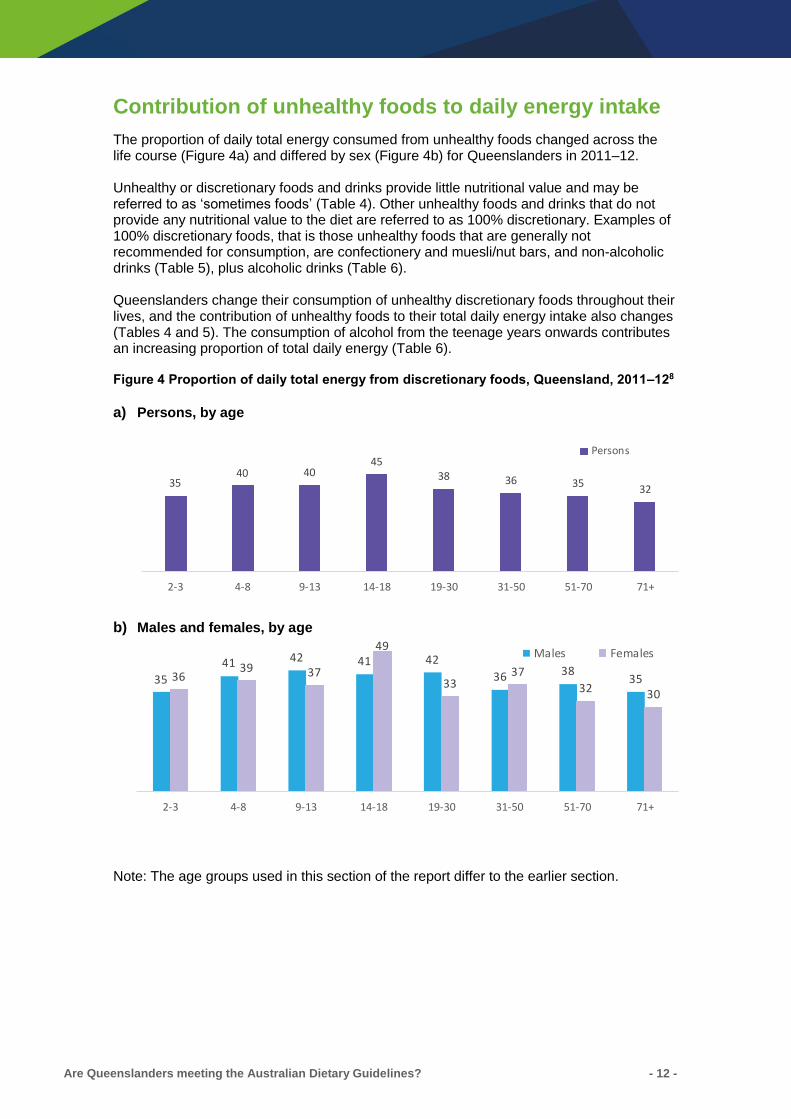
Contribution of unhealthy foods to daily energy intake
The proportion of daily total energy consumed from unhealthy foods changed across the life course (Figure 4a) and differed by sex (Figure 4b) for Queenslanders in 2011–12. Unhealthy or discretionary foods and drinks provide little nutritional value and may be referred to as ‘sometimes foods’ (Table 4). Other unhealthy foods and drinks that do not provide any nutritional value to the diet are referred to as 100% discretionary. Examples of 100% discretionary foods, that is those unhealthy foods that are generally not recommended for consumption, are confectionery and muesli/nut bars, and non-alcoholic drinks (Table 5), plus alcoholic drinks (Table 6). Queenslanders change their consumption of unhealthy discretionary foods throughout their lives, and the contribution of unhealthy foods to their total daily energy intake also changes (Tables 4 and 5). The consumption of alcohol from the teenage years onwards contributes an increasing proportion of total daily energy (Table 6). Figure 4 Proportion of daily total energy from discretionary foods, Queensland, 2011–128
a) Persons, by age
3540 40
4538 36 35
32
2-3 4-8 9-13 14-18 19-30 31-50 51-70 71+
Persons
b) Males and females, by age
35
41 42 41 42
36 383536
39 37
49
3337
32 30
2-3 4-8 9-13 14-18 19-30 31-50 51-70 71+
Males Females
Note: The age groups used in this section of the report differ to the earlier section.

Are Queenslanders meeting the Australian Dietary Guidelines? - 13 -
Children: selected key statistics for unhealthy food consumption
Daily total energy • Children aged 2–3 years derived 35% of daily total energy from unhealthy foods in
2011–12 (Figure 4a).
• The proportion of daily total energy increased to 40% for children aged 4–13 years and peaked at 45% for teenagers aged 14–18 years (teenage girls were higher than boys, 49% compared with 41%) (Figure 4b).
Daily ‘sometimes’ foods • Discretionary cereal-based products and dishes were consumed daily by 3 in 4 young
children (79% of 2–3 year olds and 78% of 4–8 year olds), despite these products being recommended as ‘sometimes’ foods (Table 4a-i). This daily consumption provided 17% of total daily energy for young children aged 2-3 years.
• More girls than boys aged 2–3 years consumed discretionary cereal-based products and dishes daily (85% compared with 73%) (Figure 4b-ii). Girls aged 2–3 years consumed 19% of total daily energy from these foods.
• One-third (32%) of children aged 9–13 years consumed snack foods daily, contributing about 3% of their total daily energy intake (Table 4b-i).
• More boys than girls aged 9–13 years consumed snack foods daily (36% compared with 27%), however, for teenagers, more girls than boys aged 14–18 years consumed snacks daily (28% compared with 20%) (Table 4b-ii). Overall, 3% of total daily energy was consumed from snacks.
Daily confectionery • More than half (55%) of children aged 4–8 years consumed confectionery daily,
including cereal, nut, fruit and seed bars, contributing 4% of total daily energy (Table 5a-i).
• Daily confectionery consumption was highest (56%) for boys aged 4–8 years and contributed 4% of total daily energy intake (Table 5a-ii). For girls aged 14–18 years, 6% of total daily energy was consumed from confectionery.
Sugar-sweetened drinks, sports and energy drinks • Two-thirds (64%) of teenagers aged 14–18 years consumed non-alcoholic drinks daily,
including fruit juice, sugary drinks and sports drinks (Table 5b-i).
• Non-alcoholic drinks including sugar-sweetened drinks, sports and energy drinks make a large contribution of total daily energy intake (8%) in teenage boys aged 14–18 years (Table 5b-ii).
Alcoholic drinks • Among teenage boys aged 14–18 years, 11% had consumed alcoholic drinks in the
previous 24 hours, contributing 2% of total daily energy intake (Table 5c-ii). Data was not publishable for teenage females aged 14–18 years due to small numbers/confidentiality.
Are Queenslanders meeting the Australian Dietary Guidelines? - 14 -
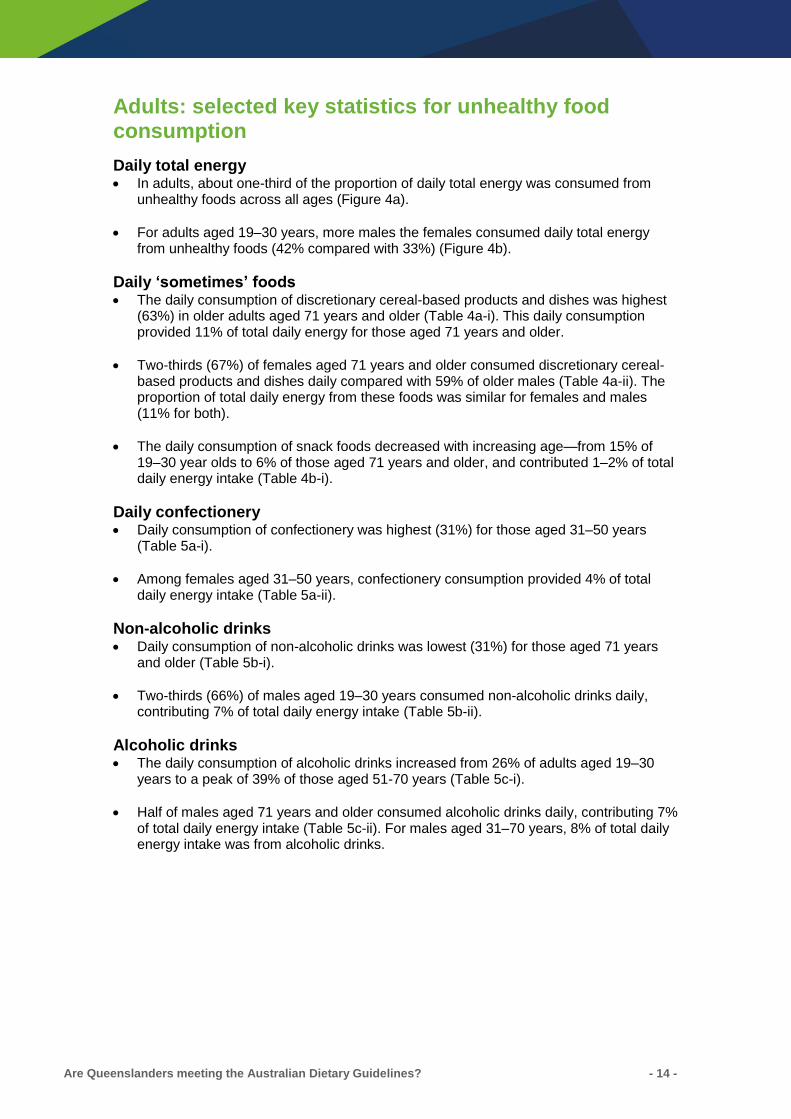
Adults: selected key statistics for unhealthy food consumption
Daily total energy • In adults, about one-third of the proportion of daily total energy was consumed from
unhealthy foods across all ages (Figure 4a).
• For adults aged 19–30 years, more males the females consumed daily total energy from unhealthy foods (42% compared with 33%) (Figure 4b).
Daily ‘sometimes’ foods • The daily consumption of discretionary cereal-based products and dishes was highest
(63%) in older adults aged 71 years and older (Table 4a-i). This daily consumption provided 11% of total daily energy for those aged 71 years and older.
• Two-thirds (67%) of females aged 71 years and older consumed discretionary cereal-based products and dishes daily compared with 59% of older males (Table 4a-ii). The proportion of total daily energy from these foods was similar for females and males (11% for both).
• The daily consumption of snack foods decreased with increasing age—from 15% of 19–30 year olds to 6% of those aged 71 years and older, and contributed 1–2% of total daily energy intake (Table 4b-i).
Daily confectionery • Daily consumption of confectionery was highest (31%) for those aged 31–50 years
(Table 5a-i).
• Among females aged 31–50 years, confectionery consumption provided 4% of total daily energy intake (Table 5a-ii).
Non-alcoholic drinks • Daily consumption of non-alcoholic drinks was lowest (31%) for those aged 71 years
and older (Table 5b-i).
• Two-thirds (66%) of males aged 19–30 years consumed non-alcoholic drinks daily, contributing 7% of total daily energy intake (Table 5b-ii).
Alcoholic drinks • The daily consumption of alcoholic drinks increased from 26% of adults aged 19–30
years to a peak of 39% of those aged 51-70 years (Table 5c-i).
• Half of males aged 71 years and older consumed alcoholic drinks daily, contributing 7% of total daily energy intake (Table 5c-ii). For males aged 31–70 years, 8% of total daily energy intake was from alcoholic drinks.

Are Queenslanders meeting the Australian Dietary Guidelines? - 15 -
Table 4 Proportion of Queenslanders consuming selected discretionary ‘sometimes’ foods in the previous 24 hours, 2011–128
a) Cereal-based products and dishes i. Persons, by age Proportion of daily total energy
from selected discretionary foods
79 78
6257
46 4550
63
2-3 4-8 9-13 14-18 19-30 31-50 51-70 71+
Age, years
%
2–3 17
4–18 13
19–50 9
51–70 10
71+ 11
ii. Males and females, by age
73 7567
53 5045
5159
8580
57 60
42 45 49
67
2-3 4-8 9-13 14-18 19-30 31-50 51-70 71+
Males Females
Age, Males Females
years % %
2–3 15 19
4–18 14 13
19–50 9 10
51–70 10 9
71+ 11 11
b) Snack foods i. Persons, by age
16
29 3224
15 12 8 6
2-3 4-8 9-13 14-18 19-30 31-50 51-70 71+
Age, years
%
2–3 1
4–18 3
19–50 2
51–70 1
71+ 1
ii. Males and females, by age
15
2836
20 1712 8 7
18
30 27 28
12 12 8 5
2-3 4-8 9-13 14-18 19-30 31-50 51-70 71+
Males Females
Age, Males Females
years % %
2–3 2 1
4–18 3 3
19–50 2 2
51–70 1 1
71+ 1 1
Note: Discretionary foods that provide little nutritional value to the daily diet are referred to as ‘sometimes’ foods.
Are Queenslanders meeting the Australian Dietary Guidelines? - 16 -
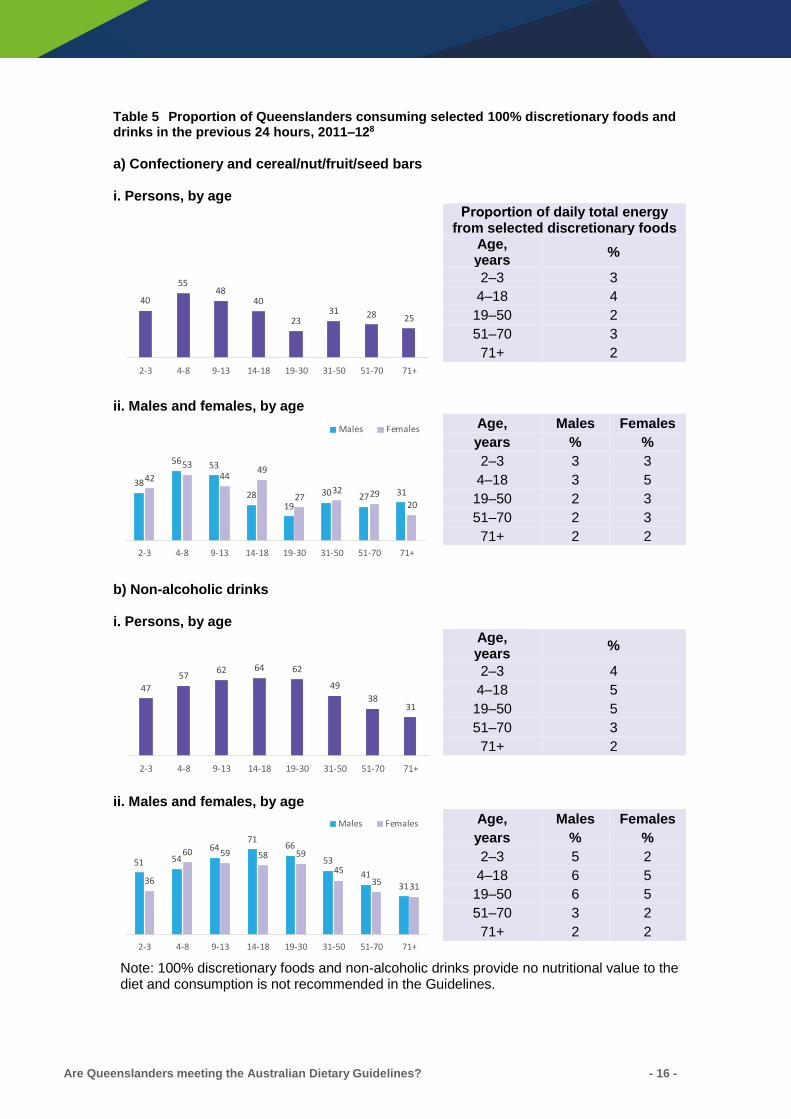
Table 5 Proportion of Queenslanders consuming selected 100% discretionary foods and drinks in the previous 24 hours, 2011–128
a) Confectionery and cereal/nut/fruit/seed bars i. Persons, by age Proportion of daily total energy
from selected discretionary foods
40
5548
40
2331 28 25
2-3 4-8 9-13 14-18 19-30 31-50 51-70 71+
Age, years
%
2–3 3
4–18 4
19–50 2
51–70 3
71+ 2
ii. Males and females, by age
38
56 53
2819
30 27 31
42
5344
49
2732 29
20
2-3 4-8 9-13 14-18 19-30 31-50 51-70 71+
Males Females
Age, Males Females
years % %
2–3 3 3
4–18 3 5
19–50 2 3
51–70 2 3
71+ 2 2
b) Non-alcoholic drinks i. Persons, by age
47
5762 64 62
49
3831
2-3 4-8 9-13 14-18 19-30 31-50 51-70 71+
Age, years
%
2–3 4
4–18 5
19–50 5
51–70 3
71+ 2
ii. Males and females, by age
51 5464
7166
53
4131
36
60 59 58 59
4535 31
2-3 4-8 9-13 14-18 19-30 31-50 51-70 71+
Males Females
Age, Males Females
years % %
2–3 5 2
4–18 6 5
19–50 6 5
51–70 3 2
71+ 2 2
Note: 100% discretionary foods and non-alcoholic drinks provide no nutritional value to the diet and consumption is not recommended in the Guidelines.
Are Queenslanders meeting the Australian Dietary Guidelines? - 17 -
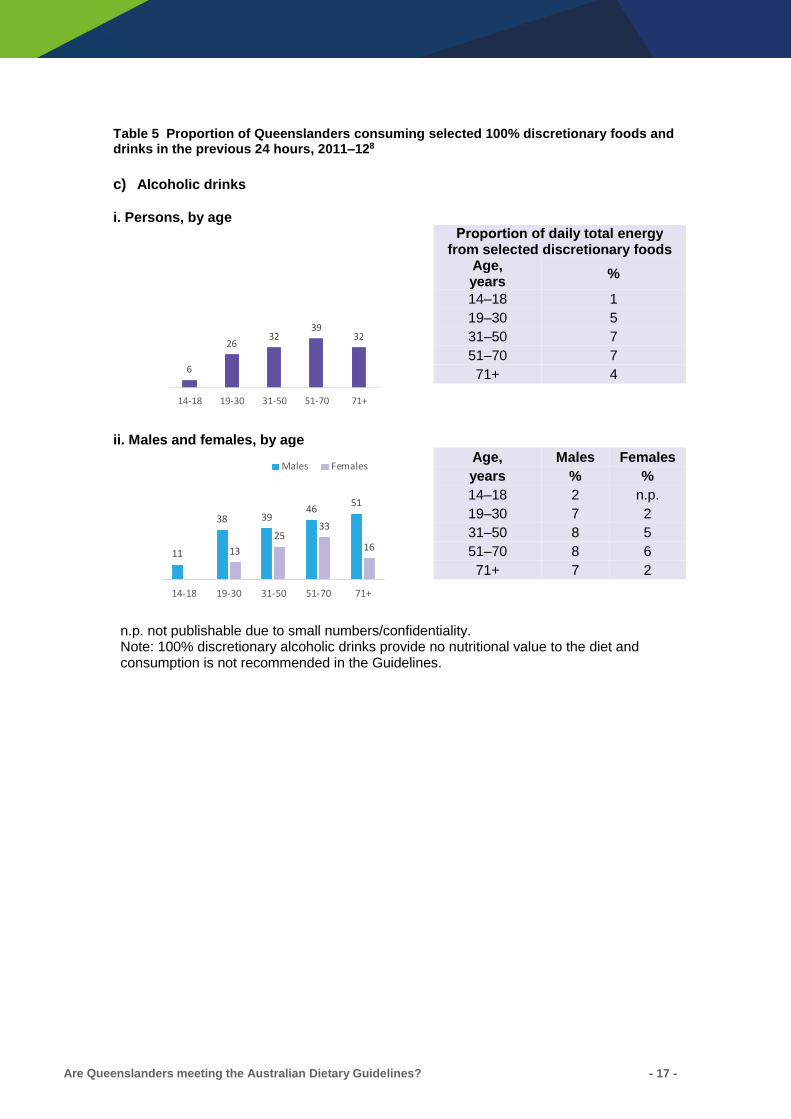
Table 5 Proportion of Queenslanders consuming selected 100% discretionary foods and drinks in the previous 24 hours, 2011–128
c) Alcoholic drinks i. Persons, by age Proportion of daily total energy
from selected discretionary foods
6
2632
3932
14-18 19-30 31-50 51-70 71+
Age, years
%
14–18 1
19–30 5
31–50 7
51–70 7
71+ 4
ii. Males and females, by age
11
38 3946
51
13
2533
16
14-18 19-30 31-50 51-70 71+
Males Females
Age, Males Females
years % %
14–18 2 n.p.
19–30 7 2
31–50 8 5
51–70 8 6
71+ 7 2
n.p. not publishable due to small numbers/confidentiality. Note: 100% discretionary alcoholic drinks provide no nutritional value to the diet and consumption is not recommended in the Guidelines.
Are Queenslanders meeting the Australian Dietary Guidelines? - 18 -
References
1. Department of Health. Burden of disease and injury: summary results for Queensland. Queensland Government: Brisbane; 2017.
2. Australian Institute of Health and Welfare. Australian burden of disease study: impact and causes of illness and death in Australia 2011. Published and unpublished data. Cat. no. BOD 4. AIHW: Canberra; 2016.
3. Queensland Health. The health of Queenslanders 2018. Report of the Chief Health Officer Queensland. Queensland Government: Brisbane; 2018.
4. World Health Organization. Diet, nutrition and the prevention of chronic diseases. Report of the joint WHO/FAO expert consultation. No. 916 (TRS 916). WHO: Geneva; 2003. Available: http://www.who.int/dietphysicalactivity/publications/trs916/en/.
5. Queensland Health. The health of Queenslanders 2014: fifth report of the Chief Health Officer Queensland. Queensland Government: Brisbane; 2014.
6. National Health and Medical Research Council. Australian Dietary Guidelines. Commonwealth of Australia: Canberra; 2013.
7. National Health and Medical Research Council, Department of Health and Ageing. Eat for health. Educator guide. Information for nutrition educators. Australian Government: Canberra; 2013. Available: https://www.eatforhealth.gov.au/sites/default/files/files/the_guidelines/n55b_eat_for_health_educators_guide.pdf.
8. Australian Bureau of Statistics. Australian health survey 2011-12: customised report. ABS: Canberra; 2018.
9. Australian Bureau of Statistics. Australian health survey: consumption of food groups from the Australian Dietary Guidelines, 2011-12. Cat. no. 4364.0.55.012. ABS: Canberra; 2016.