The Health of Queenslanders 2008 · The Health of Queenslanders 2008 Second Report of the Chief...
158
The Health of Queenslanders Prevention of Chronic Disease 2008 Second Report of the Chief Health Officer Queensland
-
Upload
truongcong -
Category
Documents
-
view
217 -
download
0
Transcript of The Health of Queenslanders 2008 · The Health of Queenslanders 2008 Second Report of the Chief...
The H
ealth of Q
ueenslanders 20
08
Second Report of the Chief H
ealth Officer Q
ueensland
The Health of QueenslandersPrevention of Chronic Disease
2 0 0 8
Second Report of the Chief Health Officer Queenslandwww.health.qld.gov.au/cho_report

©The State of Queensland (Queensland Health) 2008The Queensland Government supports and encourages the dissemination and exchange of information. However, copyright protects this material. The State of Queensland has no objection to this material or any part of this material being reproduced, made available online or electronically, but only if it is recognised as the owner and this material remains unaltered. Inquiries to adapt this material should be addressed by email to: [email protected] or by mail to: The IP Officer, Purchasing and Logistics Unit, Queensland Health, GPO Box 48, BRISBANE 4001.
ISBN: 978-1-921477-21-1
Suggested citation:Queensland Health. The Health of Queenslanders 2008: Prevention of Chronic Disease. Second Report of the Chief Health Officer Queensland, Queensland Health. Brisbane; 2008.
Contributors: The Health of Queenslanders 2008: Prevention of Chronic Disease was prepared by the Population Epidemiology Section, Population Health Queensland, Division of the Chief Health Officer. The following list indicates the key roles played by many in the production of this report.
Project manager and editor:Catherine Harper
Epidemiology team: Publication:Margaret Bright (Manager) Beata ZimkowskaHai PhungAnnette Neill
Steering Committee:Jeannette Young (chair), Andrew Wilson, Stephen Duckett, Rachelle Foreman, Brad McCulloch, Keith McNeil, Michael Skinner, Linda Selvey, Jackie Steele
Advice and assistance: Alcohol, Tobacco and Other Drugs Branch (Katrin Hausdorf, Kassandra McCullough, Kirsty Pickering, Helen Taylor, •Mark West)Cancer Screening Services Branch (Leane Christie, Nathan Dunn, Roz Glazebrook, Naomi Main, Jennifer Muller, •Alison Thompson)Central Population Health Services (Brett Eichmann, Penny Love, Paul Vardon)•Clinical Practice Improvement Centre (Maatan Kamp)•Communicable Diseases Branch (Lisa Hall, Karen Peterson, Christine Selvey) •General Practice Queensland (Alicia Reid and colleagues)•Health Promotion Branch (Mathew Dick, Rachael Farquharson, Vicki Gedge, Kate Gellweiller, Michelle Harrison, •Amanda Lee, Damian O’Sullivan, Christina Stubbs) Health Statistics Centre (Clint Breckell, Michelle Dinh, Taku Endo, Haes Houweling, Stuart Howell, Trisha Johnston, •Sarah Muller, John 0’Brien, Christine Smerdon, Nancy Tran, Ronald Webster, Ben Wilkinson, Rachael-Anne Wills) Maternity, Child Health and Safety Branch (Terri Price, Robert Ferguson)•Mental Health Branch (Elizabeth Powell, Janet Martin, Ailie Perich) •Population Health Web Team•Planning and Coordination Branch (Stephen Begg)•Planning and Development Unit (Andrea Casasola, Gayle Pollard, Patricia Rodgers)•Southern Population Health Services (Ian Hunter, Peter McKeown)•Tropical Population Health Services (Kym Blechynden, Jacqui Lloyd)•University of Queensland (Maria Donald, Ieva Ozolins, Robert Ware)•
For further information:Division of Chief Health OfficerQueensland HealthGPO Box 48, Brisbane Queensland 4001Email: [email protected]/cho_report

Report of the Chief Health Officer Queensland
i
Foreword Queenslanders generally have good health compared
to other Australians and to other nations, but there is
certainly room for improvement. Preventing chronic
disease is critical to maintaining and improving the
health of Queenslanders. Monitoring is also essential
so we know that we are making a difference.
food advertising during children’s television viewing time. The Queensland government is seeking such information from Queenslanders and is determined to address this challenge.
There has been a substantial decrease in smoking rates in Queensland over the last three years. In fact two thirds of the decline in smoking nationally occurred in Queensland. Tough smoking legislation was introduced in Queensland in 2005 and it became illegal to smoke in public places. This strategy was supported by Quitline and workplace programs. There are now nearly 90,000 fewer smokers in Queensland than there would have been without these effective interventions.
The planned introduction of fluoride into Queensland water over the next three years is another important initiative. These are only a few of the early success stories we are seeing through our investment in population prevention strategies. More can be done and it is my intention to ensure that the focus is maintained on strategies to reduce the three highest risk factors of obesity, smoking and alcohol misuse.
Queensland is a great state with the best climate for outdoor activities and some of the best locally grown produce in the nation. This report, The Health of Queenslanders 2008: Prevention of Chronic Disease can help us become healthier to take full advantage of our healthy natural environment, safe and secure communities and abundant life opportunities.
Dr Jeannette Young Chief Health Officer Queensland November 2008
That is very much the focus of this report, The Health of Queenslanders 2008: Prevention of Chronic Disease, the second in a series of two-yearly reports from the Chief Health Officer to inform Queenslanders about their health.
The lives of far too many Queenslanders are being compromised and cut short by chronic diseases such as heart attack, stroke, cancer, chronic respiratory disease and diabetes. There are obvious costs for failing to continue our effort, not just for the affected people themselves and their loved ones, but also for the health system and the economy.
One of the five ambitions of the State Government’s 2020 vision, Toward Q2: Tomorrow’s Queensland, is “Making Queenslanders Australia’s healthiest people”, with two Healthy Queensland targets: to have the shortest public hospital waiting times in Australia; and to cut obesity, smoking, heavy drinking and unsafe sun exposure by one third.
To achieve these targets we must continue to foster better health for all Queenslanders by promoting healthy lifestyles, preventing ill health, encouraging early diagnosis of disease and improving management of existing conditions. In particular, we cannot lose focus on the need to keep working with Aboriginal and Torres Strait Islander Queenslanders on the health challenges they face.
We are making gains – and the epidemiological data collected in the last 12 months is showing this for some issues. One of the most important changes is the slowing in the accelerating rate of obesity in Queensland children. This promising outcome has been achieved in the context of the Go for 2&5® campaign and the introduction of Smart Choices and Smart Moves in all Queensland state schools. National surveys tell us parents want the government to ban junk

Report of the Chief Health Officer Queensland
ii
Prevention of Chronic Disease
Table of contents ❚Foreword . . . . . . . . . . . . . . . . . . . . . . . . . . . . . . . . . . . . . . . . . . . . . . . . . . . . . . . . . . . . . . . . . . . . . . . . . . . . . . . . .iExecutive summary . . . . . . . . . . . . . . . . . . . . . . . . . . . . . . . . . . . . . . . . . . . . . . . . . . . . . . . . . . . . . . . . . . . . . . . iiiOverview . . . . . . . . . . . . . . . . . . . . . . . . . . . . . . . . . . . . . . . . . . . . . . . . . . . . . . . . . . . . . . . . . . . . . . . . . . . . . . . . .ivAbout this report . . . . . . . . . . . . . . . . . . . . . . . . . . . . . . . . . . . . . . . . . . . . . . . . . . . . . . . . . . . . . . . . . . . . . . . . . . xIntroduction . . . . . . . . . . . . . . . . . . . . . . . . . . . . . . . . . . . . . . . . . . . . . . . . . . . . . . . . . . . . . . . . . . . . . . . . . . . . . . 1
1. Indicators of progress: The health of Queenslanders 2008. . . . . . . . . . . . . . . . . . . . . . . . . . . 3Key trends . . . . . . . . . . . . . . . . . . . . . . . . . . . . . . . . . . . . . . . . . . . . . . . . . . . . . . . . . . . . . . . . . . . . . . . . . . 4Data sources . . . . . . . . . . . . . . . . . . . . . . . . . . . . . . . . . . . . . . . . . . . . . . . . . . . . . . . . . . . . . . . . . . . . . . . 10Definitions . . . . . . . . . . . . . . . . . . . . . . . . . . . . . . . . . . . . . . . . . . . . . . . . . . . . . . . . . . . . . . . . . . . . . . . . . 10
2. Chronic disease . . . . . . . . . . . . . . . . . . . . . . . . . . . . . . . . . . . . . . . . . . . . . . . . . . . . . . . . . . . . . . . . . . . 11Cancer . . . . . . . . . . . . . . . . . . . . . . . . . . . . . . . . . . . . . . . . . . . . . . . . . . . . . . . . . . . . . . . . . . . . . . . . . . . 14Cardiovascular disease . . . . . . . . . . . . . . . . . . . . . . . . . . . . . . . . . . . . . . . . . . . . . . . . . . . . . . . . . . . . . . 20Diabetes . . . . . . . . . . . . . . . . . . . . . . . . . . . . . . . . . . . . . . . . . . . . . . . . . . . . . . . . . . . . . . . . . . . . . . . . . . 24Anxiety and depression . . . . . . . . . . . . . . . . . . . . . . . . . . . . . . . . . . . . . . . . . . . . . . . . . . . . . . . . . . . . . . 28Respiratory conditions . . . . . . . . . . . . . . . . . . . . . . . . . . . . . . . . . . . . . . . . . . . . . . . . . . . . . . . . . . . . . . . 32Other preventable chronic conditions . . . . . . . . . . . . . . . . . . . . . . . . . . . . . . . . . . . . . . . . . . . . . . . . . . 36
3. Risk factors for chronic disease . . . . . . . . . . . . . . . . . . . . . . . . . . . . . . . . . . . . . . . . . . . . . . . . . . . . 39Smoking. . . . . . . . . . . . . . . . . . . . . . . . . . . . . . . . . . . . . . . . . . . . . . . . . . . . . . . . . . . . . . . . . . . . . . . . . . . 41Overweight and obesity . . . . . . . . . . . . . . . . . . . . . . . . . . . . . . . . . . . . . . . . . . . . . . . . . . . . . . . . . . . . . . 45Nutrition. . . . . . . . . . . . . . . . . . . . . . . . . . . . . . . . . . . . . . . . . . . . . . . . . . . . . . . . . . . . . . . . . . . . . . . . . . . 50Physical inactivity and sedentary behaviour. . . . . . . . . . . . . . . . . . . . . . . . . . . . . . . . . . . . . . . . . . . . . . 55Alcohol . . . . . . . . . . . . . . . . . . . . . . . . . . . . . . . . . . . . . . . . . . . . . . . . . . . . . . . . . . . . . . . . . . . . . . . . . . . . 60High blood pressure . . . . . . . . . . . . . . . . . . . . . . . . . . . . . . . . . . . . . . . . . . . . . . . . . . . . . . . . . . . . . . . . . 64High blood cholesterol . . . . . . . . . . . . . . . . . . . . . . . . . . . . . . . . . . . . . . . . . . . . . . . . . . . . . . . . . . . . . . . 66
4. Impacts of chronic disease and opportunities for prevention across the life course . . 69 Maternal and infant . . . . . . . . . . . . . . . . . . . . . . . . . . . . . . . . . . . . . . . . . . . . . . . . . . . . . . . . . . . . . . . . . 72Children . . . . . . . . . . . . . . . . . . . . . . . . . . . . . . . . . . . . . . . . . . . . . . . . . . . . . . . . . . . . . . . . . . . . . . . . . . 76Young people. . . . . . . . . . . . . . . . . . . . . . . . . . . . . . . . . . . . . . . . . . . . . . . . . . . . . . . . . . . . . . . . . . . . . . . 81Adults. . . . . . . . . . . . . . . . . . . . . . . . . . . . . . . . . . . . . . . . . . . . . . . . . . . . . . . . . . . . . . . . . . . . . . . . . . . . . 85Older people . . . . . . . . . . . . . . . . . . . . . . . . . . . . . . . . . . . . . . . . . . . . . . . . . . . . . . . . . . . . . . . . . . . . . . . 91Socioeconomic disadvantage . . . . . . . . . . . . . . . . . . . . . . . . . . . . . . . . . . . . . . . . . . . . . . . . . . . . . . . . . 96Indigenous people . . . . . . . . . . . . . . . . . . . . . . . . . . . . . . . . . . . . . . . . . . . . . . . . . . . . . . . . . . . . . . . . . . 98Regional and remote populations . . . . . . . . . . . . . . . . . . . . . . . . . . . . . . . . . . . . . . . . . . . . . . . . . . . . .101Culturally and Linguistically Diverse populations . . . . . . . . . . . . . . . . . . . . . . . . . . . . . . . . . . . . . . . . .102
5. Prevention works . . . . . . . . . . . . . . . . . . . . . . . . . . . . . . . . . . . . . . . . . . . . . . . . . . . . . . . . . . . . . . . . .103Smoking. . . . . . . . . . . . . . . . . . . . . . . . . . . . . . . . . . . . . . . . . . . . . . . . . . . . . . . . . . . . . . . . . . . . . . . . . .105Alcohol . . . . . . . . . . . . . . . . . . . . . . . . . . . . . . . . . . . . . . . . . . . . . . . . . . . . . . . . . . . . . . . . . . . . . . . . . . .108Nutrition. . . . . . . . . . . . . . . . . . . . . . . . . . . . . . . . . . . . . . . . . . . . . . . . . . . . . . . . . . . . . . . . . . . . . . . . . .110Physical activity. . . . . . . . . . . . . . . . . . . . . . . . . . . . . . . . . . . . . . . . . . . . . . . . . . . . . . . . . . . . . . . . . . . .115Cancer screening . . . . . . . . . . . . . . . . . . . . . . . . . . . . . . . . . . . . . . . . . . . . . . . . . . . . . . . . . . . . . . . . . . .117
6. Challenges and opportunities. . . . . . . . . . . . . . . . . . . . . . . . . . . . . . . . . . . . . . . . . . . . . . . . . . . . .119Key challenge 1 – Make prevention of chronic disease everyone’s business . . . . . . . . . . . . . . . . . . .121Key challenge 2 – Make prevention a key to reducing health inequality . . . . . . . . . . . . . . . . . . . . . .127Key challenge 3 – Make healthy weight a priority. . . . . . . . . . . . . . . . . . . . . . . . . . . . . . . . . . . . . . . . .130
Methodology . . . . . . . . . . . . . . . . . . . . . . . . . . . . . . . . . . . . . . . . . . . . . . . . . . . . . . . . . . . . . . . . . . . . . . . . . . .133Abbreviations . . . . . . . . . . . . . . . . . . . . . . . . . . . . . . . . . . . . . . . . . . . . . . . . . . . . . . . . . . . . . . . . . . . . . . . . . . .133References . . . . . . . . . . . . . . . . . . . . . . . . . . . . . . . . . . . . . . . . . . . . . . . . . . . . . . . . . . . . . . . . . . . . . . . . . . . . .134
Report of the Chief Health Officer Queensland Prevention of Chronic Disease
iii
Executive summary
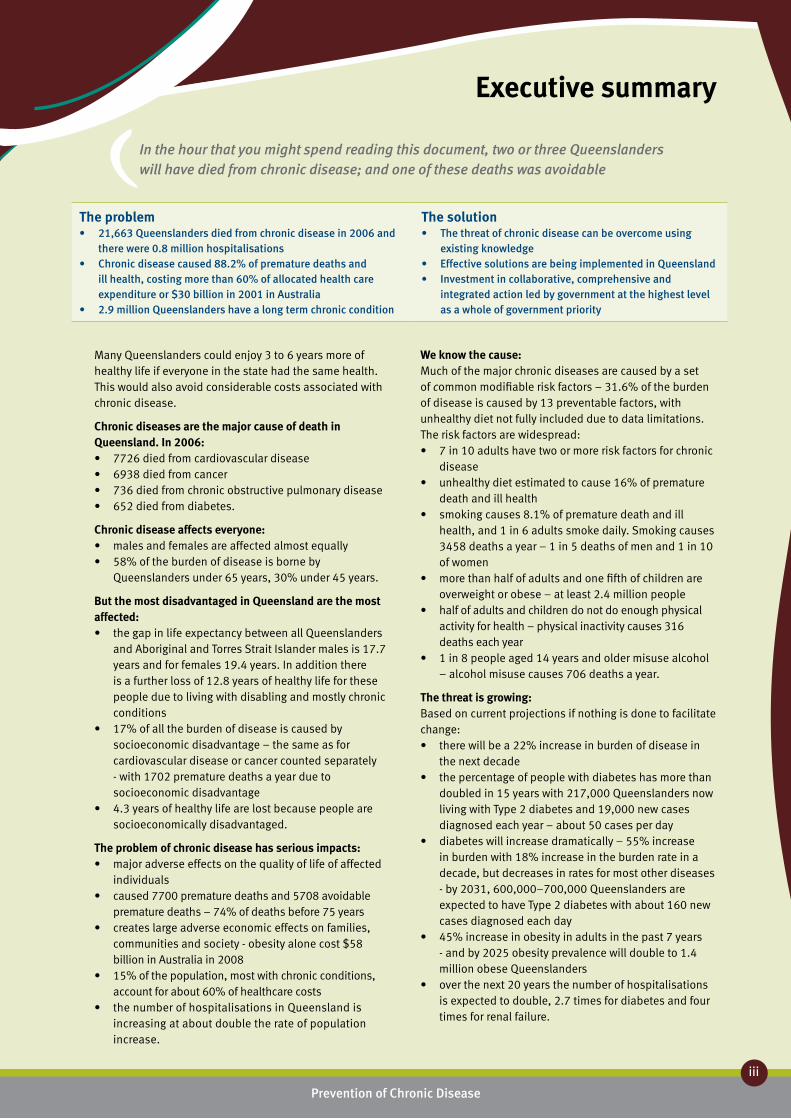
In the hour that you might spend reading this document, two or three Queenslanders will have died from chronic disease; and one of these deaths was avoidable
Many Queenslanders could enjoy 3 to 6 years more of healthy life if everyone in the state had the same health. This would also avoid considerable costs associated with chronic disease.
Chronic diseases are the major cause of death in Queensland. In 2006:
7726 died from cardiovascular disease•6938 died from cancer•736 died from chronic obstructive pulmonary disease•652 died from diabetes.•
Chronic disease affects everyone:males and females are affected almost equally•58% of the burden of disease is borne by •Queenslanders under 65 years, 30% under 45 years.
But the most disadvantaged in Queensland are the most affected:
the gap in life expectancy between all Queenslanders •and Aboriginal and Torres Strait Islander males is 17.7 years and for females 19.4 years. In addition there is a further loss of 12.8 years of healthy life for these people due to living with disabling and mostly chronic conditions17% of all the burden of disease is caused by •socioeconomic disadvantage – the same as for cardiovascular disease or cancer counted separately - with 1702 premature deaths a year due to socioeconomic disadvantage 4.3 years of healthy life are lost because people are •socioeconomically disadvantaged.
The problem of chronic disease has serious impacts:major adverse effects on the quality of life of affected •individualscaused 7700 premature deaths and 5708 avoidable •premature deaths – 74% of deaths before 75 yearscreates large adverse economic effects on families, •communities and society - obesity alone cost $58 billion in Australia in 200815% of the population, most with chronic conditions, •account for about 60% of healthcare costs the number of hospitalisations in Queensland is •increasing at about double the rate of population increase.
We know the cause: Much of the major chronic diseases are caused by a set of common modifiable risk factors – 31.6% of the burden of disease is caused by 13 preventable factors, with unhealthy diet not fully included due to data limitations. The risk factors are widespread:
7 in 10 adults have two or more risk factors for chronic •diseaseunhealthy diet estimated to cause 16% of premature •death and ill healthsmoking causes 8.1% of premature death and ill •health, and 1 in 6 adults smoke daily. Smoking causes 3458 deaths a year – 1 in 5 deaths of men and 1 in 10 of womenmore than half of adults and one fifth of children are •overweight or obese – at least 2.4 million peoplehalf of adults and children do not do enough physical •activity for health – physical inactivity causes 316 deaths each year1 in 8 people aged 14 years and older misuse alcohol •– alcohol misuse causes 706 deaths a year.
The threat is growing: Based on current projections if nothing is done to facilitate change:
there will be a 22% increase in burden of disease in •the next decadethe percentage of people with diabetes has more than •doubled in 15 years with 217,000 Queenslanders now living with Type 2 diabetes and 19,000 new cases diagnosed each year – about 50 cases per daydiabetes will increase dramatically – 55% increase •in burden with 18% increase in the burden rate in a decade, but decreases in rates for most other diseases - by 2031, 600,000–700,000 Queenslanders are expected to have Type 2 diabetes with about 160 new cases diagnosed each day45% increase in obesity in adults in the past 7 years •- and by 2025 obesity prevalence will double to 1.4 million obese Queenslandersover the next 20 years the number of hospitalisations •is expected to double, 2.7 times for diabetes and four times for renal failure.
The problem21,663 Queenslanders died from chronic disease in 2006 and •there were 0.8 million hospitalisationsChronic disease caused 88.2% of premature deaths and •ill health, costing more than 60% of allocated health care expenditure or $30 billion in 2001 in Australia2.9 million Queenslanders have a long term chronic condition•
The solutionThe threat of chronic disease can be overcome using •existing knowledgeEffective solutions are being implemented in Queensland•Investment in collaborative, comprehensive and •integrated action led by government at the highest level as a whole of government priority

We face an epidemic of unparallel
proportions – CDC USA 200345
Report of the Chief Health Officer Queensland
iv
Prevention of Chronic Disease
Overview ❚Objective international standards show that the health of Queenslanders is generally very good. Our life expectancy is very high compared with OECD countries. We believe that our health and quality of life are good.
Yet no matter how we measure the health of Queenslanders – by the length of life or by the quality of that life – we cannot afford to ignore the urgency of chronic disease. Chronic disease is one of the current and growing challenges for both the Queensland and Australian health systems. It is placing health systems under significant and unprecedented pressure that cannot be sustained. There is an urgent need to reduce the burden on the health system by reducing the prevalence of chronic disease. A reduction in chronic disease prevalence will also greatly increase the quality of life of Queenslanders and the prosperity of the state. The Queensland Government’s 2020 vision of Toward Q2: Tomorrow’s Queensland includes as one of its five ambitions the vision to make Queenslanders Australia’s healthiest people.46
The Health of Queenslanders 2008: Prevention of Chronic Disease reports on the health status and burden of disease of Queenslanders through reporting on 65 indicators of progress. This report focuses on the prevention of chronic disease in recognition of the scale and severity of chronic disease in Queensland and the resultant threats to the physical, mental, social and economic wellbeing of Queenslanders.
To prevent chronic disease we need to know which risk factors are most influential and amenable to intervention. Thirteen measurable and preventable risk factors cause one third (31.6%) of the total impact of ill health and premature death in Queensland.29 Tobacco smoking and physical inactivity are the largest individual causes of burden of disease. Poor diet in total is estimated to cause at least 16% of the burden of disease, similar to that caused by cardiovascular disease or cancer, and about double that of smoking. Socioeconomic disadvantage in Queensland leads to 17% of the burden of disease. Consistent with this data are estimates in the United States which show that about 15% of premature deaths are due to genetic predispositions, 40% to behaviours, 15% to socioeconomic status, 5% to environmental factors and 10% to deficiencies in medical care.47 Reparative work to ill health undertaken by the health system is estimated to contribute 25% to the health of Canadians.18 Clearly health is much more than health care.
The problemChronic disease is a major health problem in Queensland that has grown in recent years and will get worse if nothing or little new is done. This growth is due to the increasing number of people diagnosed with chronic diseases and the long-lasting and persistent nature of most chronic diseases. Specifically the prevalence and impact of chronic disease in Queensland is increasing due to four major factors:
increasing population1. ageing of the population, with older people much 2. more likely to have chronic diseaselifestyle, particularly increases in physical 3. inactivity and sedentary behaviours, poor nutrition and psychological distress, as well as the ongoing impact of smoking and alcohol misuseimprovements in treatment of disease 4. complications resulting in fewer deaths.
Since 2000, the rate of increase in hospitalisations in Queensland has been about double the rate of population increase – a 25% increase in the number of hospitalisations in the same period as the population grew by 15%.
In the last decade life expectancy increased 3.1 years for males and 2.1 years for females – to 78.5 years for males and 83.4 years for females. However, the gap in life expectancy between male Aboriginal and Torres Strait Islanders and other Queenslanders is 17.7 years and 19.4 years for females. The infant mortality rate in Queensland’s Aboriginal and Torres Strait Islander infants is 2.2 higher than the rate for other infants.
Chronic diseases The major preventable chronic diseases are:
Cancerone in three males and one in four females will be •diagnosed before the age of 75 yearscauses 19% of the premature death and illness •burdensurvival rates have increased due to prevention, •early detection and advances in treatment: the average five year survival rate is 63.5% - ranging from 94.1% for melanoma to 12.9% for lung cancer33.5% of the cancer burden of disease is due to •11 preventable risk factors - 20.7% due to tobacco smoking, with physical inactivity and overweight and obesity also contributing significantly57.9% of women aged 50-69 years are screened •by BreastScreen Queensland and 57.9% of women
Report of the Chief Health Officer Queensland Prevention of Chronic Disease
v
aged 20-69 years have a regular Pap smear: a bowel cancer screening program began in 2006.
Cardiovascular disease67% of the cardiovascular disease burden is due •to high blood pressure, high blood cholesterol, physical inactivity, overweight and obesity, smoking, and insufficient fruit and vegetables and six other factors - the full effect of poor diet is not measurablecoronary heart disease death rates are 62% higher •in males, 29% higher in disadvantaged areas and 39% higher in areas with a larger Aboriginal and Torres Strait Islander populationcoronary heart disease death rates decreased by •5.7% and stroke by 3.8% each year this decade – resulting in 427 fewer deathsreducing cardiovascular disease is key to improving •the health of Queenslanders. Coronary heart disease death rates are 11% higher and stroke is 8% higher than national rates. These conditions cause about one quarter of the difference in health adjusted life expectancy throughout the state.
Diabeteswill increase dramatically – with a 55% increase in •total burden and 18% increase in the burden rate in a decade: by 2031, between 600,000 and 700,000 adult Queenslanders are expected to have Type 2 diabetes (about 15% of people aged 25 years and older), with 160 new cases diagnosed each day.7% of adults 25 years and older have diabetes - •about 217,000 of all Queenslanders have Type 2 diabetes with about 19,000 new cases diagnosed each year, or about 50 new cases per dayin the last 25 years diabetes prevalence has •increased 2.5 timesAboriginal and Torres Strait Islanders are 3.4 times •more likely to have diabetes than other AustraliansType 2 diabetes is now being diagnosed in children •– about 25 per year in Australia below age 15 years – previously Type 2 diabetes was seen as an adult diseaseTotal cost of diabetes in Queensland in 2008 is •estimated at $6.9 billion3, including $4.4 billion in cost of lost wellbeing and $2.5 billion in direct financial costs. Over the next three decades, diabetes expenditure is projected to increase 400% compared with average 27% increase in total health costs.
Anxiety and depression482,000 Queenslanders (about one in eight) report •a long term mental and behavioural problem – 18% higher than the average for Australiaone in seven adults (15%) report high levels •of psychological distress – 9% higher than the Australian average people with a chronic condition report higher •levels of psychological distress - the more chronic conditions they have the higher the levels of distressone in six adults (17%) report poor or fair health, •6% higher than the Australian average.
Respiratory diseases3.7% of Queenslanders have chronic obstructive •pulmonary disease (COPD)death rates due to COPD are twice as high in males •than females, 31% higher in disadvantaged areas, 70% higher in remote areas and 200% higher in areas of high Aboriginal and Torres Strait Islander population10.8% of Queenslanders have asthma, which is the •largest health problem for children.
Risk factors The major preventable risk factors for chronic disease are:
Smoking17.2% of Queenslanders aged 14 years and older •smoke daily. Queensland rates declined by 13% between 2004 and 2007 and taking into account population increase, about 87,000 fewer smokers. Rates are still 4% higher than Australian rates. About 50% of Australian Aboriginal and Torres Strait Islanders smoke daily20.3% of women smoke during pregnancy and •twice as many teenage and Aboriginal and Torres Strait Islander mothers smokecauses 8.1% of burden of disease, 3458 deaths •and 34,138 hospitalisations each year, and 80% of lung cancer, 11% of coronary heart disease and 63% of COPDcosts the Australian economy $31.5 billion each •year or $6.3 billion per year in Queensland.48
Overweight and obesity56.8% of adults are overweight or obese – 62.7% •for males and 50.6% for females - 0.6 million are obese and another 1.6 million are overweight. The obesity rate is double for Aboriginal and Torres Strait Islander adults. Rates of self reported obesity increased by 45% for adults since 2001

Report of the Chief Health Officer Queensland
vi
Prevention of Chronic Disease
21% of children are overweight or obese - at least •36,000 are obese and another 120,000 overweight. Rates are 2-3% less than in other states with comparable datacauses 55.4% of the burden of disease due to •diabetes, 19.9% of cardiovascular disease and 3.8% of cancerobesity prevalence in young people means their life •expectancy may be shorter than for their parents obesity prevalence is projected to increase by up to •200% in 2025 to 1.4 million obese Queenslanderscurrently costs the Queensland society $11.6 billion •per year,3 an increase of 42% in three years.
Physical inactivity and sedentary behaviour53% of adults do enough physical activity, with •lower levels in disadvantaged areas. Rates have increased in recent years but remain one of the worst in the country 28% of adults are sedentary (average of seven •hours or more sitting each day of the week)43% of children aged 5-12 years and 51% of those •aged 14-17 years do enough physical activity23% of Queensland children aged 5-17 years spend •more time on screen based electronic media for entertainment than is recommendedcauses 6.6% of the burden of disease, 316 deaths •each year, and 22% of colon cancer, 18% of osteoporotic fractures and 12% of diabetes and hypertensioncosts $1.49 billion in health care in Australia •each year.
Poor nutritioncauses at least 16% of premature death and ill •health. Nutrition data are limited in Queensland cost of healthy food remains much higher in very •remote areas (24.2% higher) and 32.6% higher in towns more than 2000 kilometres from Brisbane adults don’t eat enough fruit and vegetables: 9% •eat at least five serves of vegetables per day and 54.6% of adults eat at least two serves of fruit: an average 4.3 serves of fruit and vegetable per person per day. Consumption has increased in recent years95% of infants are fed breast milk at some time, •with 88% breastfed leaving hospital. By six months the rate of breastfeeding falls to 59%, with 13% exclusively breastfed. Rates of breastfeeding have increased in the last five years but are still below national recommendationscosts the economy more than $5 billion nationally •per year, including direct health care costs of
about $3 billion per year, about 14% of the annual Queensland hospital budget ($192 million).49
Alcohol misuse15.1% of people aged 14 years and older are •drinking at risky levels of harm in the long term; 33.9% at risk in the short term. Young people, particularly females, have the riskiest drinking profilealcohol consumption patterns remained largely •unchanged between 1991 and 2007causes 706 deaths each year and 18.7% of the •total burden of disease from injuries and 9.5% from mental disorderscosts the Queensland hospital system over $128 •million per year, and the Australian community $15.3 billion, with the greatest costs borne by workplaces.48
High blood pressure25% of adults have high blood pressure with about •60% being treated by medication. About 3% of Australian adults aged 25 years and older develop high blood pressure each yearcauses 6.6% of the burden of disease.•
High blood cholesterolabout 50% of adults have high blood cholesterol•causes 6.2% of the burden of disease.•
The solutionIt is clear that the health of Queenslanders and the health system of Queensland is under threat from chronic disease. It is also clear that much of chronic disease is caused by preventable risk factors. We also know that reducing people’s risk factors can lead to rapid improvements in health and improved sense of wellbeing. Therefore there are significant opportunities to further improve the health of Queenslanders.
Yet improving the health of Queenslanders poses significant challenges due to the complexity of health and of the causes of ill health. The development of chronic disease and exposure to known risk factors starts before birth and is a life long process. How we organise our society and how we live our lives results from activites across government, in businesses and communities and through individual action. The prevention of chronic disease in Queensland requires collaborative interventions by multiple agencies and sectors.
The knowledge exists to deal with this threat and to save many lives. There is good evidence that chronic disease can be prevented from occurring in the first place and also from progressing to become a complex

Report of the Chief Health Officer Queensland Prevention of Chronic Disease
vii
problem requiring expensive and intensive medical care. Effective and cost effective interventions exist, and we have the knowledge to implement them. Some of these interventions are being implemented in Queensland and they are making a clear difference. If existing and known interventions are combined through a comprehensive, integrated approach, prevention of chronic disease can be achieved. The key question is how governments, the private sector and civil society will work together to put such approaches into practice.
With a community based public health infrastructure that embraces prevention as a priority, we can become a healthier state. Many Queenslanders could enjoy three to six years more years of healthy life if rates of ill health were the same throughout the state. This would also avoid costs associated with chronic disease. These gains are achievable if we improve access to quality health care services, emphasise healthy behaviour and focus on broad policies and strategies that offer the most benefit for the greatest number of people at the lowest cost concurrently with strategies that specifially seek to reduce health inequalities.
The prevention of chronic disease in Queensland requires a whole of government approach. Leadership at the highest levels of government is fundamental. All government departments must be accountable for chronic disease prevention at Cabinet level. New initiatives will be required each year to contribute to chronic disease prevention including contestable incentive funding that government departments can apply for. Cabinet submissions and departmental plans should include impact statements on chronic disease prevention. Achievement towards ‘Making Queenslanders Australia’s healthiest people’; an ambition of the State Government’s 2020 vision, must be monitored. The whole of government approach requires public accountability for achievement against performance measures with clear outcome targets at a departmental level specific to their contribution.
What are the potential savings? (Note dollar values are not directly comparable). In 2008, 55% of early deaths could be attributed to the combined effect of smoking, being overweight, inactive, and poor diet.50
Smokingwithin several months of quitting smoking there •is a decrease in coughing and other respiratory symptoms and an increase in lung function51
there are major gains in heart health and reduced •cancer risk after quitting: after one year excess risk of heart disease is reduced by half; after five years the risk of stroke is reduced by about 60%; after ten years the lung cancer death rate is about half; and after fifteen years an ex-smoker’s risk of heart disease is about the same as that of a non-smoker52
if smoking was reduced from by five percentage •points over the next 30 years it would save at least 10,800 Queensland lives and avoid $225.8 million in treatment costs for cancer, COPD and cardiovascular disease.53
Overweight and obesityspending on prevention of obesity is less than $1 •per person each year: treating the consequences costs $70 per person each year35
a 10% reduction in body mass index (BMI) in •overweight women can cause a 12% decrease in hypertension and 23% decrease in diabetes up to eight years later – this is possible with very moderate reductions in kilojoule intake (about a chocolate biscuit a day) and an extra 2000 steps a day37
for pre-diabetics lower intake of fat and kilojoules, •along with an average 30 minutes walking five days per week, results in weight loss of about 5 kg and a subsequent 58% reduced risk of getting diabetes up to six years later54 if all overweight or obese Australians lost 5 kg, •there would be a $44 million saving per year in health care costs due to diabetes.54
Physical inactivity and sedentary behaviourmoderate physical activity can lower the risk of •diabetes by up to 35%9 and reduce the risk of depression55 up to $88 million per year could be achieved •for every 1% increase in the proportion of the population who do sufficient level of physical activity for health.56
Poor nutritionincreasing average vegetable and fruit •consumption by just one serve daily would result in direct health care savings of $513 million a year in Australia.57,58 Even if fruit and vegetable consumption was increased by half a serve per day, it would boost the horticulture industry by $869 million a year59 a minimum of $11.5 million could be saved each •year in Australia if 80% of babies were exclusively breastfed till three months of age.60
Report of the Chief Health Officer Queensland
viii
Prevention of Chronic Disease
Alcohol misusecosts the Queensland hospital system $128 million •per year and the Australian community $15.3 billion per year.48
Cancer screeningdeath from breast cancer can be reduced by •25-30% if 70% of women aged 50-69 years were screened every two years22
about 90% of the most common forms of cervical •cancer can be prevented if all women had Pap smears every two years61
a faecal occult blood test every two years can •reduce the risk of death from bowel cancer by up to one third.62
The challengesTo further improve the health of Queenslanders will be a challenge for government, communities and individuals. Three interrelated challenges to the prevention of chronic disease may hold the key to success:
Make prevention of chronic disease everyone’s 1. business.Make prevention a key to reducing health 2. inequality.Make healthy weight a priority.3.
Fundamental to meeting these challenges is the need for sustainable investment in the systematic collection of data and the analytical capacity to monitor the causes and trends of the chronic disease burden and accurately evaluate the interventions.
We have the knowledge to address these challenges. Doing nothing new or doing little will mean a great deal of illness, suffering and premature death that is otherwise preventable. It will mean, as is already being seen, over loading of hospitals, health and welfare services, made more acute by the ageing of the Queensland population. Similarly it will mean rising costs within the health system and losses in workplace productivity.
What do we need to do?Within the required whole of government approach to prevention of chronic disease, there are clear imperatives for policy reform and further investment for the prevention of chronic disease in Queensland. Strong evidence indicates that sustained investment in these initiatives, including the workforce required for implementation in communities across Queensland, will achieve gains in the health of Queenslanders integral to ‘making Queenslanders Australia’s healthiest people’;
an ambition of the State Government’s 2020 vision, Toward Q2: Tomorrow’s Queensland.
Consistent with the Queensland government’s 2020 vision and Toward Q2 goals, and the focus adopted by the National Preventative Health Taskforce, three areas of immediate priority are actions to reduce obesity, smoking prevalence and improve alcohol consumption.
ObesityHalting and reversing the rise in overweight and obesity in Queenslanders of all ages will require significant and wide reaching action and investment. While there is more to learn about how to reduce overweight and obesity, this must not stop us acting now – we must act on the basis of what we already know, follow the best advice and evidence available and learn by doing. Evidence informed interventions include:
massive scaling up of physical activity and healthy •eating programs in early learning centres, schools, and workplacestotal ban on junk food advertising to protect •children and others from inappropriate marketing of unhealthy foods and beveragesincreasing the frequency, reach and intensity of •social marketing campaigns to encourage healthier food choices and increased physical activity in all social groupsincreasing policy and accreditation supports for the •promotion of health in childcare facilities and early learning centres strengthening implementation of • Smart Choices and Smart Moves programs in all Queensland schoolsincreasing availability, affordability and •accessibility of healthy foods, especially improving access to healthy food at reasonable prices in remote and Indigenous communitiesenhancing programs and infrastructure to promote •active forms of transport including cycling and pedestrian infrastructure and promotion of travel behaviour change programs such as TravelSmart in schools and workplacesaltering obesity-promoting environments so that they •offer many more opportunities to be active, including provision of end-of-trip facilities and opportunities for incidental physical activity such as stairwell access delivering workplace health promotion programs in •all state government departments and incentives developed to encourage private industry to support evidence based workplace health promotion programs
Report of the Chief Health Officer Queensland Prevention of Chronic Disease
ix
planning policies which consistently consider •the physical, social and mental health aspects of Queenslander’s healthuse of Health Impact Assessment as a tool to inform •planning and decision makingincreasing the use and support of the primary •health care sector to provide community education and advice about nutrition, physical activity and the management of overweight and obesity, including providing an appropriately skilled workforcedeveloping a national food strategy which integrates •food safety, food production, agricultural policy and addresses issues with climate change to ensure a safe and sustainable food supply in Australia.
TobaccoWhilst there have been many gains in tobacco control over recent years, much more remains to be done. Queensland’s multi-strategy plan for tobacco smoking could be enhanced through a range of interventions which include:
higher tobacco taxation•total ban on tobacco product displays at retail •outlets every health professional asking and recording •patient smoking status, providing immediate advice that the best thing for improved health is to not smoke, and following with assistance or referral to Quitline (13 QUIT)increasing the frequency, reach and intensity of •social marketing campaigns to discourage smoking in all social groupsincreasing the availability of nicotine replacement •therapy (NRT)a multi-strategy effort to tackle smoking among •Indigenous people including enhancing Quitline to provide more culturally sensitive services and NRT, expanding the SmokeCheck program, exploring innovative strategies targeting specific groups such as young people and pregnant women, and working with communities to promote and enforce smoke-free environmentsimplementing strategies specifically aimed at •reducing smoking amongst pregnant womenincreasing the multi-strategy effort to reduce •smoking in young people and socioeconomically disadvantaged peopledelivering additional and tailored • Quitline services including a telephone-based quit smoking course with subsidised NRT.
AlcoholThere is strong evidence that substantial reductions in alcohol-related health and social costs could be achieved by implementing, or improving the implementation of, a range of interventions which include:
higher alcohol taxation•total bans on alcohol advertising and other forms of •promotion for example in relation to sportsstronger measures to reduce drink driving, •including more intensive enforcement of random breath testing and lowering the legal blood alcohol concentration level increasing restrictions on the sale of alcohol •through reducing density of supply outlets in particular in disadvantaged areas, reducing outlet opening hours including pubs and clubs, and continuing the prohibition of the sale of alcohol in supermarketsscaling up of interventions by health care •professionals to reduce hazardous alcohol consumption, including significant enhancements to telephone-based counselling.
ConclusionPrevention of chronic disease is everyone’s businessLeadership at the highest level of government is needed to address this complex, multifaceted problem and the three identified challenges. All sectors of society and all levels of government need to be involved if the urgent and growing threat of chronic disease is to be contained and ultimately reduced. A prevention strategy for Queensland will involve universal access to appropriate services to change behaviours, built environments, and child care, school and workplace settings that support healthy living. Specific strategies are needed to address the special needs of some population sub-groups such as the disadvantaged, Indigenous people and those in remote communities, as well as the most vulnerable: infants, children and older people.
The potential benefits are great: improved health and wellbeing across the population, narrowing the health divide, with significant benefits to the broader economy. This will result in reduced or contained health care costs, freeing resources for other needs and goals within this state. The international evidence on what works is growing; we have early successes in Queensland; the national agenda is shifting towards prevention and there is growing support in the community for such a shift of focus. Prevention of the threat of chronic disease can be achieved.

Report of the Chief Health Officer Queensland
x
Prevention of Chronic Disease
About this report ❚This is the second report in The Health of Queenslanders series of two-yearly reports from the Chief Health Officer to inform Queenslanders about the health status of the population, as described in the Queensland Health Action Plan 2005. The report includes selected population health indicators, which are standardised to monitor trends over time. The report also demonstrates the health differentials between Queenslanders.
A range of data was used to develop these indicators. The latest available data are presented, including a range of unpublished data from recent Queensland Health surveys, analysis of the Queensland burden of disease and analysis of the suite of health related administrative databases. These sources of data are cited and statistical methods are summarised in the methodology. Unless otherwise indicated, all data refers to the total population of Queensland.
Each of the tables and figures in this report, with supporting information, are able to be saved from the website www.health.qld.gov.au/cho_report
The indicators in this report build upon previous health status reports by Queensland Health, particularly The Health of Queenslanders 2006,63 Health Determinants Queensland 2004,64 The State of Health of the Queensland Population 200465 and Health Indicators for Queensland 2001.66,67,68 All of these reports are available on the Queensland Health website, www.health.qld.gov.au
ContentChapter 1: Indicators of progress, is a listing of the most recent health data on a broad range of population health headline indicators, key determinant and outcome indicators for Queensland. Information for earlier years back to 2000 are included where these are available. While each of the indicators is reported for all persons only in this document, separate data for males and females is available on www.health.qld.gov.au/cho_report. It is intended to repeat this table in all future Chief Health Officer Reports, updating each with most recent data, and expanding the list to include new population indicators as data become available or as new indicators emerge.
Chapter 2: Chronic disease, reports on the Queensland information for the major chronic diseases, including burden of disease, deaths, hospitalisations, incidence and prevalence. The chapter provides information on cancer, cardiovascular disease, diabetes, anxiety and depression, respiratory diseases, and other specific chronic diseases. Information on each disease includes the cause, preventability, distribution, costs, trends and projections.
Chapter 3: Risk factors for chronic disease, reports smoking, overweight and obesity, physical inactivity, poor nutrition, alcohol misuse, high blood pressure and high blood cholesterol. Similar to Chapter 2, information on these risk factors includes the cause, preventability, distribution, projections, and challenges and opportunities for health gain.
Chapter 4: Impacts of chronic disease and opportunities for prevention across the life course, provides information for all age groupings from infants to older people, and for each major subpopulation of Queensland: socioeconomically disadvantaged, Indigenous, regional and remote populations, and culturally and linguistically diverse populations.
Chapter 5: Prevention works, highlights major gains in the prevention of chronic disease that have recently been achieved in Queensland through targeted investments.
Chapter 6: Challenges and opportunities, describes the key challenges to achieving better health for Queenslanders through the prevention of chronic disease.
The following images were sourced from BigStockPhoto.com:
© AlexStar Front Cover© Piksel Front Cover© Fotko Front Cover© Adam1975 Front Cover© Kurhan Page 72© Ni Der Lander Page 74
5708 deaths in Queensland could have been
avoided – 74% of all deaths before 75 years
that were due to chronic disease
Report of the Chief Health Officer Queensland Prevention of Chronic Disease
1
Introduction ❚
We are confronted with the fierce urgency of now – Martin Luther King69
The health of Queenslanders has improved considerably over the last few decades. We now have one of the longest life expectancies in the world and for many diseases death rates are now the lowest they have ever been.
Health is more than the absence of threats of disease and disability: it is a precious resource that helps to create productive, satisfying lives for ourselves and our families and economic security for the state. While all of us, from individuals to governments place a high value on health, all too often health is not protected and promoted. Indeed the current investments in health protection, promotion and prevention are far overshadowed by expenditures to restore health once it is lost. Although $94 billion was spent in Australia on health care in 2006-07 or 9% of the Gross Domestic Product (GDP),70 only 1.8% of recurrent health expenditure ($87.3 billion in 2006-07) was spent on public health activities to protect health and prevent the illnesses and injuries that require health care in the first place.71 This relative investment has remained effectively static over time. The dominance of treatment services over prevention, promotion and protection appears to have grown during the era of modern medicine and is now seen as a pressing problem by public health agencies nationally and internationally.72
In Queensland there are significant challenges to the health of the population. Chronic diseases caused 88.2% of the health problems and early deaths in Queensland in 2006. The total impact of disease in Queensland, premature death and ill health, is projected to increase by 22% in the next decade. Furthermore it is projected that people will get chronic diseases at younger ages. The number of hospitalisations is expected to double in the next two decades to 3.3 million in 2026, with greater increases in costly diseases such as diabetes and renal failure. These changes threaten the health of Queenslanders – their physical, mental and social wellbeing8,73 – and threaten to reverse the health gains made in previous decades.
Good health in Queensland is not shared by all. Notably the health of Aboriginal and Torres Straits Islander Queenslanders is much worse than for others.
An Aboriginal or Torres Strait Islander baby born in 2006 can expect to live about 20 years less than the average Queensland baby. Another major group in our society with worse health are the socioeconomically disadvantaged. Almost one fifth of the total impact of ill health and premature death in Queensland is due to socioeconomic disadvantage.
The health system in Queensland and Australia is not sustainable under these current and growing pressures. Just 15 predominantly chronic diseases drove 56% of the increase in national healthcare expenditure between 1987 and 2000, with 10 of these diseases related to obesity.74 In fact, in South Australia it is projected that ‘… by 2042, without significant change to the health system the entire state budget could be consumed by the health care sector’.75 Similar analyses have not been done for Queensland, the overall magnitude of the outcome is likely to be the same.
The Health of Queenslanders 2008: Prevention of chronic disease reports on the health status and burden of disease of Queenslanders and includes 65 progress indicators. Recognising the scale and severity of chronic disease in Queensland, and the resultant threats to the physical, mental and social wellbeing of Queenslanders, this report focuses on the prevention of chronic disease.
A large proportion of all deaths in Queensland are due to chronic disease; 89% in 2006. About one third (38%, or 7700 deaths) were premature i.e. occurred before the age of 75 years. Only premature deaths are considered potentially avoidable. Of the 7700 premature chronic disease deaths in 2006, 74% or 5708 deaths could have been avoided by preventing the onset of disease, treating the condition through health care or both. These 5708 avoidable chronic disease deaths represent 23% of all deaths in Queensland. Smoking, alcohol misuse, poor nutrition and physical inactivity all increase the risk of chronic disease. Importantly, one third of the total impact of ill health and premature death in Queensland is due to the combined effect of 13 preventable and measurable risk factors.29 The impact of poor diet is unable to be fully assessed, but will increase the amount of the burden of disease due to risk factors.

The health system cannot be sustained
under the current and growing pressures
of chronic disease
Report of the Chief Health Officer Queensland
2
Prevention of Chronic Disease
These preventable risk factors are a major cause of many chronic diseases (Figure 1):
overall 31.5% of total burden of disease and injury •is due to 13 measurable risk factorstwo thirds (67%) of cardiovascular disease is due to •10 risk factors: 83% of coronary heart disease and 66% of strokeabout 60% of diabetes burden is due to overweight •and obesity, and lack of physical activityone third of the cancer and injury burden is due to •11 risk factorsone quarter of mental health burden is due to 4 risk •factors.
In 2008, in a study of about 77,000 women over a 24 year period, 28% of early deaths could be attributed to smoking and 55% to the combined effect of smoking, being overweight, inactive, and poor diet.50 Similar findings could also apply to males.
Chronic diseases and their risk factors show significant variation across population groups in their incidence, prevalence and associated health outcomes. Surveillance of chronic disease and risk factors for all Queenslanders and sub-populations is critical for preventing chronic disease. This information helps to target actions to those who will benefit and to assess whether chronic disease has been prevented. The information in this report is derived from surveillance in Queensland, nationally and internationally, as well as research. However, the Queensland surveillance of risk factors is limited. Without a minimal surveillance system,
34
All causes
Cancer
Cardiovascular disease
Mental health
Neurological
Injury
Diabetes
Other
32
67
25
32
0
61
12
Percent of burden attributed to 13 measurable risk factors
Figure 1: Chronic disease risk factor attribution, Queensland 200329
the evidence base for prevention of chronic disease and evaluation of intervention impacts is compromised.
There is an urgent need for action. The Australia 2020 summit determined an ambition that ‘By 2020, Australia will have Health policy focused on prevention – not only within health, but across Government and the whole community’.76 The costs to the health system and to the Queensland society and economy are clear and described in this report. The opportunities for prevention of each chronic disease and risk factor are also described. The means of preventing and controlling most chronic diseases are well established, and some of the recent successes in Queensland to prevent chronic disease are showcased. Through investing in evidence based and well targeted prevention and control now, there are significant opportunities to further reduce the impact of chronic disease in Queensland. While this raises a number of challenges, reductions are possible with known interventions. Implementation of these will do much to close the gap in health status of different populations in Queensland and enhance the health of all Queenslanders. The successful prevention of chronic disease in Queensland is described in Chapter 5: Prevention works, and the challenges to further success are discussed in Chapter 6: Challenges and opportunities.

Report of the Chief Health Officer Queensland Prevention of Chronic Disease
3
In th
is c
hapt
er:
Indicators of progress: The health of Queenslanders 2008
Monitoring the health of Queenslanders is fundamental to the provision of evidence based services in Queensland to improve health status. This chapter reports on trends in 65 population health indicators between 2000 and the most recently available data. The indicators are in the categories of:
population•headline indicators•causes of death•hospitalisations•cancer incidence•disease prevalence •communicable disease notifications•risk factor prevalence•protective factor prevalence.•
Six key trends of outstanding or emerging health issues in 2008 are further described. These include:
ageing•infant mortality•coronary heart disease mortality•female breast cancer incidence and mortality•smoking and alcohol trends•overweight and obesity prevalence.•
Further information on many of these progress indicators is reported in Chapters 2, 3 and 4 of this report. In particular, many of these indicators vary markedly between sub-populations of Queenslanders, notably between Aboriginal and Torres Strait Islander (Indigenous) people and other Queenslanders and between those in socioeconomically disadvantaged and advantaged areas.
Key trends ❚
Data sources ❚
Definitions ❚
3
c h a p t e ro n e

Report of the Chief Health Officer Queensland
4
Prevention of Chronic Disease
b. Infant mortality
In 2007, about one person in eight was •aged 65 years and older, in 2056 this will be about one in four.The number of people 65 years and older •is projected to increase four fold (from 0.5 million to 1.9 million) over the next 50 years.In 2007, 11% of all people aged 65 years •and older were at least 85 years; in 2056, 26% will be in this age group.Over the past 10 years (1997-2006) life •expectancy in Queensland has increased from 75.4 to 78.5 years for males and from 81.3 to 83.4 years for females.38% of Queensland males live to 85 years •and 55% of females live to this age.
Since 1998 the infant mortality rate in •Queensland has decreased by 1.3% per year (not significant decrease).The Queensland Indigenous infant •mortality rate in 2006 is 2.2 times the non-Indigenous rate.The Queensland Indigenous rate has •decreased by 1.3% per year since 1998 and the non-Indigenous rate by 1.2%, although neither were significant reductions.The Australian and Queensland infant •mortality rates are the same as in Japan 20 years ago (1987). Japan has the lowest infant mortality rate in the OECD.
Rates of death for coronary heart disease •have been steadily declining since the 1960s, with 29% reduction between 2000 and 2006.Male rates of death have declined more •rapidly but are still about 60% higher than female rates.Reduction in cardiovascular disease is the •major cause of improved life expectancy in Australia and Queensland.The reduction in cardiovascular disease •is due to reduced high blood cholesterol, high blood pressure and smoking, and improved treatments.
c. Coronary heart disease deaths
Figure 2: Selected key indicators, Queensland
a. Ageing
Key trends ❚
400
350
300
250
200
150
100
50
0
Rate
(per
100
,000
per
sons
)
1986
1988
1990
1992
1994
1996
1998
2000
2002
2004
2006
Male trendlineFemale trendline
Males observed rateFemales observed rate
1960 1965 1970 1975 1980 1985 1990 1995 2000 2005
Infa
nt m
orta
lity
rate
35
30
25
20
15
10
5
0
AustraliaJapanQld IndigenousQld non indigenous
3,000,000
2,500,000
2,000,000
1,500,000
1,000,000
500,000
0
2004
2009
2014
2019
2024
2029
2034
2039
2044
2049
2054
30
25
20
15
10
5
0
Proportion aged 65+year, of total population
Num
ber o
f per
sons
age
d 65
+ Number Proportion

Report of the Chief Health Officer Queensland Prevention of Chronic Disease
5
1
d. Female breast cancer
140
120
100
80
60
40
20
0
Rate
(per
100
,000
per
sons
)
1984 1987 1990 1993 1996 1999 2002 2005
Incidence Mortality
e. Tobacco smoking and alcohol consumption trends
Perc
enta
ge o
f pop
ulat
ion
14+
year
s 40
30
20
10
01991 1993 1995 1998 2001 2004 2007
Smoke dailyAlcohol harm-short termAlcohol harm-long term
f. Adult overweight and obesity – self report
2001
2004
2005
2006
2008
2001
2004
2005
2006
2008
Male Female
Perc
enta
ge o
f pop
ulat
ion
Overweight and obeseOverweightObese
70
60
50
40
30
20
10
0
Since 2001, breast cancer death rates have •declined by 3.8% per year, a total of 23%. Incidence rates (new cases diagnosed) are •also declining.Five year survival rates for breast cancer are •high: more than 85% of women survive to 5 years.Lifetime risk of breast cancer was one in •eleven in Queensland in 2005.There were 491 deaths from breast cancer •in 2005 - 84.3% were aged 50 years and older.There were 2404 new cases of breast cancer •diagnosed in Queensland in 2005 - 73.5% were aged 50 years and older.
Smoking rates are declining with a 13% •decrease between 2004 and 2007 in Queensland, about 87,000 fewer smokers in 2007, taking into account population growth.One in 6 people aged 14 years and older •smoke daily.One in 10 people aged 14 years and older •drink alcohol at risky/high risk levels for long term harm. One in three people aged 14 years and •older are drinking at risky/high risk levels for short term harm.No change in risky/high risk alcohol •consumption (for short term or long term harm) between 2001 and 2007.
63% of adult males and 51% of females in •Queensland were measured as overweight or obese in 2006.21% of 5-17 year olds were measured as •overweight or obese in Queensland in 2006.62% of adult males and 47% of adult •females in Queensland in 2008 self reported being overweight or obese.Prevalence of self reported obesity •increased significantly by 45% between 2001 and 2008 (57% increase for males and 35% for females).Prevalence of overweight did not change •significantly in this period.Rates of overweight and obesity in •Queensland are similar to Australia.

Report of the Chief Health Officer Queensland
6
Prevention of Chronic Disease
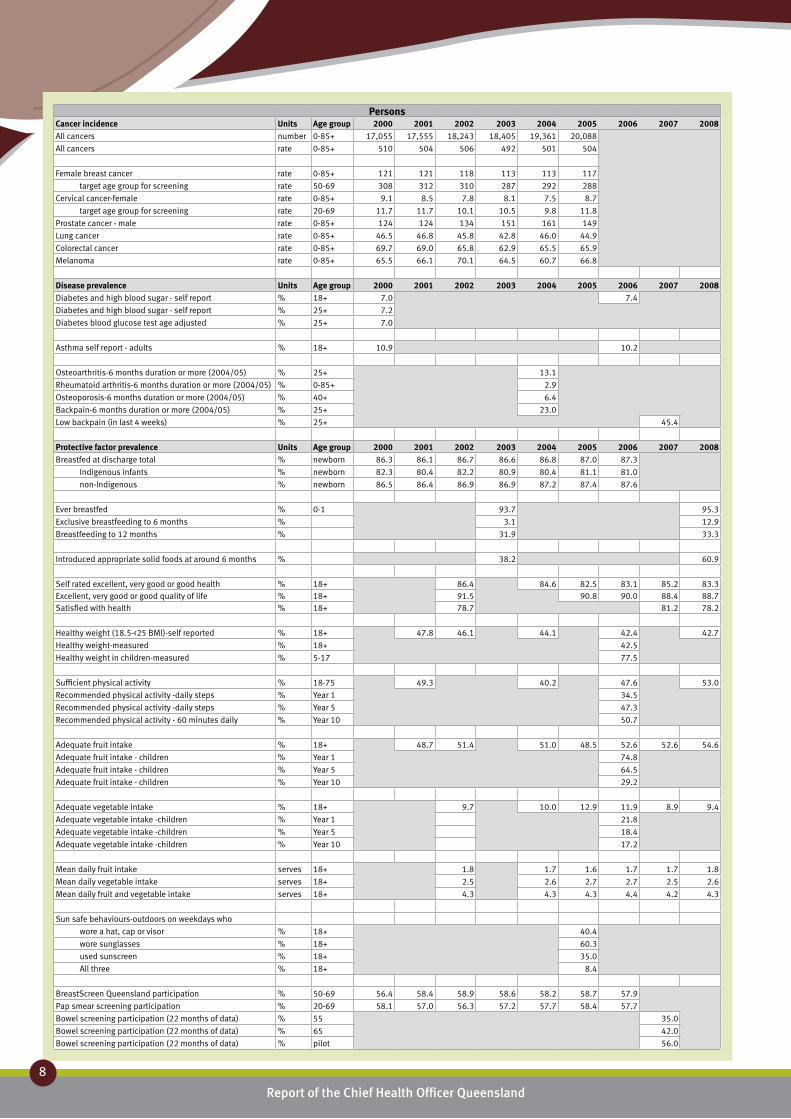
Trends in 65 population health indicators between 2000 and the most recently available data are reported in Table 1. All available data including most recent data for each indicator are reported: grey cells indicate where data is not available to date. Indicators are defined in the Definitions section on page 10 or in the
relevant section of the report. Data on these indicators is generally reported for all people. This information is available for males and females on the website: http://www.health.qld.gov.au/cho_report. Confidence intervals for all measures are also available on the website.
Table 1: Population health indicators Queensland 2000-2008
PersonsPopulation Units Age group 2000 2001 2002 2003 2004 2005 2006 2007 2008Total population (estimated resident) ‘000 0-85+ 3561.5 3628.9 3714.8 3809.2 3900.9 3994.9 4090.9 4181.4
Queensland - proportion of Australia % 0-85+ 18.6 18.8 19.0 19.2 19.4 19.6 19.7 19.9
Queensland - Brisbane % 0-85+ 45.5 45.5 45.6 45.7 45.7 45.7 44.5 44.6
Queensland - outside Brisbane % 0-85+ 54.5 54.5 54.4 54.3 54.3 54.3 55.5 55.6
Births ‘000 49.3 49.7 49.2 50.4 50.9 55.3 56.7
Children ‘000 0-14 762.2 772.6 783.9 796.5 808.3 821.3 834.7 844.9
Young people ‘000 15-24 502.5 510.0 521.3 534.3 548.4 563.6 578.6 592.8
Adults ‘000 25-64 1887.3 1924.1 1973.4 2028.2 2079.6 2130.5 2183.2 2232.2
Older people ‘000 65+ 409.6 422.2 436.2 450.2 464.6 479.5 494.4 511.5
Infants ‘000 0-<1 47.9 49.4 48.6 48.6 50.2 52.7 55.2 54.8
Young children ‘000 1-4 196.8 198.3 201.1 204.0 206.0 209.1 213.3 219.0
Children ‘000 5-14 517.4 524.9 534.2 544.0 552.2 559.5 566.3 571.2
Young people ‘000 15-24 502.5 510.0 521.3 534.3 548.4 563.6 578.6 592.8
Younger adults ‘000 25-44 1074.5 1080.5 1096.7 1115.0 1131.9 1149.6 1169.2 1188.3
Adults ‘000 45-64 812.7 843.6 876.7 913.2 947.7 980.9 1014.0 1043.9
Older people ‘000 65-74 227.4 231.5 238.1 244.5 251.9 259.7 267.5 278.3
Elderly ‘000 75+ 182.2 190.7 198.1 205.7 212.7 219.8 226.9 233.2
Children % 0-14 21.4 21.3 21.1 20.9 20.7 20.6 20.4 20.2
Young people % 15-24 14.1 14.1 14.0 14.0 14.1 14.1 14.1 14.2
Adults % 25-64 53.0 53.0 53.1 53.2 53.3 53.3 53.4 53.4
Older people % 65+ 11.5 11.6 11.7 11.8 11.9 12.0 12.1 12.2
Headline indicators Units Age group 2000 2001 2002 2003 2004 2005 2006 2007 2008Life expectancy
males years at birth 76.4 76.9 77.2 77.6 77.8 78.3 78.5
females years at birth 81.9 82.3 82.4 82.8 82.9 83.2 83.4
Indigenous life expectancy
males years at birth 58.9
females years at birth 62.6
Health adjusted life expectancy
persons years at birth 72.8
males years at birth 70.5
females years at birth 75.3
Non-Indigenous persons years at birth 73.1
Indigenous persons years at birth 60.0
Infant mortality rate rate 5.9 5.8 5.7 4.6 5.2 4.8 4.9
Non-Indigenous rate 5.8 5.5 5.3 4.4 4.9 4.7 4.9
Indigenous rate 10.7 11.3 12.2 10.0 10.7 12.2 10.8
Perinatal mortality rate rate 11.0 11.3 10.3 9.6 10.7 10.1 10.8
Health inequality - Avoidable deaths
Disadvantaged/Advantaged rate ratio 0-74 1.51 1.39 1.59 1.59 1.60 1.60 1.73
Burden of disease per head rate 0-85+ 132.4 118.3
Burden of disease
due to premature mortality % 0-85+ 46.9 45.4
due to disability % 0-85+ 53.1 54.6
Median age at death-total years 78 78 79 79 79 79 79
Indigenous years 55
Non-Indigenous years 79

Report of the Chief Health Officer Queensland Prevention of Chronic Disease
7
1Persons
Causes of death Units Age group 2000 2001 2002 2003 2004 2005 2006 2007 2008Deaths due to all causes number 0-85+ 22,315 22,749 23,876 23,389 24,433 23,508 24,120
Premature deaths - all causes number 0-74 9,331 9,641 9,507 9,363 9,598 9,193 9,327
Premature deaths - % of all causes % 0-74 41.8 42.4 39.8 40.0 39.3 39.1 38.7
Non-avoidable deaths number 0-74 2,551 2,647 2,809 2,828 3,092 2,862 3,295
Non-avoidable deaths % 0-74 27.3 27.5 29.5 30.2 32.2 31.1 35.3
Avoidable deaths number 0-74 6,780 6,994 6,698 6,535 6,506 6,331 6,032
Avoidable deaths % 0-74 72.7 72.5 70.5 69.8 67.8 68.9 64.7
Preventable number 0-74 4,054 4,116 4,065 3,872 3,871 3,788 3,612
Preventable % 0-74 43.4 42.7 42.8 41.4 40.3 41.2 38.7
Health care amenable number 0-74 2,726 2,878 2,633 2,663 2,635 2,544 2,420
Health care amenable % 0-74 29.2 29.9 27.7 28.4 27.5 27.7 25.9
Premature death rate rate 0-74 289 289 278 265 265 246 241
Non-avoidable deaths rate 0-74 79 79 82 80 85 77 85
Avoidable deaths rate 0-74 210 210 196 185 179 169 156
Preventable rate 0-74 125 123 119 110 107 101 93
Health care amenable rate 0-74 85 87 77 75 73 68 63
All causes rate 0-85+ 688 668 677 638 643 597 591
Coronary heart disease rate 0-85+ 156 149 144 132 129 115 110
Stroke rate 0-85+ 68.4 65.5 66.1 62.4 60.7 55.3 54.5
Heart failure rate 0-85+ 10.4 11.5 9.7 8.1 8.4 7.2 7.1
All cancers rate 0-85+ 189 186 187 180 181 174 168
Female breast cancer rate 0-85+ 22.5 25.6 23.3 23.4 22.2 23.1 19.7
target age group for screening rate 50-69 48.2 50.6 50.2 52.2 49.2 53.1 45.6
Female cervical cancer rate 0-85+ 3.4 2.8 2.3 2.1 2.1 1.9 2.5
target age group for screening rate 20-69 3.9 2.8 2.0 1.6 2.3 2.4 2.7
Male prostate cancer rate 0-85+ 16.0 15.1 14.6 15.4 14.9 14.2 14.0
Lung cancer rate 0-85+ 37.7 36.6 39.2 34.8 36.5 35.5 34.8
Colorectal cancer rate 0-85+ 25.3 24.9 24.1 21.8 20.0 20.0 16.8
Melanoma rate 0-85+ 6.3 6.3 5.4 7.2 7.4 6.9 6.3
Diabetes rate 0-85+ 17.0 15.0 15.4 15.3 16.2 16.0 16.1
Suicide rate 0-85+ 15.1 13.8 14.5 12.3 11.7 11.6 8.0
Suicide - young people rate 15-24 15.5 16.3 16.1 11.9 9.7 11.8 7.9
Asthma rate 0-85+ 2.2 2.3 1.9 1.6 1.1 1.6 1.5
Asthma - children and younger people rate 5-34 0.5 0.6 0.4 0.5 0.4 0.4 0.2
COPD rate 0-85+ 25.8 23.2 26.1 23.2 22.7 20.1 18.3
COPD - older people rate 65+ 183 169 190 167 163 148 131
Road transport deaths rate 0-85+ 8.4 9.4 8.7 8.1 8.2 7.1 7.5
Road transport deaths - young people rate 15-24 13.9 18.2 20.2 15.7 16.9 11.8 14.9
Drowning - preschool children rate 0-4 7.9 4 3.2 2.8 3.6 3.9 6.7
Sudden Infant Death Syndrome rate 0-1 0.76 0.59 0.43 0.30 0.34 0.44 0.16
Sudden Infant Death Syndrome number 0-1 37 29 21 15 17 24 9
Deaths due to risky alcohol consumption rate 0-85+ 17.8 19.8 18.3 18.5 17.8 17.3 17.5
Deaths due to smoking rate 0-85+ 105 101 103 94.5 95.6 88.7 84.9
Deaths due to illicit drugs rate 0-85+ 2.8 1.8 1.8 1.7 2.0 1.9 1.0
Deaths due to physical inactivity rate 0-85+ 12.0 11.6 10.7 9.7 9.4 8.4 7.8
Hospitalisations Units Age group 2000 2001 2002 2003 2004 2005 2006 2007 2008All causes number 0-85+ 1,177,055 1,246,893 1,261,573 1,317,365 1,366,866 1,417,073 1,480,716
All causes rate 0-85+ 34,040 35,050 34,529 35,023 35,412 35,759 36,163
Chronic conditions number 0-85+ 669,432 705,973 700,230 723,220 738,089 758,192 783,961
Chronic conditions rate 0-85+ 19,479 19,900 19,189 19,220 19,090 19,080 19,090
Potentially avoidable hospitalisations
Ambulatory Care Sensitive Conditions number 0-85+ 107,339 110,718 111,188 118,597 123,120 125,988 131,871
Ambulatory Care Sensitive Conditions % 0-85+ 9.1 8.9 8.8 9.0 9.0 8.9 8.9
Ambulatory Care Sensitive Conditions rate 0-85+ 3,137 3,132 3,064 3,175 3,207 3,192 3,234
Coronary heart disease rate 0-85+ 916 902 864 854 834 781 789
Stroke rate 0-85+ 286 272 254 252 245 246 244
Diabetes rate 0-85+ 212 243 249 267 324 344 368
COPD rate 0-85+ 271 272 264 261 261 250 239
COPD - older people rate 65+ 1,650 1,679 1,644 1,635 1,610 1,559 1,492
Asthma rate 0-85+ 236 182 171 179 173 162 139
Asthma - children rate 0-14 574 394 402 445 452 411 349
Falls rate 0-85+ 901 878 840 860 893 906 937
Falls - older people rate 65+ 3,667 3,640 3,556 3,724 3,827 3,916 4,145
Hospitalisations for risky alcohol consumption rate 0-85+ 603 616 594 602 613 629 633
Hospitalisations for smoking rate 0-85+ 927 917 881 871 872 845 837
Hospitalisations for physical inactivity rate 0-85+ 31.1 31.3 30.4 29.8 30.3 29.4 29.9
Hospitalisations for illicit drugs rate 0-85+ 126 113 101 105 107 99 99
PersonsCancer incidence Units Age group 2000 2001 2002 2003 2004 2005 2006 2007 2008All cancers number 0-85+ 17,055 17,555 18,243 18,405 19,361 20,088
All cancers rate 0-85+ 510 504 506 492 501 504
Female breast cancer rate 0-85+ 121 121 118 113 113 117
target age group for screening rate 50-69 308 312 310 287 292 288
Cervical cancer-female rate 0-85+ 9.1 8.5 7.8 8.1 7.5 8.7
target age group for screening rate 20-69 11.7 11.7 10.1 10.5 9.8 11.8
Prostate cancer - male rate 0-85+ 124 124 134 151 161 149
Lung cancer rate 0-85+ 46.5 46.8 45.8 42.8 46.0 44.9
Colorectal cancer rate 0-85+ 69.7 69.0 65.8 62.9 65.5 65.9
Melanoma rate 0-85+ 65.5 66.1 70.1 64.5 60.7 66.8
Disease prevalence Units Age group 2000 2001 2002 2003 2004 2005 2006 2007 2008Diabetes and high blood sugar - self report % 18+ 7.0 7.4
Diabetes and high blood sugar - self report % 25+ 7.2
Diabetes blood glucose test age adjusted % 25+ 7.0
Asthma self report - adults % 18+ 10.9 10.2
Osteoarthritis-6 months duration or more (2004/05) % 25+ 13.1
Rheumatoid arthritis-6 months duration or more (2004/05) % 0-85+ 2.9
Osteoporosis-6 months duration or more (2004/05) % 40+ 6.4
Backpain-6 months duration or more (2004/05) % 25+ 23.0
Low backpain (in last 4 weeks) % 25+ 45.4
Protective factor prevalence Units Age group 2000 2001 2002 2003 2004 2005 2006 2007 2008Breastfed at discharge total % newborn 86.3 86.1 86.7 86.6 86.8 87.0 87.3
Indigenous infants % newborn 82.3 80.4 82.2 80.9 80.4 81.1 81.0
non-Indigenous % newborn 86.5 86.4 86.9 86.9 87.2 87.4 87.6
Ever breastfed % 0-1 93.7 95.3
Exclusive breastfeeding to 6 months % 3.1 12.9
Breastfeeding to 12 months % 31.9 33.3
Introduced appropriate solid foods at around 6 months % 38.2 60.9
Self rated excellent, very good or good health % 18+ 86.4 84.6 82.5 83.1 85.2 83.3Excellent, very good or good quality of life % 18+ 91.5 90.8 90.0 88.4 88.7Satisfied with health % 18+ 78.7 81.2 78.2
Healthy weight (18.5-<25 BMI)-self reported % 18+ 47.8 46.1 44.1 42.4 42.7
Healthy weight-measured % 18+ 42.5
Healthy weight in children-measured % 5-17 77.5
Sufficient physical activity % 18-75 49.3 40.2 47.6 53.0
Recommended physical activity -daily steps % Year 1 34.5
Recommended physical activity -daily steps % Year 5 47.3
Recommended physical activity - 60 minutes daily % Year 10 50.7
Adequate fruit intake % 18+ 48.7 51.4 51.0 48.5 52.6 52.6 54.6
Adequate fruit intake - children % Year 1 74.8
Adequate fruit intake - children % Year 5 64.5
Adequate fruit intake - children % Year 10 29.2
Adequate vegetable intake % 18+ 9.7 10.0 12.9 11.9 8.9 9.4
Adequate vegetable intake -children % Year 1 21.8
Adequate vegetable intake -children % Year 5 18.4
Adequate vegetable intake -children % Year 10 17.2
Mean daily fruit intake serves 18+ 1.8 1.7 1.6 1.7 1.7 1.8
Mean daily vegetable intake serves 18+ 2.5 2.6 2.7 2.7 2.5 2.6
Mean daily fruit and vegetable intake serves 18+ 4.3 4.3 4.3 4.4 4.2 4.3
Sun safe behaviours-outdoors on weekdays who
wore a hat, cap or visor % 18+ 40.4
wore sunglasses % 18+ 60.3
used sunscreen % 18+ 35.0
All three % 18+ 8.4
BreastScreen Queensland participation % 50-69 56.4 58.4 58.9 58.6 58.2 58.7 57.9
Pap smear screening participation % 20-69 58.1 57.0 56.3 57.2 57.7 58.4 57.7
Bowel screening participation (22 months of data) % 55 35.0
Bowel screening participation (22 months of data) % 65 42.0
Bowel screening participation (22 months of data) % pilot 56.0
Report of the Chief Health Officer Queensland
8

1Persons
Risk factor prevalence Units Age group 2000 2001 2002 2003 2004 2005 2006 2007 2008Low maternal age % <20 years 6.5 6.4 6.3 6.1 6.0 5.6 5.5
Pre-term births (less than 37 weeks) -total % 8.4 8.2 8.6 8.5 8.8 8.7 9.0
Low birth weight (less than 2,500 gms) - total % 5.4 5.2 5.3 5.3 5.4 5.4 5.3
Non-Indigenous % 5.0 4.9 5.0 4.9 5.1 5.0 5.0
Indigenous % 11.1 10.3 11.7 11.0 11.0 11.2 10.1
Less than 5 antenatal visits - total % 10.5 6.3 1.3 7.7 7.9 7.7 7.5
Non-Indigenous % 9.6 7.9 1.0 6.6 6.8 6.6 6.6
Indigenous % 25.7 25.5 25.7 25.2 27.0 27.4 24.8
Smoking during pregancy - total % 20.3
Non-Indigenous % 18.4
Indigenous % 53.2
Smoking after 20 weeks gestation - total % 19.0
Non-Indigenous % 17.2
Indigenous % 51.5
Self rated fair or poor health % 18+ 14.6 15.5 17.4 16.9 14.7 16.7
Psychological distress (High or very high) % 18+ 14.7 15.2
Smoke daily % 14+ 21.1 19.8 17.2
Smoke daily - adults % 18+ 20.6 17.9
Risky/high risk alcohol consumption-long term harm % 14+ 10.5 11.2 11.8
Risky/high risk alcohol consumption-short term harm % 14+ 36.0 38.2 37.2
Illicit drugs - used in last 12 months % 14+ 16.3 15.9 13.7
Underweight-self reported (<18.5 BMI) % 18+ 3.8 3.2 3.0 4.0 2.6
Overweight-self reported (BMI 25-<30) % 18+ 34.1 34.6 34.8 31.0 33.9
Obese-self reported (BMI 30-<40) % 18+ 12.9 14.6 16.3 17.5 18.9
Severely obese-self reported (BMI 40+) % 18+ 1.4 1.4 1.8 1.6 1.9
Overweight/obese self reported (25+ BMI) % 18+ 48.4 50.6 52.2 50.1 54.7
Obese-self reported (30+BMI) % 18+ 14.3 16.0 17.7 19.1 20.8
Underweight-measured % 18+ 1.9
Overweight and obese (25+ BMI)-measured % 18+ 56.8
Obese (30+BMI)-measured % 18+ 20.5
Overweight/obese (25+ BMI)-measured (age adjusted) % 25+ 58.9 62.0
Obese (30+BMI)-measured (age adjusted) % 25+ 21.9 23.1
Underweight-measured, children % 5-17 1.4
Overweight or obese-measured, children % 5-17 21.1
Inadequate fruit intake % 18+ 51.3 48.6 49.0 51.3 47.3 47.4 45.4
Inadequate vegetable intake % 18+ 90.3 90.0 87.0 87.9 91 90.6
Insufficient physical activity % 18-75 34.5 39.6 36.3 47.0
Insufficient physical activity -daily steps % 5-12 57.0
Insufficient physical activity - 60 minutes daily % 14-17 49.0
Exceeds recommendationed time-small screen activity % Year 1 17.0
Exceeds recommendationed time-small screen activity % Year 5 23.0
Exceeds recommendationed time-small screen activity % Year 10 33.0
High blood cholesterol-self reported % 18+ 29.1
High blood pressure- self reported % 18+ 26.3
Communicable disease notifications Units Age group 2000 2001 2002 2003 2004 2005 2006 2007 2008Acute Rheumatic Fever number 0-85+ 39 43 31 27 25 47 38 37
Chlamydia (Sexually Transmissable Infections) number 0-85+ 4,935 5,586 6,436 7,570 8,668 9,496 11,978 12,706
HIV number 0-85+ 96 97 118 114 137 148 143 166
Measles number 0-85+ 28 11 8 11 0 1 2 4
Q Fever number 0-85+ 393 444 354 222 160 157 169 172
Ross River Virus number 0-85+ 1,481 1,568 885 2,514 2,005 1,179 2,611 2,137
Salmonellosis (all) number 0-85+ 1,825 2,199 2,673 2,180 2,797 2,595 2,695 2,363
Tuberculosis number 0-85+ 102 128 121 125 112 118 131 125
Immunisation Units Age group 2000 2001 2002 2003 2004 2005 2006 2007 2008Childhood vaccination rates (June quarter) % 12-<15 mths 89.7 91.7 90.6 91.1 91.6 90.8 90.8 90.9
Childhood vaccination rates (June quarter) % 24-<27 mths 86.2 88.6 88.5 89.8 91.9 91.6 92.2 92.2
Childhood vaccination rates (June quarter) % 72-<75 mths N/A N/A 82.1 82.0 83.6 79.9 83.1 87.8
Prevention of Chronic Disease
9

Report of the Chief Health Officer Queensland
10
Data sources ❚Data sources for Key indicators in Table 1 are listed below. Data sources within this document are cited.
Population data was derived from Australian 1. Bureau of Statistics (ABS) publications.Headline indicator data:2. • LifeexpectancywasderivedfromABS
publications or from analysis using ABS Cause of death data
• Healthadjustedlifeexpectancyandburdenof disease data was generated by Queensland Health28 using ABS Cause of death and other relevant data sources
• DeathrelatedindicatorsderivedfromABScause of death.77
Cause of death: derived from ABS Cause of death.3. Hospitalisations: derived from Queensland 4. Hospital Admitted Patient Data Collection.Cancer incidence: derived from Queensland 5. Cancer Registry.Disease prevalence data:6. • DiabetesandasthmaderivedfromChronic
Disease Survey 2006, conducted by Queensland Health
• MusculoskeletaldataderivedfromNationalHealth Survey, and Queensland Health Omnibus survey.
Protective factor prevalence: derived from 7. Queensland Health Omnibus surveys, Perinatal Data Collection, Cancer screening: BreastScreen Queensland, Pap Smear Register and bowel screening database.Risk factor prevalence: derived from Queensland 8. Health Omnibus surveys, Healthy Kids Queensland Survey, National Drug Strategy Household Survey.Communicable disease notifications derived from 9. Queensland Health Notifiable Conditions System and vaccination data from Australian Childhood Immunisation Register (ACIR).
Definitions ❚Avoidable deaths: avoidable mortality comprises those causes of death that are potentially avoidable at the present time, given available knowledge about social and economic policy impacts and health behaviours.78 Ambulatory Care Sensitive Conditions (ACSC): a range of conditions for which hospitalisation should be avoided because the disease or condition has been prevented or could be prevented from occurring through timely access to effective primary care.79
Deaths: based on the year in which the death was registered. A death refers to any death which occurs in, or en route to Australia and is registered with a state or territory Registry of Births, Deaths or Marriages.80 Rates are per 100,000 estimated resident population.Hospitalisations: the total number of separations in all hospitals (public and private) providing acute care services. A separation is an episode of care which can be a total hospital stay (from admission to discharge, transfer or death) or a portion of a hospital stay ending in a change of status (for example from acute care to rehabilitation).81 Rates are per 100,000 estimated resident population.Infant mortality rate: the number of deaths of children under one year of age in one calendar year per 1,000 live births in the same calendar year.80 Life expectancy: refers to the average number of additional years a person of a given age and sex might expect to live if the age specific death rates of the given period continue throughout his / her life time. Life expectancies are calculated from life tables which are statistical models of levels of mortality in a population of different ages.80
Neonatal deaths: deaths of any child weighing at least 400 grams at delivery (or, when birth weight is unavailable, of at least 20 weeks gestation) who was born alive and who died within 28 days of birth.77 Perinatal mortality rate: the annual number of foetal and neonatal deaths per 1,000 live births and foetal deaths combined (where birth weight was at least 400 grams).77 Potentially avoidable hospitalisations: a range of conditions for which hospitalisation could potentially be avoided because the disease or condition is preventable by interventions either in primary prevention, ambulatory care or injury prevention.82
Psychological distress: derived from the Kessler 10 Scale (K10). This is a scale of non-specific psychological distress based on 10 questions about negative emotional states in the four weeks prior to interview.83 Standardised rates: these enable the comparison of rates between populations with differing age structures by relating them to a standard population. These rates are the overall rates that would have prevailed in the standard population if it had experienced at each age the rates of the population being studied. The standard population used is the estimated resident population for Australia (persons) at 30 June 2001. All rates for deaths, hospitalisations, cancer incidence and burden of disease are age standardised. Disease prevalence and risk and protective factor prevalence are not age standardised.
88% of premature deaths and disability is caused by chronic disease•
74% of premature deaths due to chronic disease are avoidable •
(5708 deaths in 2006 or 110 deaths each week)
More than 2.9 million Queenslanders live with a long term chronic condition• 15
Report of the Chief Health Officer Queensland
Chronic disease
The health of a people is really the foundation upon which all their happiness and all their powers as a state depend – Benjamin Disraeli, Prime Minister of the United Kingdom 1874-1880
Chronic diseases are a major burden in Queensland, Australia and globally placing a great load on individuals, communities, the health sector and government. The dominance of chronic disease in Queensland is a relatively recent phenomenon but one that looks likely to keep increasing. This increase will reduce the quality of life of Queenslanders and place increased stress on the state’s health system.
Chronic diseases caused 88% of the health problems and early deaths in Queensland in 2006, with an excess of this borne by the disadvantaged in our communities.84 The chronic diseases of cancer, cardiovascular disease, nervous system disorders, mental disorders, diabetes, chronic respiratory conditions, musculoskeletal conditions and oral health caused 80% of the health problems and early deaths in Queensland. In Australia in 2001, treatment of these chronic diseases accounted for $30 billion in health care, or 60% of allocated health expenditure.85 More than 2.9 million Queenslanders live with a long-term chronic condition.15 If the life expectancy of the average Queenslander is adjusted for loss of healthy life, a total of eight years are lost (from 80.8 years to 72.8).28 Chronic diseases were the cause of seven of these eight lost years.
Cancer ❚
Cardiovascular disease ❚
Diabetes ❚In th
is c
hapt
er: Anxiety and depression ❚
Respiratory conditions ❚
Other preventable chronic diseases ❚
This chapter describes the situation for chronic disease in Queensland with a specific focus on the most prevalent and preventable chronic diseases; cancer, cardiovascular diseases, diabetes, anxiety and depression, respiratory diseases, renal disease and musculoskeletal conditions. The impact of each disease on Health Adjusted Life Expectancy (HALE) is discussed throughout. Further information on HALE for each Health Service District of Queensland is provided elsewhere.28
Chronic diseases are complex and varied in nature which makes them very difficult to define. However, as a group they can be described as non-communicable diseases that have complex causes, multiple and often common risk factors, a long latency period and a long illness period which ultimately results in some limitation of daily living.86 Chronic diseases vary considerably in terms of their nature, their cause, and the extent of their impact on individuals and communities. Whereas some chronic disease may contribute to premature death, others contribute more to ill health. Some may last indefinitely, whereas others may resolve over time. However chronic diseases are generally never cured completely.
The dominance of chronic disease in Queensland is a relatively recent phenomenon. Last century there were great increases in life expectancy due to declines in mortality: particularly infant and maternal mortality, and mortality due to infectious diseases in childhood and early adulthood. These improvements in health were largely brought about by factors such as access to better housing and sanitation, a trend towards smaller families, an increase in incomes, and public health measures
c h a p t e rt w o
Prevention of Chronic Disease
11
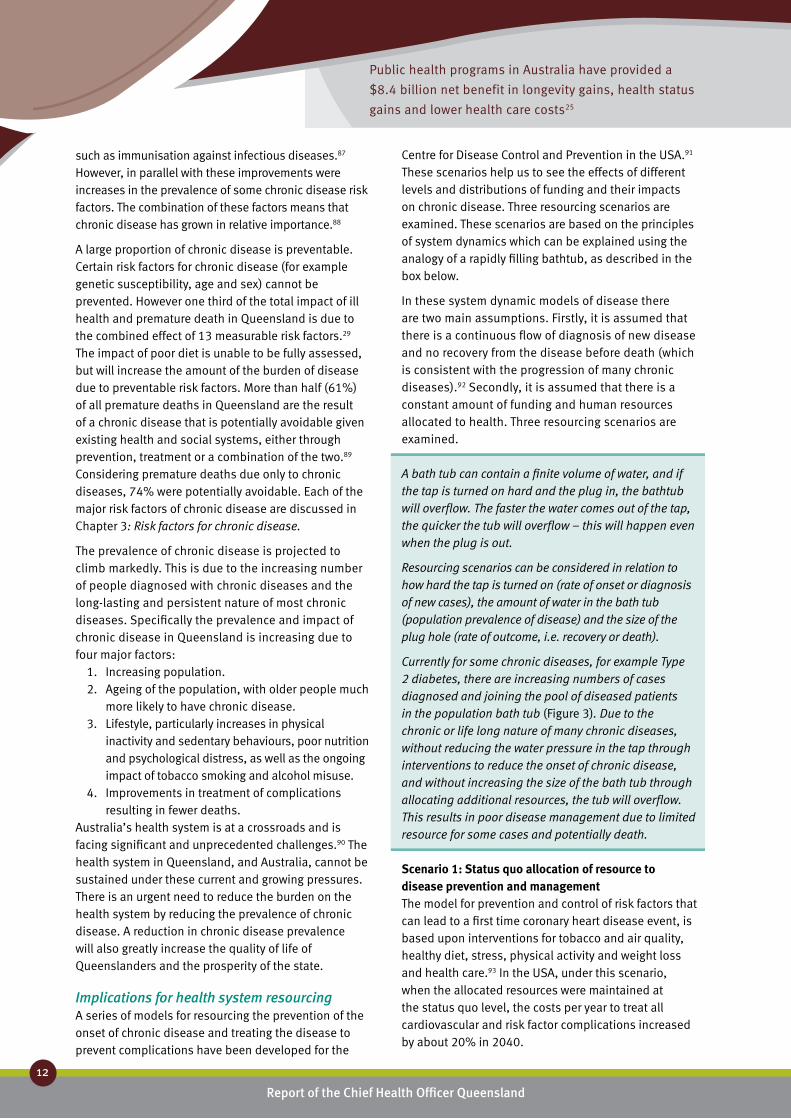
Public health programs in Australia have provided a
$8.4 billion net benefit in longevity gains, health status
gains and lower health care costs25
Report of the Chief Health Officer Queensland
12
Prevention of Chronic Disease
such as immunisation against infectious diseases.87 However, in parallel with these improvements were increases in the prevalence of some chronic disease risk factors. The combination of these factors means that chronic disease has grown in relative importance.88
A large proportion of chronic disease is preventable. Certain risk factors for chronic disease (for example genetic susceptibility, age and sex) cannot be prevented. However one third of the total impact of ill health and premature death in Queensland is due to the combined effect of 13 measurable risk factors.29 The impact of poor diet is unable to be fully assessed, but will increase the amount of the burden of disease due to preventable risk factors. More than half (61%) of all premature deaths in Queensland are the result of a chronic disease that is potentially avoidable given existing health and social systems, either through prevention, treatment or a combination of the two.89 Considering premature deaths due only to chronic diseases, 74% were potentially avoidable. Each of the major risk factors of chronic disease are discussed in Chapter 3: Risk factors for chronic disease.
The prevalence of chronic disease is projected to climb markedly. This is due to the increasing number of people diagnosed with chronic diseases and the long-lasting and persistent nature of most chronic diseases. Specifically the prevalence and impact of chronic disease in Queensland is increasing due to four major factors:
1. Increasing population.2. Ageing of the population, with older people much
more likely to have chronic disease.3. Lifestyle, particularly increases in physical
inactivity and sedentary behaviours, poor nutrition and psychological distress, as well as the ongoing impact of tobacco smoking and alcohol misuse.
4. Improvements in treatment of complications resulting in fewer deaths.
Australia’s health system is at a crossroads and is facing significant and unprecedented challenges.90 The health system in Queensland, and Australia, cannot be sustained under these current and growing pressures. There is an urgent need to reduce the burden on the health system by reducing the prevalence of chronic disease. A reduction in chronic disease prevalence will also greatly increase the quality of life of Queenslanders and the prosperity of the state.
Implications for health system resourcingA series of models for resourcing the prevention of the onset of chronic disease and treating the disease to prevent complications have been developed for the
Centre for Disease Control and Prevention in the USA.91 These scenarios help us to see the effects of different levels and distributions of funding and their impacts on chronic disease. Three resourcing scenarios are examined. These scenarios are based on the principles of system dynamics which can be explained using the analogy of a rapidly filling bathtub, as described in the box below.
In these system dynamic models of disease there are two main assumptions. Firstly, it is assumed that there is a continuous flow of diagnosis of new disease and no recovery from the disease before death (which is consistent with the progression of many chronic diseases).92 Secondly, it is assumed that there is a constant amount of funding and human resources allocated to health. Three resourcing scenarios are examined.
A bath tub can contain a finite volume of water, and if the tap is turned on hard and the plug in, the bathtub will overflow. The faster the water comes out of the tap, the quicker the tub will overflow – this will happen even when the plug is out.
Resourcing scenarios can be considered in relation to how hard the tap is turned on (rate of onset or diagnosis of new cases), the amount of water in the bath tub (population prevalence of disease) and the size of the plug hole (rate of outcome, i.e. recovery or death).
Currently for some chronic diseases, for example Type 2 diabetes, there are increasing numbers of cases diagnosed and joining the pool of diseased patients in the population bath tub (Figure 3). Due to the chronic or life long nature of many chronic diseases, without reducing the water pressure in the tap through interventions to reduce the onset of chronic disease, and without increasing the size of the bath tub through allocating additional resources, the tub will overflow. This results in poor disease management due to limited resource for some cases and potentially death.
Scenario 1: Status quo allocation of resource to disease prevention and managementThe model for prevention and control of risk factors that can lead to a first time coronary heart disease event, is based upon interventions for tobacco and air quality, healthy diet, stress, physical activity and weight loss and health care.93 In the USA, under this scenario, when the allocated resources were maintained at the status quo level, the costs per year to treat all cardiovascular and risk factor complications increased by about 20% in 2040.

Report of the Chief Health Officer Queensland Prevention of Chronic Disease
13
2
Scenario 2: A stable amount of resource with additional proportion allocated to disease management
If the amount of resource (human and financial) is kept stable but a greater proportion of the resource is directed towards disease management, then there is less resource available for disease prevention. While this means there are fewer deaths initially, it also means that the prevalence of the disease actually increases because its onset is not being addressed. This higher prevalence of disease then spirals into an ever increasing need for disease management. If there is no additional resource in the health system, then some diseased patients will be unable to have their disease managed, complications will increase and the number of deaths will increase.
Scenario 3: A single permanent increase in resource allocation to disease preventionIf there is a single permanent increase in resource allocation to prevent disease, initially some disease
is prevented and the disease prevalence declines. This frees up resources from disease management to undertake additional disease prevention. As the prevalence of the disease declines, it is possible to establish a cycle which facilitates a long-term decline in both disease prevalence and deaths from complications.
In the USA under this scenario, implementation of all interventions began in 1995 and were ramped up to be fully effective by 1997. Implementation will continue unabated through to 2040. As a result, the costs per year to treat all cardiovascular and risk factor complications are reduced by about 15% from 1995 levels. That is, the implementation of this alternative scenario to the status quo, using a multi-strategy approach to prevention and control of cardiovascular disease risk factors, is projected to reduce costs associated with treatment of disease and its risk factors by about one third in 2040.
Funding is an essential input to enable effective delivery of health services. It is a key driver in the
Figure 3: Diagrammatic representation of system dynamic modelling of chronic disease
Current situation Potential future with status quo distribution of resources to prevention and treatment
development of a sustainable health system over the longer term. In 2005/06, funding allocated to the Prevention, Promotion and Protection Program accounted for 4.0% of the total Queensland Health expenditure.94 Achieving a balanced investment across the health continuum will involve attaining a better balance in funding allocation between the services aimed at preventing illness and those used to restore health and manage ill health. The application of these system dynamic model scenarios to the development of balanced investment between preserving health and treating ill health in
Queensland, and in Australia, requires consideration if we are to reduce the burden on the health care system and increase the health of all Queenslanders.
Chapter 5: Prevention works describes some of the current successes in Queensland in reducing risk factors for chronic disease. However, this raises a number of challenges, which are discussed in Chapter 6: Challenges and opportunities.
onsetonset
recovery/deaths
prevalenceprevalence
recovery/deaths
onsetonset
recovery/deaths
prevalenceprevalence
recovery/deaths

Preventable risk factors cause one third of the
premature death and ill health due to cancer29
Report of the Chief Health Officer Queensland
14
Prevention of Chronic Disease
Cancer ❚Cancer is not just one disease, but a diverse group of diseases. Cancer is a disease of the cells which are the body’s basic building blocks. Cancer starts in our genes. Although there are many types of cancer, they all start because abnormal cells grow out of control. Cancers were the leading cause of the burden of disease and injury in Queensland in 2006, causing 18.9% of the total burden of premature death and disability. Lung, colorectal, breast and prostate cancers caused half the cancer burden (49.2%).
What causes it?In Queensland in 2003, one third of the burden of disease caused by cancer was due to eleven measurable and preventable risk factors.29 One fifth of the burden was due to tobacco smoking. Physical inactivity and overweight and obesity also contribute significantly to the burden of cancer.
Most cancers have a unique set of risk factors that are responsible for their onset, although a number do share known or suspected risk factors. Some cancers occur as a direct result of smoking, dietary influences, infectious agents or exposure to ultraviolet radiation from sunlight, while others may be a result of inherited genetic abnormalities. But it should be noted that for many cancers the population level causes are unknown. For example, the cause of most breast cancer in the population is unknown. Furthermore it is virtually impossible to link an individual case of cancer to an individual causative exposure.
Tobacco smoking caused about 80% of the burden of disease due to lung cancer in 2003.29 Almost all cervical cancer can be attributed to infection with human papillomavirus (HPV).95 Exposure to ultraviolet radiation from the sun has been clearly identified as the most important risk factor for skin cancer.96 In Queensland, there are a number of factors which contribute to skin cancer including very high levels of ambient ultraviolet radiation, an outdoor lifestyle and a predominantly fair-skinned population.97, 98 In addition, in 2005 1.5% of Queensland adults visited a solarium over the 12 month period, doubling to 3.7% of those aged 18-24 years. Solariums produce concentrated ultraviolet radiation.
Inadequate intake of fruit and vegetables, inadequate physical activity and overweight and obesity caused
more than 6000 cancer deaths in Australia each year.99 In Queensland insufficient fruit and vegetable consumption caused 1.7% of the burden of cancer in 2003.29 International evidence suggests a link between specific foodstuffs and macronutrients and specific cancers.100 For example, the evidence that red meats and processed meats are a cause of colorectal cancer is convincing. Additionally some types of vegetables (non-starchy) and fruits in general probably protect against a number of cancers including stomach and oesophageal cancers.
What can be done to prevent it?International evidence suggests that it is possible to prevent at least one third of cancer cases by means of controlling tobacco and alcohol use, and moderating diet.101 In addition, early detection through population screening and effective treatment can reduce the impact of a further third of cancer.101
Primary prevention is the main focus for cancers with known modifiable risk factors. The risk factors most amenable to primary prevention are smoking, poor nutrition, physical inactivity, alcohol misuse and exposure to ultraviolet radiation. In 2008, the risk of death from cancer was 3.3 times higher in women with poor lifestyle factors (that is, were smokers, were overweight, inactive, had high alcohol intake and had poor diet) in contrast with those who did not.50 Similar findings could also apply to males.
The currently available human papillomavirus (HPV) vaccine could prevent around 70% of cervical cancers in Australia. HPV vaccination in girls in Year 8 was introduced in Queensland in 2008 via a school based program. A catch up program for older high school students and women aged up to 26 years began in 2007 and will continue until the end of June 2009. In the 2007 school vaccination program, 74% of students in Years 10, 11 and 12 received their first dose, 69% received dose 2 and 62% dose 3. Some students completed their course of vaccinations through their GP or other immunisation provider, so the overall numbers vaccinated will be higher.
Significant gains can be made in reducing the incidence of skin cancers through increases in modifiable sun safety behaviours, as well as provision of sun safe environments. In 2005, 51% of adult men and 28% of women wore a hat, cap or visor if they spent more than 15 minutes outdoors between 10am and 3pm on a weekday. In this same period, 58% of men and 63% of women wore sunglasses, while only 22% of men and 49% of women wore sunscreen. Being

1 in 3 men and 1 in 4 women will be diagnosed with cancer in
their lifetime – and one in 11 women with breast cancer14
Report of the Chief Health Officer Queensland Prevention of Chronic Disease
15
2
sun safe is a result of multiple behaviours – yet only 8% of men and 9% of women undertook these three core behaviours at the time of day when the risk of skin cancer is highest.
Early detection plays an important role in cancer control and prevention. Population based screening is efficacious for breast cancer in detecting small cancers and for cervical and bowel cancer in detecting precancerous changes. Death from breast cancer can be reduced by 25-30% if 70% of women aged 50-69 are screened every two years.22 In 2005-06, 57.9% of Queensland women in the target age group (50-69 years) were screened for breast cancer by BreastScreen Queensland.102 Cervical cancer is widely recognised as one of the most preventable cancers. Approximately 90% of the most common form of cervical cancer can be prevented if all women had regular Pap smears every two years.61,103 In 2006-07, 59.2% of Queensland women in the target age group of 20-69 years had had a Pap smear in the preceding two years.104
The biology of colorectal cancer provides the opportunity for a variety of approaches to primary prevention and early detection.105 The Faecal Occult Blood Test (FOBT) is a simple non-invasive process to detect small amounts of blood in the bowel motion, an early warning sign of bowel cancer.62 Having an FOBT every two years can reduce the risk of dying from bowel cancer by up to one third.62 Participation in the National Bowel Cancer Screening Program is undertaken in response to a direct mail invitation. Between August 2006 and May 2008, 35% of people aged 55 years and 42% of people aged 65 years participated in the program, with higher participation among participants of the pilot program conducted in 2002-2004 (56%).106 More information on cancer screening is provided in Chapter 4: Impacts of chronic disease - Adults.
Evidence does not support population screening for prostate cancer. The currently available tests do not meet the criteria established in the Australian Population Based Screening Framework that need to be satisfied before population screening can be introduced.109 The difficulty in the early detection of prostate cancer is that most cancers found through screening will not be life threatening. It has been estimated that prostate cancer is present in 30-40% of men aged over 50 years, but only one in four of these cancers will cause clinical symptoms and one in 14 will cause death.110 Over diagnosis, estimated to be as high as 50%, can result in over treatment resulting in high risks of urinary incontinence, bowel problems
and erectile dysfunction.111 Population screening needs to balance benefits and harms. It is possible that early detection using the currently available test will cause more harm than benefit. Therefore the most appropriate approach is for individual men to seek the advice of their GP if they notice any signs or symptoms or they have a strong family history of prostate cancer.
What is the prevalence?Cancers are a common group of diseases. Almost 17% of males and 12% of females aged 65 years and older in the Australian population were diagnosed with cancer in the period 1982 to 2005 and were still alive in 2006.112 This supports the anecdote that ‘everyone has either had cancer or knows someone with cancer’.
It is likely that one in three males and one in four females in Queensland will be diagnosed with cancer before the age of 75 years old (considered lifetime risk).14 The lifetime risk of breast cancer in Queensland females in 2005 was one in eleven (risk of one in eight by the age of 85 years), prostate cancer was one in eight males, one in 20 people for melanoma, one in 21 people for colorectal cancer, and for lung cancer one in 21 for males and one in 39 for females.14 In 2005, excluding non-melanoma skin cancers, there were 20,088 incident or new cases of cancer in Queensland (11,236 males and 8852 females) and 6938 deaths in 2006 (4069 males and 2869 females).
Skin cancer is Australia’s most common cancer, responsible for about 80% of all newly diagnosed cases, where most of these are non-melanocytic.113 In Australia in 2002 the incidence rate of treated non-melanocytic skin cancer was more than five times the incidence of all other cancers combined.114 Queensland has the highest incidence of malignant melanoma and non-melanocytic (basal cell and squamous cell carcinomas) skin cancer in the world.114,115,
Is it the same for everyone?The incidences of types of cancers differ between males and females. For males, the most common cancers
GU
IDELIN
ES
Recommended breast, ❚ 107 cervical108 and bowel62 cancer screening
BreastScreen PAP smear Bowel screening (FOBT)*
50-69 years 20-69 years 50 years and older
2 yearly 2 yearly 2 yearly
* currently FOBT screening is offered to those aged 50, 55 and 65 years

Report of the Chief Health Officer Queensland
16
Prevention of Chronic Disease
diagnosed were prostate, colorectal, melanoma and lung, and the most common cause of cancer deaths were from lung, prostate and colorectal cancers and melanoma (Figure 4). For females, the most common cancers diagnosed were breast, colorectal, melanoma and lung, and the most common causes of cancer death were lung, breast, colorectal and melanoma.
Cancer rates are higher in older age groups for all cancers considered in this report (Figure 5). The age specific profile of each cancer is quite different, with the burden of female breast cancer beginning by the early 20s and peaking before 60 years, and the burden due to prostate cancer peaking at 90 years. The disease burden of all cancers and each specific cancer is principally associated with premature mortality: 80% of the burden of disease due to all cancers is due to premature mortality, although for breast cancer and prostate cancer, 60-65% of burden was due to premature mortality.
Males are more likely to be diagnosed with cancer than females. In 2004-05 incidence rates of all cancers combined were 40% higher in males than females. Rates were similar across areas of socioeconomic advantage/disadvantage. However, rates were 18% lower in remote or regional areas compared to cities and 30% lower in areas of high Indigenous population compared to areas of less than 1% Indigenous people. These lower rates may be associated with differences in rates of population based cancer screening.
Individual cancers have markedly different incidence rates across Queensland. In 2005-06, lung cancer incidence rates were 41% higher in disadvantaged areas than advantaged, and about 30% higher in areas with 1-20% Indigenous population compared with areas of less than 1% Indigenous people. Colorectal cancer was about 30% lower in very remote
areas than major cities. Prostate cancer incidence was 19% higher in advantaged than disadvantaged areas and 75% higher in major cities compared with very remote areas. Female breast cancer incidence was 18% higher in advantaged areas than disadvantaged, 60% higher in cities than very remote areas and higher in areas of very low Indigenous population (less than 1%) compared with areas of high Indigenous population.
Males also have higher death rates from cancer than females. For all cancers in 2005-06, death rates were 66% higher in males than females. In contrast to incidence rates, cancer death rates were 15% higher in areas of socioeconomic disadvantage compared to advantaged areas. Including all cancers, about 14% of cancer deaths of people aged 0-74 years were due to socioeconomic disadvantage in 2005-06. This translates to about 520 premature deaths per year, of which about 50% were lung cancer deaths.
Lung cancer death rates vary across population groups and are a major cause of cancer related health inequality in Queensland. There were about 1400 deaths of Queenslanders per year in 2006 due to lung cancer where two thirds of these were male (66%). Lung cancer death rates were about 65% higher in areas of socioeconomic disadvantage. If everyone had the same lung cancer death rates as those in the most advantaged areas, about 35% of lung cancer deaths in people aged less than 75 years could be avoided. This translates to 280 lung cancer deaths per year that could be regarded as being due to socioeconomic disadvantage. Much of this excess relates to substantially higher smoking rates in areas of disadvantage in Queensland.
In contrast to lung cancer, death rates for breast, colorectal and prostate cancers did not vary across population groups in Queensland.
3000
2500
2000
1500
1000
500
0
Num
ber o
f cas
es
Males New casesDeaths
Pros
tate
Mel
anom
a
Colo
rect
al
Lung
Bre
ast
Mel
anom
a
Colo
rect
al
Lung
Cerv
ical
Females New casesDeaths
3000
2500
2000
1500
1000
500
0
Num
ber o
f cas
es
2846
550
1553
185454
1430
1138902
2404
491
1171
311
1105
87
641504
17539
Figure 4: Incidence and deaths due to major cancers, Queensland 200514,77

43% of cancer deaths
are preventable
Report of the Chief Health Officer Queensland Prevention of Chronic Disease
17
2
Indigenous Queenslanders are more likely to die of cancer than their non-Indigenous counterparts. Over the period of 1997-2002, Indigenous Queenslanders in rural and remote areas had higher death rates from cancer than non-Indigenous Queenslanders: 26% higher for males and 77% higher for females.116 This is consistent with 1982-1996 results.117 Mortality from smoking related cancers, such as lung, oral cavity,
pharynx and larynx, and cervical cancer was higher in each time period assessed.
What are the trends?Incidence and death rates due to all cancers continue to fall in Queensland, following previously reported trends.63 Since 2000, the death rate for all cancers in males decreased by 2.2% per year and for females
Figure 5: Age specific burden of disease due to cancer, Queensland 2006
9000
8000
7000
6000
5000
4000
3000
2000
1000
0
Bur
den
of d
isea
se (D
ALY
s)
0-1
5-9
15-1
9
25-2
9
35-3
9
45-4
9
55-5
9
65-6
9
75-7
9
85-8
9
95-9
9
Age group
Burden of disease due to all cancers
Male Female
12000
10000
8000
6000
4000
2000
0
Bur
den
of d
isea
se (D
ALY
s)
Age group
Burden of disease due to all cancers
3500
3000
2500
2000
1500
1000
500
0
Bur
den
of d
isea
se (D
ALY
s)
0-1
5-9
15-1
9
25-2
9
35-3
9
45-4
9
55-5
9
65-6
9
75-7
9
85-8
9
95-9
9
Age group
Burden of disease due to lung cancer
Premature deathDisability burden
1400
1200
1000
800
600
400
200
0
Burden of disease due to colorectal cancer
Bur
den
of d
isea
se (D
ALY
s)
0-1
5-9
15-1
9
25-2
9
35-3
9
45-4
9
55-5
9
65-6
9
75-7
9
85-8
9
95-9
9
Age group
1400
1200
1000
800
600
400
200
0
Bur
den
of d
isea
se (D
ALY
s)
0-1
5-9
15-1
9
25-2
9
35-3
9
45-4
9
55-5
9
65-6
9
75-7
9
85-8
9
95-9
9
Age group
Burden of disease due to female breast cancer
Premature deathDisability burden
1000900800700600500400300200100
0
Burden of disease due to prostate cancer
Bur
den
of d
isea
se (D
ALY
s)
0-1
5-9
15-1
9
25-2
9
35-3
9
45-4
9
55-5
9
65-6
9
75-7
9
85-8
9
95-9
9
Age group
Premature deathDisability burden
Premature deathDisability burden
0-1
5-9
15-1
9
25-2
9
35-3
9
45-4
9
55-5
9
65-6
9
75-7
9
85-8
9
95-9
9
Premature deathDisability burden

About half (54%) of all cancer deaths in 2006 occurred
in people aged less than 75 years
Report of the Chief Health Officer Queensland
18
Prevention of Chronic Disease
For colorectal cancer there has been a steady increase in rates of new cases diagnosed since 1982, particularly for males. However death rates are declining as more cases are diagnosed and managed earlier. Since 2000 there was a 6.2% per year decrease in death rates, although no significant change in incidence rates. Further improvement of regular population screening under the National Bowel Cancer Screening Program with a Faecal Occult Blood Test (FOBT) will lead to earlier detection and further reduction in colorectal cancer death rates.
Cervical cancer death rates have fallen dramatically – by about 26% since 2000 or 6.0% each year – largely as a result of an organised cervical screening program enabling early detection and treatment. Incidence rates have not changed in this period.
How do we compare?In 2004-05 death rates for all cancers in Queensland were similar to national rates. There was no significant difference between Queensland and national death rates for lung, breast, prostate or colorectal cancers. However Queensland had the highest incidence rates for all cancers among the states and territories and was about 7% higher than national incidence rates in 2006.120 Of note Queensland had the lowest prostate incidence rates among the states and territories and was about 3% less than the national rate.
Within the OECD, for all cancers, Australia was ranked 8th lowest for death rates among 27 countries in 2001-03, with Australian rates 12% higher than Finland which was the best performing country.121
How is it projected to change?The total disease burden caused by all cancers in Queensland is projected to increase by about 24% between 2006 and 2016, largely as a result of an increasing and ageing population. However, the rate will decrease slightly and the proportion of total burden due to cancer will remain around 19% over the period. There are small projected decreases in the rate of disease burden for most specific causes of cancer burden, but consistent with population growth and ageing, the total amount of burden for many cancers is projected to increase; lung cancer by 14%, colorectal cancer by 39%, prostate cancer by 35%, breast cancer by 23% and melanoma by 12%. In contrast, the cervical cancer burden is projected to decrease by 38%.
by 1.3% per year. The all cancer incidence rate in this period also decreased: by 0.1% per year for males and 0.8% per year for females. In males the decrease in incidence and death rates for all cancers is mainly due to decreases in lung and stomach cancer.118 Decreasing death rates for all cancers in females was due to improved early detection and treatment of breast cancer, colorectal, cervical, stomach and ovarian cancer. Historical trends for the incidence and mortality rates for each cancer are detailed in Table 1, and have been reported previously.118
Changes in cancer incidence rates (that is, the rate of newly diagnosed cancer) should be interpreted with caution as the rates may reflect changes in screening practices and public awareness, which increases detection rates early in the disease progression.
Lung cancer remains the major cause of cancer death in males, even though for the past two decades the incidence rate and death rate have declined. Since 2000, there has been a 2.7% decrease per year in the male lung cancer death rate and 2.3% per year decrease in the incidence rate. However the trends for females are opposite, with rates of death and new cases diagnosed steadily increasing over recent decades.118 However since 2000 there has been no significant change in the female lung cancer death rate or in the incidence rate. Changes in lung cancer rates in males and females reflect changes in smoking prevalence in previous decades.
Prostate cancer is the most common cancer diagnosed in males and the second largest cause of cancer death for males. Despite a 5.3% rise in the rates of new cases each year between 2000 and 2006, probably as a result of testing, death rates have fallen by 2.1% per year between 2000 and 2006.119
For Queensland females, breast cancer is the most common cancer diagnosed and the second most common cause of cancer death. The BreastScreen Queensland Program was introduced in 1991. Incidence and death rates are declining and since 2001, the death rate for breast cancer has significantly declined by a total of 23% or 3.8% per year. The incidence rate, or rate of diagnosis of new cases decreased by 1.1% per year in this period. The recent decrease in the rate of new cases may be due to early detection in the BreastScreen Queensland Program, where a large population has now been screened and the rate of detection of new cases is starting to approach an equilibrium.118

25-30% of deaths from breast cancer can
be prevented if 70% of women aged 50-69
are screened every two years22 – 57.9% of
Queensland women are screened
Report of the Chief Health Officer Queensland Prevention of Chronic Disease
19
2
What is its impact?In 2006 in Queensland, cancer was the largest cause of total burden of disease, causing 18.9% of the total burden; 19.4%% for males and 18.3% for females.
Cancers are a major cause of premature mortality in Queenslanders resulting in 3850 early deaths before 75 years of age in 2006; 54% of all cancer deaths and 41% of all such premature deaths in 2006. Deaths due to many cancers including lung, breast, colorectal, skin and cervical, are classified as substantially avoidable, given existing health and social systems in Australia, either through prevention, early detection, treatment or any combination of these.122 These preventable cancers are the cause of 43% of all cancer deaths and 32.3% of all avoidable deaths.
Hospitalisations due to many cancers including lung, breast, colorectal, skin and cervical cancer, are classified as potentially avoidable, either through prevention of the disease or access to timely and effective primary care.82
Survival from cancer has generally increased over the 20 years from 1982 to 2002, to a five-year relative survival of 63.5% for all cancers diagnosed in Queensland in 1996-2000, from 50.9% in 1982-1985.123 Of the major cancers, lung cancer had the lowest survival rate at 12.9%, and melanoma the highest at 94.1%, closely followed by breast cancer at 86.9%. The five year survival rate of colorectal cancer was 62.9%, cervical cancer was 74.6% and prostate cancer was 80.6%. Broadly speaking, the Queensland five year relative survival for different types of cancer was similar to Australia and the United States and generally higher than European countries, particularly England. In Queensland, for all cancers combined, persons diagnosed in 1996-2000 were 55% less likely to die within five years of diagnosis compared to persons diagnosed in 1982-1985. The greatest improvements in survival over time were for the following cancers: melanoma, breast, prostate, testicular and thyroid cancer and childhood leukaemia.
Expenditure for cancer was $2.15 billion or about 4.3% of Australian health expenditure in 2000-01, with most of this (90%) spent on treatment.85 Expenditure on non-melanoma skin cancer was the most expensive ($264 million), followed by breast ($241 million), colorectal ($235 million) and prostate cancer ($201 million). In 2008, taking into account the full effects of cancer, the total cost in Queensland is estimated to be about $9.5
billion,3 including $8.8 billion in lost wellbeing and $0.7 billion in direct financial costs.
Challenges and opportunities?Cancer remains a leading cause of premature death and disability in Queensland. One third (33.5%) of the burden of cancer is due to 11 modifiable risk factors,29 which means there is great potential for significant reductions in cancer incidence and mortality. In addition, early detection through population screening and effective treatment can reduce the impact of a further third of cancer.101 Cancer rates can be lowered significantly through enhancing cancer screening (for breast, bowel and cervical cancer) and reducing tobacco smoking. Further gains can be made by addressing modifiable risk factors including increasing physical activity and reducing overweight and obesity, poor diet, alcohol misuse and poor sun safe behaviours.
Reducing smoking will have the largest impact on preventing the burden of cancer. In 2003 in Queensland, tobacco smoking was responsible for 20.7% of total burden of cancer. This was largely due to its impact on lung cancer but includes other cancers such as mouth, oesophageal and kidney cancers.
About one fifth of Queenslanders smoke daily, about half are insufficiently active, about half are overweight or obese and less than 10% practice sun safe behaviour. Furthermore less than 60% of women in the target age groups are regularly screened for breast cancer or have regular Pap smears. Full participation in the recently introduced National Bowel Cancer Screening Program will be necessary to achieve reduction in death rates. Thus further investment in prevention and early detection has the potential to significantly reduce the burden of cancer in Queensland.

Coronary heart disease death rates are
11% higher in Queensland than Australia
– stroke rates are 8% higher12
Report of the Chief Health Officer Queensland
20
Cardiovascular disease ❚Cardiovascular health relates to the heart and blood vessels. Cardiovascular disease was the second largest cause of burden of disease and injury in Queensland in 2006, at 16.3% of total burden. Within the broad group of cardiovascular disease the major causes of death in 2006 were coronary heart disease (CHD) which accounted for 58% of all cardiovascular deaths and 21% of all deaths in Queensland, stroke (about 9% of all deaths), heart failure (about 1% of all deaths) and peripheral vascular disease (less than 1%). Indigenous people in Australia experience relatively high rates of acute rheumatic fever and chronic rheumatic heart disease, although these conditions are rare in non-Indigenous people.124
What causes it?The main underlying cause of cardiovascular disease is the build up of fat, cholesterol and other substances in the inner lining of the arteries.124 At its most serious it leads to a reduced or blocked blood supply to the heart (causing the specific clinical forms of CHD; angina and heart attack) or to the brain (causing stroke). It is associated with ageing and a number of known factors that put people at greater risk of cardiovascular disease irrespective of their age. A diagnosis of diabetes puts people at higher risk of developing a cardiovascular condition. In 2004/05, Australians who reported having diabetes were twice as likely to also report having had a heart attack and four times as likely to have had a stroke as those without diabetes.125
The major risk factors for cardiovascular disease are high blood cholesterol, high blood pressure, smoking, overweight and obesity, physical inactivity and poor nutrition. Two thirds (67%) of the total Queensland cardiovascular burden of premature death and dis-ability is due to the combined effect of these and four other minor risk factors.29 Furthermore 83% of the CHD burden and 66% of the stroke burden is due to the joint effect of these risk factors. The methodology for assessing burden of disease currently only includes the impact of low fruit and vegetable consumption and not the full impact of poor nutrition. Therefore these impacts are an underestimate of the role of preventable risk factors in cardiovascular disease burden.
While 80% of people who have at least one risk factor for CHD don’t actually have the disease, of those with CHD, nearly all (90%) have at least one risk factor. This apparent dichotomy illustrates the difference between the concept of individual risk and population risk, which is important for the planning of population and
individual interventions to prevent CHD. For the indi-vidual, having one or more risk factors is not necessar-ily a good predictor of disease, however at a population level, the presence of risk factors has proved to be effective in targeting population based strategies.126,127
What can be done to prevent it?At least two thirds of the total disease burden due to cardiovascular conditions is due to the joint effects of high blood pressure, high blood cholesterol, physical inactivity, obesity, tobacco smoking, poor nutrition and other factors.29 In 2008, the risk of death from cardiovascular disease was 8.2 times higher in women with poor lifestyle factors over a 24 year period, in contrast to those who did not.50 Poor lifestyle fac-tors were smoking, being overweight, inactive, high alcohol intake and poor diet. Similar findings could also apply to males. Thus, interventions to address these factors will not only prevent the development of cardiovascular disease but also address the important priority of improving the overall health status of the population.90, 128 In the longer term, greater gains in population health status will come from the prevention of cardiovascular disease than from its treatment.92 For example, in Australia over the period 1968 to 2000, 74% of the decline in coronary heart disease mortality in males and 81% of the decline in females was due to the combined effect of reducing three risk factors.38 In males 36% of the decline was due to reductions in diastolic blood pressure, 22% from cholesterol and 16% from smoking. For females 56% of the decline was from diastolic blood pressure reduction, 20% from cholesterol and 5% from smoking.
Many people in Australia are at risk of cardiovascular disease, based on lifestyle behaviours. In 2001, one in four people across all age ranges reported at least two risk factors with poor diet and physical inactivity the most commonly reported.129 Despite the prevalence of risk factors in the population across all age groups, an individual is more likely to have heart disease if they have more risk factors irrespective of age.
Although cardiovascular disease is a condition largely affecting older people, it has its origins in early life and the intergenerational social and cultural exposures and associated risks.130, 131 For example adult cardiovascular disease is linked to poor health status in childhood,

Two thirds (67%) of cardiovascular disease is due to preventable risk factors – high blood cholesterol,
high blood pressure, smoking, overweight and obesity, physical inactivity and poor nutrition29
Report of the Chief Health Officer Queensland
2
affected people across a broad age range. In 2004/05 61% of Queenslanders aged 65 years and older reported such conditions, as well as 29% of people aged 45-64 years and 12% of those aged 25-44 years.
Death rates for CHD and stroke increased with age (Figure 6), as did those for rheumatic heart disease. Rates of CHD death begin to increase from age 60 years in males and from age 70 in females, peaking at ages 85 years and older. In 2005-06 CHD death rates were 62% higher in males than females, 29% higher in socioeco-nomically disadvantaged than advantaged areas, 10% higher in outer regional areas and 46% higher in very remote areas than major cities (Figure 7). These rates were also 39% higher in areas of high Indigenous popu-lation than areas of low Indigenous population. Death rates for stroke in 2006 did not differ significantly across population groups in Queensland (Figure 7).
If everyone had the same CHD death rates as those in the most advantaged areas, about 25% of
such as overweight and obesity,132 low birth weight, poor nutrition and impaired early development.133 Obese children have up to four times the risk of becom-ing overweight or obese adults.134
While the targeting of ‘high risk’ individuals reduces death rates, greater impact can result from efforts to affect the baseline risk across the broader popula-tion. For example, in recent decades there have been significant reductions in deaths from cardiovascular disease through the reduction of blood pressure and cholesterol across the population rather than reduction below specific diagnostic thresholds.135 In both Australia and New Zealand the baseline risk strategy has been estimated to reduce more cardiovascular cases at lower cost compared to targeting specific high risk individu-als.136,127 Similarly reducing BMI by 10% in overweight and obese women is predicted to decrease hypertension by 12% and diabetes by 23% up to eight years later.37 These reductions could be achieved with very moderate reductions in kilojoule intake (equivalent to a chocolate biscuit a day) combined with a moderate increase in daily physical activity (an extra 2000 steps).
What is the prevalence?In 2004/05, almost one fifth of Queenslanders reported having a long term cardiovascular condition – 18.8% or approximately 700,000 people.15 The most common of these conditions was hypertension, and 4.1% or 155,000 people reported a long term heart problem, stroke or other vascular condition. In 2005, 22% of Australians presenting to a general practitioner (GP) did so for a cardiovascular condition, most com-monly hypertension followed by CHD.137
Cardiovascular conditions, along with cancer, are the two largest causes of premature death (before 75 years) in Queensland. Coronary heart disease led to an average of 4506 deaths per year in Queensland in 2006 of which 25.5% were premature, that is before the age of 75 years. Of the 1150 premature deaths, 39% were in men aged 65-74 years (449 deaths) and 33% in men aged 45-64 years (379 deaths). Women accounted for 24% of these premature deaths (276 deaths). In 2006 in Queensland there were 2220 deaths due to stroke, with less than one in five consid-ered premature (16.2%). Among Indigenous people, there were 49 deaths from acute rheumatic fever and chronic rheumatic heart disease in 2006.
Is it the same for everyone?While long term cardiovascular conditions were more commonly reported in older people these conditions
Figure 6: Rates of death77 and total burden of disease for CHD
and Stroke, Queensland 2006
3500
3000
2500
2000
1500
1000
500
0
Dea
th ra
te
(per
100
,000
pop
ulat
ion)
0-4
10-1
4
20-2
4
30-3
4
40-4
4
50-5
4
60-6
4
70-7
4
80-8
4Age group
CHD Stroke
Rates of death
Bur
den
of d
isea
se (D
ALY
s) 4000
3500
3000
2500
2000
1500
1000
500
0
1-4
10-1
4
20-2
4
30-3
4
40-4
4
50-5
4
60-6
4
70-7
4
80-8
4
90-9
4
Age group
Burden of disease due to CHD
Female Male
Bur
den
of d
isea
se (D
ALY
s) 4000
3500
3000
2500
2000
1500
1000
500
0
1-4
10-1
4
20-2
4
30-3
4
40-4
4
50-5
4
60-6
4
70-7
4
80-8
4
90-9
4
Age group
Burden of disease due to Stroke
Female Male
Prevention of Chronic Disease
21
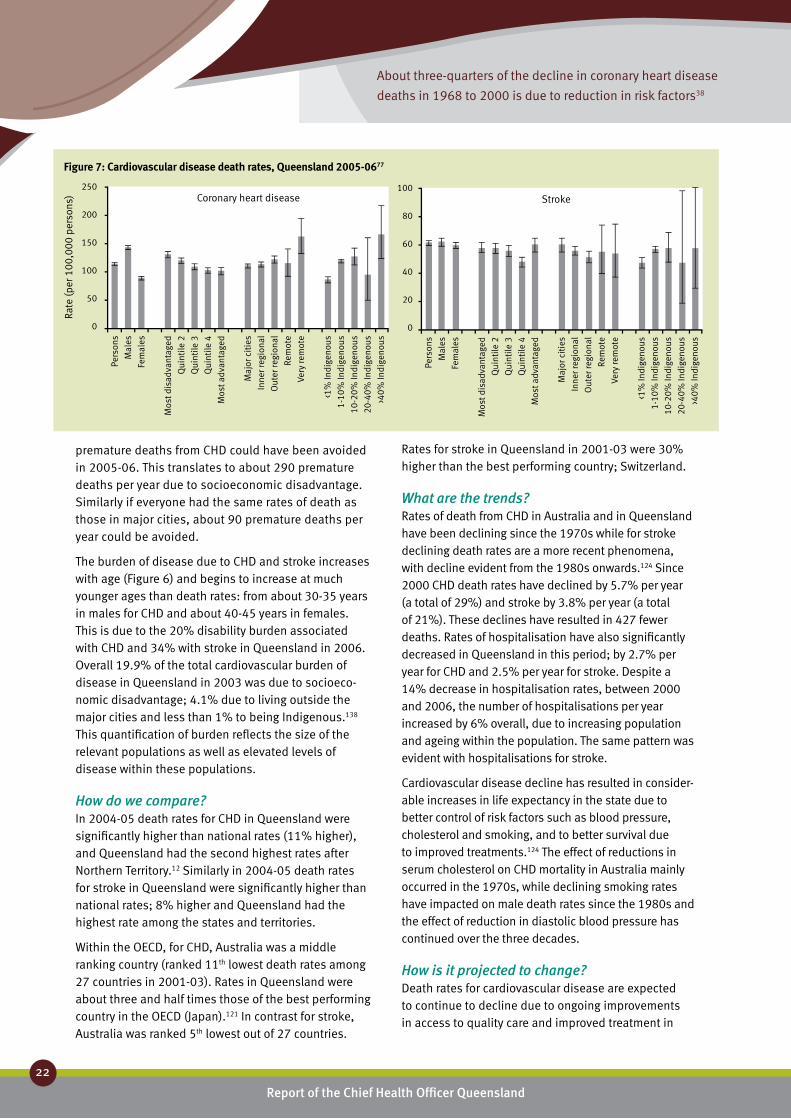
About three-quarters of the decline in coronary heart disease
deaths in 1968 to 2000 is due to reduction in risk factors38
Report of the Chief Health Officer Queensland
22
Prevention of Chronic Disease
premature deaths from CHD could have been avoided in 2005-06. This translates to about 290 premature deaths per year due to socioeconomic disadvantage. Similarly if everyone had the same rates of death as those in major cities, about 90 premature deaths per year could be avoided.
The burden of disease due to CHD and stroke increases with age (Figure 6) and begins to increase at much younger ages than death rates: from about 30-35 years in males for CHD and about 40-45 years in females. This is due to the 20% disability burden associated with CHD and 34% with stroke in Queensland in 2006. Overall 19.9% of the total cardiovascular burden of disease in Queensland in 2003 was due to socioeco-nomic disadvantage; 4.1% due to living outside the major cities and less than 1% to being Indigenous.138 This quantification of burden reflects the size of the relevant populations as well as elevated levels of disease within these populations.
How do we compare?In 2004-05 death rates for CHD in Queensland were significantly higher than national rates (11% higher), and Queensland had the second highest rates after Northern Territory.12 Similarly in 2004-05 death rates for stroke in Queensland were significantly higher than national rates; 8% higher and Queensland had the highest rate among the states and territories.
Within the OECD, for CHD, Australia was a middle ranking country (ranked 11th lowest death rates among 27 countries in 2001-03). Rates in Queensland were about three and half times those of the best performing country in the OECD (Japan).121 In contrast for stroke, Australia was ranked 5th lowest out of 27 countries.
Rates for stroke in Queensland in 2001-03 were 30% higher than the best performing country; Switzerland.
What are the trends?Rates of death from CHD in Australia and in Queensland have been declining since the 1970s while for stroke declining death rates are a more recent phenomena, with decline evident from the 1980s onwards.124 Since 2000 CHD death rates have declined by 5.7% per year (a total of 29%) and stroke by 3.8% per year (a total of 21%). These declines have resulted in 427 fewer deaths. Rates of hospitalisation have also significantly decreased in Queensland in this period; by 2.7% per year for CHD and 2.5% per year for stroke. Despite a 14% decrease in hospitalisation rates, between 2000 and 2006, the number of hospitalisations per year increased by 6% overall, due to increasing population and ageing within the population. The same pattern was evident with hospitalisations for stroke.
Cardiovascular disease decline has resulted in consider- able increases in life expectancy in the state due to better control of risk factors such as blood pressure, cholesterol and smoking, and to better survival due to improved treatments.124 The effect of reductions in serum cholesterol on CHD mortality in Australia mainly occurred in the 1970s, while declining smoking rates have impacted on male death rates since the 1980s and the effect of reduction in diastolic blood pressure has continued over the three decades.
How is it projected to change?Death rates for cardiovascular disease are expected to continue to decline due to ongoing improvements in access to quality care and improved treatment in
250
200
150
100
50
0
Rate
(per
100
,000
per
sons
) Coronary heart disease
Pers
ons
Mal
es
Fem
ales
Mos
t dis
adva
ntag
ed
Qui
ntile
2
Qui
ntile
3
Qui
ntile
4
Mos
t adv
anta
ged
Maj
or c
itie
s
Inne
r reg
iona
l
Out
er re
gion
al
Rem
ote
Very
rem
ote
<1%
Indi
geno
us
1-10
% In
dige
nous
10-2
0% In
dige
nous
20-4
0% In
dige
nous
>40%
Indi
geno
us
100
80
60
40
20
0
Stroke
Pers
ons
Mal
es
Fem
ales
Mos
t dis
adva
ntag
ed
Qui
ntile
2
Qui
ntile
3
Qui
ntile
4
Mos
t adv
anta
ged
Maj
or c
itie
s
Inne
r reg
iona
l
Out
er re
gion
al
Rem
ote
Very
rem
ote
<1%
Indi
geno
us
1-10
% In
dige
nous
10-2
0% In
dige
nous
20-4
0% In
dige
nous
>40%
Indi
geno
us
Figure 7: Cardiovascular disease death rates, Queensland 2005-0677

Preventing cardiovascular disease in Queensland will produce the greatest gains in
closing the gap in health inequality and improving the health of the population
Report of the Chief Health Officer Queensland Prevention of Chronic Disease
23
2
combination with a continuing decline in smoking rates and improved management of risk factors. Despite a projected decline in the rate of cardiovascular burden between 2006 and 2016, the total burden is projected to remain steady due to the projected increase in the number of older people in the population. The impact of increasing rates of overweight and obesity com-pounded by increasing prevalence of diabetes is likely to jeopardise these gains.
What are its impacts?Cardiovascular disease is a major cause of premature mortality in Queenslanders resulting in 1150 deaths in people aged less than 75 years annually. Deaths due to CHD and stroke are classified as substantially avoidable, given existing health and social systems in Australia, either through prevention or treatment or both,122 causing 30% of avoidable deaths.
CHD was the principal diagnosis for 32,508 hospitalisations in Queensland in 2006/07 with an average stay of 4.0 days. There were 9938 hospitalisations for stroke in 2006/07 and the average length of stay was 8.4 days. All hospitalisations due to CHD are classified as potentially avoidable through primary prevention, although none are classified as ambulatory care sensitive.82 In contrast, hospitalisations due to angina, rheumatic fever, hypertensive disease and congestive heart failure are classified as potentially preventable by ambulatory care but not by primary prevention.82
An estimated $8.9 billion was saved in 1996 in Australia due to the reduction in CHD death rates from levels 30 years earlier.25 Using conservative assumptions, public health programs saved $66 million in CHD related health care costs, with a further $828 million in longevity gains.
Cardiovascular disease is the most expensive disease group in terms of direct health expenditure, accounting for 11% or $5.4 billion of national health expenditure in 2000-01.139 About half (47%) of this expenditure was related to hospital services, 26% to pharmaceuticals, 10% to aged care homes and the remainder to out of hospital medical and other professional services. National spending on cardiovascular disease in the 30 year period from 2002-03 is projected to double to $16.2 billion per year, with the majority of the expected increase due to population growth and ageing.140 In 2008, taking into account the full effects of cardiovas-cular disease, the total cost in Queensland is estimated to be about $32.3 billion3, including $29.7 billion in lost wellbeing and $2.6 billion in direct financial costs.
Queenslanders with a cardiovascular condition were more likely to rate their health as poor or fair compared to those with no chronic conditions (33% compared with 4% in 2004/05).15 In 2003, cardiovascular conditions were the leading cause of difference in health adjusted life expectancy (HALE) between populations in Queensland. For those who live in areas of socioeconomic advantage compared to areas of disadvantage, cardiovascular conditions accounted for 0.9 years of the 4.3 year difference, remote areas compared to major cities (1 year of the 5.6 year difference) and between Indigenous and non-Indigenous people (4.1 years of the 13.1 year difference).
Challenges and opportunities?Rates of cardiovascular disease death in Queensland are declining but remain about 11% higher than national rates. Internationally, Australia has relatively low mortality rates and has improved its life expectancy ranking in recent years through better prevention and treatment of cardiovascular conditions. Continuing and substantial health gains can be made by improving cardiovascular health for all Queenslanders, particu-larly in socioeconomically disadvantaged areas and for Indigenous people. Reducing dietary salt intake by three grams per day will result in 22% reduction in deaths from stroke and 16% reduction in deaths from CHD.21
Smoking, alcohol consumption, physical inactivity, poor diet and overweight are considered as some of the most serious risk factors for health worldwide. Modest reductions in blood pressure, obesity, tobacco smoking and poor diet would more than halve the cardiovascular disease incidence if these reductions were population wide and simultaneous.141
While the spectacular decline in CHD mortality over the last three decades is due to reduced population risk factors,38 many adult Queenslanders are still at risk of cardiovascular disease irrespective of their age. About a quarter of the adult Queensland population have high blood pressure, about half have high cholesterol, about half are insufficiently active, more than half are overweight or obese and about one fifth smoke daily. Further investment in prevention could reduce the cardiovascular burden and promote healthy life into older age. This will be necessary to avoid stagnation of gains previously made in cardiovascular health over the past two decades. Costs associated with treatment of cardiovascular disease are very high and therefore failure to make substantial progress in prevention as the population ages will significantly increase the already unprecedented pressure on the health system.

Report of the Chief Health Officer Queensland
24
Prevention of Chronic Disease
eye tests. It also involves monitoring of related life-style behaviours. In May 2007, about 90% of general practices in Queensland had signed on to the Diabetes Practice Incentives Program.147
What is the prevalence?The prevalence of diabetes is about 7% depending on the method of assessment, that is, by blood sample or by self report. The true prevalence of diabetes can only be determined using blood measurement with the most recent assessment in 2000. In 2000, 7.0% (age stand-ardised) of Queenslanders aged 25 years and older had been diagnosed with diabetes, with similar rates for males (7.1%) and females (7.0%). Using this data,63 in 2007 about 206,000 Queenslanders were estimated to have Type 2 diabetes with about 17,000 new cases diagnosed each year, or about 50 new cases per day.
Estimates of diabetes using self report generally under-estimate the true prevalence of diabetes (by as much as 50%125) as many people may not know they have the disease.148 Based on self report, in 2006 6.7% (age standardised) of Queenslanders aged 18 years and older had been told they had diabetes or high blood sugar (7.0% males and 6.5% females) (Table 2).149 This excluded gestational diabetes. The unadjusted rate for adults was 7.4%. The majority (83%) of self reported cases of diagnosed diabetes in Australia were Type 2 diabetes.125 In 2005, 6.6% of Australians visited a GP for a problem related to diabetes and of these visits most (86%) were concerned with Type 2 diabetes.137
There were 652 deaths due to diabetes in Queensland in 2006, which was 2.7% of all deaths. Males accounted for 50% of these deaths. In 2004-05 only half of these deaths were specifically coded to either Type 1 or Type 2 diabetes, and of the coded deaths most (84%) were due to Type 2 diabetes.
For hospitalisations in Queensland in 2006/07, diabetes was the cause of 7.2% (106,000 hospitalisa-tions) of all hospitalisations; of these diabetes was the principal diagnosis for 14,966 hospitalisations and an additional diagnosis for 91,197 hospitalisations. The majority of these hospitalisations were Type 2 diabetes (83% in 2004/5-2005/06), where 99% of all hospitali-sations were specifically coded to either Type 1 or Type 2 diabetes.
Is it the same for everyone?Prevalence of Type 2 diabetes increased markedly with age for adult males and females, whether assessed by blood measurement or self report.150 However, Type 2 diabetes is now being diagnosed in children. In
Diabetes ❚Diabetes mellitus (diabetes) is a disease marked by high blood glucose levels resulting from defective pro-duction and/or action of insulin, which is the hormone that regulates blood sugar.142 There are several types of diabetes and each has different causes and clinical histories: Type 1, Type 2 and gestational diabetes.
Diabetes was the sixth leading broad cause of prema-ture death and disability in Queensland in 2006, and was responsible for 5.7% of the total burden of disease and injury. Type 2 diabetes caused 92% of the total diabetes burden. Type 2 diabetes was the third largest specific cause of burden of disease (5.2%), after coro-nary heart disease, and anxiety and depression.
What causes it?Diabetes is caused by impaired glucose regulation and metabolism as a result of a number of risk factors. The factors that cause Type 1 and Type 2 diabetes are dif-ferent. Type 1 diabetes is largely the result of a genetic predisposition in combination with biological and environmental factors.143,144 Type 2 diabetes results from a combination of genetic factors and lifestyle behaviours and unlike Type 1 diabetes is highly preventable. In Queensland, 60.5% of the premature death and disability due to Type 2 diabetes was due to two risk factors, with overweight and obesity the major factor, followed by physical inactivity.29 As poor nutrition is not fully included in the 60.5%, this is an underestimate of the full preventability of diabetes.
What can be done to prevent it?The incidence of Type 2 diabetes can be significantly prevented through improved nutrition and physical activity which prevents individuals from becoming over-weight and obese.145 For those at high risk of the disease – those defined as pre-diabetic, loss of 5-7% in body weight can prevent or delay the onset of Type 2 diabe-tes.146 Lower intake of fat and kilojoules, along with an average 30 minutes walking five days per week, resulted in weight loss of about 5 kg and a subsequent 58% reduced risk of getting diabetes up to six years later.
Managing diabetes involves trying to keep blood glucose within safe levels and for Type 2 diabetes, maintaining or improving lifestyle behaviours to moder-ate the impact of the disease.6 A diabetes health care check undertaken by GPs has been introduced by the federal government. This check includes six-monthly monitoring of BMI, blood pressure and feet examina-tion, annual blood and urine tests, and two-yearly
60.5% of Type 2 diabetes is due to overweight
and obesity and physical inactivity29

Between 2006 and 2016, the burden of Type 2
diabetes is projected to increase by 55%
Report of the Chief Health Officer Queensland Prevention of Chronic Disease
25
2
Age group Percentage Percentage
Person 18+years 6.7 (5.4-8.4) SEIFA disadvantaged 6.9 (4.1-11.4)
Male 18+years 7.0 (5.0-9.8) quintile 2 9.5 (6.1-14.6)
Female 18+years 6.5 (4.8-8.7) quintile 3 5.2 (3.1-8.7)
quintile 4 6.2 (3.8-9.9)
Persons (years) 18-29 0.7 (0.1-3.2) advantaged 5.8 (3.4-9.8)
30-39 2.8 (1.1-6.7)
40-49 4.0 (2.2-7.3) ARIA Major city 6.0 (4.3-8.3)
50-59 10.6 (7.1-15.6) Inner/Outer regional 8.6 (6.2-11.8)
60-69 13.3 (8.6-20.1) Remote/Very remote 6.4 (1.9-19.5)
70+ 18.1 (12.0-26.4)
*includes high blood sugar, and is age standardised
Table 2: Diabetes prevalence based on self-report*, Queensland 2006149
1999-2005 in Australia, 21 children aged 0-4 years were reported as diagnosed with Type 2 diabetes, 34 aged 5-9 years and 117 aged 10-14 years.151 Similarly the rate of disease burden due to diabetes increases dramati-cally after 20-25 years and continues to rise into very old age (Figure 8). Of those with Type 2 diabetes, 81% were aged 45 years or older when diagnosed.6 In contrast, for Type 1 diabetes, 24% had been diagnosed by age 15 years and 56% before the age of 45 years.
Indigenous Australians are more likely to develop diabetes. After adjusting for age differences, in 2004/05 Indigenous Australians were 3.4 times as likely to report some form of diabetes as other Australians.152 In addition, the condition was twice as prevalent among Indigenous Australians in remote areas compared with non-remote areas. Torres Strait Islanders have the highest prevalence of Type 2 diabetes in Australia, with about one third of adults affected.153
Death rates for diabetes in 2005-06 were 200% higher for people living in areas of disadvantage compared
to those in advantaged areas, 37% higher in outer regional areas than major cities and higher again in remote and very remote areas. Death rates were at least 87% higher in areas with a higher proportion of Indigenous people than those with less than 1% Indigenous population. About 90 deaths per year or about 35% of premature deaths from diabetes were due to socioeconomic disadvantage if everyone was assumed to have the same rates as those in the most advantaged areas. Similarly, if everyone aged less than 75 years in Queensland had the same death rates for diabetes as those in major cities, about 25 premature deaths could have been avoided.
How do we compare?The prevalence of diabetes, both by measurement and self report, was slightly lower in Queensland than Australia. In 2000 measured prevalence in Queensland was 7.0% and in Australia 7.4% for people aged 25 years and older.150 In the same age group in 2004/05, the self reported prevalence of diabetes in Queensland
Figure 8: Total disease burden due to diabetes, Queensland 2006
2500
2000
1500
1000
500
0
Bur
den
of d
isea
se (D
ALY
s)
0-1
5-9
15-1
9
25-2
9
35-3
9
45-4
9
55-5
9
65-6
9
75-7
9
85-8
9
95-9
9
100
Age
Male Female
3500
3000
2500
2000
1500
1000
500
0
Bur
den
of d
isea
se (D
ALY
s)
0-1
5-9
15-1
9
25-2
9
35-3
9
45-4
9
55-5
9
65-6
9
75-7
9
85-8
9
95-9
9
100
Age
Type 1 diabetesType 2 diabetes

Health expenditure for diabetes in Australia is
projected to increase by 400% between 2003
and 2033 – from $1.4 billion to $7 billion31
Report of the Chief Health Officer Queensland
26
Prevention of Chronic Disease
was 4.8% and for Australia 5.2%,15,154 noting that this did not include high blood sugar as described above (Table 2).
In 2006, according to the International Diabetes Federation, comparison of the percentage of people with diabetes in 20 other OECD countries puts Australia in the middle ranking countries (similar to Japan, Sweden, Ireland and Belgium).155 The highest preva-lence of diabetes was found in Mexico (10%) and the lowest was in the United Kingdom (3%).
Death rates for diabetes in Queensland were similar to national rates in 2004-05. Within 27 OECD countries in 2001-03, Australia was a middle ranking country for diabetes death rates; ranked 11th lowest. Queensland rates in the same period were three times the rates of the best performing country, Greece.
What are the trends?The number of people with diabetes has increased sub-stantially in recent years. While self reported diabetes prevalence is known to be inaccurate, the collection of this data over many years allows for comparisons. Trend analysis in Queensland is limited to recent self reported assessments. However, in Australia between 1989-90 and 2004/05, the proportion of people report-ing diabetes increased from 1.4% to 3.6%; this is an underestimate of diabetes prevalence in both periods as it excludes those who may mistakenly understand their condition to be diagnosed high blood sugar rather than diabetes. While this prevalence is largely due to an increase in Type 2 diabetes, other types of diabe-tes such as Type 1 diabetes and gestational diabetes are also reported to be on the rise.156 This substantial increase in diabetes prevalence is related to more peo-ple developing diabetes, people living longer with the disease, and better detection of the disease.157
Hospitalisation rates for diabetes have also increased. Between 2000/01 and 2006/07, hospitalisation rates where diabetes was the principal cause increased by 9.8% per year. These trends were similar for males and females. While rates increased by 73% in this seven year period, the number of hospitalisations doubled, from 7200 per year to 15,000 per year. Death rates for diabetes as the principal cause increased between 2000 and 2006 by 1.8% per year for females and decreased for males by 1.5% per year.
How is it projected to change?Diabetes in Queensland is expected to increase dramatically over the next decade. In Australia over
the past two decades diabetes prevalence has more than doubled and now affects around one million Australians. By 2031, it is expected that diabetes will affect 3.3 million Australians. The World Health Organization (WHO) projects that the number of people with diabetes worldwide will increase from an esti-mated 177 million in 2000 to 300 million in 2025. WHO also estimated that in 2000, diabetes was a fac-tor in 9% of all deaths worldwide.8
Diabetes prevalence is expected to increase in the Queensland population as more people are diagnosed with a condition that requires ongoing treatment and management with low or no likelihood of recovery. In the 10-year period between 2006 and 2016, the total burden of disease in Queensland due to Type 2 diabetes is projected to increase by 55%. But more importantly the rate of disease burden is projected to increase by 18%. In contrast, for most other conditions the rate is decreasing, in particular for coronary heart disease, stroke and cancer. If the Queensland projec-tions are extended to 2031, based on current trends, there will be between 600,000 and 700,000 people in Queensland with Type 2 diabetes and about 160 new cases diagnosed each day. This will reflect a prevalence rate in people aged 25 years and older of about 15%.
Hospitalisations for diabetes are projected to almost triple (2.7 times) in Queensland in the next 20 year period; from 6400 in 2006/07 to 17,000 in 2026/27.158 However, in light of the doubling in hospitalisations for diabetes over the past seven years, these projections are an underestimate.
What are its impacts?Diabetes in Queensland imposes a large load on the health system and on communities. Diabetes can have severe complications and is associated with substan-tial morbidity and mortality. In 2006 the majority of the burden of disease due to Type 2 diabetes was due to disability (79%), rather than premature mortality, although Type 1 had a lower disability component (55%). In 2004/05, Australians who reported diabetes were twice as likely to report having had a heart attack and four times as likely to have had a stroke as those without the disease.125 People who reported diabetes were twice as likely to report a cataract or glaucoma as those without diabetes and nearly a third of people starting treatment for end stage kidney disease did so because of kidney damage due to diabetes.
People with a chronic disease were more likely to report fair or poor health. In 2004/05, 54% of diabetics in

If all overweight Australian women reduced their weight by about 5kg,
the incidence of diabetes would be reduced by 23% up to eight years later37
Report of the Chief Health Officer Queensland Prevention of Chronic Disease
27
2
Queensland reported poor health compared to 4% with no chronic condition.159 Diabetes, along with cancer, is the most disabling of selected chronic conditions.
Deaths due to diabetes are classified as substantially avoidable, given Australia’s existing health and social systems, either through prevention or treatment or both.89 All hospitalisations due to diabetes are classi-fied as potentially avoidable, either through preven-tion or access to timely and effective primary care.82 Hospitalisations due to complications from diabetes which could have been prevented by health care provided in an ambulatory care setting such as general practice or community health, caused 75,474 hospi-talisations per year in 2005-06. These were 2.7% of all hospitalisations, 39% of all diabetes hospitalisations and 31% of all ambulatory care sensitive hospitalisa-tions, and as such the largest cause of potentially avoidable separations in the ambulatory care setting.
The cost of treating diabetes will prove a particular challenge. In 2000/01 in Australia, health system costs due to diabetes were estimated at $0.8 billion, which was 1.7% of the total national expenditure on health care.160 However this is an underestimate because diabetes is also related to other diseases such as cardiovascular and renal diseases and so total health expenditure attributable to diabetes is actually greater than $0.8 billion.161 The total health expenditure for diabetes in Australia is projected to increase 400% in the 30 year period between 2003 and 2033 from $1.4 billion (projected from 2000-01) to $7 billion.31 In contrast the average national health expenditure across all conditions was projected to increase by 27%. In 2008, taking into account the full effects of diabetes, the total cost in Queensland is estimated to be about $6.9 billion3, including $4.4 billion in lost wellbeing and $2.5 billion in direct financial costs. It has been estimated that if all overweight or obese Australians lost 5 kg, there would be a $44 million saving per year in health care costs associated with Type 2 diabetes and its complications.54
Challenges and opportunities?Type 2 diabetes is widely recognised as a major prob-lem for the health system, in Queensland and world-wide.8 The cause of the problem is relatively simple: increasing levels of the risk factors for diabetes. More than half the adult population in Queensland are over-weight or obese and these levels have been increasing in recent years. Less than half the population are get-ting sufficient physical activity, although in recent years
there have been signs of improvement. Rates of obesity and physical inactivity in children are of concern and are driving state and national policy responses.
Furthermore, once diagnosed, the disease can be treated and managed, but people do not recover from the condition. Relatively few people die as a direct result of diabetes. Therefore as more people are diagnosed with Type 2 diabetes, the number of people needing medical care and management increases. Added to this, a diagnosis of diabetes puts people at risk of cardiovascular conditions, kidney disease and other complications. Thus the burden on the health system is amplified. The projected 400% increase in health care cost of diabetes over the 30 years to 2033 demonstrates the extent of the challenge. This does not of course factor in the personal cost of diabetes for those who live with its limitations - loss of wellbeing, depression, modification to social life and loss of workforce participation.
For chronic diseases such as diabetes there is the risk that as the resources required to treat a condition increase, the resources needed to prevent the condi-tion become harder to obtain.92 This is relevant for all chronic conditions but more so for Type 2 diabetes because of the greatly increasing number of cases and the life-long management and treatment requirements. This produces ever increasing need for resources for treatment that are thus not available for prevention. This is illustrated in the bathtub analogy (Figure 3) and the associated text.
However, there are opportunities to address the prob-lem. Over 60% of Type 2 diabetes is due to the joint effect of overweight and obesity and lack of physical activity.29 Investment in prevention in Queensland over the last 3-5 years is showing early signs of success, as shown in Chapter 5: Prevention works. As suggested by WHO162 and data from Australia,37 a small change in the main risk factors such as overweight and obesity could result in significant reduction in risk of chronic disease such as Type 2 diabetes. For example, it has been estimated that if all overweight Australian women (BMI greater than 25) reduced their BMI by 2 points (approxi-mately by 5.5kg), the incidence of diabetes would be reduced by 23% up to eight years later.37 Substantial health gains can therefore be achieved by improving levels of physical activity and nutrition and reducing levels of overweight and obesity, for all Queenslanders, particularly those in socioeconomically disadvantaged areas and for Indigenous people.

Queensland has more mental health issues than Australia: higher percentage of people with
long term problems, psychological distress and poor self reported health
Report of the Chief Health Officer Queensland
28
Anxiety and depression ❚Mental health relates to emotions, thoughts and behaviours. A person with good mental health is generally able to handle day to day events and obstacles, work towards important goals, and function effectively in society. However even minor health problems may affect everyday activities to the extent that individuals cannot function as they would wish or are expected to, within their family or community. The experience of mental health problems or lack of mental wellbeing is described and measured in a variety of ways including;
depression• 5 long term mental and behavioural conditions• 163 anxiety and depression• 164 poor self reported health• 165,166 psychological distress• 83 or psychosocial stress93 low health related quality of life.• 167
Chronic depression and associated mental health issues are chronic conditions of increasing significance and impact in the population. Mental disorders accounted for two of the eight years of healthy life lost in Queensland in 2003.28 Combined, anxiety and depression are the second largest specific cause of disease and injury burden in Queensland in 2006 and the leading specific cause of disability burden (14.5% of total disability burden). Anxiety and depression are a particularly significant source of disability burden in children and young people.
In addition, people with a chronic disease such as cardiovascular disease, cancer and diabetes are more likely to experience mental health issues. For some chronic conditions such as cardiovascular disease, stress has been shown to be a risk factor.168 The conditions associated with chronic disease, often called co-morbid conditions, include increased psychological distress, reduced quality of life and diminished sense of mental wellbeing.
What causes it?Depression has complex causes, possibly specific to the individual, their personality, levels of support and social connectedness and severity of disease. Excessive alcohol consumption, use of illicit drugs, partner violence and child sexual abuse put people at greater risk of anxiety and depression and other mental
health disorders. In 2003, these four risk factors explained 25% of the burden of disease from mental disorders in Queensland.29
The causes of psychological distress may be related to more generalised chronic stress, which can then feed into a poor health cycle by adversely affecting blood pressure and cholesterol.169 This cycle is evident through increased food intake,170 and heightened tendencies to smoke,171 thus further increasing the risk of chronic health conditions. Once developed, chronic health conditions are associated with functional limitations which are likely to affect quality of life; such as lower mobility, more problems with self care and daily activities, pain and discomfort, and anxiety or depression.5 These limitations are also generally more typical of older people.
The causes of loss of subjective wellbeing and mental health stress are specific to the individual. Generally people with poorer subjective health and wellbeing have lower levels of social capital (sense of trust and sharing, and attachment to local community) as well as fewer healthy lifestyle behaviours and lower socioeconomic status.172
What can be done to prevent it?Prevention requires strategic approaches in two main areas: enhancing protective factors and minimising risk factors. Enhancing protective factors involves the development and maintenance of behaviours that promote physical and psychological wellbeing. Higher levels of health and wellbeing are associated with social connectedness; specifically levels of trust and sharing in the local neighbourhood and a stronger sense of community identity.173 Interventions to enhance mental wellbeing should also include activities that promote physical health and wellbeing such as physical activity, good nutrition and maintaining a healthy body weight.
Minimising risk factors involves reduction and control of known causes and risk factors for deterioration in mental health and wellbeing. A whole of community approach is needed to reduce the most significant risk factors including alcohol consumption, use of illicit drugs, partner violence and childhood sexual abuse. Additional priorities include strategies to combat chronic stress and prevent chronic disease risk factors such as physical activity and healthy eating.
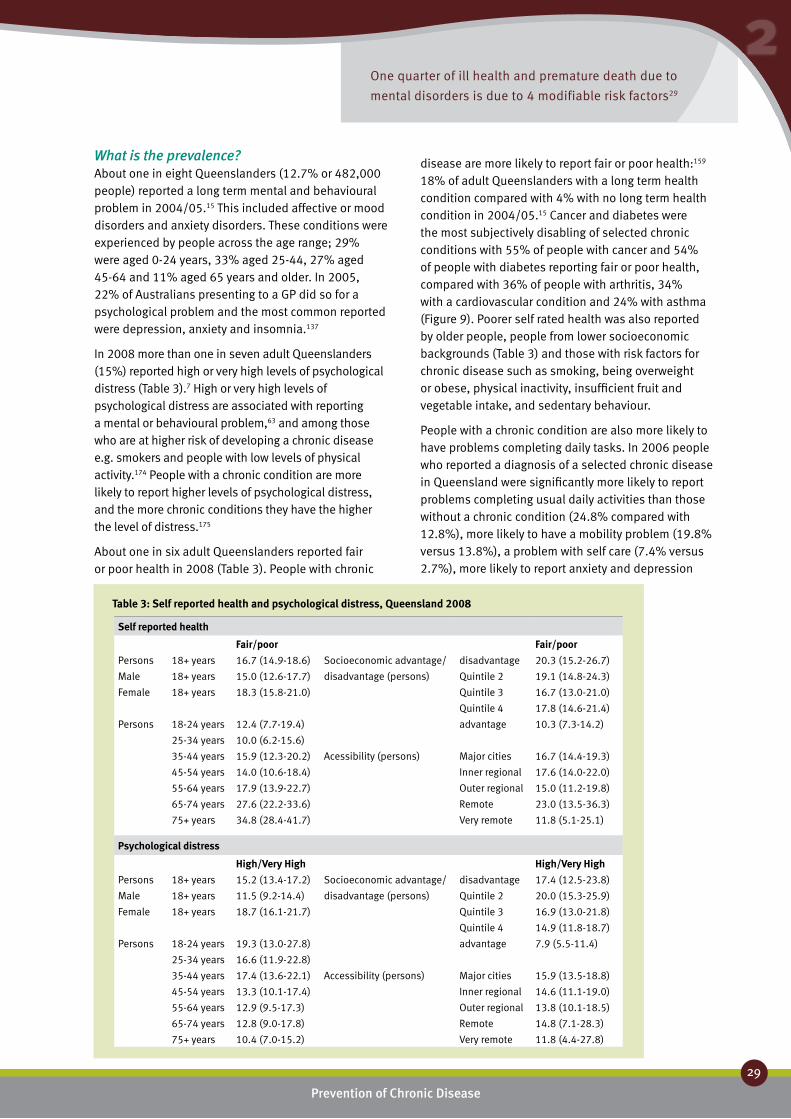
One quarter of ill health and premature death due to
mental disorders is due to 4 modifiable risk factors29
Report of the Chief Health Officer Queensland
2
What is the prevalence?About one in eight Queenslanders (12.7% or 482,000 people) reported a long term mental and behavioural problem in 2004/05.15 This included affective or mood disorders and anxiety disorders. These conditions were experienced by people across the age range; 29% were aged 0-24 years, 33% aged 25-44, 27% aged 45-64 and 11% aged 65 years and older. In 2005, 22% of Australians presenting to a GP did so for a psychological problem and the most common reported were depression, anxiety and insomnia.137
In 2008 more than one in seven adult Queenslanders (15%) reported high or very high levels of psychological distress (Table 3).7 High or very high levels of psychological distress are associated with reporting a mental or behavioural problem,63 and among those who are at higher risk of developing a chronic disease e.g. smokers and people with low levels of physical activity.174 People with a chronic condition are more likely to report higher levels of psychological distress, and the more chronic conditions they have the higher the level of distress.175
About one in six adult Queenslanders reported fair or poor health in 2008 (Table 3). People with chronic
disease are more likely to report fair or poor health:159 18% of adult Queenslanders with a long term health condition compared with 4% with no long term health condition in 2004/05.15 Cancer and diabetes were the most subjectively disabling of selected chronic conditions with 55% of people with cancer and 54% of people with diabetes reporting fair or poor health, compared with 36% of people with arthritis, 34% with a cardiovascular condition and 24% with asthma (Figure 9). Poorer self rated health was also reported by older people, people from lower socioeconomic backgrounds (Table 3) and those with risk factors for chronic disease such as smoking, being overweight or obese, physical inactivity, insufficient fruit and vegetable intake, and sedentary behaviour.
People with a chronic condition are also more likely to have problems completing daily tasks. In 2006 people who reported a diagnosis of a selected chronic disease in Queensland were significantly more likely to report problems completing usual daily activities than those without a chronic condition (24.8% compared with 12.8%), more likely to have a mobility problem (19.8% versus 13.8%), a problem with self care (7.4% versus 2.7%), more likely to report anxiety and depression
Prevention of Chronic Disease
29
Self reported health
Fair/poor Fair/poorPersons 18+ years 16.7 (14.9-18.6) Socioeconomic advantage/ disadvantage 20.3 (15.2-26.7)
Male 18+ years 15.0 (12.6-17.7) disadvantage (persons) Quintile 2 19.1 (14.8-24.3)
Female 18+ years 18.3 (15.8-21.0) Quintile 3 16.7 (13.0-21.0)
Quintile 4 17.8 (14.6-21.4)
Persons 18-24 years 12.4 (7.7-19.4) advantage 10.3 (7.3-14.2)
25-34 years 10.0 (6.2-15.6)
35-44 years 15.9 (12.3-20.2) Acessibility (persons) Major cities 16.7 (14.4-19.3)
45-54 years 14.0 (10.6-18.4) Inner regional 17.6 (14.0-22.0)
55-64 years 17.9 (13.9-22.7) Outer regional 15.0 (11.2-19.8)
65-74 years 27.6 (22.2-33.6) Remote 23.0 (13.5-36.3)
75+ years 34.8 (28.4-41.7) Very remote 11.8 (5.1-25.1)
Psychological distress
High/Very High High/Very HighPersons 18+ years 15.2 (13.4-17.2) Socioeconomic advantage/ disadvantage 17.4 (12.5-23.8)
Male 18+ years 11.5 (9.2-14.4) disadvantage (persons) Quintile 2 20.0 (15.3-25.9)
Female 18+ years 18.7 (16.1-21.7) Quintile 3 16.9 (13.0-21.8)
Quintile 4 14.9 (11.8-18.7)
Persons 18-24 years 19.3 (13.0-27.8) advantage 7.9 (5.5-11.4)
25-34 years 16.6 (11.9-22.8)
35-44 years 17.4 (13.6-22.1) Accessibility (persons) Major cities 15.9 (13.5-18.8)
45-54 years 13.3 (10.1-17.4) Inner regional 14.6 (11.1-19.0)
55-64 years 12.9 (9.5-17.3) Outer regional 13.8 (10.1-18.5)
65-74 years 12.8 (9.0-17.8) Remote 14.8 (7.1-28.3)
75+ years 10.4 (7.0-15.2) Very remote 11.8 (4.4-27.8)
Table 3: Self reported health and psychological distress, Queensland 2008

Half a million Queenslanders report a long term
mental or behavioural problem15
Report of the Chief Health Officer Queensland
30
Prevention of Chronic Disease
(35.6% versus 20.4%) and more likely to report experiencing moderate to severe pain (45.9%), than those without a chronic condition (35.9%).176
Is it the same for everyone?In the total population, mental and behavioural problems were more commonly reported by younger people.15 The age profile for anxiety and depression shows the burden of disease beginning in childhood and continuing into the middle years with generally a higher burden for females in most age groups (Figure 10). Indigenous people generally report poorer health.177
In 2008, older people were more likely to report poorer health as were people living in areas of socioeconomic disadvantage (Table 3).
Adult females were more likely to report high levels of psychological distress than males (62% more likely) in 2008, and generally, younger people report higher levels than older people (Table 3). People living in socioeconomically disadvantaged areas were more likely to report high levels of psychological distress.
How do we compare?Queenslanders had the second highest prevalence of long term mental and behavioural problems compared
Percentage of population
0 20 40 60 80 100
Cancer
Diabetes
Arthritis
CVD
Asthma
None
Percentage of population
0 20 40 60 80 100
15-24
25-34
35-44
45-54
55-64
64-74
75+
Current daily smoker
Overweight/obese
Sedentary/low exercise level
1 or less serves of vegetables
4 or less serves of vegetables
Risky/high alcohol risk
0 20 40 60 80 100
Fair or poor healthExcellent, good or very good health
Figure 9: Self-reported health, Queensland 2004/0515
Figure 10: Anxiety and depression burden of disease,
Queensland 2006
4000
3500
3000
2500
2000
1500
1000
500
0
Bur
den
of d
isea
se (D
ALY
s)
0-1
5-9
15-1
9
25-2
9
35-3
9
45-4
9
55-5
9
65-6
9
75-7
9
85-8
9
95-9
9
Age group
Male
Female
with other states and territories; the Queensland prevalence was 18% higher than the national average of 10.7% in 2004/05.154 Similarly a higher proportion of Queenslanders reported high or very high levels of psychological distress in 2004/05 compared to national reporting; 7% higher in adults aged 18-64 years and 28% higher in those aged 65 years and older.15,154 Queenslanders were more likely to report fair or poor health than the Australian population (about 6% higher).
What are the trends?Psychological distress is increasing, with a 30% increase in the proportion of people in Queensland who reported high or very high levels of psychological
Anxiety and depression is twice as common in people with
a chronic disease than those with no such disease5
Report of the Chief Health Officer Queensland Prevention of Chronic Disease
31
2
distress between 2004 and 2008.178,179 There are limited data on trends in other mental health conditions.
How is it projected to change?Anxiety and depression will remain a leading cause of burden of disease over the next 10 years. While the rate of burden is projected to remain steady over this time, the total burden will rise by 13% due to increased population. These projections are unlikely to reflect the potential impact of more generalised loss of wellbeing reported with certain chronic conditions such as diabetes projected to increase. In 2001 and 2004/05, people with diabetes and obese people were more likely to report fair or poor health than people with other chronic conditions or people without a chronic condition. Therefore it is likely that the obesity epidemic will have both a direct and an indirect effect on overall wellbeing.159 In addition, as the population ages, the proportion of people reporting fair or poor health is expected to increase given current patterns of loss of health and wellbeing with ageing (Table 3).
What are its impacts?The effect of loss of wellbeing and good mental health is difficult to measure, but includes social impacts on the individual and their family as well as a range of economic impacts from cost of services to reduced productivity.180 Chronic diseases impact on people across the life-course and are not limited to people in older age groups, and therefore include work related as well as social impacts.
Mental ill health is disabling. The cost of mental health problems are widely spread and often the
economic impact is greatest outside the health system.181 Productivity losses are estimated to be 2.5 times larger than health care costs.182 However evidence shows that treatment for anxiety and depression and migraine can result in substantial long term improvements in productivity.183
Challenges and opportunities?Loss of wellbeing generally, and depression specifically, is increasingly recognised as an emerging problem. It is considered to be growing directly in response to the stresses of modern life and indirectly as a result of the increasing prevalence of chronic disease. Remedying a lack of wellbeing and enhancing mental health at a population level will require a promotion, prevention and early intervention approach,184 to improve physical health and social connectedness, reduce alcohol misuse and illicit drug use, decrease domestic violence and childhood sexual abuse, and combat chronic disease and chronic stress.
The full impact of chronic stress in society is difficult to measure. However it is broadly accepted as a widespread and growing problem and has a major impact on productivity through days lost and loss of efficiency in role, as well as the direct medical cost of treatment.185 Addressing chronic stress and its associated manifestations are therefore likely to become a high priority in future.
Successful health and mental health promotion and intervention programs need to address all of these issues in systematic and creative ways to effectively protect against future mental health problems in the population.

Report of the Chief Health Officer Queensland
32
Prevention of Chronic Disease
Respiratory conditions ❚
COPDChronic obstructive pulmonary disease (COPD) is one of the key respiratory conditions affecting Queenslanders. In 2006 in Queensland COPD caused 2.9% of the total burden of disease and injury with 51% of this due to premature mortality and 49% to disability. COPD is a serious and progressive disease which involves destruction of lung tissue and narrowing of the air passages, causing chronic shortness of breath. The main form of COPD is emphysema. If a chronic cough is involved COPD may be referred to as chronic bronchitis.186
What causes it?The main cause of COPD is tobacco smoking. About 62.8% of COPD is caused by smoking,187 and in Australia in 2003 about three quarters of COPD deaths were due to tobacco smoke.164 The risk of the disease increases with increasing tobacco use. Other risk factors may worsen respiratory symptoms or increase the risk of developing the disease, either independently or combined with smoking. These factors include exposure to air pollution including passive tobacco smoke, and exposure to occupational dusts and chemicals. The symptoms of COPD can be worsened by respiratory infections such as influenza and pneumonia.186
What could be done to prevent it?The most important preventive measure is to not smoke. Stopping smoking, even late in the course of the disease, may slow the rate of decline in respiratory function. Within several months of quitting smoking, coughing and other respiratory symptoms decrease and lung function increases.45 Vaccination against influenza and pneumococcal disease may reduce the risks of exacerbation of COPD.186
What is the prevalence?The prevalence of COPD is difficult to determine with accuracy due to variability in definitions and data collection methods used. The prevalence for COPD in Queensland was estimated at 3.7% in 2004/05, using self report.15 In a recent study in Adelaide, 65.6% of the COPD cases were previously undiagnosed, with about half having moderate or severe COPD.34
In Queensland in 2006/07 there were 9670 hospitalisations for COPD with 76% in people aged 65
years and older. In 2006 there were 736 deaths due to COPD with 88% in people aged 65 years and older.
Is it the same for everyone?COPD is a disease that manifests mid to late in the life course (Figure 11). For those aged 65 years and older, 9.8% of males and 8.6% of females reported COPD (bronchitis or emphysema) as a long term condition in 2004/05 in Queensland.15
In 2005-06 in Queensland, death rates due to COPD were higher in males than females (double the rate), in areas of greater socioeconomic disadvantage (31% higher than advantaged areas), in remote areas (70% higher than in major cities) and in areas of greater proportion of Indigenous people (200% higher). If everyone had the same rates of death for COPD as those in advantaged areas, in 2005-06 about 100 deaths in people aged less than 75 years could have been avoided. Similar differences were seen in hospitalisation rates for COPD across these population groups (Figure 12). Much of this excess relates to substantially higher smoking rates in areas of disadvantage in Queensland.
How do we compare?Compared to other states and territories, Queensland prevalence rates for COPD were similar to national rates in 2004/05.15,154 It is difficult to make direct comparisons with other countries due to differences in definitions and data collection methods. However for death rates for bronchitis, asthma and emphysema, Australia was ranked 13th lowest out of 26 OECD countries in 2001-03.121
3000
2500
2000
1500
1000
500
0
Rate
(per
100
,000
per
sons
)
0-4
10-1
4
20-2
4
30-3
4
40-4
4
50-5
4
60-6
4
70-7
4
80-8
4
COPD
Asthma
Age group (years)
Figure 11: Hospitalisation rates due to COPD and asthma,
Queensland 2005/06-2006/071

Many people with COPD still smoke – COPD patients over 40 years
were twice as likely to smoke as those without the disease34
Report of the Chief Health Officer Queensland Prevention of Chronic Disease
33
2
What are the trends?Death rates for COPD in the total population decreased by 6.4% per year for males between 2000 and 2006, with no change in female death rates. Male rates were about two times higher than female rates. A similar pattern was evident in hospitalisation rates; with a 3.7% decline each year for males and no change in female hospitalisation rates between 2000/01 and 2006/07. As a result male rates are now closer to female rates compared to earlier periods. Hospitalisation rates were about 50% higher in males in 2006 whereas they were nearly twice the female rate in 2000. These changes in COPD rates in males and females reflect changes in smoking prevalence in recent decades.
How is it projected to change?
The total burden of disease associated with COPD in Queensland is projected to increase by 10% between 2006 and 2016, while the rate of burden (disease burden per head) is expected to decrease by 20%.
What is its impact?Deaths due to COPD are classified as completely avoidable, given existing health and social systems in Australia, either through prevention, early detection, treatment or any combination of these.78 COPD was the cause of 4% of avoidable deaths among people aged 0-74 years in 2005-06 in Queensland.
COPD was the principal diagnosis associated with 9670 hospitalisations in Queensland in 2006/07.
All hospitalisations due to COPD are classified as potentially avoidable, either through prevention or access to timely and effective primary care.79,82 COPD related hospitalisations were 8.5% of all ambulatory care sensitive hospitalisations in 2006/07.
COPD is responsible for several hundred million dollars of health care expenditure in Australia each year. Most of the cost is related to the number of hospitalisations (9670 hospitalisations in Queensland in 2006/07) and the length of stay required (average 7.2 days per hospitalisation in Queensland in 2006). A large proportion of COPD hospitalisations follow emergency admission. The disease is not managed very often in general practice.186
Challenges and opportunities?COPD is a major cause of disability, hospitalisations and deaths particularly in persons aged 65 years and older. In a recent Adelaide study, the prevalence of current smoking in those with COPD was similar to those without COPD in the age group under 40 years.34 In older age groups, smoking prevalence in the COPD cases was nearly double (30.4%) compared with those without COPD (16.6%).188 Smokers with COPD were more likely to be male, of lower educational status and on lower incomes.188 While similar data are not available in Queensland, it remains important to note that in 2007 in Queensland, one in six people aged 14 years and older reported smoking daily (17.2%).26 Thus, continued efforts to reduce smoking prevalence will support declines in the burden of COPD.
1500
1000
500
0Rate
(per
100
,000
per
sons
)
Asthma
Pers
ons
Mal
esFe
mal
es
Mos
t dis
adva
ntag
edQ
uint
ile 2
Qui
ntile
3Q
uint
ile 4
Mos
t adv
anta
ged
Maj
or c
itie
sIn
ner r
egio
nal
Out
er re
gion
alRe
mot
eVe
ry re
mot
e
<1%
Indi
geno
us1-
10%
Indi
geno
us10
-20%
Indi
geno
us20
-40%
Indi
geno
us>4
0% In
dige
nous
COPD
Pers
ons
Mal
esFe
mal
es
Mos
t dis
adva
ntag
edQ
uint
ile 2
Qui
ntile
3Q
uint
ile 4
Mos
t adv
anta
ged
Maj
or c
itie
sIn
ner r
egio
nal
Out
er re
gion
alRe
mot
eVe
ry re
mot
e
<1%
Indi
geno
us1-
10%
Indi
geno
us10
-20%
Indi
geno
us20
-40%
Indi
geno
us>4
0% In
dige
nous
1500
1000
500
0
Figure 12: Hospitalisations for COPD and asthma, Queensland 2005/06-2006/071

Report of the Chief Health Officer Queensland
34
Prevention of Chronic Disease
Percentage PercentagePerson 18+years 9.9 (8.2-12.0) persons aged 18+ years
Male 18+years 6.8 (4.8-9.5) SEIFA most disadvantaged 6.9 (4.1-11.4)
Female 18+years 13.0 (10.3-16.3) quintile 2 9.5 (6.1-14.6)
quintile 3 5.2 (3.1-8.7)
Persons (years) 18-29 14.7 (9.8-21.5) quintile 4 6.2 (3.8-9.9)
30-39 9.9 (6.7-14.3) advantaged 5.8 (3.4-9.8)
40-49 8.7 (5.7-12.9)
50-59 7.1 (4.4-11.2) ARIA Major city 11.3 (8.8-14.4)
60-69 10.0 (5.8-16.5) Inner/Outer regional 9.1 (6.7-12.3)
70+ 8.6 (3.4-19.3) Remote/Very remote 4.0 (1.6-9.4)
*age adjusted
Table 4: Asthma prevalence* based on self report, Queensland 2006176
Asthma Asthma is a chronic respiratory disease causing episodes of wheezing, chest tightness and shortness of breath due to widespread narrowing of the airways and obstruction to airflow. The underlying problem is usually inflammation of the air passages which become sensitive to a wide range of triggers. The symptoms are variable and usually reversible, either spontaneously or with treatment.189
In 2006 in Queensland, asthma was responsible for 2.5% of the total burden of disease and injury and was almost entirely due to ill health or disability (95%), rather than premature mortality. Asthma is a leading cause of disease burden in children and young people.
What causes it?The underlying causes of asthma are still not well understood and there is no known cure. Known factors that may increase the risk include environmental exposures such as tobacco smoke, specific allergens including dust mites and mould spores, physical inactivity and stressful life events.189
What could be done to prevent it?It is well established that exposure to relevant allergens may trigger an asthma attack and/or worsen asthma symptoms. However it remains uncertain whether manipulation of these factors can actually prevent asthma from developing.190 Factors associated with an increased incidence of asthma include a genetic predisposition, allergen sensitisation and exposure (house dust mites, possibly pet exposure) and tobacco smoke exposure. Factors associated with a reduced incidence of asthma include exclusive breastfeeding for six months, or use of partially or extensively hydrolysed
hypoallergenic infant feeding formulas, and diets high in omega-3 fatty acids (found in fish oils).190
Under the supervision of a GP, asthma can largely be controlled. Asthma management, including medications, and education continue to improve. Written asthma action plans have been shown to greatly improve the outcomes of asthma and reduce attacks.191
What is the prevalence?In 2006, the prevalence of asthma in Queensland adults was 10.2% (crude prevalence or 9.9% age adjusted).176 Prevalence was higher in females than males; 13% and 6.8% respectively (age adjusted). The prevalence varied across the age range (Table 4).
In Queensland in 2006/07 there were 5663 hospitalisations for asthma, with 51% for children aged 0-14 years. While asthma deaths occur in all age groups, few children die from asthma in Queensland (around three per year), and the risk of dying from asthma increases with age with 40% of the 63 deaths from asthma in 2006 occurring in people aged 65 years and older.
Is it the same for everyone?Asthma was the largest cause of the burden of disease in Queensland children aged 1-14 years in 2006, accounting for 25% of the total burden in this age group.
Asthma is a disease that manifests in childhood although it continues across the life course (Figure 11). Asthma was more prevalent in younger age groups, affecting 12.3% of Queensland children aged 0-14 years, about 10% of those aged 15-64 years and about 8% of those aged 65 years and older in 2004/05.15 In children aged 0-14 years, asthma is more common

All hospitalisations due to asthma are
preventable by primary health care
Report of the Chief Health Officer Queensland Prevention of Chronic Disease
35
2
in boys than girls. In adults in 2006 in Queensland, the prevalence of asthma in females is double that in males and was generally higher in socioeconomically disadvantaged areas and in major cities (Table 4).
Indigenous people (particularly older adults) have a higher prevalence of asthma (16.5%)152 than other Australians (10.2%).154 People born in countries other than Australia had a lower prevalence of asthma (7%) compared to those born in Australia (11.2%).154 Rates of hospitalisation for asthma in the total population were 38% higher in socioeconomically disadvantaged areas, 82% higher in remote and very remote areas than major cities and at least 20% higher in areas with greater proportion of Indigenous population than areas with less than 1% Indigenous population (Figure 12).
How do we compare?Compared to other states and territories in 2004/05, the self reported overall prevalence of asthma as a long term condition was similar in Queensland to the national prevalence (10.2%).15 Similarly Queensland death rates for asthma were similar to national rates, both for the total population and for those aged 5-34 years in 2004/05. The prevalence of asthma in Queensland and Australia is high by international standards.189
What are the trends?The prevalence of asthma in Australia increased through the 1980s and 1990s but evidence suggests this trend may have stabilised and even reversed in children.189 Of note, in Queensland between 2000 and 2006 rates of death for asthma in females decreased by 9.8% per year. Male rates also decreased but the rate of change was not significant. A similar pattern was evident in the age group 5-34 years, with overall decline of 9.2% per year between 2000 and 2006.
Hospitalisation rates for asthma decreased by 6.4% per year between 2000/01 and 2006/07 and the rate of decrease was similar for males and females.
Children aged 0-4 years, were more likely to visits GPs or emergency departments for asthma compared to other age groups. However the overall rate of GP visits for asthma has been decreasing over the past 10 years, with the largest reduction in children aged 0-4 years.186
How is it projected to change?The total burden of disease associated with asthma in Queensland is projected to increase by 15% between 2006 and 2016, where this is due to increasing size and age of the Queensland population rather than change in asthma prevalence.
What is its impact?All hospitalisations due to asthma are classified as preventable by health care provided in an ambulatory care setting such as general practice or community health.79 In 2006/07 there were about 5,700 hospitalisations for asthma in Queensland with half (51%) occurring in children aged 0-14 years. The average length of stay for asthma for children in public hospitals was 1.5 days, where for older people (65 years and older) it was 3.9 days. Asthma is most commonly managed in general practice. GPs are usually the first point of contact for asthma management and also provide support and ongoing care. Asthma is one of the most common reasons for visiting a GP. In 2005/06, about 1.6% of all GP visits were asthma-related (2.3 asthma related GP visits per 100 visits).192
In order to assist GPs to provide a coordinated approach to asthma management, asthma is one of the conditions available under the Chronic Disease Management – Practice and Service Incentives Payments. In May 2007, about 90% of general practices in Queensland had signed on to the Asthma Practice Incentives Program with higher participation in targeted areas of special need.147
People with asthma report poorer general health and quality of life than people without asthma. More people with asthma suffer with anxiety and depression than people without asthma. Asthma can result in time off work or school and some restriction of participation in physical and social activities.189
Challenges and opportunities?The burden of asthma in Queensland could be reduced by reducing tobacco smoking and increased use of asthma management plans for both adults and children. Despite the known additional health risks, just as many people with asthma smoke as people without asthma. In addition, around 40% of children who have asthma live with smokers and are likely to be exposed to passive smoke.189

Hospitalisations for renal dialysis will
increase by 400% in 20 years
Report of the Chief Health Officer Queensland
36
Prevention of Chronic Disease
Other preventable ❚
chronic conditionsIn addition to the major diseases described above, there are a number of other conditions broadly included under the heading of chronic disease. These include: chronic kidney disease or renal disease, musculoskeletal conditions and gastro-oesophageal reflux disease. In addition to these chronic conditions, there are a number of key conditions and issues associated with ageing. These include falls and neurological problems such as dementia and adult onset hearing loss and vision loss.
Adult onset hearing loss is among the top three conditions causing burden of disease and injury in middle aged and older men,27 but is generally not considered in the suite of chronic diseases. Similarly, dementia is a key issue for older men and women, but has low levels of preventability. Falls while a common problem in older people, are not a chronic disease. In Queensland in 2006, about one in four people aged 65 years and older reported having had a fall in the previous 12 months and about half of these had more than one fall.193 Falls led to about 19,000 hospitalisations in Queensland each year with rates of hospitalisations for falls in older people increasing at the rate of 2.2% per year since 2000. Additionally, while oral health issues are important and of great importance to Queensland children, in recognition of the planned introduction of fluoride into Queensland’s water, oral health will be addressed in future reports when data becomes available on the impact and effectiveness of the intervention.
While these conditions are important, this report is about preventable chronic diseases and thus will not be further discussed. Instead this section focuses on the preventable chronic conditions of chronic kidney disease, and arthritis and musculoskeletal conditions.
Chronic kidney diseaseChronic kidney disease has been an important health issue for many years. It is marked by the long term and usually irreversible loss of kidney function.194 As kidney disease often lacks symptoms in its early stages it is not commonly recognised by the general
population and its diagnosis may be delayed or missed. While chronic kidney disease is considered preventable and treatable, it can also progress to end stage kidney disease (ESKD). At this point the function of the kidneys is insufficient to sustain life. Such cases require kidney replacement therapy, such as kidney transplant or dialysis. The impact of ESKD is largely measured by kidney replacement therapy statistics using the Australian and New Zealand National End Stage Renal Disease Registry (ANZDATA).
What can be done to prevent it?While chronic kidney disease is a serious and costly disease it is also considered highly preventable.194 Reducing the human and economic burden of this disease will rely heavily on preventing the onset and progression of disease. People with diabetes are at greater risk of developing chronic kidney disease, therefore factors which put people at risk of diabetes (i.e. overweight and obesity and physical inactivity) also put people at risk of chronic kidney disease.88 The prevalence in 2000 of chronic kidney disease was three times as high in those with diabetes as those without diabetes.195 Similarly, people with metabolic syndrome (that is central obesity, insulin resistance, high blood pressure and cholesterol abnormalities) are 2.6 times more likely to have chronic kidney disease as those without this syndrome.196 Primary prevention of chronic kidney disease involves reducing the incidence of risk factors such as diabetes and high blood pressure. For example, limiting sodium intake by eliminating table salt, cooking salt and salty processed foods is effective in reducing blood pressure in people with existing high blood pressure.197
Secondary prevention involves measures for early detection to allow prompt and effective intervention to prevent the disease becoming established. The goal of tertiary prevention is to manage established disease to minimise complications and reduce impairment and disability.
What is the prevalence and impacts?Chronic kidney disease is the presence of kidney damage and reduced kidney function measured by Glomerular Filtration Rate (GFR).194 Measuring the prevalence of chronic kidney disease can only be confirmed using biomedical methods. Based on blood and urine tests in 2000, 16.2% of Australians aged 25 years and older had some level of kidney damage.195 According to the ANZDATA, 0.07% of Australians in
One in three Queenslanders have a musculoskeletal condition
such as arthritis or back pain, for at least 6 months15
Report of the Chief Health Officer Queensland Prevention of Chronic Disease
37
2
this age group had ESKD in 2005.198 In Queensland, there were 455 new cases of ESKD commencing treatment in 2005 (11.2 per 100,000 people).149,
198 Indigenous people in Queensland have far higher rates of chronic kidney disease, and in some Indigenous communities are up to 30 times the rate for the non-Indigenous population.194
In 2000-01 it was estimated that the total Australian recurrent expenditure on chronic kidney disease was $647 million.194 The majority of this (about 60%), was associated with hospital services for dialysis, a further 20% for non-dialysis hospital services, 13% for pharmaceuticals and 4% for out of hospital medical services. The number of people in Queensland with chronic kidney failure is growing by 6% per year,149 and the resultant treatment costs are expected to increase by $35 million over the next 10 years.199
Challenges and opportunities?The impact of chronic kidney disease is projected to increase markedly in the next decades as rising levels of overweight and obesity contribute to a higher prevalence of diabetes. This will affect a larger number of people and create further pressure on limited health services. Hospitalisations for renal failure are projected to double in Queensland in the 20 year period between 2006/07 and 2026/2027, while for renal dialysis they are projected to nearly quadruple from 170,000 to 660,000 hospitalisations per year.158
Arthritis and musculoskeletal conditionsArthritis and musculoskeletal conditions are the world’s most common cause of severe long term pain and physical disability.200 The two most common types of arthritis are osteoarthritis and rheumatoid arthritis. Osteoarthritis affects mostly the spine, hips, knees and hands. Rheumatoid arthritis is a chronic systemic condition, with the most prominent feature being inflammation of joints particularly the hands.
What can be done to prevent it?Increasing physical activity levels and specifically weight bearing and muscle strengthening activities are considered protective in managing arthritis and
other musculoskeletal problems. It is acknowledged such activity will not necessarily prevent them. To help prevent osteoarthritis, it is important to avoid joint injury or overuse of joints in activities such as repetitive kneeling, heavy lifting or squatting.201
What is the prevalence and impacts?In 2004/05 one in three Queenslanders reported having arthritis, back pain or other musculoskeletal condition of at least six months duration, with 16% of Queenslanders reporting arthritis.15 The prevalence of arthritis was higher in females than males (18% compared with 14% respectively).15 The prevalence of arthritis increases with age. About 17% or 633,000 Queenslanders reported a long term back problem in 2004/05. Back pain prevalence begins to increase in the teenage years and peaks in the middle years.
In 2005, 17% of Australians presenting to a GP did so for arthritis where osteoarthritis was the most common reason.137 Back complaints were also a common cause of GP encounter, accounting for about 8% of GP presentations in 2005.137 Arthritis and back pain were often identified as co-morbid conditions when people presented to a GP for other chronic conditions.23
Almost one third of the burden of disease due to musculoskeletal conditions was due to osteoarthritis (33%), 30% due to acute and chronic back pain and 16% due to rheumatoid arthritis. Arthritis imposes a substantial burden on people with disease, community organisations, insurance companies and governments.201 Many of these expenses are indirect costs and are not directly quantifiable. It is estimated that the indirect financial cost of osteoarthritis in 2007 was in excess of $7 billion.201 In 2007 the total cost of arthritis to the Australian economy is estimated to be $23.9 billion, where almost half of this is due to the non-financial cost, with health system spending estimated to be about 20% and about 17% in productivity losses, reflecting the impact of arthritis on employment and workforce participation.202 In 2008, taking into account the full effects of osteoarthritis specifically, the total cost in Queensland is estimated to be about $4.6 billion,3 including $3.1 billion in lost wellbeing and $1.5 billion in direct financial costs.

Report of the Chief Health Officer Queensland
38
Prevention of Chronic Disease
Challenges and opportunities?Arthritis and musculoskeletal conditions have a high level of impact on the individual and on the health system. Arthritis is a major cause of pain and discomfort for many people with very high levels of indirect and direct costs. The burden due to osteoarthritis, rheumatoid arthritis and back pain is projected to increase by about 35% between 2006 and 2016, although rate of burden will remain steady.

One third (31.6%) of the total impact of ill health and premature death in Queensland
is due to the combined effect of 13 measurable and preventable risk factors29
Report of the Chief Health Officer Queensland Prevention of Chronic Disease
39
Risk factors for chronic disease
c h a p t e rt h r e e
the physiological risk factors of high blood pressure and high blood cholesterol. Other risk factors that may exacerbate chronic disease, such as stress, are discussed in Chapter 2: Chronic disease. The prevalence of smoking, alcohol misuse, insufficient fruit and vegetable consumption, insufficient physical activity, and overweight and obesity for each Health Service District of Queensland have been previously reported.205
To prevent chronic disease it is important to assess which risk factors are most influential and amenable to intervention. Thirteen measurable and preventable risk factors cause one third (31.6%) of the total impact of ill health and premature death in Queensland.29 As the total impact of poor nutrition is not measurable, this proportion of burden of disease caused by preventable risk factors is an underestimate. The majority (87%) of this measured impact is due to behavioural risk factors.29 Smoking and physical inactivity are the largest single causes of burden of disease. Poor diet is estimated to cause at least 16% of the burden of disease, similar to that caused by cardiovascular disease or cancer (Figure 13). The burden of disease due to socioeconomic disadvantage in Queensland is also similar.
In 2008, over a 24 year period, 28% of early deaths in women could be attributed to smoking and 55% to the combined effect of smoking, being overweight, inactive, and poor diet.50 Similar findings could also apply to males. The risk of death from cardiovascular disease was 8.2 times higher among women with these risk factors than those without and risk of death from cancer was 3.3 times higher. All the women in the study were aged 34 to 59 years and free of cardiovascular disease or cancer at commencement.
Smoking ❚
Overweight and obesity ❚
Nutrition ❚
Physical inactivity and sedentary behaviour ❚
Alcohol ❚
High blood pressure ❚
High blood cholesterol ❚
Individual responsibility can have its full effect only when individuals have equitable access to healthy life, and are supported to make healthy choices – WHO8
Reducing risks to health has been a preoccupation of people and their physicians and politicians throughout history. It can be traced back at least 5000 years to some of the world’s earliest civilizations.141 It has never been more relevant than today.
Strategies to prevent chronic disease statewide and nationally, place a strong emphasis on prevention and management of modifiable risk.203 Health behaviours are an important determinant of both current and future health status of the population and are modifiable actions that impact on health in the short and long term. Strategies to modify these behaviours must recognise that people’s choices, and even their own understanding of their own individual capacities for change, are shaped by their social histories and circumstances.204
There are many possible definitions of ‘risk’. In this report we use the definition of the World Health Organization (WHO), defining it as ‘a probability of an adverse outcome, or a factor that raises this possibility’.141
For chronic disease, there are a small number of risk factors common to many diseases. This chapter will focus on the major behavioural risk factors of smoking, overweight and obesity, alcohol misuse, poor diet, physical inactivity and sedentary behaviour, as well as
In th
is c
hapt
er:
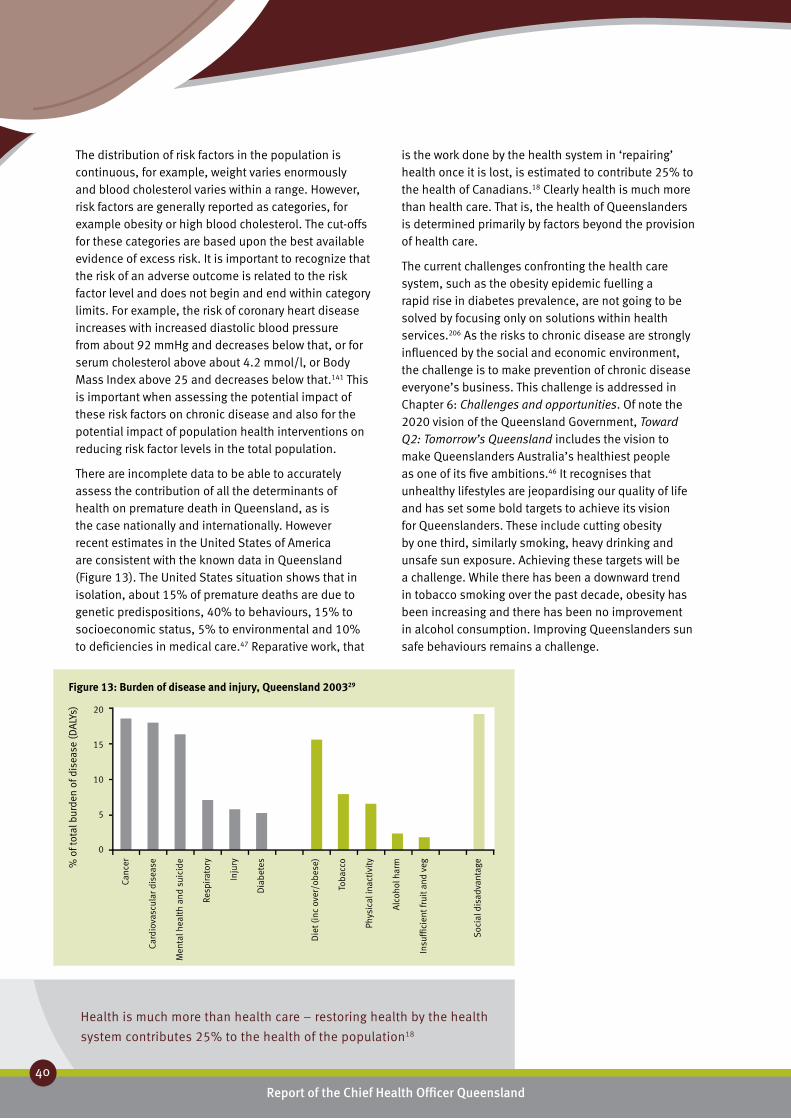
Report of the Chief Health Officer Queensland
40
Prevention of Chronic Disease
Health is much more than health care – restoring health by the health
system contributes 25% to the health of the population18
The distribution of risk factors in the population is continuous, for example, weight varies enormously and blood cholesterol varies within a range. However, risk factors are generally reported as categories, for example obesity or high blood cholesterol. The cut-offs for these categories are based upon the best available evidence of excess risk. It is important to recognize that the risk of an adverse outcome is related to the risk factor level and does not begin and end within category limits. For example, the risk of coronary heart disease increases with increased diastolic blood pressure from about 92 mmHg and decreases below that, or for serum cholesterol above about 4.2 mmol/l, or Body Mass Index above 25 and decreases below that.141 This is important when assessing the potential impact of these risk factors on chronic disease and also for the potential impact of population health interventions on reducing risk factor levels in the total population.
There are incomplete data to be able to accurately assess the contribution of all the determinants of health on premature death in Queensland, as is the case nationally and internationally. However recent estimates in the United States of America are consistent with the known data in Queensland (Figure 13). The United States situation shows that in isolation, about 15% of premature deaths are due to genetic predispositions, 40% to behaviours, 15% to socioeconomic status, 5% to environmental and 10% to deficiencies in medical care.47 Reparative work, that
Canc
er
Card
iova
scul
ar d
isea
se
Men
tal h
ealt
h an
d su
icid
e
Resp
irato
ry
Inju
ry
Dia
bete
s
Die
t (in
c ov
er/o
bese
)
Toba
cco
Phys
ical
inac
tivi
ty
Alc
ohol
har
m
Insu
ffici
ent f
ruit
and
veg
Soc
ial d
isad
vant
age
20
15
10
5
0
% o
f tot
al b
urde
n of
dis
ease
(DA
LYs)
Figure 13: Burden of disease and injury, Queensland 200329
is the work done by the health system in ‘repairing’ health once it is lost, is estimated to contribute 25% to the health of Canadians.18 Clearly health is much more than health care. That is, the health of Queenslanders is determined primarily by factors beyond the provision of health care.
The current challenges confronting the health care system, such as the obesity epidemic fuelling a rapid rise in diabetes prevalence, are not going to be solved by focusing only on solutions within health services.206 As the risks to chronic disease are strongly influenced by the social and economic environment, the challenge is to make prevention of chronic disease everyone’s business. This challenge is addressed in Chapter 6: Challenges and opportunities. Of note the 2020 vision of the Queensland Government, Toward Q2: Tomorrow’s Queensland includes the vision to make Queenslanders Australia’s healthiest people as one of its five ambitions.46 It recognises that unhealthy lifestyles are jeopardising our quality of life and has set some bold targets to achieve its vision for Queenslanders. These include cutting obesity by one third, similarly smoking, heavy drinking and unsafe sun exposure. Achieving these targets will be a challenge. While there has been a downward trend in tobacco smoking over the past decade, obesity has been increasing and there has been no improvement in alcohol consumption. Improving Queenslanders sun safe behaviours remains a challenge.

Smoking rates decreased by 13% in 3 years – taking into account
population growth this is about 87,000 fewer smokers26
Report of the Chief Health Officer Queensland Prevention of Chronic Disease
41
3
Smoking ❚Tobacco smoking is a leading cause of preventable death in Queensland. Smoking substantially increases the risk of lung cancer and 13 other cancers, cardiovascular disease, stroke and chronic lung disease. Tobacco smoke contains over 4000 chemicals. As well as tar and nicotine, these harmful chemicals include carbon monoxide, ammonia and arsenic. At least 60 of the chemicals in tobacco smoke are known to cause cancer, including cancer of the lung, throat, mouth, bladder and kidney.207
Tobacco is highly addictive. More than 90% of Australians who currently smoke began as teenagers,208 and about 90% of adult Australian smokers now say that they wish they had never started using tobacco products.209 People who start smoking in their teens are more likely to become lifelong smokers than those who take up smoking later.53 While smokers are generally aware that tobacco smoking is harmful, many still underestimate the extent of the danger relative to other lifestyle risks.210
What causes it?Smoking tobacco is influenced by a combination of health and social determinants and individual risk and protective factors. The highly addictive nature of tobacco contributes significantly to ongoing use.
What can be done to prevent it?Smoking rates, and the impact of smoking related illness on the population, are reduced through efforts to prevent the uptake of smoking by young people, reducing exposure to environmental tobacco smoke and supporting smokers to quit.
Reduction of tobacco smoking requires the regulation of tobacco in terms of advertising, points of sale and taxes, promotion of Quit and Smokefree messages, reduction in smoke free environments, equitable access to cessation services and treatment, and community support and education to reduce tobacco smoking: these are all part of the National Tobacco Strategy 2004-2009.210
Tobacco use in Queensland is being targeted via a multi-strategy approach to tobacco control. For more information see Chapter 5: Prevention works - Smoking.
What is the prevalence?In 2007 one in six (17.2%) Queenslanders aged 14 years and older reported smoking daily (Table 5).
Among teenagers aged 14-19 years, 5.7% of males and 13.1% of females reported smoking daily. The average age that people reported taking up smoking was 15.6 years.211 The proportion of ex-smokers was 25.7%.
Is it the same for everyone?Rates of daily smoking in Queensland in 2007 were highest in the age range 20-49 years (about 21%) and declined to 10% among people aged 60 years and older (Table 5). Smoking rates were generally higher among males than females in most age groups. The exception was for teenagers aged 14-19 years, where smoking rates were more than twice as high among females although this difference was not statistically significant.
Socioeconomic status is strongly associated with smoking rates. Rates of daily smoking in areas of socioeconomic advantage and disadvantage in Queensland are not yet available for the 2007 data. In 2004 daily smoking rates were two fold higher in disadvantaged areas than advantaged areas.63 Similarly using the most recently available data, in 2004 smoking rates were 50% higher in remote and very remote areas of the state, compared with the major cities.
Smoking rates are high amongst labourers and related workers. In 2004/05, the prevalence of Australian workers who smoked ranged from 14% to 43% for males and 13% to 35% for females. Male labourers and related workers were the most likely to be current smokers (43%) and male professionals were the least likely (14%). Similarly, female labourers and related workers were the most likely to be current smokers (35%) and female professionals were the least likely (13%).212
Male Female Persons
18+ years 20.0 (17.9- 22.3) 15.8 (14.2-17.5) 17.9 (16.5-19.3)
12+ years 18.3 (16.3-20.4) 14.9 (13.4-16.6) 16.6 (15.3-17.9)
12-19 years 4.3 (2.0-9.0) 9.9 (6.2-15.4) 7.0 (4.7-10.3)
12-15 1.7 (0.4-6.8) 5.7 (2.4-12.9) 3.6 (1.7-7.5)
16-17 5.2 (1.2-19.5) 10.3 (4.5-21.7) 7.7 (3.7-15.3)
18-19 8.6 (2.7-24.3) 17.9 (8.3-34.4) 13.2 (7.0-23.5)
14+ years 18.9 (16.9-21.1) 15.4 (13.9-17.1) 17.2 (15.9-18.5)
14-19 5.7 (2.7-11.9) 13.1 (8.3-20.3) 9.3 (6.3-13.7)
20-29 28.3 (22.2-35.4) 17.5 (13.6-22.4) 23.0 (19.2-27.3)
30-39 23.0 (17.9-29.1) 16.9 (13.5-21.0) 19.9 (16.8-23.5)
40-49 22.5 (17.7- 28.3) 21.6 (17.4-26.4) 22.1 (18.8- 25.7)
50-59 20.0 (15.7-25.3) 14.1 (10.8-18.2) 17.1 (14.2-20.3)
60+ 10.3 (8.0-13.3) 9.8 (7.5-12.6) 10.0 (8.3-12.0)
Table 5: Daily smokers, Queensland 2007211

Despite recent decline, smoking rates in Queensland
are about 4% higher than the national average26
Report of the Chief Health Officer Queensland
42
Prevention of Chronic Disease
Indigenous people have high smoking rates. In 2004/05, half of the Australian adult Indigenous population (50%) were daily smokers.152 Rates of daily smoking were similar for Indigenous men and women (51% and 49%). Indigenous men in remote areas were more likely than those in non-remote areas to smoke on a daily basis (58% compared with 49%).
About one in five women smoked during pregnancy in 2005-06 (20.5%).213 Smoking rates among teenage pregnant women were more than double those for all mothers who gave birth in Queensland in 2005-2006; 44% compared with 20.5%.213 Similarly smoking rates among Aboriginal pregnant women (58%) and Torres Strait Islander women (43%) were higher than overall smoking rates. Quitting rates were low: 6.3% of all women who smoked quit by 20 weeks, while 3.1% of Indigenous women quit. Among all those who smoked during pregnancy, 42% or 4724 women smoked 10 or more cigarettes per day.
How do we compare?Queensland has the third highest proportion of daily smokers of the states and territories of Australia.26 In 2007, the rates of smoking in Queensland were about 4% higher than the national average. At this time, 18.9% of Queensland males aged 14 years and older reported smoking daily compared with 18.0% of Australian males, and 15.4% of Queensland females aged 14 years and older reported smoking daily compared with 15.2% of Australian females.
Queensland rates of smoking during pregnancy (20%) were higher than the national average (17%), and higher than ACT (15%), NSW (14%) and WA (17%).214 Queensland rates were lower than the Northern Territory (31%), Tasmania (28%) and South Australia (23%).
What are the trends?Daily smoking rates are continuing to decline. In the three year period between 2004 and 2007 there was a 2.6 percentage point decrease in the proportion of Queenslanders aged 14 years and older smoking daily from 19.8% to 17.2%.26,215 In this three year period, smoking rates in Queensland declined by 13% resulting in about 87,000 fewer smokers in 2007 than would have been expected if the decline had not occurred. This takes into account population growth between the two periods. Even if population growth is not considered, in 2007 there were about 37,500 fewer people smoking than in 2004. About two thirds (64%) of the national decline in smoking rates between 2004 and 2007 was associated with fewer Queenslanders smoking. The proportion of people who have never smoked increased from 49.4% in 2004 to 54.5% in 2007. There was a decrease in the proportion of ex-smokers from 27.9% in 2004 to 25.7% in 2007.
Over the longer time period, between 2001 and 2007, smoking rates in Queensland have decreased by 20% (Figure 2e).
How is it projected to change?Rate of smoking among males has been steadily declining since the early 1970s while female rates peaked in the late 1970s and have been steadily declining since.216 While the number of smokers in the current population is decreasing, the impact of smoking prevalence in earlier decades is still affecting people and the health system in 2008 due to the long lag time between exposure and effect. Of note 67% of smoking related deaths in 2006 occurred in people aged 75 years or older. Ongoing tobacco control efforts will continue to tackle the smoking problem and work to decrease the prevalence of smoking in the population.
Figure 14: Disease burden due to tobacco smoking, Queensland 2006
7000
6000
5000
4000
3000
2000
1000
0
Age (years)
0-1 10-14 25-29 40-44 55-59 70-74 85-89 100
StrokeCoronary heart diseaseCOPDChronic respiratory diseaseLung cancer
4000
3000
2000
1000
0
Bur
den
of d
isea
se (D
ALY
s)
Males Females
Age (years)
0-1 10-14 25-29 40-44 55-59 70-74 85-89 100

One in five women smoke during pregnancy
Report of the Chief Health Officer Queensland Prevention of Chronic Disease
43
3
160
140
120
100
80
60
40
20
0
Rate
(per
100
,000
per
sons
)
Deaths (2005-06)
Pers
ons
Mal
e
Fem
ale
Mos
t dis
adva
ntag
ed
Qui
ntile
2
Qui
ntile
3
Qui
ntile
4
Leas
t dis
adva
ntag
ed
Maj
or c
itie
s
Inne
r reg
iona
l
Out
er re
gion
al
Rem
ote
Very
rem
ote
2000
1500
1000
500
0
Hospitalisations (2005/06-2006/07)
Pers
ons
Mal
es
Fem
ales
Mos
t dis
adva
ntag
ed
Qui
ntile
2
Qui
ntile
3
Qui
ntile
4
Leas
t dis
adva
ntag
ed
Maj
or c
itie
s
Inne
r reg
iona
l
Out
er re
gion
al
Rem
ote
Very
rem
ote
Figure 15: Deaths and hospitalisations due to tobacco smoking, Queensland1,77
What are its impacts?Smoking was a leading contributor to overall burden of disease in Queensland in 2003 (8.1%), contributing 10% of the total burden for males and 5.9% for females.29 It was also the largest individual contributor to cancer burden (Figure 14).29 Smoking causes about 80% of lung cancer, 11.3% of coronary heart disease and 62.8% of chronic obstructive pulmonary disease.187 Reduction in smoking will improve health outcomes and management of chronic disease.
In 2005-06, there were on average 3485 deaths per year due to tobacco smoking in Queensland with 66% of these being male. Almost one in five of all male deaths in Queensland in 2006 were caused by smoking and one in ten of all female deaths. Rates of death for smoking related conditions varied across population groups: male rates were two and a half times the female rates, rates in most socioeconomically disadvantaged areas were 43% higher than least disadvantaged areas, and rates in remote areas were at least 40% higher than rates in major cities (Figure 15). About 1480 smoking related deaths occurred in people aged less than 75 years, 43% of all such deaths. Within this age group, 36% or 529 deaths were due to socioeconomic disadvantage and 5% or about 85 deaths were related to living outside cities. Death rates for smoking related conditions in Queensland decreased by 3.3% per year between 2000 and 2006 (4.3% per year for males and 1.8% for females), consistent with decreases in male death rates due lung cancer and chronic obstructive pulmonary disease. Female death rates for these two conditions did not decline over the period.
Smoking resulted in an average 34,138 hospitalisations per year in Queensland in 2005/06-2006/07. Rates of hospitalisation varied across population groups: male rates were double the female rates, rates in most socioeconomically disadvantaged areas were 70% higher than least disadvantaged areas, and rates in remote areas were double the rates in major cities (Figure 15). Rates of hospitalisation for smoking related conditions in Queensland decreased by 1.7% per year between 2000 and 2006 (2.5% per year for males and 0.5% for females).
In Queensland in the first quarter of 2008, there were about 46,554 hospital bed nights due to smoking (68% in public hospitals). If this hospital burden had been prevented, there would be greater capacity to meet the needs of the 36,030 people waiting for elective surgery in the same period (where 9% were classified as urgent or Category 1, 40% were semi-urgent or Category 2 and 50% were Category 3).217
While the total impact of tobacco smoking on disease burden increases markedly after age 40 and is increasingly evident in older age groups (Figure 14), effects begin in foetal life and continue across the life course.218 Smoking during pregnancy doubles the risk of low birth weight,219,220 placental complications and risk of pre-term birth.218 Exposure to passive smoking in young children increases the risk of SIDS, middle ear

In Queensland in the first quarter of 2008, there were 46,554 hospital bed nights due to smoking (68% in
public hospitals). At the same time there were 36,030 people waiting for elective surgery (where 9% were
classified as urgent or Category 1, 40% were semi urgent or Category 2 and 50% were Category 3)
Report of the Chief Health Officer Queensland
44
Prevention of Chronic Disease
It is critical to address smoking rates in sub-populations where smoking prevalence remains high: Indigenous people, pregnant women, and labourers and related workers. To be effective, tobacco control strategies need to reach all Queenslanders who smoke. For more information on tobacco prevention programs, see Chapter 5: Prevention works - Smoking
Of particular importance are strategies to target the high rates of smoking among Indigenous people in Queensland. Currently, the SmokeCheck program trains health professionals in the delivery of brief interventions for Indigenous smokers. In addition, the Event Support Program, which promotes a positive smoke-free message at local Indigenous sporting and cultural events, is valuable for preventing uptake of smoking amongst young people.
There is overwhelming evidence about the benefits of helping mothers to reduce smoking. There remains a need to address this issue in Queensland particularly among younger mothers and Indigenous mothers. About one in five of all mothers and half of Indigenous mothers smoke through their pregnancy and very few quit by 20 weeks. Reducing these very high smoking rates in these groups during pregnancy represents a key opportunity to achieve better health outcomes for mothers and infants.
disease, respiratory illnesses, as well as development of asthma and onset of asthma attacks.221
In 2004/05 tobacco was conservatively estimated to cost the Australian economy $31.5 billion, representing more than half of all drug costs nationally.48 On a pro-rata basis, this is $6.3 billion in Queensland.
Challenges and opportunities?Around one in six Queenslanders smoke daily. Given the impact of smoking on ill health and death there is significant reason to keep building on recent gains achieved by intensive tobacco control efforts. For example, if the proportion of people who smoke in Queensland was reduced by five percentage points, at least 10,800 Queensland lives and $225.8 million in treatment costs for cancer, chronic obstructive pulmonary disease and cardiovascular disease alone would be saved over the next 30 years.53
The health benefits of quitting smoking are numerous. Within several months of quitting there is a decrease in coughing and other respiratory systems and increase in lung function.45,51 Quitting smoking leads to a large and rapid fall in the risk of heart, stroke and vascular disease.52 One year after quitting, excess risk of heart disease is reduced by half. The risk of stroke is reduced by about 60% after five years of not smoking. Ten years after quitting, the lung cancer death rate is about half that of a current smoker. Fifteen years after quitting an ex-smoker’s risk for heart disease is about the same as that of a non-smoker.

63% of men and 51% of women are
overweight or obese2
Report of the Chief Health Officer Queensland Prevention of Chronic Disease
45
3
Overweight and obesity ❚Overweight is caused by an imbalance in energy. Although many factors may influence an individual’s weight, at a basic level an individual will gain weight when over a sufficient period, the energy intake from their diet exceeds the energy expended through daily living and physical activity.222
There are recommended weight ranges for adults and children and once an individual exceeds these healthy levels there is an increase in their risk of chronic disease.141 The recommended weights for adults of differing heights have been combined into a measure of Body Mass Index (BMI), and categories of acceptable and unacceptable weight are described below. For children, overweight and obesity are defined using international definitions.223 Healthy weight is also assessed by waist circumference (WC). WC more closely measures intra-abdominal fat and central fatness than BMI224,225 and intra-abdominal fat is more closely related to disease risk than general body fat.224 There is an increased risk of metabolic complications such as diabetes and chronic conditions such as heart disease and some
Weight for height chart for men and women aged 18-64 years
© Reproduced with the permission of The Australian Nutrition Foundation Inc (Nutrition Australia)
cancers if WC for men is 94 cm or greater and 80 cm or greater for women.41,42 The risk of these chronic diseases increases if WC exceeds 102 cm and 88 cm respectively. The risk of diabetes is increased by 4.5 times for men and 3.8 times for women if WC exceeds 102 cm and 88 cm respectively.41,42
What causes it?In general, overweight and obesity is caused by lack of physical activity or inappropriate eating patterns, or a combination of both. The increase in overweight and obesity in recent decades has been caused by a combination of factors – technological, social and economic – that result in reduced physical activity and increased consumption of high energy food and drinks. Although obesity has a strong genetic link, the large increase in obesity in recent years comes from non-genetic factors.
Economic factors influence food selection, as indicated by the relationship between obesity prevalence and socioeconomic status. Computer modelling of the French national diet found that consumers on a low food budget were more likely to select a diet high in energy (or energy dense foods).226 In the USA, the per capita increase in the number of restaurants accounted for 61% of the increase in BMI and 65% of the increase in obesity.227 Lower relative food costs, especially for processed energy dense foods and sweetened drinks, and the proliferation of fast food restaurants offering large portions of low-cost energy dense foods have probably made a significant contribution to the obesity epidemic. Social, workforce, technological and broader economic developments have contributed to these changes in the food economy.228
The term ‘obesogenic environment’ has been coined to describe the environment in which we now live. In recent years we have had greater access to high fat and refined carbohydrate diets, and an increasingly sedentary lifestyle.
What can be done to prevent it?Prevention of overweight and obesity requires integrated interventions that both enhance the quality of diets and increase physical activity. Details of what can be done to address poor diet and insufficient physical activity are described in the following sections: Nutrition, and Physical inactivity and
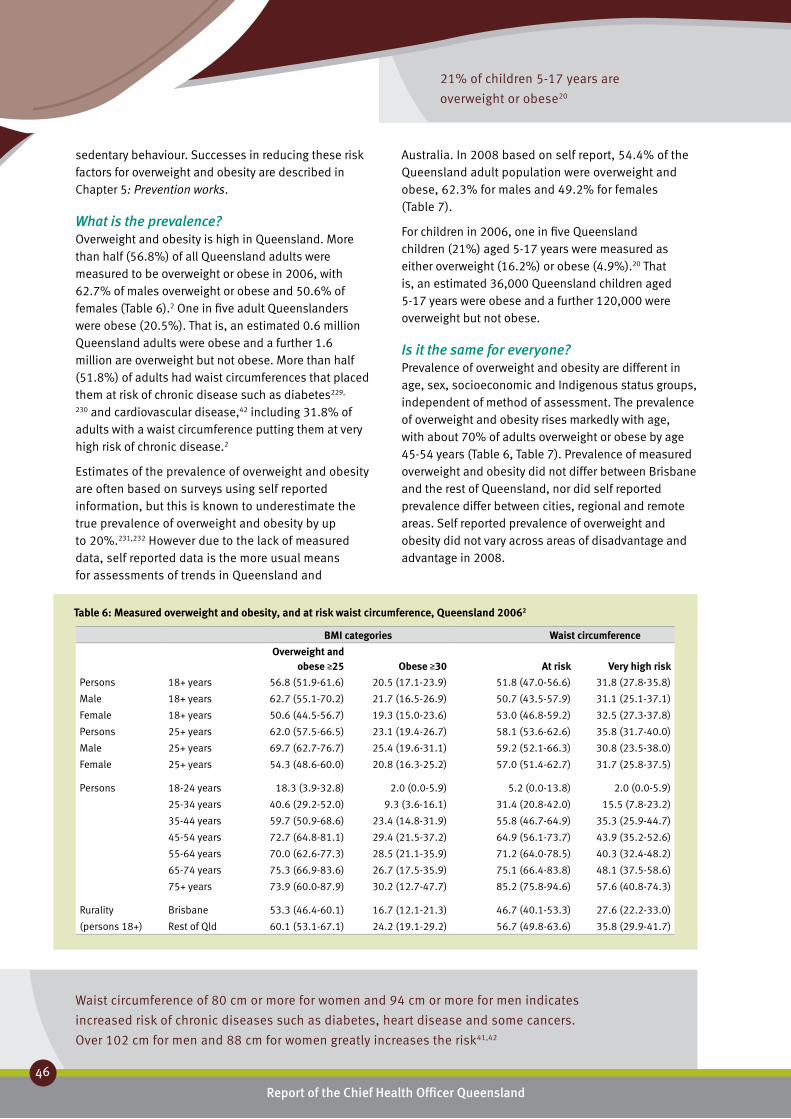
Waist circumference of 80 cm or more for women and 94 cm or more for men indicates
increased risk of chronic diseases such as diabetes, heart disease and some cancers.
Over 102 cm for men and 88 cm for women greatly increases the risk41,42
21% of children 5-17 years are
overweight or obese20
Report of the Chief Health Officer Queensland
46
Prevention of Chronic Disease
sedentary behaviour. Successes in reducing these risk factors for overweight and obesity are described in Chapter 5: Prevention works.
What is the prevalence?Overweight and obesity is high in Queensland. More than half (56.8%) of all Queensland adults were measured to be overweight or obese in 2006, with 62.7% of males overweight or obese and 50.6% of females (Table 6).2 One in five adult Queenslanders were obese (20.5%). That is, an estimated 0.6 million Queensland adults were obese and a further 1.6 million are overweight but not obese. More than half (51.8%) of adults had waist circumferences that placed them at risk of chronic disease such as diabetes229,
230 and cardiovascular disease,42 including 31.8% of adults with a waist circumference putting them at very high risk of chronic disease.2
Estimates of the prevalence of overweight and obesity are often based on surveys using self reported information, but this is known to underestimate the true prevalence of overweight and obesity by up to 20%.231,232 However due to the lack of measured data, self reported data is the more usual means for assessments of trends in Queensland and
Australia. In 2008 based on self report, 54.4% of the Queensland adult population were overweight and obese, 62.3% for males and 49.2% for females (Table 7).
For children in 2006, one in five Queensland children (21%) aged 5-17 years were measured as either overweight (16.2%) or obese (4.9%).20 That is, an estimated 36,000 Queensland children aged 5-17 years were obese and a further 120,000 were overweight but not obese.
Is it the same for everyone?Prevalence of overweight and obesity are different in age, sex, socioeconomic and Indigenous status groups, independent of method of assessment. The prevalence of overweight and obesity rises markedly with age, with about 70% of adults overweight or obese by age 45-54 years (Table 6, Table 7). Prevalence of measured overweight and obesity did not differ between Brisbane and the rest of Queensland, nor did self reported prevalence differ between cities, regional and remote areas. Self reported prevalence of overweight and obesity did not vary across areas of disadvantage and advantage in 2008.
BMI categories Waist circumference
Overweight and obese ≥25
Obese ≥30
At risk
Very high risk
Persons 18+ years 56.8 (51.9-61.6) 20.5 (17.1-23.9) 51.8 (47.0-56.6) 31.8 (27.8-35.8)
Male 18+ years 62.7 (55.1-70.2) 21.7 (16.5-26.9) 50.7 (43.5-57.9) 31.1 (25.1-37.1)
Female 18+ years 50.6 (44.5-56.7) 19.3 (15.0-23.6) 53.0 (46.8-59.2) 32.5 (27.3-37.8)
Persons 25+ years 62.0 (57.5-66.5) 23.1 (19.4-26.7) 58.1 (53.6-62.6) 35.8 (31.7-40.0)
Male 25+ years 69.7 (62.7-76.7) 25.4 (19.6-31.1) 59.2 (52.1-66.3) 30.8 (23.5-38.0)
Female 25+ years 54.3 (48.6-60.0) 20.8 (16.3-25.2) 57.0 (51.4-62.7) 31.7 (25.8-37.5)
Persons 18-24 years 18.3 (3.9-32.8) 2.0 (0.0-5.9) 5.2 (0.0-13.8) 2.0 (0.0-5.9)
25-34 years 40.6 (29.2-52.0) 9.3 (3.6-16.1) 31.4 (20.8-42.0) 15.5 (7.8-23.2)
35-44 years 59.7 (50.9-68.6) 23.4 (14.8-31.9) 55.8 (46.7-64.9) 35.3 (25.9-44.7)
45-54 years 72.7 (64.8-81.1) 29.4 (21.5-37.2) 64.9 (56.1-73.7) 43.9 (35.2-52.6)
55-64 years 70.0 (62.6-77.3) 28.5 (21.1-35.9) 71.2 (64.0-78.5) 40.3 (32.4-48.2)
65-74 years 75.3 (66.9-83.6) 26.7 (17.5-35.9) 75.1 (66.4-83.8) 48.1 (37.5-58.6)
75+ years 73.9 (60.0-87.9) 30.2 (12.7-47.7) 85.2 (75.8-94.6) 57.6 (40.8-74.3)
Rurality Brisbane 53.3 (46.4-60.1) 16.7 (12.1-21.3) 46.7 (40.1-53.3) 27.6 (22.2-33.0)
(persons 18+) Rest of Qld 60.1 (53.1-67.1) 24.2 (19.1-29.2) 56.7 (49.8-63.6) 35.8 (29.9-41.7)
Table 6: Measured overweight and obesity, and at risk waist circumference, Queensland 20062
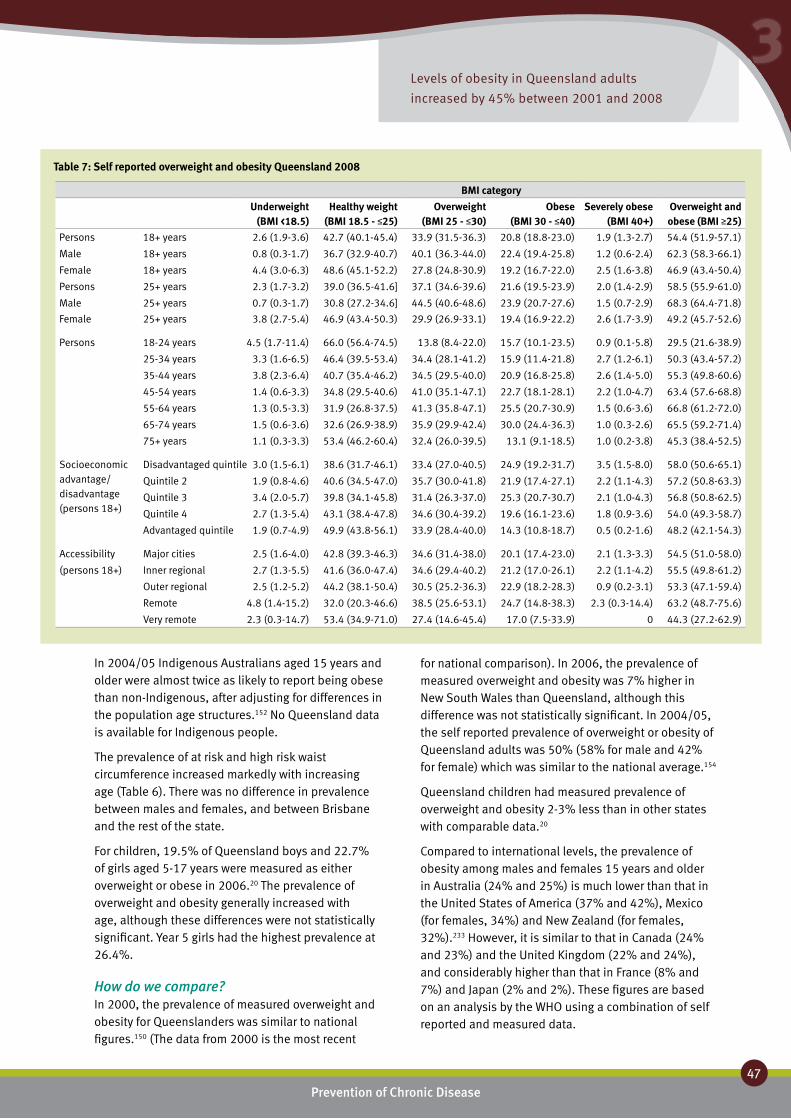
Report of the Chief Health Officer Queensland Prevention of Chronic Disease
47
3Levels of obesity in Queensland adults
increased by 45% between 2001 and 2008
In 2004/05 Indigenous Australians aged 15 years and older were almost twice as likely to report being obese than non-Indigenous, after adjusting for differences in the population age structures.152 No Queensland data is available for Indigenous people.
The prevalence of at risk and high risk waist circumference increased markedly with increasing age (Table 6). There was no difference in prevalence between males and females, and between Brisbane and the rest of the state.
For children, 19.5% of Queensland boys and 22.7% of girls aged 5-17 years were measured as either overweight or obese in 2006.20 The prevalence of overweight and obesity generally increased with age, although these differences were not statistically significant. Year 5 girls had the highest prevalence at 26.4%.
How do we compare?In 2000, the prevalence of measured overweight and obesity for Queenslanders was similar to national figures.150 (The data from 2000 is the most recent
for national comparison). In 2006, the prevalence of measured overweight and obesity was 7% higher in New South Wales than Queensland, although this difference was not statistically significant. In 2004/05, the self reported prevalence of overweight or obesity of Queensland adults was 50% (58% for male and 42% for female) which was similar to the national average.154
Queensland children had measured prevalence of overweight and obesity 2-3% less than in other states with comparable data.20
Compared to international levels, the prevalence of obesity among males and females 15 years and older in Australia (24% and 25%) is much lower than that in the United States of America (37% and 42%), Mexico (for females, 34%) and New Zealand (for females, 32%).233 However, it is similar to that in Canada (24% and 23%) and the United Kingdom (22% and 24%), and considerably higher than that in France (8% and 7%) and Japan (2% and 2%). These figures are based on an analysis by the WHO using a combination of self reported and measured data.
BMI category
Underweight (BMI <18.5)
Healthy weight (BMI 18.5 - ≤25)
Overweight (BMI 25 - ≤30)
Obese (BMI 30 - ≤40)
Severely obese (BMI 40+)
Overweight and obese (BMI ≥25)
Persons 18+ years 2.6 (1.9-3.6) 42.7 (40.1-45.4) 33.9 (31.5-36.3) 20.8 (18.8-23.0) 1.9 (1.3-2.7) 54.4 (51.9-57.1)
Male 18+ years 0.8 (0.3-1.7) 36.7 (32.9-40.7) 40.1 (36.3-44.0) 22.4 (19.4-25.8) 1.2 (0.6-2.4) 62.3 (58.3-66.1)
Female 18+ years 4.4 (3.0-6.3) 48.6 (45.1-52.2) 27.8 (24.8-30.9) 19.2 (16.7-22.0) 2.5 (1.6-3.8) 46.9 (43.4-50.4)
Persons 25+ years 2.3 (1.7-3.2) 39.0 (36.5-41.6] 37.1 (34.6-39.6) 21.6 (19.5-23.9) 2.0 (1.4-2.9) 58.5 (55.9-61.0)
Male 25+ years 0.7 (0.3-1.7) 30.8 (27.2-34.6] 44.5 (40.6-48.6) 23.9 (20.7-27.6) 1.5 (0.7-2.9) 68.3 (64.4-71.8)
Female 25+ years 3.8 (2.7-5.4) 46.9 (43.4-50.3) 29.9 (26.9-33.1) 19.4 (16.9-22.2) 2.6 (1.7-3.9) 49.2 (45.7-52.6)
Persons 18-24 years 4.5 (1.7-11.4) 66.0 (56.4-74.5) 13.8 (8.4-22.0) 15.7 (10.1-23.5) 0.9 (0.1-5.8) 29.5 (21.6-38.9)
25-34 years 3.3 (1.6-6.5) 46.4 (39.5-53.4) 34.4 (28.1-41.2) 15.9 (11.4-21.8) 2.7 (1.2-6.1) 50.3 (43.4-57.2)
35-44 years 3.8 (2.3-6.4) 40.7 (35.4-46.2) 34.5 (29.5-40.0) 20.9 (16.8-25.8) 2.6 (1.4-5.0) 55.3 (49.8-60.6)
45-54 years 1.4 (0.6-3.3) 34.8 (29.5-40.6) 41.0 (35.1-47.1) 22.7 (18.1-28.1) 2.2 (1.0-4.7) 63.4 (57.6-68.8)
55-64 years 1.3 (0.5-3.3) 31.9 (26.8-37.5) 41.3 (35.8-47.1) 25.5 (20.7-30.9) 1.5 (0.6-3.6) 66.8 (61.2-72.0)
65-74 years 1.5 (0.6-3.6) 32.6 (26.9-38.9) 35.9 (29.9-42.4) 30.0 (24.4-36.3) 1.0 (0.3-2.6) 65.5 (59.2-71.4)
75+ years 1.1 (0.3-3.3) 53.4 (46.2-60.4) 32.4 (26.0-39.5) 13.1 (9.1-18.5) 1.0 (0.2-3.8) 45.3 (38.4-52.5)
Socioeconomic advantage/ disadvantage (persons 18+)
Disadvantaged quintile 3.0 (1.5-6.1) 38.6 (31.7-46.1) 33.4 (27.0-40.5) 24.9 (19.2-31.7) 3.5 (1.5-8.0) 58.0 (50.6-65.1)
Quintile 2 1.9 (0.8-4.6) 40.6 (34.5-47.0) 35.7 (30.0-41.8) 21.9 (17.4-27.1) 2.2 (1.1-4.3) 57.2 (50.8-63.3)
Quintile 3 3.4 (2.0-5.7) 39.8 (34.1-45.8) 31.4 (26.3-37.0) 25.3 (20.7-30.7) 2.1 (1.0-4.3) 56.8 (50.8-62.5)
Quintile 4 2.7 (1.3-5.4) 43.1 (38.4-47.8) 34.6 (30.4-39.2) 19.6 (16.1-23.6) 1.8 (0.9-3.6) 54.0 (49.3-58.7)
Advantaged quintile 1.9 (0.7-4.9) 49.9 (43.8-56.1) 33.9 (28.4-40.0) 14.3 (10.8-18.7) 0.5 (0.2-1.6) 48.2 (42.1-54.3)
Accessibility Major cities 2.5 (1.6-4.0) 42.8 (39.3-46.3) 34.6 (31.4-38.0) 20.1 (17.4-23.0) 2.1 (1.3-3.3) 54.5 (51.0-58.0)
(persons 18+) Inner regional 2.7 (1.3-5.5) 41.6 (36.0-47.4) 34.6 (29.4-40.2) 21.2 (17.0-26.1) 2.2 (1.1-4.2) 55.5 (49.8-61.2)
Outer regional 2.5 (1.2-5.2) 44.2 (38.1-50.4) 30.5 (25.2-36.3) 22.9 (18.2-28.3) 0.9 (0.2-3.1) 53.3 (47.1-59.4)
Remote 4.8 (1.4-15.2) 32.0 (20.3-46.6) 38.5 (25.6-53.1) 24.7 (14.8-38.3) 2.3 (0.3-14.4) 63.2 (48.7-75.6)
Very remote 2.3 (0.3-14.7) 53.4 (34.9-71.0) 27.4 (14.6-45.4) 17.0 (7.5-33.9) 0 44.3 (27.2-62.9)
Table 7: Self reported overweight and obesity Queensland 2008
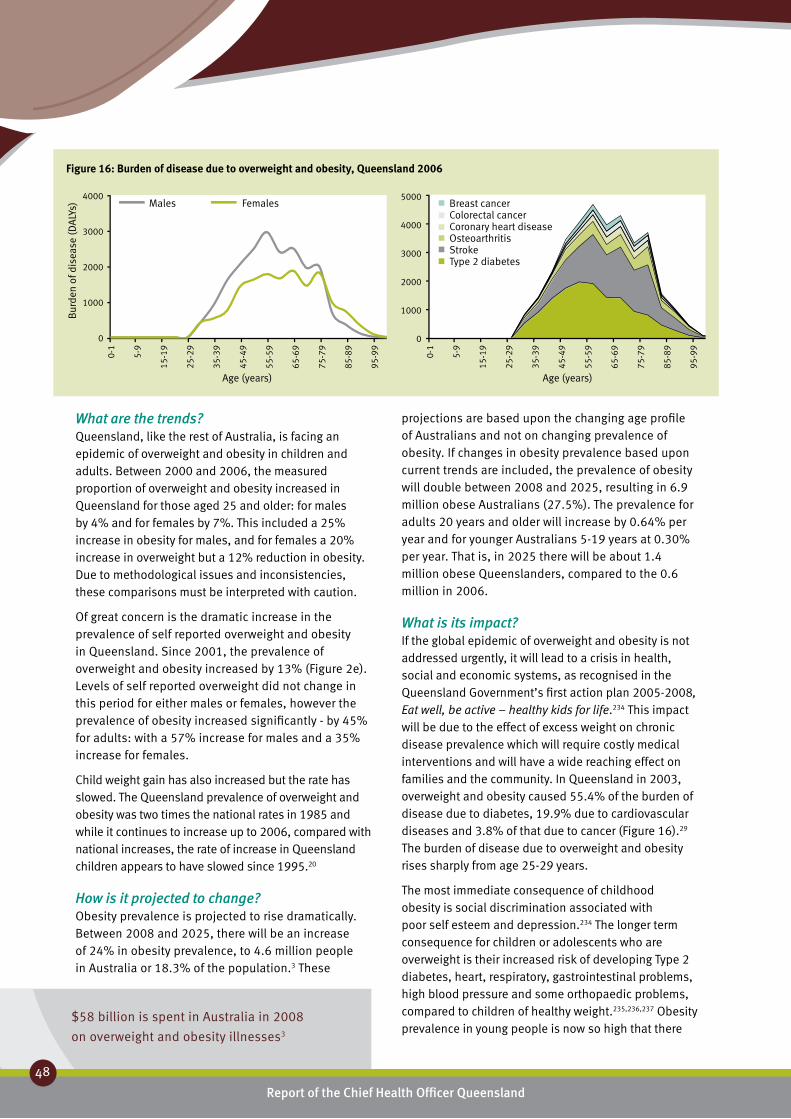
$58 billion is spent in Australia in 2008
on overweight and obesity illnesses3
Report of the Chief Health Officer Queensland
48
Prevention of Chronic Disease
What are the trends?Queensland, like the rest of Australia, is facing an epidemic of overweight and obesity in children and adults. Between 2000 and 2006, the measured proportion of overweight and obesity increased in Queensland for those aged 25 and older: for males by 4% and for females by 7%. This included a 25% increase in obesity for males, and for females a 20% increase in overweight but a 12% reduction in obesity. Due to methodological issues and inconsistencies, these comparisons must be interpreted with caution.
Of great concern is the dramatic increase in the prevalence of self reported overweight and obesity in Queensland. Since 2001, the prevalence of overweight and obesity increased by 13% (Figure 2e). Levels of self reported overweight did not change in this period for either males or females, however the prevalence of obesity increased significantly - by 45% for adults: with a 57% increase for males and a 35% increase for females.
Child weight gain has also increased but the rate has slowed. The Queensland prevalence of overweight and obesity was two times the national rates in 1985 and while it continues to increase up to 2006, compared with national increases, the rate of increase in Queensland children appears to have slowed since 1995.20
How is it projected to change?Obesity prevalence is projected to rise dramatically. Between 2008 and 2025, there will be an increase of 24% in obesity prevalence, to 4.6 million people in Australia or 18.3% of the population.3 These
projections are based upon the changing age profile of Australians and not on changing prevalence of obesity. If changes in obesity prevalence based upon current trends are included, the prevalence of obesity will double between 2008 and 2025, resulting in 6.9 million obese Australians (27.5%). The prevalence for adults 20 years and older will increase by 0.64% per year and for younger Australians 5-19 years at 0.30% per year. That is, in 2025 there will be about 1.4 million obese Queenslanders, compared to the 0.6 million in 2006.
What is its impact?If the global epidemic of overweight and obesity is not addressed urgently, it will lead to a crisis in health, social and economic systems, as recognised in the Queensland Government’s first action plan 2005-2008, Eat well, be active – healthy kids for life.234 This impact will be due to the effect of excess weight on chronic disease prevalence which will require costly medical interventions and will have a wide reaching effect on families and the community. In Queensland in 2003, overweight and obesity caused 55.4% of the burden of disease due to diabetes, 19.9% due to cardiovascular diseases and 3.8% of that due to cancer (Figure 16).29 The burden of disease due to overweight and obesity rises sharply from age 25-29 years.
The most immediate consequence of childhood obesity is social discrimination associated with poor self esteem and depression.234 The longer term consequence for children or adolescents who are overweight is their increased risk of developing Type 2 diabetes, heart, respiratory, gastrointestinal problems, high blood pressure and some orthopaedic problems, compared to children of healthy weight.235,236,237 Obesity prevalence in young people is now so high that there
Figure 16: Burden of disease due to overweight and obesity, Queensland 2006
4000
3000
2000
1000
0
Bur
den
of d
isea
se (D
ALY
s)
0-1
5-9
15-1
9
25-2
9
35-3
9
45-4
9
55-5
9
65-6
9
75-7
9
85-8
9
95-9
9Age (years)
Males Females5000
4000
3000
2000
1000
0
Age (years)
Breast cancerColorectal cancerCoronary heart diseaseOsteoarthritisStrokeType 2 diabetes
0-1
5-9
15-1
9
25-2
9
35-3
9
45-4
9
55-5
9
65-6
9
75-7
9
85-8
9
95-9
9
Australia spends less than $1 per person per year on preventing obesity
and $70 per person per year on treating the consequences35
Report of the Chief Health Officer Queensland Prevention of Chronic Disease
49
3
are credible predictions that this generation of children will be the first to have shorter life expectancy than their parents.238 In the coming decades, life expectancy may be shortened by two to five years, as the obese who are now at younger ages carry their elevated risk of death into middle and older ages.
The cost of obesity is very high. Ten obesity related diseases were included in the 15 diseases which drove the 56% increase in health care expenditure in Australia between 1987 and 2000.74 The total cost of obesity to the Australian society and governments in 2008 is $58 billion with 20% or $11.6 billion spent in Queensland.3 The direct financial cost in Australia is estimated to be $8.3 billion including $2 billion in the health system (2.3% of total expenditure on health services in 2005-06) and $3.6 billion in productivity costs. Thus the net cost of loss of wellbeing is valued at $50 billion with about $10 billion in Queensland. This is an increase of 42% from the 2005 Australian costs.
Funds directed towards dealing with the consequences of obesity are significantly greater than funds spent on preventing this disease. In 2003 it was reported that the health sector in Australia “probably spends less than $1 per person per year on preventing obesity, against $70 per person per year on treating the consequences”.35
Challenges and opportunities?Overweight and obesity pose a major risk to long term health by increasing the risk of chronic diseases such as Type 2 diabetes, cardiovascular disease and some cancers.239 Strong growth in the prevalence of diabetes is likely over the next 20 years, mostly as a direct result of increasing levels of overweight and obesity.54 It has been estimated that if all overweight or obese Australians lost 5 kg, there would be a $44 million saving per year in health care costs associated with Type 2 diabetes and its complications alone.240 A modest weight loss of 5-10% of starting body weight is sufficient to achieve clinically relevant health benefits.241 The challenge of increasing healthy weight in Queensland is discussed in Chapter 6: Challenges and opportunities.

Report of the Chief Health Officer Queensland
50
Prevention of Chronic Disease
Nutrition ❚Nutrition is an important determinant of health and wellbeing of the population. Optimum nutrition is essential for the normal growth and the physical and cognitive development of infants and children, healthy weight, enhanced resilience and quality of life, good physical and mental health throughout life, resistance to infection, and protection against chronic disease and premature death.242 A balanced diet, as recommended in the NHMRC Dietary Guidelines series, includes consuming a variety of nutritious foods and drinks to provide appropriate levels of protective dietary components. These components include micro and macro nutrients, and avoiding excessive consumption of energy dense nutrient-poor foods including those high in salt, saturated fats and sugars.17,21
Nutrition data are limited in Queensland and Australia. Currently data are unavailable for important aspects of nutrition including: energy intake; intake of key food groups including milk and dairy products, meat and alternatives; “junk” food and drinks; intakes of salt, saturated fat, sugars, folate, calcium, iron, dietary fibre etc. The lack of data has affected the degree to which nutrition issues can be considered in this report.
Nutrition and chronic diseaseThere has been no complete dietary data collected for Queensland adults since 1995 and so this section will focus on the key public health priorities of fruit and vegetable consumption and breastfeeding. Further information on the nutrition of Queensland children is reported from the 2006 Healthy Kids Queensland survey,16 and the 1995 National Nutrition Survey.243 Of note, a subsequent national adult survey is planned for 2010 which will provide Queensland data.
Increasing the fruit and vegetable consumption of Queenslanders is a key public health priority. Eating
sufficient daily serves of fruit and vegetables is one of the key nutritional indicators of chronic disease prevention.244 Fruit and vegetables are rich in substances including fibre, vitamins, minerals and other factors which enhance health and protect against disease. A higher intake of fruit and vegetables is also associated with lower consumption of substances like saturated fat in the diet. Eating vegetables and fruits protects against a range of health problems including coronary heart disease, high blood pressure, stroke, some forms of cancer (including colon, lung and gastrointestinal cancers), obesity and Type 2 diabetes.43, 245,246 In Queensland in 2003, insufficient fruit and vegetable consumption caused 1.2% of the total burden of disease and injury, 1.6% for males and 0.8% for females.29
Breastfeeding is also an important public health priority in Queensland and Australia. The health benefits of breastfeeding clearly demonstrate its superiority to breastmilk substitutes. Breastfeeding is associated with a reduction in the incidence and impact of childhood infections, allergic disease, diabetes, obesity, some childhood cancers and Sudden Infant Death Syndrome (SIDS).17, 247 In addition, breastfeeding is associated with reduced risk of cardiovascular disease in adulthood.248 The WHO assessed that breastfed infants were 22% less likely to be overweight and obese as adults and 37% less likely to develop Type 2 diabetes.249 For mothers, breastfeeding promotes recovery from childbirth, reduces risk of ovarian and breast cancers and fosters attachment between mother and child.250 The NHMRC’s infant feeding guidelines17 and the WHO40 currently recommend infants should be fed only breast milk for the first six months with the appropriate introduction of solid foods at around six months with breastfeeding continued until at least 12 months of age.
What can be done to prevent it?Poor nutrition can be prevented. Nutrition is a central feature of an integrated approach to chronic disease prevention. A broad, population approach has been
GU
IDEL
INES
Recommended daily intake of fruit ❚
and vegetable serves 17,43
Fruit Vegetables4-7 years 1 28-11 years 1 312-18 years 3 418+ years 2 5
Pregnant women 4 5-6Breastfeeding women 5 7
GU
IDELIN
ES
Recommended breastfeeding and solid ❚
feeding introduction for infants17,40
12 months
6 months Breastfeeding
Birth Breastfeeding Solid foods
Breastfeeding Introduction of solids
Introduction of cow’s milk
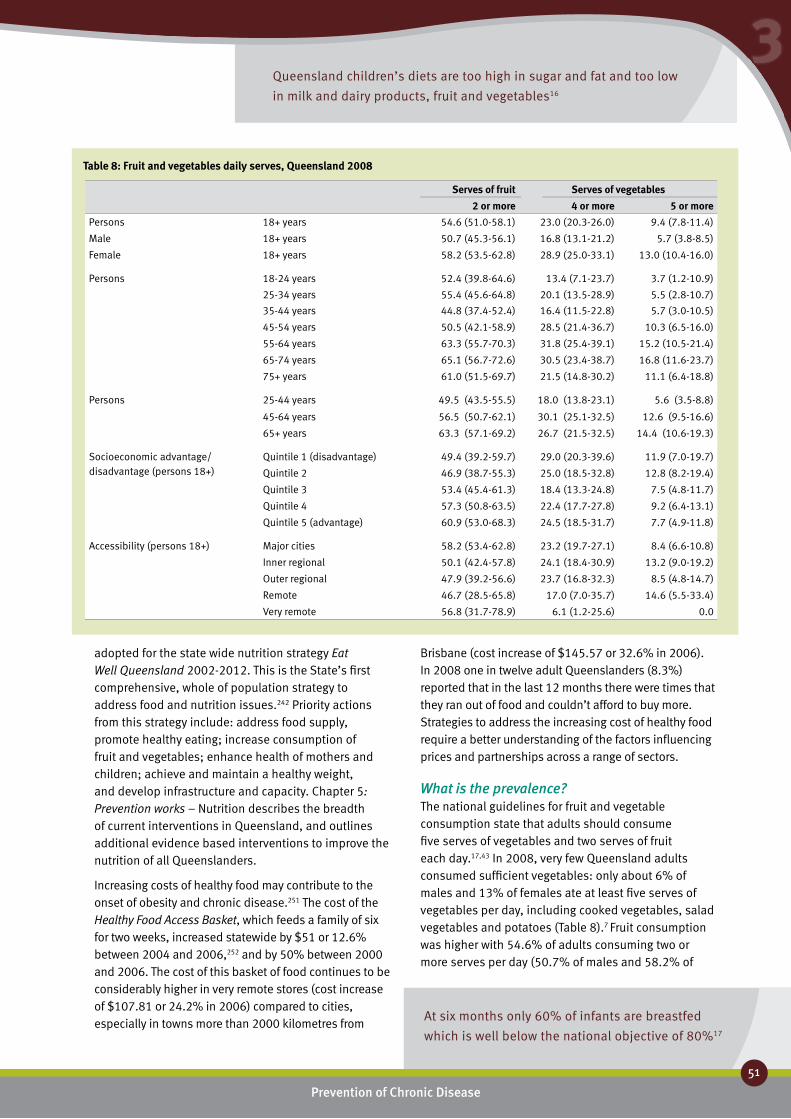
Queensland children’s diets are too high in sugar and fat and too low
in milk and dairy products, fruit and vegetables16
At six months only 60% of infants are breastfed
which is well below the national objective of 80%17
Report of the Chief Health Officer Queensland Prevention of Chronic Disease
51
3
Serves of fruit Serves of vegetables
2 or more 4 or more 5 or morePersons 18+ years 54.6 (51.0-58.1) 23.0 (20.3-26.0) 9.4 (7.8-11.4)
Male 18+ years 50.7 (45.3-56.1) 16.8 (13.1-21.2) 5.7 (3.8-8.5)
Female 18+ years 58.2 (53.5-62.8) 28.9 (25.0-33.1) 13.0 (10.4-16.0)
Persons 18-24 years 52.4 (39.8-64.6) 13.4 (7.1-23.7) 3.7 (1.2-10.9)
25-34 years 55.4 (45.6-64.8) 20.1 (13.5-28.9) 5.5 (2.8-10.7)
35-44 years 44.8 (37.4-52.4) 16.4 (11.5-22.8) 5.7 (3.0-10.5)
45-54 years 50.5 (42.1-58.9) 28.5 (21.4-36.7) 10.3 (6.5-16.0)
55-64 years 63.3 (55.7-70.3) 31.8 (25.4-39.1) 15.2 (10.5-21.4)
65-74 years 65.1 (56.7-72.6) 30.5 (23.4-38.7) 16.8 (11.6-23.7)
75+ years 61.0 (51.5-69.7) 21.5 (14.8-30.2) 11.1 (6.4-18.8)
Persons 25-44 years 49.5 (43.5-55.5) 18.0 (13.8-23.1) 5.6 (3.5-8.8)
45-64 years 56.5 (50.7-62.1) 30.1 (25.1-32.5) 12.6 (9.5-16.6)
65+ years 63.3 (57.1-69.2) 26.7 (21.5-32.5) 14.4 (10.6-19.3)
Socioeconomic advantage/ disadvantage (persons 18+)
Quintile 1 (disadvantage) 49.4 (39.2-59.7) 29.0 (20.3-39.6) 11.9 (7.0-19.7)
Quintile 2 46.9 (38.7-55.3) 25.0 (18.5-32.8) 12.8 (8.2-19.4)
Quintile 3 53.4 (45.4-61.3) 18.4 (13.3-24.8) 7.5 (4.8-11.7)
Quintile 4 57.3 (50.8-63.5) 22.4 (17.7-27.8) 9.2 (6.4-13.1)
Quintile 5 (advantage) 60.9 (53.0-68.3) 24.5 (18.5-31.7) 7.7 (4.9-11.8)
Accessibility (persons 18+) Major cities 58.2 (53.4-62.8) 23.2 (19.7-27.1) 8.4 (6.6-10.8)
Inner regional 50.1 (42.4-57.8) 24.1 (18.4-30.9) 13.2 (9.0-19.2)
Outer regional 47.9 (39.2-56.6) 23.7 (16.8-32.3) 8.5 (4.8-14.7)
Remote 46.7 (28.5-65.8) 17.0 (7.0-35.7) 14.6 (5.5-33.4)
Very remote 56.8 (31.7-78.9) 6.1 (1.2-25.6) 0.0
Table 8: Fruit and vegetables daily serves, Queensland 2008
adopted for the state wide nutrition strategy Eat Well Queensland 2002-2012. This is the State’s first comprehensive, whole of population strategy to address food and nutrition issues.242 Priority actions from this strategy include: address food supply, promote healthy eating; increase consumption of fruit and vegetables; enhance health of mothers and children; achieve and maintain a healthy weight, and develop infrastructure and capacity. Chapter 5: Prevention works – Nutrition describes the breadth of current interventions in Queensland, and outlines additional evidence based interventions to improve the nutrition of all Queenslanders.
Increasing costs of healthy food may contribute to the onset of obesity and chronic disease.251 The cost of the Healthy Food Access Basket, which feeds a family of six for two weeks, increased statewide by $51 or 12.6% between 2004 and 2006,252 and by 50% between 2000 and 2006. The cost of this basket of food continues to be considerably higher in very remote stores (cost increase of $107.81 or 24.2% in 2006) compared to cities, especially in towns more than 2000 kilometres from
Brisbane (cost increase of $145.57 or 32.6% in 2006). In 2008 one in twelve adult Queenslanders (8.3%) reported that in the last 12 months there were times that they ran out of food and couldn’t afford to buy more. Strategies to address the increasing cost of healthy food require a better understanding of the factors influencing prices and partnerships across a range of sectors.
What is the prevalence?The national guidelines for fruit and vegetable consumption state that adults should consume five serves of vegetables and two serves of fruit each day.17,43 In 2008, very few Queensland adults consumed sufficient vegetables: only about 6% of males and 13% of females ate at least five serves of vegetables per day, including cooked vegetables, salad vegetables and potatoes (Table 8).7 Fruit consumption was higher with 54.6% of adults consuming two or more serves per day (50.7% of males and 58.2% of

Queensland children’s diets are too high in sugar and fat and
too low in milk and dairy products, fruit and vegetables16
Report of the Chief Health Officer Queensland
52
females). Queensland adults ate an average of 2.6 serves of vegetables per day and 1.8 serves of fruit, an average of 4.3 serves of fruit and vegetable combined.
Queensland children do not eat enough fruit and vegetables particularly as they get older. In Queensland in 2006, based on 24 hour food records, on average 75% of Year 1 and 65% of Year 5 children reported regularly consuming the recommended one piece of fruit or more per day.20 However only 29% of Year 10 students reported regularly consuming the recommended three serves of fruit per day. The percentage of children consuming the recommended amount of vegetables also varied across school years – 22% of Year 1 children (two or more serves per day), 18% of Year 5 children (three or more serves per day) and 17% of Year 10 students (four or more serves per day).
In addition Queensland children consume too much sugar and fat, with low intakes of milk and dairy products.20 About one quarter of the energy intake was
from sugar (22-25%); one third (33%) from fat, where 30% is recommended; and 14.5% from saturated fat where 10% is recommended. Calcium intake was inadequate: intake of 3% boys and 7% girls in Year 1 was inadequate; 43% boys and 56% girls in Year 5; and 50% boys and 88% girls in Year 10. The average intake of milk products was inadequate for girls in all Years and boys in Year 10. Year 10 girls consumed only half the recommended intake. Few children consumed low-fat milk as recommended. Furthermore, 10% of Year 5 girls and 25% of Year 10 girls have inadequate iron intake.
Breastfeeding is not sustained for long enough in Queensland. In 2006 at discharge, 83% of Queensland babies were breastfed and a further 5% were fed both artificial and breast milk253 which is close to the state target of 90%.250 In 2008, most Queensland infants (95%) had been fed breast milk at some point.254 At one month of age, 83% of infants were breastfed,
70
60
50
40
30
20
10
0
Perc
enta
ge o
f pop
ulat
ion
Fruit serves (2+ per day)
MaleFemale
20
01
2005
a
2005
b
2008
2001
2005
a
2005
b
2008
70
60
50
40
30
20
10
0
Vegetable serves (4+ per day)
MaleFemale
20
01
2005
a
2005
b
2008
2001
2005
a
2005
b
2008
Figure 17: Trends in daily serves of fruit and vegetables, Queensland260
Perc
enta
ge o
f pop
ulat
ion
Not
e: 2
005a
May
/Jun
e 20
05
200
5b D
ecem
ber 2
005
1000
800
600
400
200
0
Bur
den
of d
isea
se (D
ALY
s)
Age (years) Age (years)
Male Female
1200
1000
800
600
400
200
0
Bur
den
of d
isea
se (D
ALY
s)
0-1
5-9
15-1
9
25-2
9
35-3
9
45-4
9
55-5
9
65-6
9
75-7
9
85-8
9
95-9
9
Colorectal cancerStomach cancerOesophagus cancerLung cancerStrokeCoronary heart disease
0-1
5-9
15-1
9
25-2
9
35-3
9
45-4
9
55-5
9
65-6
9
75-7
9
85-8
9
95-9
9
Figure 18: Burden due to insufficient fruit and vegetable consumption, Queensland 2003
1 in 10 adults eat enough vegetables and
1 in 2 eat enough fruit
Report of the Chief Health Officer Queensland
3
and by six months the rate of any breastfeeding had fallen to 59%,254 well below the national objective of 80% breastfeeding at six months.17 The rate of breastfeeding at 12 months was 33%. The rate of exclusive breastfeeding for the first three months was 55% (short of the state target of 60%) and 13% for the first six breastfed months (well short of the state target of 50%).254,250 The rate of introduction of appropriate solid foods at around six months was 60.9%.254
Is it the same for everyone?Vegetable consumption increased with age with higher consumption in people aged 55 years and older in 2008 (Table 8). About half of all adults ate two or more pieces of fruit each day, including fresh, dried, frozen and tinned fruit and in 2008 people aged 55 years and older were generally more likely than younger people to consume the recommended two serves of fruit per day. There was no difference in eating patterns across areas of socioeconomic difference or between city, regional and remote areas.
The intention of mothers to breastfeed prior to giving birth was the best predictor of actual breastfeeding practice.255 In 2003, mothers who had decided before giving birth to breast feed were nearly 19 times more likely to initiate breastfeeding, five times more likely to breastfeed for four months, nearly five times more likely to breastfeed for six months and 13 times more likely to breastfeed for 12 months, than mothers who had not made that decision prior to the birth.255 The decision by mothers to breastfeed their infants prior to birth remains high, rising from 86% in 2003 to 92% in 2008.256,254
Indigenous mothers were less likely to initiate and continue breastfeeding than other mothers. The proportion of Indigenous mothers who were breastfeeding at discharge (81% in 2006) was lower than in the non-Indigenous population (87.6% in 2006) in Queensland. In 2004/05 in Australia, 79% of Indigenous children aged 0–3 years were reported as having ever been breastfed (including those currently breastfed) compared with 88% of other Australian children.257 Less than one-third (30%) of Indigenous children in non-remote areas had been breastfed for six months or more compared with 36% of other children.
How do we compare?Queensland rates are similar to Australian nutrition data. Fruit and vegetable consumption patterns in Queensland in 2004/05 were similar to the national average.163 Breast feeding rates in Queensland were similar to national rates in 1995258 and in 2003, 92%
of Queensland children aged 0-3 years had ever been breastfed compared with 87% of infants aged 0-3 years nationally in 2001.259
What are the trends?In Queensland fruit and vegetable consumption has increased in recent years (Figure 17). Between 2001 and 2008 the proportion of Queensland adult males who reported eating at least two serves of fruit per day significantly increased by 21% (from 42% in 2001 to 51% in 2008) and for females from 56% to 58% (not a significant change). Over this same time, the proportion of adults who reported eating at least four serves of vegetables per day significantly increased by 42% from 16.4% in 2001 to 23.3% in 2008. For females there was a significant increase of 40% between 2001 and 2008 (20.6% to 28.9%) while for males the increase from 12.1% to 16.8% was not significant.
Between 2003 and 2008, the proportion of Queensland mothers who breastfed their infants has increased. There was a 1.7% increase in the proportion of infants who had been fed breast milk at some point, 5.1% increase in those breastfed at one month, 4.2% at six months and 4.4% in infants breastfed at 12 months (Table 1).255,254 The exclusive breastfeeding rates for the first three months have risen from 45% in 2003 to 55% in 2008 and at six months from 3% to 13%. The introduction of solids at around six months has risen to 60%, reflecting a drop in proportion of infants receiving solids too early. There was no change in the proportion breastfed on discharge from hospital between 2000 and 2006 in Queensland.253
What are its impacts?The Global Strategy on Diet, Physical Activity and Health highlights the role of healthy diets in preventing diseases such as cardiovascular disease, Type 2 diabetes and certain types of cancer.54 In Queensland in 2003 poor diet was estimated to cause about 16% of the total burden of disease and injury, assessed by the contribution of overweight and obesity, high blood cholesterol, high blood pressure and inadequate consumption of vegetables and fruits. Overall, the contribution of the combined effect of these dietary factors was similar to that of cancer or cardiovascular disease or that due to socioeconomic disadvantage, and about double that of smoking (Figure 13).29,261
Prevention of Chronic Disease
53

Poor diet causes about 16% of the burden of disease –
the same as for cancer or cardiovascular disease
Report of the Chief Health Officer Queensland
54
Prevention of Chronic Disease
As well as promoting healthy weight, improving the nutrition of Queenslanders will support good health by enhancing growth and development of children; increasing protection against infections, some cancers, anaemia, high blood pressure, renal disease, and oxidative damage including that which causes cardiovascular disease; improving bone density; and enhancing general wellbeing.17
In Queensland in 2003, insufficient fruit and vegetable consumption caused about 8.5% of the burden of disease of cardiovascular disease.29 Other health outcomes of insufficient consumption were stroke, lung cancer, oesophageal cancer, stomach cancer and colorectal cancer (Figure 18). The burden of disease due to insufficient fruit and vegetable consumption began in people aged in their 20s, with most impact by their 50s. These figures are similar to data for the rest of Australia. This burden of disease was lower in females than males, with later onset in females.
Poor nutrition is considered a factor in more than 56% of all deaths and costs in excess of $5 billion nationally per year, including direct health care costs of about $3 billion per year in Australia based on 1990 costings.49
Challenges and opportunities?Just one extra serve of fruit and vegetables will make a difference. In 2001 in Australia it was reported that increasing average vegetable and fruit consumption by just one serve daily would result in direct health care system savings of $513 million a year from the time of increased consumption ($391.8 million for cardiovascular disease and $96.8 million for colorectal, breast, lung and prostate cancers).57,58 Reducing dietary salt intake by three grams per day will reduce deaths from stroke by 22% and from coronary disease by 16%.21 Increasing breast feeding rates will also make a difference. A minimum of $11.5 million could be saved each year in Australia if the prevalence of exclusive breastfeeding at three months was increased from less than 60% to 80%.60

Report of the Chief Health Officer Queensland Prevention of Chronic Disease
55
3
Physical inactivity and ❚
sedentary behaviourPhysical activity is essential for physical and mental health and general wellbeing of adults and children. Regular physical activity reduces the risks of many chronic diseases particularly cardiovascular disease and Type 2 diabetes, and of the risk factors for these conditions such as overweight and obesity, high blood pressure and high blood cholesterol.186 It strengthens the musculoskeletal system reducing the likelihood of osteoporosis and the risk of falls and fractures in older people. In addition it improves mental wellbeing by reducing feelings of stress, and anxiety and depression.55 Metabolic health is influenced both by the time spent in physical activity and in being sedentary.262
The amount of physical activity required for health benefit, in contrast to fitness, has been nationally defined for adults as at least 30 minutes of moderate intensity physical activity on most days of the week44 and for children and adolescents, 60 minutes of moderate to vigorous activity daily.11, 39 Sedentary behaviour is behaviours during waking hours for which energy expenditure is low (less than 1.5 metabolic equivalent intensity levels) and is characterised by prolonged sitting time including at home, in transport and at work.263
What causes it?Physical inactivity and sedentary behaviour and their consequences are a product of modern life. The basic cause of the global epidemic of obesity is too many kilojoules coupled with reduced physical exertion. Many Queenslanders have become sedentary over the years because physical activity has been slowly engineered out of our lives. People in Queensland and Australia are living in an ‘obesogenic’ environment, that is one that promotes obesity through:
Increasing car dependency. In South East •Queensland about 45% of car trips are less than 3km, a walkable distance, and 61% of car trips are less than 10km, a distance easily cycled.264
Urban areas with built environment changes not •supporting active living.Increasing reliance on televisions and internet and •occupations which increasingly impose sedentary behaviours.
What can be done to prevent it?What will it take to get us to drive less and walk more for errands? What will it take to get us to use the stairs in buildings? How much of our transport budgets are we willing to spend on attractive cycle and walking trails? Is it possible to move people away from their television sets for one half hour of activity per day? How can we best impress upon our politicians and bureaucrats the importance of considering the impact on physical activity of laws and policies that affect health care, transportation, building codes, zoning ordinances?265
What can be done to increase physical activity and reduce sedentary behaviour depends on a number of factors. The motivation to change individual behaviour is complex. The latin word, sedére which means ‘to sit’, may be used to characterise those behaviours for which energy is low; these included prolonged sitting time at home and at work. Many people perceive themselves to be physically active and yet their activity doesn’t meet recommended levels: 36% of people in a Sunshine Coast Survey in 2007 who perceived themselves to be active did not meet the recommended levels of activity.266 People who were sufficiently active tended to need less motivation through social and others supports: those who weren’t active tended to require direction and advice and support from doctors and friends.
The prevalence of physical activity and sedentary behaviour is strongly influenced by societal factors as well as individual choices. To achieve change in activity behaviour in Queensland requires strategies to develop environments that support physical activity. These environments include the workplace, home, school, and in transport and leisure time. These environments are under the control and influence of many groups in Queensland, including the State and local governments, communities and businesses. All of these groups need to work together to develop supportive environments for physical activity.
GU
IDELIN
ES
Recommended physical activity ❚
for health benefit11,39,44
Children and young peopleModerate to vigorous physical activity 60 minutes daily
AdultsModerate physical activity 30 minutes on most days Be active every day in as many ways as you can Think of movement as an opportunity
Note: Children and youth should spend less than two hours per day playing computer games, watching television or surfing the internet for entertainment.

28% of adults were sedentary for at least seven
hours every day of the week
Report of the Chief Health Officer Queensland
56
Prevention of Chronic Disease
Supportive local environments to improve physical activity rates include:267
Good community-scale urban design and land •use increases physical activity levels nearly two fold (161%), specifically if residences are close to shops and schools, streets are well connected, and there is high population density and amounts of green spaces. Each quartile increase in land use mix is associated with 12.2% reduced risk of being obese.30 Good urban design and land use at a street level increases physical activity levels by 35%, specifically improved lighting, safe and easy street crossings, well connected pathways, presence of traffic calming structures and aesthetic enhancements. Access to places for physical activity increases •physical activity by 48.4% including paths, facilities, parks and places that are safe and affordable. Accessibility was based on distance to destinations such as workplaces, schools, food stores, public transport stops and parks.
In addition to encouraging physical activity it is important to discourage excess sedentary time. Sedentary behaviour such as excessive time spent watching television and in small screen recreation is likely to be linked with overweight and obesity. It is recommended that children and young people spend no more than two hours per day watching television or other small screen activities, except for educational reasons.11
Strategies to promote physical activity and reduce sedentary behaviour in Queensland must be based on a number of interrelated approaches, settings and targeted interventions. For more information on strategies and successful interventions see Chapter 5: Prevention works – Physical activity.
What is the prevalence?Many adults and children in Queensland are not doing enough physical activity to support good health. In 2008, 53% of the adult population aged 18-75 years in Queensland reported a level of physical activity that is sufficient for health benefit. Sedentary behaviour
Sufficient physical activity
Sitting 7+ hours/day, 7 days a week
18-75 years 18-65 years
Persons 18-75 years 53.0 (50.3-55.7) 27.7 (25.1-30.5)
Male 18-75 years 55.2 (51.1-59.2) 29.6 (25.8-33.8)
Female 18-75 years 50.9 (47.2-54.5) 25.9 (22.5-29.7)
Persons 18-24 years 63.1 (53.7-71.6) 35.5 (26.9-45.2)
25-34 years 51.3 (44.4-58.1) 29.1 (23.3-35.7)
35-44 years 54.8 (49.3-60.1) 28.3 (23.6-33.4)
45-54 years 53.2 (47.3-59.1) 25.6 (20.7-31.2)
55-64 years 50.1 (44.5-55.8) 21.8 (17.4-26.9)
65-74 years 41.2 (35.2-47.5)
Persons 25-44 years 53.2 (48.9-57.5) 35.5 (26.9-45.2)
45-64 years 51.8 (47.7-55.9) 28.7 (24.9-32.7)
65+ years 41.2 (35.2-47.5)
Socioeconomic Disadvantaged quintile
45.6 (38.1-53.3) 21.6 (15.6-29.1)
advantage/disadvantage Quintile 2 46.5 (40.1-53.0) 20.8 (15.8-27.0)
Quintile 3 58.3 (52.4-64.0) 24.6 (19.2-31.0)
Quintile 4 52.3 (47.3-57.2) 29.0 (24.4-34.1)
Advantaged quintile 58.2 (52.0-64.2) 38.6 (32.1-45.5)
Accessibility Major cities 54.1 (50.4-57.7) 31.6 (28.0-35.5)
Inner regional 53.1 (47.2-58.9) 24.8 (19.6-31.0)
Outer regional 48.1 (41.9-54.3) 20.9 (16.0-26.8)
Remote 46.1 (32.3-60.5) 22.9 (12.3-38.5)
Very remote 71.1 (52.4-84.6) 10.5 (3.9-25.2)
Table 9: Physical activity prevalence and sedentary behaviour, Queensland 2008
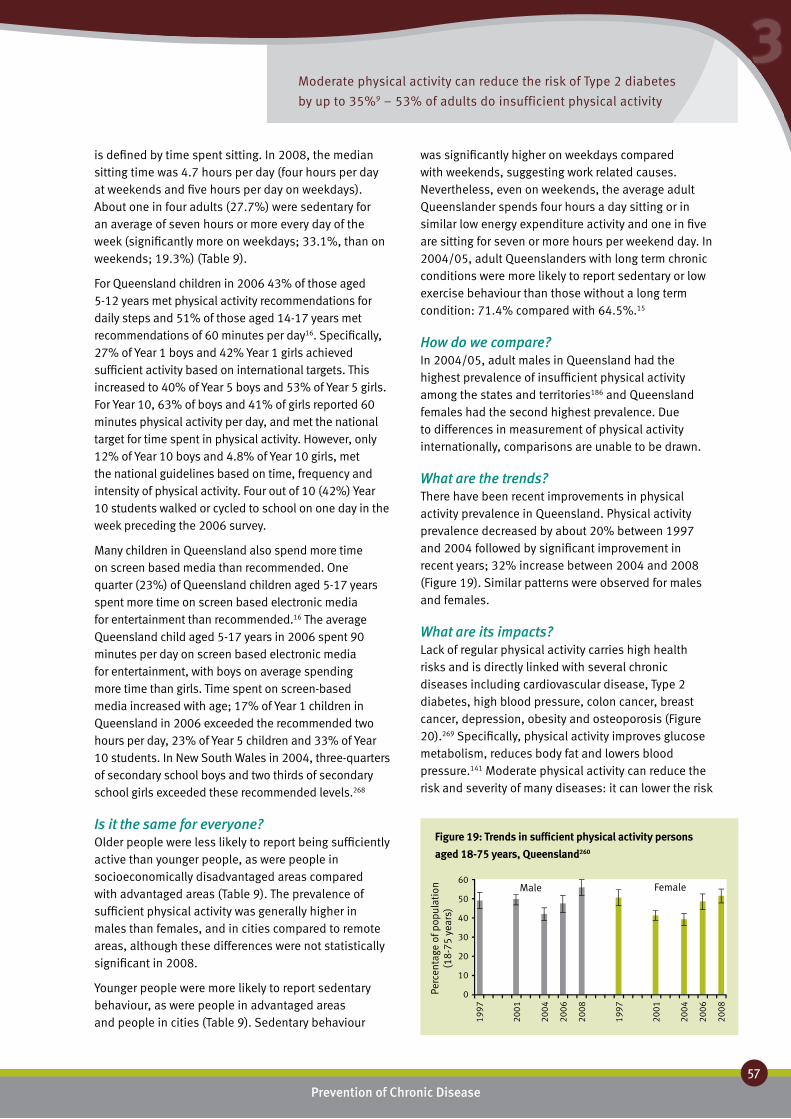
Moderate physical activity can reduce the risk of Type 2 diabetes
by up to 35%9 – 53% of adults do insufficient physical activity
Report of the Chief Health Officer Queensland Prevention of Chronic Disease
57
3
60
50
40
30
20
10
0Perc
enta
ge o
f pop
ulat
ion
(1
8-75
yea
rs)
1997
2001
2004
2006
2008
1997
2001
2004
2006
2008
Male Female
Figure 19: Trends in sufficient physical activity persons
aged 18-75 years, Queensland260
is defined by time spent sitting. In 2008, the median sitting time was 4.7 hours per day (four hours per day at weekends and five hours per day on weekdays). About one in four adults (27.7%) were sedentary for an average of seven hours or more every day of the week (significantly more on weekdays; 33.1%, than on weekends; 19.3%) (Table 9).
For Queensland children in 2006 43% of those aged 5-12 years met physical activity recommendations for daily steps and 51% of those aged 14-17 years met recommendations of 60 minutes per day16. Specifically, 27% of Year 1 boys and 42% Year 1 girls achieved sufficient activity based on international targets. This increased to 40% of Year 5 boys and 53% of Year 5 girls. For Year 10, 63% of boys and 41% of girls reported 60 minutes physical activity per day, and met the national target for time spent in physical activity. However, only 12% of Year 10 boys and 4.8% of Year 10 girls, met the national guidelines based on time, frequency and intensity of physical activity. Four out of 10 (42%) Year 10 students walked or cycled to school on one day in the week preceding the 2006 survey.
Many children in Queensland also spend more time on screen based media than recommended. One quarter (23%) of Queensland children aged 5-17 years spent more time on screen based electronic media for entertainment than recommended.16 The average Queensland child aged 5-17 years in 2006 spent 90 minutes per day on screen based electronic media for entertainment, with boys on average spending more time than girls. Time spent on screen-based media increased with age; 17% of Year 1 children in Queensland in 2006 exceeded the recommended two hours per day, 23% of Year 5 children and 33% of Year 10 students. In New South Wales in 2004, three-quarters of secondary school boys and two thirds of secondary school girls exceeded these recommended levels.268
Is it the same for everyone?Older people were less likely to report being sufficiently active than younger people, as were people in socioeconomically disadvantaged areas compared with advantaged areas (Table 9). The prevalence of sufficient physical activity was generally higher in males than females, and in cities compared to remote areas, although these differences were not statistically significant in 2008.
Younger people were more likely to report sedentary behaviour, as were people in advantaged areas and people in cities (Table 9). Sedentary behaviour
was significantly higher on weekdays compared with weekends, suggesting work related causes. Nevertheless, even on weekends, the average adult Queenslander spends four hours a day sitting or in similar low energy expenditure activity and one in five are sitting for seven or more hours per weekend day. In 2004/05, adult Queenslanders with long term chronic conditions were more likely to report sedentary or low exercise behaviour than those without a long term condition: 71.4% compared with 64.5%.15
How do we compare?In 2004/05, adult males in Queensland had the highest prevalence of insufficient physical activity among the states and territories186 and Queensland females had the second highest prevalence. Due to differences in measurement of physical activity internationally, comparisons are unable to be drawn.
What are the trends?There have been recent improvements in physical activity prevalence in Queensland. Physical activity prevalence decreased by about 20% between 1997 and 2004 followed by significant improvement in recent years; 32% increase between 2004 and 2008 (Figure 19). Similar patterns were observed for males and females.
What are its impacts?Lack of regular physical activity carries high health risks and is directly linked with several chronic diseases including cardiovascular disease, Type 2 diabetes, high blood pressure, colon cancer, breast cancer, depression, obesity and osteoporosis (Figure 20).269 Specifically, physical activity improves glucose metabolism, reduces body fat and lowers blood pressure.141 Moderate physical activity can reduce the risk and severity of many diseases: it can lower the risk
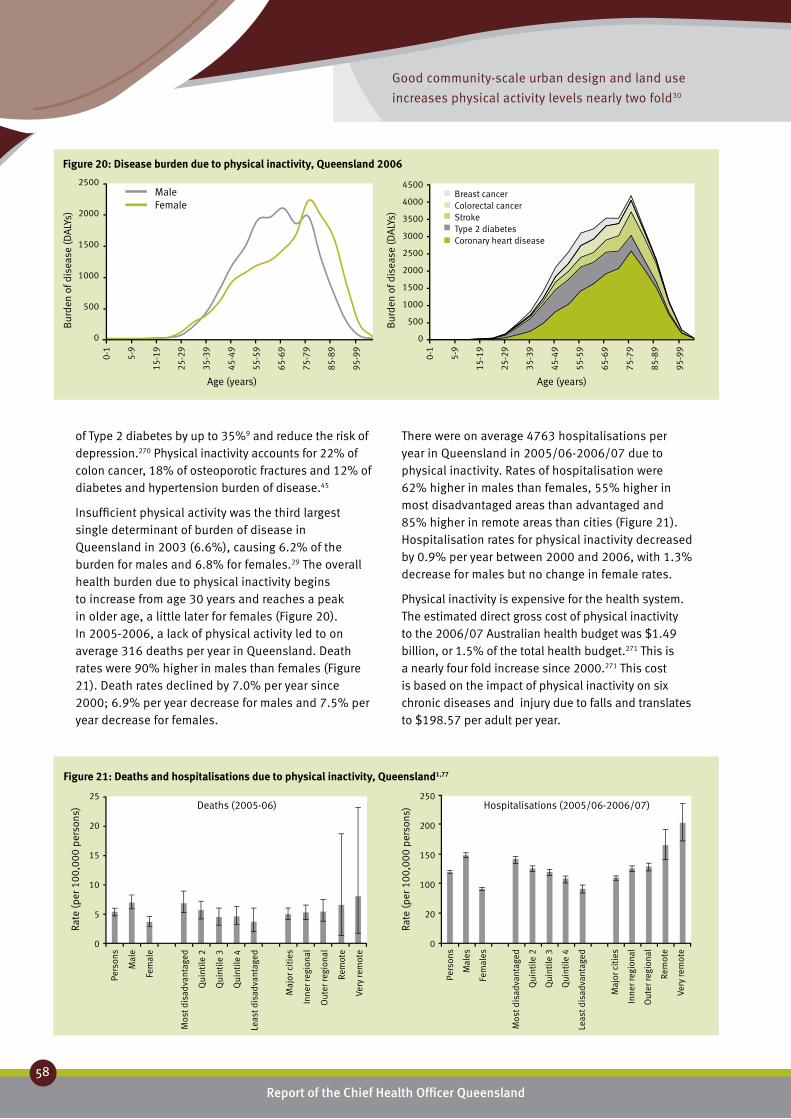
Good community-scale urban design and land use
increases physical activity levels nearly two fold30
Report of the Chief Health Officer Queensland
58
Prevention of Chronic Disease
of Type 2 diabetes by up to 35%9 and reduce the risk of depression.270 Physical inactivity accounts for 22% of colon cancer, 18% of osteoporotic fractures and 12% of diabetes and hypertension burden of disease.45
Insufficient physical activity was the third largest single determinant of burden of disease in Queensland in 2003 (6.6%), causing 6.2% of the burden for males and 6.8% for females.29 The overall health burden due to physical inactivity begins to increase from age 30 years and reaches a peak in older age, a little later for females (Figure 20). In 2005-2006, a lack of physical activity led to on average 316 deaths per year in Queensland. Death rates were 90% higher in males than females (Figure 21). Death rates declined by 7.0% per year since 2000; 6.9% per year decrease for males and 7.5% per year decrease for females.
25
20
15
10
5
0
Rate
(per
100
,000
per
sons
)
250
200
150
100
20
0
Rate
(per
100
,000
per
sons
)Deaths (2005-06)
Pers
ons
Mal
e
Fem
ale
Mos
t dis
adva
ntag
ed
Qui
ntile
2
Qui
ntile
3
Qui
ntile
4
Leas
t dis
adva
ntag
ed
Maj
or c
itie
s
Inne
r reg
iona
l
Out
er re
gion
al
Rem
ote
Very
rem
ote
Hospitalisations (2005/06-2006/07)
Pers
ons
Mal
es
Fem
ales
Mos
t dis
adva
ntag
ed
Qui
ntile
2
Qui
ntile
3
Qui
ntile
4
Leas
t dis
adva
ntag
ed
Maj
or c
itie
s
Inne
r reg
iona
l
Out
er re
gion
al
Rem
ote
Very
rem
ote
Figure 21: Deaths and hospitalisations due to physical inactivity, Queensland1,77
There were on average 4763 hospitalisations per year in Queensland in 2005/06-2006/07 due to physical inactivity. Rates of hospitalisation were 62% higher in males than females, 55% higher in most disadvantaged areas than advantaged and 85% higher in remote areas than cities (Figure 21). Hospitalisation rates for physical inactivity decreased by 0.9% per year between 2000 and 2006, with 1.3% decrease for males but no change in female rates.
Physical inactivity is expensive for the health system. The estimated direct gross cost of physical inactivity to the 2006/07 Australian health budget was $1.49 billion, or 1.5% of the total health budget.271 This is a nearly four fold increase since 2000.271 This cost is based on the impact of physical inactivity on six chronic diseases and injury due to falls and translates to $198.57 per adult per year.
Figure 20: Disease burden due to physical inactivity, Queensland 2006
Age (years)
4500
4000
3500
3000
2500
2000
1500
1000
500
0
Bur
den
of d
isea
se (D
ALY
s)
0-1
5-9
15-1
9
25-2
9
35-3
9
45-4
9
55-5
9
65-6
9
75-7
9
85-8
9
95-9
9
Breast cancerColorectal cancerStrokeType 2 diabetesCoronary heart disease
2500
2000
1500
1000
500
0
Bur
den
of d
isea
se (D
ALY
s)
Age (years)
Male Female
0-1
5-9
15-1
9
25-2
9
35-3
9
45-4
9
55-5
9
65-6
9
75-7
9
85-8
9
95-9
9

Report of the Chief Health Officer Queensland Prevention of Chronic Disease
59
3
Challenges and opportunities?With half the adult population in Queensland not sufficiently active there is great potential to improve physical activity at a population level – and so improve health outcomes and reduce health spending on preventable chronic conditions. Keeping Australians active and healthy has been identified as one of four priorities in Australian health reform.90
Every 1% increase in the population undertaking sufficient physical activity (i.e. 30 minutes on most days) would save at least $88 million per year: $3.5 million for coronary heart disease, Type 2 diabetes and colon cancer alone.56 As well, every 1% change would lead to 122 fewer premature deaths and 1764 years of life gained in Australia due to coronary heart disease, Type 2 diabetes and colon cancer alone.56
Report of the Chief Health Officer Queensland
60
Prevention of Chronic Disease
Alcohol ❚Alcohol is the most commonly used drug in our society. It depresses the central nervous system and affects most cells and systems of the body. There is evidence that from middle-age onwards relatively low levels of alcohol have some health benefits.272 However, drinking regularly and drinking at levels higher than the recommended NHMRC guidelines for low risk drinking, increases the risk of acute and chronic health and social impacts and premature death.273
In Queensland in 2003, alcohol consumption caused a total 2.3% of the total burden of disease, where harmful effects caused 3.5% of the burden and beneficial effects reduced the burden by 1.2%.29 For males, alcohol consumption caused 4.2% of the total burden, with 5.2% due to alcohol harm and -1.0% to alcohol benefit. For females, alcohol consumption caused 0.2% of the total burden, 4.1% due to alcohol harm and -3.9% to alcohol benefit.
There are two main patterns of drinking that pose a risk to a person’s health – excessive alcohol intake on a particular occasion, and consistent high alcohol intake in the long-term. The Australian Alcohol Guidelines, first published by the NHMRC in 2001, are intended to give Australians clear guidelines on how to avoid or minimise the harmful consequences of alcohol consumption, as both acute and chronic health impacts.272
The Australian Alcohol Guidelines for Low Risk Drinking 2008 are currently under review with revised guidelines anticipated to be released in late 2008. The Guidelines will recommend low-risk alcohol intake levels to reduce risk for both the immediate and long-term. To minimise health impacts, the evidence indicates two or less standard drinks in any one day for both men and women.4 Drinks should be spread over several hours. Women who are pregnant, planning a pregnancy or who are breastfeeding should consume no alcohol.
What causes it?Consumption of alcohol is influenced by a combination of health and social determinants and individual risk and protective factors.273 For example, a child growing up in a family in which heavy drinking is accepted is more likely to use alcohol and develop alcohol related problems as they grow up. However the presence or absence of any one individual risk or protective factor does not necessarily lead to alcohol misuse. Rather alcohol misuse is caused by a combination of factors and the timing of their occurrence, particularly at transitional ages such as moving into or out of adolescence.
What can be done to prevent it?Reducing alcohol misuse and its impact requires a reduction in the incidence of intoxication, increasing public safety at times and in places where alcohol is consumed, increasing number of alcohol free events, workplace policies that support responsible drinking, providing equitable access to prevention and treatment services for individuals and communities affected by alcohol misuse and regulating alcohol availability – all of which are described in the National Alcohol Strategy 2006-2009.274
What is the prevalence?Most Queenslanders (about 85%) drink alcohol (Table 10). In 2007, 11.8% of Queenslanders aged 14 years and older had a usual alcohol consumption that put them at risk of harm in the long term: 11.5% for males and 12.1% for females.26 In 2007, 37.2% of Queenslanders were drinking at levels that put them at risk of harm in the short term; 40.9% of males and 33.5% of females.26
Is it the same for everyone?While levels of risky drinking were similar for males and females in 2007, other aspects of their drinking patterns differed. Males were twice as likely to drink daily as females (10.9% compared with 5.7%) and more likely to drink weekly than females (47.4% compared with 37.1%).26
Overall, young Queenslanders, particularly females, have the riskiest drinking profile. In 2007, risky alcohol consumption was highest in the age group 20-29 years, with 17.6% drinking at levels that put them at risk or high risk of harm in the long term (Table 10). In the 14-19 year age group the proportion of females who consumed alcohol at harmful levels in the long term was 13.6%, compared to 9.1% for males.
GU
IDEL
INES
Maximum alcohol consumption ❚
for low risk harm from drinking4
Men and women
2 or less standard drinks in any one day
Drinks should be spread over several hours. No alcohol for woman who are pregnant, are planning a pregnancy or are breastfeeding.

One in six 20-29 years olds are at risk of harm
in the long term due to alcohol misuse36
Report of the Chief Health Officer Queensland Prevention of Chronic Disease
61
3
Drinking for Long Term Harm Abstainers Low risk Risky High risk Risky/high riskPersons 14+ years 15.1 (13.9-16.4) 73.1 (71.5-74.6) 7.8 (6.9-8.8) 4.0 (3.3-4.8) 11.8 (10.7 - 13.0)
Male 14+ years 13.0 (11.4-14.9) 75.5 (73.1-77.7) 6.7 (5.5-8.3) 4.8 (3.7-6.1) 11.5 (9.8-13.4)
Female 14+ years 17.2 (15.5-19.0) 70.7 (68.6-72.7) 8.9 (7.7-10.3) 3.2 (2.4-4.2) 12.1 (10.7-13.7)
Persons 14-19 years 26.2 (20.9-32.4) 62.5 (56.0-68.5) 6.4 (3.8-10.5) 4.9 (2.8-8.5) 11.3 (7.8-16.1)
Male 14-19 years 32.1 (23.9-41.5) 58.8 (49.3-67.7) 5.8 (2.6-12.5) 3.3 (1.2-9.1) 9.1 (4.9-16.5)
Female 14-19 years 20.2 (13.9-28.3) 66.3 (57.5-74.1) 7.0 (3.6-13.2) 6.6 (3.4-12.3) 13.5 (8.6-20.8)
Persons 14-19 years 26.2 (20.9-32.4) 62.5 (56.0-68.5) 6.4 (3.8-10.5) 4.9 (2.8-8.5) 11.3 (7.8-16.1)
20-29 years 9.5 (6.9-13.0) 72.9 (68.1-77.1) 11.4 (8.6-15.0) 6.2 (4.1-9.3) 17.6 (14.1-21.8)
30-39 years 10.1 (8.8-12.8) 78.6 (75.0-81.8) 7.7 (5.8-10.0) 3.6 (2.2-5.9) 11.3 (7.8-16.1)
40-49 years 9.3 (7.1-12.1) 79.2 (75.6-82.4) 8.9 (6.8-11.5) 2.6 (1.6-4.2) 11.5 (9.1-14.3)
50-59 years 13.0 (10.6-15.9) 74.4 (70.7-77.7) 7.1 (5.3-9.4) 5.5 (3.9-7.8) 12.6 (10.1-15.6)
60+ years 24.6 (22.1-27.3) 67.8 (64.9-70.6) 5.5 (4.3-7.1) 2.1 (1.3-3.1) 7.6 (6.1-9.4)
Drinking for Short Term HarmPersons 14+ years 15.1 (13.9-16.4) 47.7 (46.0-49.4) 12.7 (11.5-13.9) 24.5 (23.0-26.1) 37.2 (35.5-38.9)
Male 14+ years 13.0 (11.4-14.9) 46.0 (43.4-48.7) 13.4 (11.7-15.3) 27.5 (25.1-30.1) 40.9 (38.8-43.6)
Female 14+ years 17.2 (15.5-19.0) 49.3 (47.1-51.6) 11.9 (10.5-13.5) 21.6 (19.7-23.6) 33.5 (31.3-35.7)
Persons 14-19 years 26.2 (20.9-32.4) 31.3 (25.7-37.6) 11.4 (7.7-16.4) 31.0 (25.5-37.2) 42.4 (36.2-48.9)
Male 14-19 years 32.1 (23.9-41.5) 29.4 (21.7-38.4) 10.4 (5.7-18.0) 28.2 (20.7-37.2) 38.5 (29.9-48.0)
Female 14-19 years 20.2 (13.9-28.3) 33.3 (25.5-42.2) 12.5 (7.5-20.1) 34.0 (26.2-42.8) 46.5 (37.8-55.4)
Persons 14-19 years 26.2 (20.9-32.4) 31.3 (25.7-37.6) 11.4 (7.7-16.4) 31.0 (25.5-37.2) 42.4 (36.2-48.9)
20-29 years 9.5 (6.9-13.0) 27.5 (23.4-32.0) 13.0 (10.2-16.4) 50.0 (45.2-54.9) 63.0 (58.2-67.6)
30-39 years 10.1 (8.0-12.8) 44.6 (40.6-48.7) 13.7 (11.1-16.8) 31.6 (27.9-35.5) 45.2 (41.2-49.3)
40-49 years 9.3 (7.1-12.1) 50.7 (46.5-54.9) 17.2 (14.2-20.7) 22.8 (19.5-26.4) 40.0 (35.9-44.2)
50-59 years 13.0 (10.6-15.9) 58.4 (54.3-62.4) 15.6 (12.8-18.9) 12.9 (10.4-16.0) 28.5 (24.9-32.4)
60+ years 24.6 (22.1-27.3) 63.8 (60.9-66.7) 6.3 (5.0-7.9) 5.3 (4.0-6.9) 11.6 (9.8-13.7)
Table 10: Alcohol consumption; Queensland 2007211
In 2004/05, 16% of Australian Indigenous adults reported drinking alcohol at risky or high risk levels for long term harm.275 After adjusting for age differences in the populations, the rate of risky alcohol consumption for long term harm among Indigenous people is similar
to that for non-Indigenous people. However, levels of acute risky or high risk drinking, that is drinking at levels of short term harm, were twice as high in Indigenous people than non-indigenous, even after adjusting for age differences. This was evident in
Age (years)
2000
1000
0
0-1
5-9
15-1
9
25-2
9
35-3
9
45-4
9
55-5
9
65-6
9
75-7
9
85-8
9
95-9
9
FallsHomicide and violenceOesophagus cancerRoad traffic injuriesSuicide and self-inflicted injuriesSubstance use disorders
2000
1000
0
-1000
Bur
den
of d
isea
se (D
ALY
s)
Male Female
Age (years)
0-1
5-9
15-1
9
25-2
9
35-3
9
45-4
9
55-5
9
65-6
9
75-7
9
85-8
9
95-9
9
Figure 22: Disease burden due to net alcohol harm, Queensland 2003

Drink driving caused 29% of road deaths13
Report of the Chief Health Officer Queensland
62
Prevention of Chronic Disease
all age groups. Indigenous youth compared to non-Indigenous youth are 2.3 times more likely to die from alcohol related causes.276
How do we compare?Queensland rates for alcohol consumption at risk of harm in the long term were not significantly higher than Australian rates for males or females.26
In most OECD countries, including Australia, there appears to have been a peak in alcohol consumption patterns in the 1970s and 1980s, with reductions in consumption since. In 2006, Australia was ranked 15th highest out of 30 OECD countries for alcohol consumption in people aged 15 years and older.186
What are the trends?The proportion of people aged 14 years and older drinking at risky levels for long term harm, was similar in 2004 and 2008; 11.2% compared with 11.8%. Risky drinking for short term harm was also similar, 38.2% in 2004 and 37.25 in 2007. In Australia and also in Queensland, alcohol consumption patterns have remained largely unchanged between 1991 and 2007 for people aged 14 years and older (Figure 2e).36,211 The proportion of Queenslanders drinking daily has remained between about 6% and 9% since 1993. The average age at which people had their first full serve of alcohol (16.8 years in 2007) remained stable.
What is its impact?The impact of alcohol consumption on public safety and amenities potentially affects all Queenslanders
in some way, regardless of age, sex, socioeconomic groups or whether or not they drink alcohol.
Alcohol acts as a central nervous system depressant that affects a person’s mood, cognition and behaviour. Examples of acute harms during and immediately after excessive alcohol consumption include injury, road traffic injuries, drowning, assaults, suicide and unsafe sex.277 Driving under the influence is illegal but drink driving continues to be one of the major contributing factors in accidents on Queensland roads. According to Queensland Transport, alcohol contributes to about 30% of road deaths in Queensland each year.13 Alcohol is known to affect many organs and systems in the body. Regular alcohol consumption at harmful levels increases the risk of brain damage, cancer of the lips, mouth, throat and oesophagus, liver cirrhosis and liver cancer, cardiovascular disease, pancreatitis and alcohol dependence.277
Collectively acute and chronic impacts of alcohol misuse resulted in 2.3% of the burden of disease in Queensland in 2003.29 Alcohol misuse caused 9.5% of the burden due to mental disorders. Substance use disorders, suicide and self-inflicted injuries, road traffic injuries, cancer of the oesophagus, homicide and violence, and falls were the major premature death and disability outcomes from alcohol misuse (Figure 22). These disease burdens impact at different ages, however all start to impact from 20-24 years. It should be noted that only in females aged 65 years and older did the health benefits of alcohol outweigh its harm (Figure 22).
1500
1000
500
0
Rate
(per
100
,000
per
sons
) Hospitalisations (2005/06-2006/07)
Pers
ons
Mal
es
Fem
ales
Mos
t dis
adva
ntag
ed
Qui
ntile
2
Qui
ntile
3
Qui
ntile
4
Leas
t dis
adva
ntag
ed
Maj
or c
itie
s
Inne
r reg
iona
l
Out
er re
gion
al
Rem
ote
Very
rem
ote
40
30
20
10
0
Rate
(per
100
,000
per
sons
) Deaths (2005-06)
Pers
ons
Mal
es
Fem
ales
Mos
t dis
adva
ntag
ed
Qui
ntile
2
Qui
ntile
3
Qui
ntile
4
Leas
t dis
adva
ntag
ed
Maj
or c
itie
s
Inne
r reg
iona
l
Out
er re
gion
al
Rem
ote
Very
rem
ote
Figure 23: Deaths and hospitalisations due to alcohol related conditions, Queensland1,77
More than $128 million was spent in hospitals in
Queensland in one year due to alcohol misuse1
Report of the Chief Health Officer Queensland Prevention of Chronic Disease
63
3
Young people are at greatest risk of experiencing acute harms because of their harmful drinking patterns such as drinking excessively on a single occasion. Heavy and excessive alcohol consumption, particularly at an early age, also places young people at greater risk of continuing to drink at harmful levels, increasing their likelihood of developing chronic diseases, brain injury and alcohol dependence.
In 2005-2006, alcohol misuse led to on average 706 deaths per year in Queensland, of which about 68% were male – about one in 25 of all male deaths in Queensland (3.8%) and one in 50 female deaths (2.0%). Death rates were 80% higher in most socioeconomically disadvantaged areas than least disadvantaged and 90% higher in remote areas compared to cities (Figure 23). About 505 alcohol related deaths occurred in people aged less than 75 years, 71% of all such deaths. Within this age group, 26% or 134 deaths were due to socioeconomic disadvantage and 10% or about 50 deaths due to living outside cities. Death rates declined by 2.4% per year for females since 2000, but not for males.
There were on average 25,621 hospitalisations per year in Queensland in 2005/06-2006/07 due to alcohol misuse. Rates of hospitalisation were 77% higher in males than females, and 2.3 times higher in remote areas than cities. Rates were lowest in the second lowest quintile of disadvantage (Figure 23) and rates in areas of disadvantage were about 40% higher than lowest rates. Hospitalisation rates for alcohol misuse increased by 0.8% per year between 2000 and 2006, with 2.1% increase for females but no change for males. Hospitalisation for alcohol related conditions caused 1.8% of all hospitalisations in Queensland in this period.
Alcohol is implicated in an estimated 114,214 occupied hospital bed days in Queensland in 2005/06:1 this translates to a cost to the hospital system of over $128 million. The annual cost to the Australian community of alcohol-related social problems was estimated to be $15.3 billion in 2004/05.48 The greatest costs due to alcohol related issues are borne by workplaces as a result of reduced productivity of workers while at work and absenteeism. This is followed by the costs of alcohol related road accidents and crime.274
Alcohol was the main preventable cause of injury burden in Queensland in 2003, and alone caused 18.7% of the total burden from injuries. Alcohol was also the largest cause of mental disorder burden.29
Queensland’s fire service estimates 20% of fire deaths are alcohol-related, and this is higher in males and those aged 25-29 years.274 The majority of these preventable fires occurred at night.
Challenges and opportunities?It is important to acknowledge that the drinking culture in Australia is extremely strong and entrenched in everyday life. Achieving attitude and behaviour change will therefore be difficult and needs to be seen as a long term goal.278
Developing a drinking culture to produce healthier and safer outcomes is the key challenge to preventing alcohol misuse. Achieving this difficult challenge will need joint action by governments, non-government groups, industry and communities.274 As attitudes towards the use of alcohol change with age and stage in the life cycle, reducing alcohol misuse requires different actions for age, sex and life stage groups.278
There has been a recent increase in public concern about alcohol. More than half of adult Australians want an increase in the number of alcohol free events (63%), serving only low alcohol beverages at sporting events (61%), more severe penalties for drink driving (86%) and restricted late night trading of alcohol (52%).279
Alcohol misuse impacts significantly on Queensland families, communities and the economy. Beyond the personal and family stories of alcohol-related tragedy, is the added burden to the Queensland community of considerable cost to the health system, police service and criminal justice system.273
Reducing harms from alcohol misuse is a commitment at all levels of government. In recognition of the need for prevention and early intervention, a number of significant whole-of-Government initiatives have been established in Queensland. There is strong evidence that substantial reductions in alcohol-related health and social costs could be achieved by broader implemention, or enhancing the implementation of a range of interventions. Queensland’s broad strategic response is implemented in line with the National Alcohol Strategy 2006-2009,274 and involves a comprehensive mix of approaches that address the availability of alcohol through liquor licensing regulations, promote and support healthy attitudes and behaviours towards alcohol, and minimise harms associated with alcohol use. Although government has an important role in preventing and reducing the harmful effects of alcohol misuse, it is also critical to take a partnership approach with non-government organisations, the private sector, education and research centres.273
Reducing dietary salt intake by three grams per day will
cause 22% reduction in stroke deaths and 16% reduction
in coronary heart disease deaths21
Report of the Chief Health Officer Queensland
64
Prevention of Chronic Disease
High blood pressure ❚Blood pressure represents the forces exerted by the blood on the walls of the arteries as the heart contracts and relaxes. The WHO defines high blood pressure as systolic blood pressure of 140 mmHg or more, or diastolic blood pressure of 90 mmHg or more, or taking medication for high blood pressure. Despite this definition there is no threshold level of risk. The risk from high blood pressure is continuous which means the health risks start from even quite low blood pressure levels. As blood pressure increases so does the risk of cardiovascular disease. High blood pressure is also referred to as hypertension.186
What causes it?Most people with high blood pressure (about 90%) suffer primary or essential hypertension where there is no clearly definable cause. However there are a number of factors recognised as contributing to high blood pressure. These include obesity, risky alcohol consumption, insufficient physical activity and poor diet (particularly a high salt intake but also high saturated fat intake and low intake of fruit and vegetables).280
Stress raises blood pressure transiently but in the long term leads to greater kilojoule intake170 and a greater tendency to smoke171 and may have further indirect effects by influencing drinking and physical activity patterns. Tobacco smoking increases the risk of cardiovascular disease and stroke three fold in people with high blood pressure.281
What can be done to prevent it?The prevention and management of high blood pressure involves two major strategies: lifestyle modification and medication.197 Lifestyle modifications include achieving and maintaining a healthy weight, undertaking sufficient physical activity, reducing salt (i.e. sodium) intake, limiting alcohol and not smoking. In about half of people with high blood pressure, it can be reduced by 5mmHg through limiting sodium intake by eliminating table salt, cooking salt and salty processed foods.
Blood pressure can be further reduced by losing weight and regular physical activity. Even a small amount of weight loss can make a major difference in lowering or preventing high blood pressure.197 Although many people can lower their blood pressure significantly with lifestyle changes, most still need medication to reduce the risk of coronary heart disease, stroke and renal disease.197
What is the prevalence? In 2000, the prevalence of high blood pressure for Queensland adults aged 25 years and older was about 25%, about 2.4 million Queenslanders. By clinical measurement in 2000, 16.0% of Queensland males aged 25 years and older had untreated high blood pressure and 12.0% had treated high blood pressure (total 28%). For females, 8.7% had untreated high blood pressure and 13.7% had treated high blood pressure (total 22.4%).150
In Queensland in 2005, about one quarter of adults aged 18 years and older (26.3%) reported they had ever been told by a doctor or nurse they had high blood pressure. Of these, 62.1% were taking medication to help manage their blood pressure.193 In 2005-06 high blood pressure was the most common problem managed by Australian GPs, accounting for 6.5% of all problems managed.192
Is it the same for everyone?Males are more likely to have high blood pressure than females in all age groups. However more females (about 60%) were receiving treatment for high blood pressure then males (40%) in all age groups.150 The proportion of both males and females with high blood pressure and its associated disease burden increases markedly with age (Figure 24). The burden of disease associated with high blood pressure commences at an earlier age for males (less than 30 years) compared to females (less than 45 years) (Figure 24).
There have been no national or state surveys that directly measured blood pressure among Indigenous people. However, self reported data indicates that high blood pressure was 60% more prevalent among Indigenous people than non-Indigenous people. Indigenous people also reported high blood pressure from a younger age.282
How do we compare?In 2000, the prevalence of untreated and treated high blood pressure in Queensland was similar to Australia.150
What are the trends? Every year, about 3% of Australian adults aged 25 years and older develop high blood pressure.283 Currently trends in Queensland are unable to be determined.
In the urban Australian population aged 25-64 years, long term trend data shows that in this group the prevalence of high blood pressure has decreased since

45% of stroke and 42% of coronary heart disease
burden is due to high blood pressure29
Report of the Chief Health Officer Queensland Prevention of Chronic Disease
65
3
the 1980s for both males and females.186 There has also been a decline in average blood pressure levels since the 1980s.
What are its impacts?In 2003 in Queensland, an estimated 6.6% of total burden of disease and injury was due to high blood pressure, 7.0% in males and 6.3% in females.29 The burden of disease due to high blood pressure manifests as coronary heart disease, stroke and hypertensive heart disease (Figure 24). An estimated 42% of the total burden of coronary heart disease and 45% of the total stroke burden was attributable to high blood pressure.29
The diagnosis of high blood pressure or hypertension and its treatment is the key first step in management of all related diseases.
Challenges and opportunities?Declines in diastolic blood pressure have continued to contribute to reductions in coronary heart disease mortality over the last few decades.38 Deaths from coronary heart disease through reductions in diastolic blood pressure in males have decreased by 36% and in females by 56%. In addition, there is now strong evidence that blood pressure lowering treatment
reduces the risk of primary or initial stroke not only in hypertensive individuals but also in high-risk people with blood pressures below 140/90 mmHg.284 Furthermore, reducing dietary salt intake by three grams per day will cause 22% reduction in stroke deaths and 16% reduction in coronary heart disease deaths.21 It has been estimated that if all overweight Australian women (BMI greater than 24) reduced their BMI by two points (approximately by 5.5kg), the incidence of hypertension would be reduced by 12% up to eight years later.37
High blood pressure causes no obvious symptoms at first. However, when discovered and treated, it can usually be controlled. Control of blood pressure greatly reduces the risk of cardiovascular disease and overall mortality, although not necessarily to the levels of unaffected people.186
Australians are currently consuming around nine grams of salt each day, well above the recommended six gram maximum for overall health. The majority of salt in Australian diets (75-85%) comes from processed foods. The remaining 15-25% comes from salt added during cooking or at the table. The Australian Division of World Action on Salt and Health is seeking to work with the food industry to reduce the sodium content of processed foods by an average 25% over the next five years.285
4000
3000
2000
1000
0
Bur
den
of d
isea
se (D
ALY
s)
Age (years)
Males Females
Figure 24: Disease burden due to high blood pressure, Queensland 2006
7000
6000
5000
4000
3000
2000
1000
0
0-1
5-9
15-1
9
25-2
9
35-3
9
45-4
9
55-5
9
65-6
9
75-7
9
85-8
9
95-9
9
Age (years)
All other conditionsStrokeCoronary heart disease
0-1
5-9
15-1
9
25-2
9
35-3
9
45-4
9
55-5
9
65-6
9
75-7
9
85-8
9
95-9
9

Report of the Chief Health Officer Queensland
66
Prevention of Chronic Disease
High blood cholesterol ❚Cholesterol is a type of fat and is essential for many of the body’s metabolic processes. However, a high level of cholesterol in the blood is a basic cause of atherosclerosis (fatty build-up of plaque in the arteries). Mainly as a result of this, high blood cholesterol is a major risk factor for coronary heart disease, stroke and other vascular diseases.186
As with other chronic disease risk factors, the risks associated with high blood cholesterol are continuous and so the risk of heart disease increases steadily with increasing blood cholesterol levels. A total cholesterol level of 5.5 mmol/L or more is considered high. Cholesterol levels are further broken down into ‘bad’ low-density lipoprotein (LDL) cholesterol and ‘good’ high-density lipoprotein (HDL) cholesterol. Excess levels of LDL cholesterol are the main way that cholesterol contributes to plaque formation, whereas high levels of HDL cholesterol have a protective effect against heart disease by helping to reduce plaque.186
What causes it?Most cholesterol in the body is made by the liver from a variety of foods, and especially from saturated fats. Therefore the main cause of high blood cholesterol is a diet high in saturated fats. However, genetic factors and various metabolic conditions such as diabetes may also contribute in some individuals.141
What could be done to prevent it?High blood cholesterol can be prevented through a combination of health behaviours such as maintaining a healthy body weight, sufficient physical activity and good nutrition.186 The Heart Foundation recommends a diet that is low in saturated fat, and high in fish, whole grains, fruit and vegetables. Studies indicate that including plant sterols into the diet may be an effective method of lowering total and LDL cholesterol levels. Cholesterol-lowering medication (notably statins) may be prescribed and monitored by a GP.286
Chronic stress is another factor that adversely affects blood cholesterol,169 and is also known to lead to greater kilojoule intake170 and a greater tendency to smoke.171
What is the prevalence? Around 50% of the adult Queensland population has high blood cholesterol. By clinical measurement in 2000, 51.1% of Queensland males aged 25 years and older had high blood cholesterol levels, and 47.4% of females.150
Clinical measurements of high blood cholesterol tend to be about 20% higher than self report. In Queensland in 2005, about 30% of adult Queenslanders reported that they had ever been told by a doctor or a nurse that they had high blood cholesterol. Of these, 41.5% were taking medication to help manage their cholesterol.193
Is it the same for everyone?Blood cholesterol levels usually rise steadily with age, and are associated with a corresponding increase in attributable burden of disease due to coronary heart disease and stroke (Figure 25). In Queensland in 2000, the prevalence of high total blood cholesterol increased with age to a peak in those aged 65-74 years for both males and females. However the burden of disease associated with high blood cholesterol manifests much earlier in males (less than 60 years) than females (80 years and older) (Figure 25).29
How do we compare?Around half the adult population in Queensland have high cholesterol levels, which is similar to Australia.150 Cholesterol data differ within and between countries. The WHO found that cholesterol levels were consistently lower across all age groups in Japan compared with Australia.287
What are the trends?Substantial reductions in blood cholesterol and the subsequent decline in coronary heart disease mortality occurred mainly in the 1970s.38 Trend data for Australians aged 25-64 years living in capital cities shows that during the 20 year period 1980 to 1999-2000, average blood cholesterol levels remained very similar. There was also no apparent reduction in the prevalence of people with high blood cholesterol over the same period.186
What are its impacts?In 2003 in Queensland, an estimated 6.2% (6.6% in males and 5.8% in females) of total burden of disease and injury was due to high blood cholesterol.29 An estimated 35.2% of the total burden of cardiovascular disease was attributable to high blood cholesterol.29 High blood cholesterol is estimated to cause 18% of the global burden of stroke and 56% of global burden of coronary heart disease.141
The diagnosis of high blood cholesterol and its treatment is the key first step in management of all related diseases.

In men aged 40 years a 10% reduction in cholesterol can result in a 50% reduction
in coronary heart disease and at age 70 years there is an average 20% reduction8
Report of the Chief Health Officer Queensland Prevention of Chronic Disease
67
3
Challenges and opportunities?Over the period 1968-2000, there were substantial declines in deaths due to coronary heart disease which is largely attributed to reductions in population risk factors from primary and secondary prevention.38 In males, 22% of the decrease in mortality due to coronary heart disease was due to reduction in cholesterol, with 20% due to cholesterol reduction in females.38 Effects of reductions in blood cholesterol on coronary heart disease mortality occurred mainly in the 1970s primarily due to changes in diet. The most significant declines in cholesterol levels occurred before the widespread use of lipid-lowering drugs which commenced in the mid-1990s.38
However in recent years average blood cholesterol levels in Australia have remained largely unchanged. Further interventions along with population risk factor
Figure 25: Disease burden due to high blood cholesterol, Queensland 2006
Age (years)
5000
4000
3000
2000
1000
0
0-1
5-9
15-1
9
25-2
9
35-3
9
45-4
9
55-5
9
65-6
9
75-7
9
85-8
9
95-9
9
StrokeCoronary heart disease
3000
2000
1000
0
Bur
den
of d
isea
se (D
ALY
s)
Age (years)
Males Females
0-1
5-9
15-1
9
25-2
9
35-3
9
45-4
9
55-5
9
65-6
9
75-7
9
85-8
9
95-9
9
monitoring are needed to continue to reduce disease burden from coronary heart disease and stroke.38
The WHO states that lowering an individual’s cholesterol results in timely and substantial protection from coronary disease, with benefits related to age. In men aged 40 years a 10% reduction in cholesterol can result in a 50% reduction in coronary heart disease and at age 70 years there is an average 20% reduction.8
New research from the George Institute in Sydney has indicated that even small reductions in cholesterol levels can substantially reduce coronary heart disease and strokes. It has been reported that a 10% lowering of LDL cholesterol in the adult Australian population could save about 3000 lives each year from coronary heart disease and stroke.288

Report of the Chief Health Officer Queensland
68
Prevention of Chronic Disease
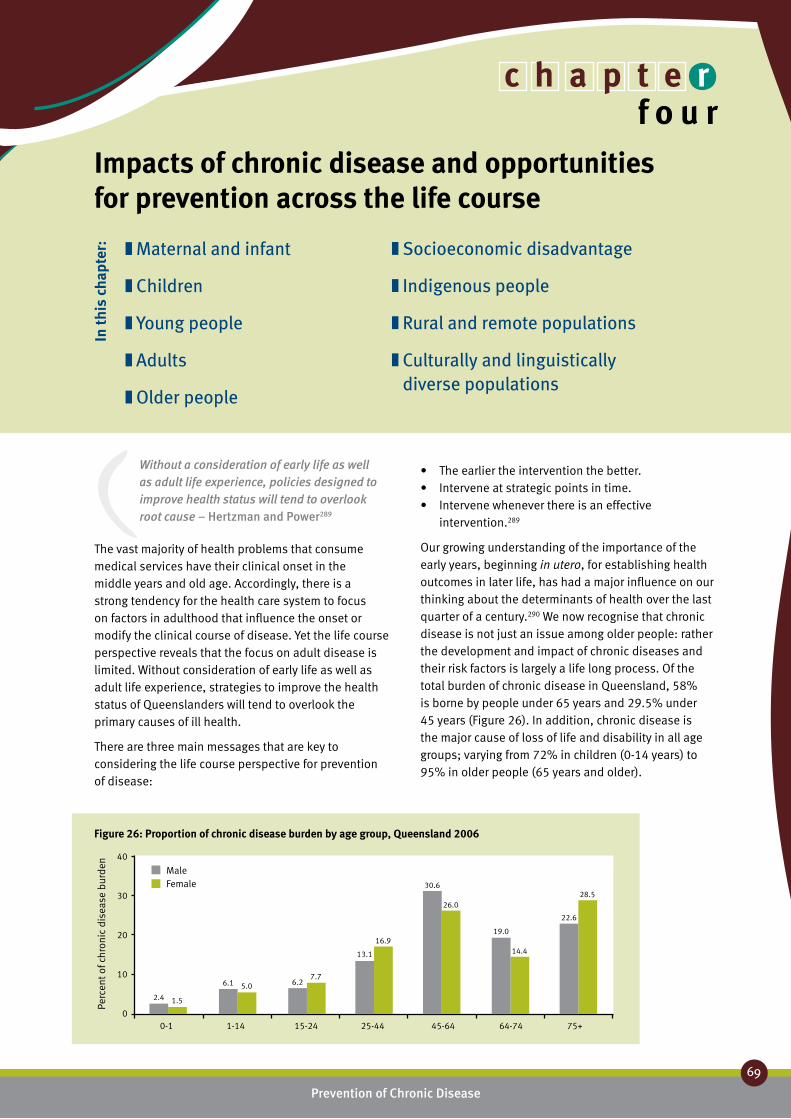
Report of the Chief Health Officer Queensland Prevention of Chronic Disease
69
Without a consideration of early life as well as adult life experience, policies designed to improve health status will tend to overlook root cause – Hertzman and Power289
The vast majority of health problems that consume medical services have their clinical onset in the middle years and old age. Accordingly, there is a strong tendency for the health care system to focus on factors in adulthood that influence the onset or modify the clinical course of disease. Yet the life course perspective reveals that the focus on adult disease is limited. Without consideration of early life as well as adult life experience, strategies to improve the health status of Queenslanders will tend to overlook the primary causes of ill health.
There are three main messages that are key to considering the life course perspective for prevention of disease:
The earlier the intervention the better.•Intervene at strategic points in time.•Intervene whenever there is an effective •intervention.289
Our growing understanding of the importance of the early years, beginning in utero, for establishing health outcomes in later life, has had a major influence on our thinking about the determinants of health over the last quarter of a century.290 We now recognise that chronic disease is not just an issue among older people: rather the development and impact of chronic diseases and their risk factors is largely a life long process. Of the total burden of chronic disease in Queensland, 58% is borne by people under 65 years and 29.5% under 45 years (Figure 26). In addition, chronic disease is the major cause of loss of life and disability in all age groups; varying from 72% in children (0-14 years) to 95% in older people (65 years and older).
Impacts of chronic disease and opportunities for prevention across the life course
Maternal and infant ❚
Children ❚
Young people ❚
Adults ❚
Older people ❚
Socioeconomic disadvantage ❚
Indigenous people ❚
Rural and remote populations ❚
Culturally and linguistically ❚
diverse populations
Figure 26: Proportion of chronic disease burden by age group, Queensland 2006
40
30
20
10
0
Perc
ent o
f chr
onic
dis
ease
bur
den
0-1 1-14 15-24 25-44 45-64 64-74 75+
2.4 1.5
6.1 5.0 6.27.7
13.1
16.9
30.6
26.0
19.0
14.4
22.6
28.5
MaleFemale
In th
is c
hapt
er:
c h a p t e rf o u r

Report of the Chief Health Officer Queensland
70
Prevention of Chronic Disease
In Queensland most children and young people are in good physical health. The caveat to this general good health is that many young people do experience mental health problems, and poor nutrition and physical inactivity are evident.16 However by early adulthood the effects of exposure to risk factors such as tobacco smoking, poor nutrition, physical inactivity and obesity may manifest as diseases such as Type 2 diabetes, or the early stages of diseases such as coronary heart disease or chronic obstructive pulmonary disease. In recent years, younger and younger people are being diagnosed with such chronic diseases. It is usually in middle age that the ‘accumulated interactions of genetic predisposition, environment and lifestyle commonly start to impact on health’.291 As the
population ages and people survive longer with cancer and chronic diseases of the circulatory and respiratory systems, dementia and related neurodegenerative disorders are likely to become more prevalent and have a greater impact on the health and welfare of older Queenslanders.164,292
This chapter describes the impact of chronic disease through the life course and the key opportunities for prevention. The epidemiology of chronic disease is described in relation to the burden of disease and injury due to risk factors (Table 11 and Figure 27) and the sociodemographic characteristics of the population. With few exceptions, the shape of the distribution of chronic disease, death and ill health
Age group (years)
0-1 1-14 15-24 25-44 45-64 65-74 75+ totalTobacco 5.1 0.7 0.2 2.0 12.1 12.8 8.3 7.8
Overweight and obesity 0.0 0.0 0.0 5.6 12.9 10.0 6.0 7.4
High blood pressure 0.0 0.0 0.0 0.8 5.0 10.0 14.8 6.6
Physical inactivity 0.0 0.0 0.6 3.4 8.5 9.0 9.3 6.5
High blood cholesterol 0.0 0.0 0.0 2.6 7.7 8.1 10.4 6.2
Alcohol -net 0.1 0.6 11.8 7.3 2.9 0.5 -1.5 2.6
Occupational exposures 0.0 0.0 3.5 3.5 3.6 1.3 0.6 2.2
Illicit drugs 0.2 0.0 9.6 3.5 1.4 0.7 0.3 1.9
Low fruit and vegetables 0.0 0.0 0.2 1.0 2.7 2.7 2.2 1.8
Intimate partner violence 0.0 0.0 4.8 3.4 1.2 0.2 0.1 1.3
Child sexual abuse 0.0 0.0 3.9 2.7 1.0 0.1 0.0 1.0
Air pollution-long term 0.0 0.0 0.0 0.3 0.8 1.1 1.4 0.7
Unsafe sex 0.0 0.0 0.9 1.2 0.6 0.3 0.2 0.5
Osteoporosis 0.0 0.0 0.0 0.0 0.0 0.1 0.7 0.2
Particulates-short term 0.0 0.0 0.0 0.0 0.1 0.2 0.3 0.1
Ozone-short term 0.0 0.0 0.0 0.0 0.1 0.2 0.3 0.1
Table 11: Proportion of burden of disease due to individual risk factors, Queensland 200329
50
40
30
20
10
0
Perc
ent o
f tot
al b
urde
n
0-1 1-14 15-24 25-44 45-64 64-74 75+
MaleFemale
47
2 1
26
17
33
25
44
33
41
3337
34
Age group (years)
Figure 27: Proportion of burden of disease and injury due to 13 risk factors, Queensland 200329
Chronic disease is not just an issue for older people – 86% of the years of
potential life lost and disability before age 75 is due to chronic disease
Report of the Chief Health Officer Queensland Prevention of Chronic Disease
71
44
across ages tends to be the same for both sexes, even though the magnitude is often very different. Therefore, describing the age structure for all persons tends to reflect the situation for both sexes.
Social and economic factors play a key role in chronic disease and risk factors. Socioeconomic status is a strong predictor of health and risk of injury.293 Lack of socioeconomic resources is associated with a higher level of risk of chronic disease and higher disease prevalence. Socioeconomic disadvantage includes poor education, low income, unemployment, limited access to health services and living in poor housing conditions. Health is also influenced by social participation and community capacity. There are a combination of structural determinants and individual risk and protective factors from social, cultural and environmental perspectives, which influence several
health behaviour and risk taking behaviours. In recent years, a life course approach to the study of health and illness has helped to explain the existence of wide socioeconomic differentials in all measures of health status.
Chronic disease strategies, both statewide and nationally, place a strong emphasis on prevention and management of modifiable risk.294 The National and Queensland frameworks for preventing chronic disease (Queensland Strategy for Chronic Disease 2005-2015)5 take a life course perspective on prevention, highlighting the importance of healthy behaviour and management of risk factors for primary prevention of chronic diseases. In addition, broader intervention strategies aiming to address common determinants of social and health problems are now being considered and implemented in Queensland.

The first few years of life, beginning even before birth,
represents a time limited opportunity to promote and
improve the health of the population
Report of the Chief Health Officer Queensland
72
Prevention of Chronic Disease
Maternal and infant ❚Every child ought to have the chance to be all that he or she could be, and the opportunities of life ought not to be determined by the circumstances of birth295
The first few years of life, beginning even before birth, represent a time limited opportunity to promote and improve the health of the population. The life course case is based on the understanding that “various biological and social factors throughout life, independently, cumulatively and interactively, influence health and disease”.296
The circumstances of birth have an important impact on the opportunity for good health in Queensland. This applies particularly to those most at risk of poorer health outcomes, such as socioeconomically disadvantaged and Indigenous people. In 2006, a male child born in Queensland could expect to live 78.5 years and a female child 83.4 years.297 However an Indigenous male child could expect to live 58.9 years and a female Indigenous child 62.6 years: about 20 years less.80 In Queensland in 2003 there was a 4.3 year gap in health adjusted life expectancy between people living in most socioeconomically advantaged areas and those living in most disadvantaged areas.28 The average Queensland baby can expect to live 9% of his or her life in ill health.28
What are the key health issues?The key health issues for infants under one year were disorders relating to low birth weight and short gestation, birth trauma and asphyxia and congenital
abnormalities. Low birth weight was the cause of 20% of the total disease burden in Queensland in infants aged 0-1 years in 2006, followed by birth trauma which caused 10.6% of burden (Table 12).
Low birth weight and prematurity directly contribute to higher neonatal death rates.298 Additional to these direct effects, the early years are also critical for long term health outcomes. Poor growth in utero leads to a variety of chronic disorders such as cardiovascular disease, Type 2 diabetes and hypertension. Low birth weight has been shown to be directly related to risk of death by coronary heart disease.299 Exposures to risk factors prior to birth may permanently alter anatomical function and a variety of metabolic processes.130 While low birth weight can be associated with several chronic diseases300 the relationship is complex and may reflect long term adverse socioeconomic circumstances, genetic processes, and maternal health and lifestyle factors such as maternal smoking.301
Males Females
Rank Specific condition % of total DALY Specific condition % of total DALY
1 Low birth weight 17.8 Low birth weight 23.2
2 Birth trauma and asphyxia 10.8 Birth trauma and asphyxia 10.2
3 Congenital heart disease 7.1 Congenital heart disease 5.5
4 Down syndrome 4.1 Asthma 4.0
5 Neonatal infections 3.8 Down syndrome 3.4
6 Autism spectrum disorders 3.6 Neonatal infections 2.9
7 Sudden infant death syndrome 2.5 Cystic fibrosis 1.8
8 Urogenital tract malformations 2.0 Epilepsy 1.6
9 Epilepsy 1.9 Sudden infant death syndrome 1.3
10 Spina bifida 1.7 Spina bifida 1.1
Total 55.3 Total 55.0
Table 12: Top specific cause of burden of disease, 0-1 year olds, Queensland 2006

More than 50% of Indigenous mothers and
18% of non-Indigenous mothers smoked
throughout their pregnancy
Report of the Chief Health Officer Queensland
72
Prevention of Chronic Disease
73
Report of the Chief Health Officer Queensland
72
4
Is there a role for prevention?The antenatal and neonatal environment is of critical importance in the prevention of chronic disease and the promotion of wellbeing over the life course.302 For the individual, being born at full term, within the normal weight range, to a mother in good health and into a supportive social environment are critical protective factors for healthy childhood, adulthood and longevity.290
Promotion and protection of health in the long term can be achieved by improving the maternal environment. This includes improving nutritional status of mothers prior to conception, throughout pregnancy and during lactation. Early access to antenatal care is important. Smoking during pregnancy needs to be reduced. Other important issues include reducing the number of low birth weight and pre-term infants (particularly among Indigenous mothers, young mothers and those from lower socioeconomic backgrounds) and improving infant nutrition in the first 12 months of life, through breastfeeding and appropriate introduction of solid foods.
What are the opportunities for prevention?Although most Queensland children are healthy and have a healthy start in life there are some who don’t. These include infants from disadvantaged backgrounds, where disadvantage refers to both the social and the economic environment, and Indigenous infants. The family and community environment into which a child is born has an effect on that child’s physical, social, and psychological growth and their future educational, psychosocial and other outcomes.33 Interventions to moderate the health burden of chronic disease need to focus on improving the outlook of Queensland’s mothers and babies. The interventions can do this by recognising the impact of the infant in the family and the community as well as recognising the social and socioeconomic characteristics of the setting.
Prevention of low birth weight and pre-term birth is key to improving the health of infant Queenslanders. Improving pre-conception health and nutritional status of young Queensland women is also important. Addressing these opportunities will include initiatives such as: Smart Choices - Healthy Food and Drink Supply Strategy for Queensland Schools,303 the Eat Well Be Active campaign,199 Growing Strong, feeding you and your baby304 and improving access to antenatal care. Many of these strategies are discussed in Chapter 5: Prevention works.
Good nutrition in the early years supports healthy growth and development and the benefits last
throughout life.250, 305 There are direct effects such as lowering the risk of excessive weight gain in childhood, improving dental health as well as preventing diet related disease in later life. Breastfeeding is helpful for both mothers and babies and is recommended by the NHMRC.306 For babies it protects against childhood infections, allergic disease and is shown to improve neurocognitive development.307 For mothers, breastfeeding promotes recovery from childbirth, fosters attachment with the child and reduces the risk of ovarian and breast cancers.259 The national guidelines recommend infants should be fed only breast milk for the first six months, with the appropriate introduction of solid foods at around six months with breastfeeding continued until at least 12 months of age.308 Increasing initiation of breastfeeding at birth and supporting mothers to breast feed in the first 12 months is very important to enable lifelong benefits. Ensuring all mothers are supported in their efforts to breastfeed is important. In Australia between 1995 and 2004/05, while overall duration of breastfeeding remained constant, the gap between breastfeeding practices of the most advantaged and least advantaged mothers widened considerably.309
Reducing smoking rates amongst pregnant mothers is another key issue. More than half of Indigenous mothers and one in five non-Indigenous mothers smoke throughout their pregnancy, with very few quitting by 20 weeks. Smoking during pregnancy doubles the risk of low birth weight.220,310 In addition, infants exposed to tobacco smoke as a result of either parent smoking are at greater risk of SIDS (double the risk) and other childhood conditions including middle ear disease (30% higher risk).221 In Queensland in 2003, 5.1% of the total disease burden in infants 0-1 years was due to maternal smoking (Table 11). There is overwhelming evidence about the benefits of helping expectant mothers reduce smoking.218 In Queensland, programs such as SmokeCheck and the National Smoke-free Pregnancy Project address this issue.
Facts and figures:In Queensland, the number of births per head of population is slightly higher than the national rate, consistent with the younger age profile of the Queensland population. In 2005, there were 1383 births per 100,000 Queensland residents, in comparison to 1336 per 100,000 nationally.311 The fertility rate of Queensland women aged 15-49 years in 2006 was 1.8 births per 1000 women, and has been declining for many years. In 1947 the fertility rate was 3.4 births per 1000 women.312
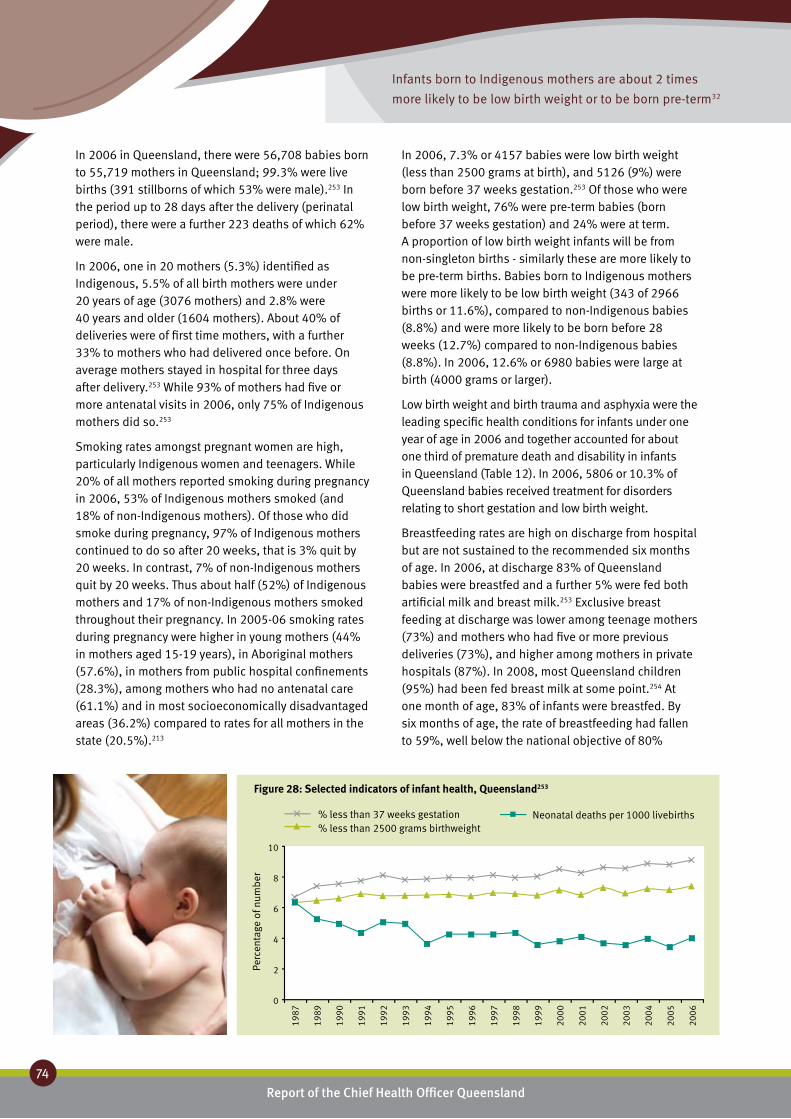
Infants born to Indigenous mothers are about 2 times
more likely to be low birth weight or to be born pre-term32
Report of the Chief Health Officer Queensland
74
Prevention of Chronic Disease
In 2006 in Queensland, there were 56,708 babies born to 55,719 mothers in Queensland; 99.3% were live births (391 stillborns of which 53% were male).253 In the period up to 28 days after the delivery (perinatal period), there were a further 223 deaths of which 62% were male.
In 2006, one in 20 mothers (5.3%) identified as Indigenous, 5.5% of all birth mothers were under 20 years of age (3076 mothers) and 2.8% were 40 years and older (1604 mothers). About 40% of deliveries were of first time mothers, with a further 33% to mothers who had delivered once before. On average mothers stayed in hospital for three days after delivery.253 While 93% of mothers had five or more antenatal visits in 2006, only 75% of Indigenous mothers did so.253
Smoking rates amongst pregnant women are high, particularly Indigenous women and teenagers. While 20% of all mothers reported smoking during pregnancy in 2006, 53% of Indigenous mothers smoked (and 18% of non-Indigenous mothers). Of those who did smoke during pregnancy, 97% of Indigenous mothers continued to do so after 20 weeks, that is 3% quit by 20 weeks. In contrast, 7% of non-Indigenous mothers quit by 20 weeks. Thus about half (52%) of Indigenous mothers and 17% of non-Indigenous mothers smoked throughout their pregnancy. In 2005-06 smoking rates during pregnancy were higher in young mothers (44% in mothers aged 15-19 years), in Aboriginal mothers (57.6%), in mothers from public hospital confinements (28.3%), among mothers who had no antenatal care (61.1%) and in most socioeconomically disadvantaged areas (36.2%) compared to rates for all mothers in the state (20.5%).213
In 2006, 7.3% or 4157 babies were low birth weight (less than 2500 grams at birth), and 5126 (9%) were born before 37 weeks gestation.253 Of those who were low birth weight, 76% were pre-term babies (born before 37 weeks gestation) and 24% were at term. A proportion of low birth weight infants will be from non-singleton births - similarly these are more likely to be pre-term births. Babies born to Indigenous mothers were more likely to be low birth weight (343 of 2966 births or 11.6%), compared to non-Indigenous babies (8.8%) and were more likely to be born before 28 weeks (12.7%) compared to non-Indigenous babies (8.8%). In 2006, 12.6% or 6980 babies were large at birth (4000 grams or larger).
Low birth weight and birth trauma and asphyxia were the leading specific health conditions for infants under one year of age in 2006 and together accounted for about one third of premature death and disability in infants in Queensland (Table 12). In 2006, 5806 or 10.3% of Queensland babies received treatment for disorders relating to short gestation and low birth weight.
Breastfeeding rates are high on discharge from hospital but are not sustained to the recommended six months of age. In 2006, at discharge 83% of Queensland babies were breastfed and a further 5% were fed both artificial milk and breast milk.253 Exclusive breast feeding at discharge was lower among teenage mothers (73%) and mothers who had five or more previous deliveries (73%), and higher among mothers in private hospitals (87%). In 2008, most Queensland children (95%) had been fed breast milk at some point.254 At one month of age, 83% of infants were breastfed. By six months of age, the rate of breastfeeding had fallen to 59%, well below the national objective of 80%
10
8
6
4
2
0
Perc
enta
ge o
f num
ber
1987
1989
1990
1991
1992
1993
1994
1995
1996
1997
1998
1999
2000
2001
2002
2003
2004
2005
2006
Figure 28: Selected indicators of infant health, Queensland253
% less than 37 weeks gestation% less than 2500 grams birthweight
Neonatal deaths per 1000 livebirths

The rate of exclusive breastfeeding for the first six months is 13%,
well short of the state target of 50%
Report of the Chief Health Officer Queensland Prevention of Chronic Disease
75
44
breastfeeding at six months. The rate of breastfeeding at 12 months of age was 33%.
While the rate of exclusive breastfeeding for the first three months (55%) is close to the state target of 60%, the rate of exclusive breastfeeding for the first six months (13%) falls well short of the state target of 50%. The rate of introduction of appropriate solid foods at around six months is 60.9%.254
Childhood vaccination prevents a number of previously common diseases including measles, diphtheria, poliomyelitis, rubella and mumps as well as rarer but serious diseases such as invasive disease caused by meningococcal C and Haemophilus influenzae type b (Hib) bacteria. Newer vaccines protect against rotavirus gastroenteritis and chickenpox. Childhood vaccination is one of the most cost-effective of all preventive services.313 Free vaccines are provided to Queensland children under the National Immunisation Program. In the quarter April to June 2008, in Queensland, 90.8% of infants aged 12 to 15 months had been fully immunised.314 This is comparable to the national rate of 91.2%.
In 2006 in Queensland, the infant mortality rate was 4.9 deaths per 1000 live births. The Indigenous infant mortality rate in 2006 was 2.2 times higher than the non-Indigenous rate: 10.8 deaths per 1000 live births compared with 4.9 deaths per 1000 live births, based on data from the Queensland Registrar General (Figure 29). It is likely that under reporting of birth registrations in Queensland may lead to an over estimate of infant mortality, with greater effect on Indigenous rates than non-Indigenous rates. Babies born to Indigenous mothers have mortality rates 2.4 times higher than those of the rest of the population, regardless of whether they live in urban, rural or remote areas.315
Maternal deaths occur infrequently in Australia. In Queensland in the three year period 2003 to 2005,
there were 18 maternal deaths.316 Queensland has reported the highest maternal mortality rate of all the states in 2000-2005, although comparisons must be interpreted with caution as small numbers produce rates of high variability.
What is changing?The number of babies born in Queensland has been increasing for decades. In the last 10 years there has been an increase of about 20% in the number of births and in the last 20 years an increase of 44%. Since 1987, there has been a steady decline in the neonatal death rate (defined as a death within 28 days of an infant born alive of birth weight at least 400 grams, or at least 20 weeks gestation) and the stillbirth rate has remained constant (Figure 28). However in this 20 year period, there has been a 17% increase in the proportion of low birth weight infants and 36% increase in pre-term infants. The proportion of multiple births in Queensland over this period has increased by about 50%. The increasing number of births in Queensland has magnified the impact of these increasing rates; there was a 70% increase in the number of low birth weight babies and a 97% increase in pre-term infants (Figure 29). While there has been a small steady increase in the overall proportion of low birth weight infants, for non-Indigenous babies born at full term there has been a steady decrease, thus the increase in low birth weight is associated with pre-term births.317 There has been no change in the proportion of low birth weight infants born to Indigenous mothers (overall or at term) from 1988 to 2002.
The rate of SIDS has declined over the past decade, and in 2006 there were nine deaths due to SIDS in Queensland. The age standardised maternal death rate in Australia varies from year to year with little evidence of changing trend in recent decades.316
The proportion of Queensland mothers who were breastfeeding increased between 2003 and 2008. There was a 1.7% increase in the proportion of infants that had been fed breast milk at some point, a 4.0% increase in those breastfed at one month, 2.4% at six months and 1.4% in infants breastfed at 12 months.254, 256 There was no change in the rate of breast feeding on discharge from hospital between 2000 and 2006 in Queensland.253
15
10
5
0
Infa
nt m
orta
lity
rate
(d
eath
s pe
r 100
0 liv
e bi
rths
)
1998
1999
2000
2001
2002
2003
2004
2005
2006
Figure 29: Trend in infant mortality, Queensland
Qld Indigenous Qld non-Indigenous
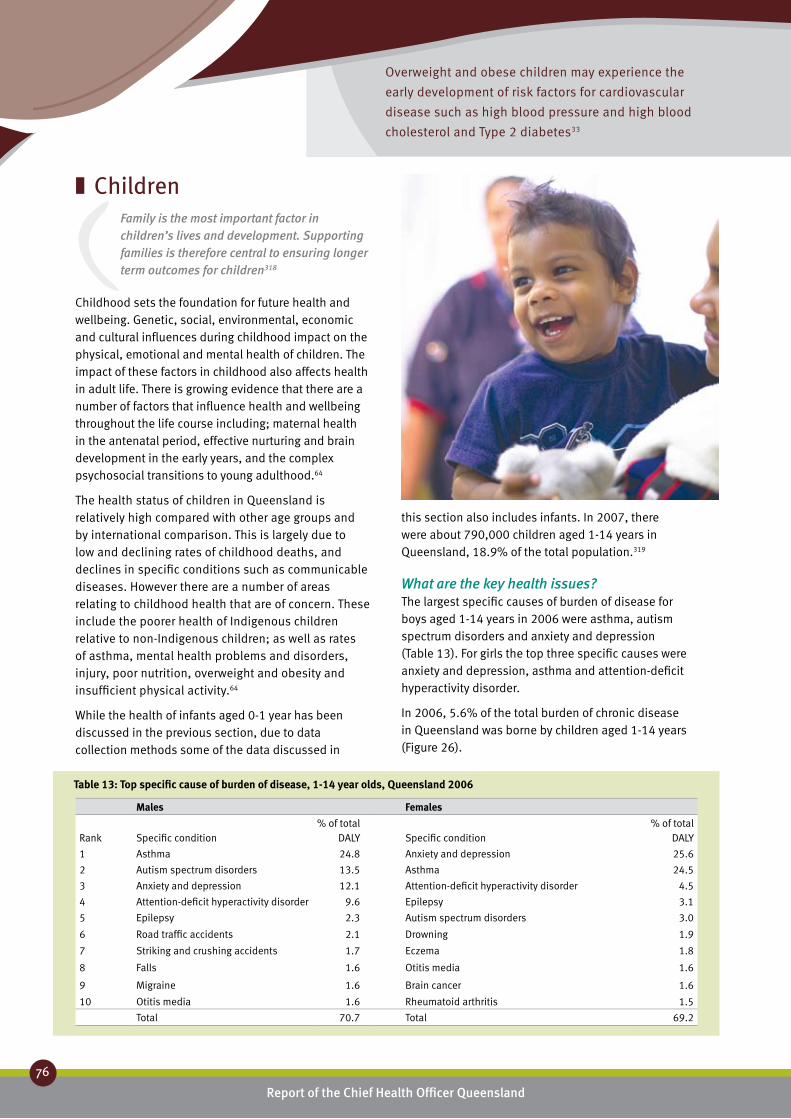
Overweight and obese children may experience the
early development of risk factors for cardiovascular
disease such as high blood pressure and high blood
cholesterol and Type 2 diabetes33
Report of the Chief Health Officer Queensland
76
Prevention of Chronic Disease
Children ❚Family is the most important factor in children’s lives and development. Supporting families is therefore central to ensuring longer term outcomes for children318
Childhood sets the foundation for future health and wellbeing. Genetic, social, environmental, economic and cultural influences during childhood impact on the physical, emotional and mental health of children. The impact of these factors in childhood also affects health in adult life. There is growing evidence that there are a number of factors that influence health and wellbeing throughout the life course including; maternal health in the antenatal period, effective nurturing and brain development in the early years, and the complex psychosocial transitions to young adulthood.64
The health status of children in Queensland is relatively high compared with other age groups and by international comparison. This is largely due to low and declining rates of childhood deaths, and declines in specific conditions such as communicable diseases. However there are a number of areas relating to childhood health that are of concern. These include the poorer health of Indigenous children relative to non-Indigenous children; as well as rates of asthma, mental health problems and disorders, injury, poor nutrition, overweight and obesity and insufficient physical activity.64
While the health of infants aged 0-1 year has been discussed in the previous section, due to data collection methods some of the data discussed in
this section also includes infants. In 2007, there were about 790,000 children aged 1-14 years in Queensland, 18.9% of the total population.319
What are the key health issues?The largest specific causes of burden of disease for boys aged 1-14 years in 2006 were asthma, autism spectrum disorders and anxiety and depression (Table 13). For girls the top three specific causes were anxiety and depression, asthma and attention-deficit hyperactivity disorder.
In 2006, 5.6% of the total burden of chronic disease in Queensland was borne by children aged 1-14 years (Figure 26).
Males Females Rank
Specific condition
% of total DALY
Specific condition
% of total DALY
1 Asthma 24.8 Anxiety and depression 25.6
2 Autism spectrum disorders 13.5 Asthma 24.5
3 Anxiety and depression 12.1 Attention-deficit hyperactivity disorder 4.5
4 Attention-deficit hyperactivity disorder 9.6 Epilepsy 3.1
5 Epilepsy 2.3 Autism spectrum disorders 3.0
6 Road traffic accidents 2.1 Drowning 1.9
7 Striking and crushing accidents 1.7 Eczema 1.8
8 Falls 1.6 Otitis media 1.6
9 Migraine 1.6 Brain cancer 1.6
10 Otitis media 1.6 Rheumatoid arthritis 1.5
Total 70.7 Total 69.2
Table 13: Top specific cause of burden of disease, 1-14 year olds, Queensland 2006
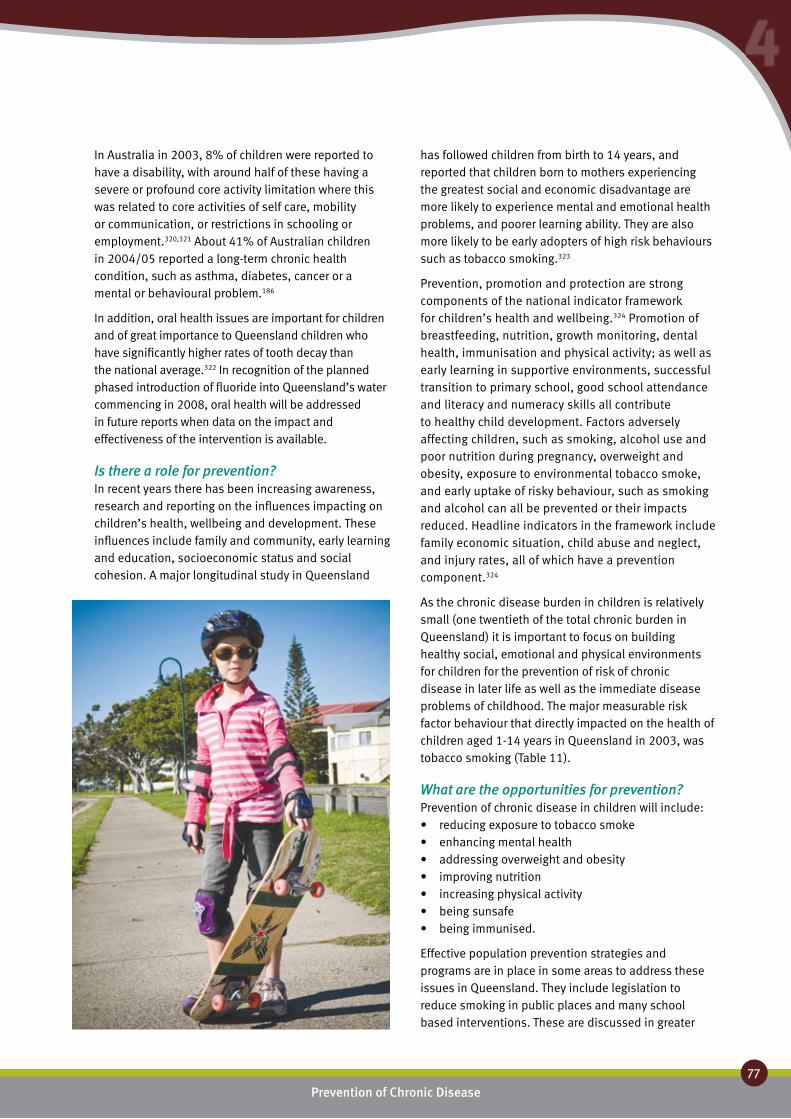
Report of the Chief Health Officer Queensland Prevention of Chronic Disease
77
44
In Australia in 2003, 8% of children were reported to have a disability, with around half of these having a severe or profound core activity limitation where this was related to core activities of self care, mobility or communication, or restrictions in schooling or employment.320,321 About 41% of Australian children in 2004/05 reported a long-term chronic health condition, such as asthma, diabetes, cancer or a mental or behavioural problem.186
In addition, oral health issues are important for children and of great importance to Queensland children who have significantly higher rates of tooth decay than the national average.322 In recognition of the planned phased introduction of fluoride into Queensland’s water commencing in 2008, oral health will be addressed in future reports when data on the impact and effectiveness of the intervention is available.
Is there a role for prevention?In recent years there has been increasing awareness, research and reporting on the influences impacting on children’s health, wellbeing and development. These influences include family and community, early learning and education, socioeconomic status and social cohesion. A major longitudinal study in Queensland
has followed children from birth to 14 years, and reported that children born to mothers experiencing the greatest social and economic disadvantage are more likely to experience mental and emotional health problems, and poorer learning ability. They are also more likely to be early adopters of high risk behaviours such as tobacco smoking.323
Prevention, promotion and protection are strong components of the national indicator framework for children’s health and wellbeing.324 Promotion of breastfeeding, nutrition, growth monitoring, dental health, immunisation and physical activity; as well as early learning in supportive environments, successful transition to primary school, good school attendance and literacy and numeracy skills all contribute to healthy child development. Factors adversely affecting children, such as smoking, alcohol use and poor nutrition during pregnancy, overweight and obesity, exposure to environmental tobacco smoke, and early uptake of risky behaviour, such as smoking and alcohol can all be prevented or their impacts reduced. Headline indicators in the framework include family economic situation, child abuse and neglect, and injury rates, all of which have a prevention component.324
As the chronic disease burden in children is relatively small (one twentieth of the total chronic burden in Queensland) it is important to focus on building healthy social, emotional and physical environments for children for the prevention of risk of chronic disease in later life as well as the immediate disease problems of childhood. The major measurable risk factor behaviour that directly impacted on the health of children aged 1-14 years in Queensland in 2003, was tobacco smoking (Table 11).
What are the opportunities for prevention?Prevention of chronic disease in children will include:
reducing exposure to tobacco smoke•enhancing mental health•addressing overweight and obesity•improving nutrition•increasing physical activity•being sunsafe•being immunised.•
Effective population prevention strategies and programs are in place in some areas to address these issues in Queensland. They include legislation to reduce smoking in public places and many school based interventions. These are discussed in greater

About 40% of children who have asthma live with adult
smokers and are likely to be exposed to passive smoke
Report of the Chief Health Officer Queensland
78
Prevention of Chronic Disease
detail in Chapter 5: Prevention works. In addition the Australian government has introduced a health check for all four year olds to identify early risks and ensure appropriate treatment is provided.
Infants and children are particularly susceptible to environmental tobacco smoking because they have limited control over their physical environment and because their immune system and respiratory functioning are still developing.325 Due to the significant potential harm to children from tobacco exposure, implementing effective tobacco control through legislation and other government initiatives is an important response.33
Under the supervision of a GP, asthma can largely be controlled by good management. Medications, asthma management and education continue to improve. Written asthma plans improve asthma outcomes in children. Despite this, there are still few people with written asthma plans, albeit a higher proportion for children than adults.189 About 8% of childhood asthma is due to environmental tobacco smoke.325 About 40% of children who have asthma live with adult smokers and are likely to be exposed to passive smoke. Exposure to passive smoking can exacerbate conditions such as asthma.186 Children with asthma who live in the most disadvantaged areas were significantly more likely to live in a household with one or more regular smokers compared to more advantaged areas.189
Risk and protective factors for mental health in children are wide ranging and occur at varying levels including individuals, family, school context, life events and situations, and community and cultural factors. In 2007, a Queensland Health report provided evidence based recommendations to support population health policy and practice with regard to mental health and wellbeing in childhood.326 There is established evidence that quality centre based programs have a positive effect on child development. However less is known about the impact of centre based programs on a child’s mental health. There is also established evidence that prenatal and early childhood home visiting programs are effective in promoting child development, parent/child interaction and parenting skills, particularly in low income families.326
In the short term, children who are overweight or obese experience psycho-social problems such as poor body image and low self-esteem and a range of health problems such as asthma and sleep apnoea. Longer term, overweight and obese children may also experience the early development of risk factors for
cardiovascular disease such as high blood pressure and high blood cholesterol. Young people who were overweight or obese as children are more likely to be overweight as adults. Overweight and obesity in adults is a risk factor for a number of health conditions including cardiovascular disease, Type 2 diabetes, and certain cancers,33, 234 as discussed in Chapter 2: Chronic disease.
A recent Australian study found that overweight or obese children had more television time than healthy weight children. They were also more likely to live in a household where children had a television in their bedroom (25%) compared to healthy weight children (17%).327 There is clear evidence of the association between television viewing and childhood obesity228 and the increased adult risk of obesity.228 Much of this association is related to eating behaviours, particularly in relation to the advertising of energy dense foods.228 The Coalition on Food Advertising to Children has recently reported that Australian parents are concerned about food advertising (56.6% are somewhat or very concerned), and particularly unhealthy food advertising (67.3% are somewhat or very concerned) during times when children watch television. Parents are concerned that advertising influences children to prefer unhealthy foods and so are supportive of the introduction of stronger regulations, and in particular, a ban on unhealthy food advertising at times when children watch television.328
While there is some evidence that Queensland’s investment in prevention programs is starting to have an effect, there is still much to be achieved in terms of preventing overweight and obesity and promoting good health. The Healthy Kids Queensland Survey 2006 reported that Queensland children are still eating too much sugar and fat, with low intakes of milk and dairy products (calcium intake) and vegetables, and relatively low intakes of fruit.16
Breastfeeding plays a major role in protecting infants against infection and chronic diseases such as diabetes and asthma, and it has been suggested that it also reduces the risk of obesity in childhood.17 All children need good nutrition and sufficient physical activity to achieve physical and emotional wellbeing and to maintain a healthy weight.
Sun safe behaviours are vital to reduce the risk of skin cancer. In Queensland in 2006, parents of children aged 0-12 years reported that 84.1% always or mostly ensured that their children wore a hat when outdoors for at least 15 minutes on a sunny day.329 About three

Report of the Chief Health Officer Queensland Prevention of Chronic Disease
79
44
quarters of parents (75.2%) always or mostly ensured that their children were covered up with clothes. About two thirds (67.6%) of parents reported that they always or mostly applied or supervised the application of sunscreen when children were outdoors for at least 15 minutes on a sunny day.
Although the incidence of vaccine-preventable diseases in Australia has been reduced since the introduction of immunisation, these diseases remain a serious concern. Vaccine coverage needs to be high to achieve and maintain the level of community protection necessary to prevent outbreaks. Most children in Queensland continue to be vaccinated against major vaccine preventable childhood diseases. In the quarter April - June 2008 the proportions of two year olds (92.6%) and five year olds (87.3%) fully vaccinated in Queensland were similar to those for Australia (92.8% and 87.3% respectively).330 As the diseases prevented by childhood vaccination are not chronic diseases, they are not described further in this report.
The Australian Government has introduced the Healthy Kids Check to ensure that every four year old child in Australia has a basic health check.331 This consultation will be covered by Medicare, and will promote early detection of lifestyle risk factors, delayed development and illness, and introduce guidance for healthy lifestyles and early intervention strategies. The Healthy Kids Check will take place at or around the same time as the four year old immunisation. There is a specific health check for Indigenous children.332
Facts and figures:
DemographicAt the latest census (2006) there were 754,000 children aged between 1 and 14 years in Queensland; about 204,000 were aged 1-4 years and the remaining 550,000 were aged 5-14 years, together representing about 20% of the population. In 2006, 6.8% of Queensland’s children were Indigenous, 88.6% had been born in Australia, 3.8% were born in mainly English speaking countries and 2.3% in non-English speaking countries.333 About half lived in major cities (49.9%), 46.6% lived in regional areas and 3.5% lived in remote locations.
Chronic diseaseIn 2006/07, there were 104,709 hospitalisations among children aged 0-14 years, which represented 7.1% of all hospitalisations in Queensland. Of those children hospitalised, 57% were boys.1
After infancy (0-1 year) the death rates for children drop dramatically,186 with the lowest death rates among children aged 10-14 years. Over the last two decades the childhood mortality rate in Australia has more then halved.186 In Queensland in 2006, there were 391 deaths among children aged 0-14 years representing 1.6% of all deaths with 62% of these deaths in male children. The leading cause of death in Australia in children aged 1-14 years remains injury and poisoning.186 The mortality rate for Indigenous children is around three times that of non-Indigenous children.186
Asthma was the largest cause of the burden of disease in Queensland children aged 1-14 years in 2006, causing 24.6% of the total burden in this age group. In 2004/05, the prevalence of asthma in Queensland children aged 0-14 years was 12.3%.15 Over recent years there is some evidence that the prevalence is decreasing slightly.189 All hospitalisations due to asthma are considered preventable by health care in the ambulatory care setting. When hospital admission does occur, it is predominately in preschool aged children and is almost always brief.189 Nevertheless, asthma remains a common health concern among children resulting in a substantial burden of health care utilisation.
The rate of new cases of Type 1 diabetes in children is increasing. Between 2000 and 2006 in Australia the age-adjusted incidence rate increased significantly from 19.2 to 22.6 per 100,000. Queensland rates for children aged 0-14 years were higher than the national rate at 23.1
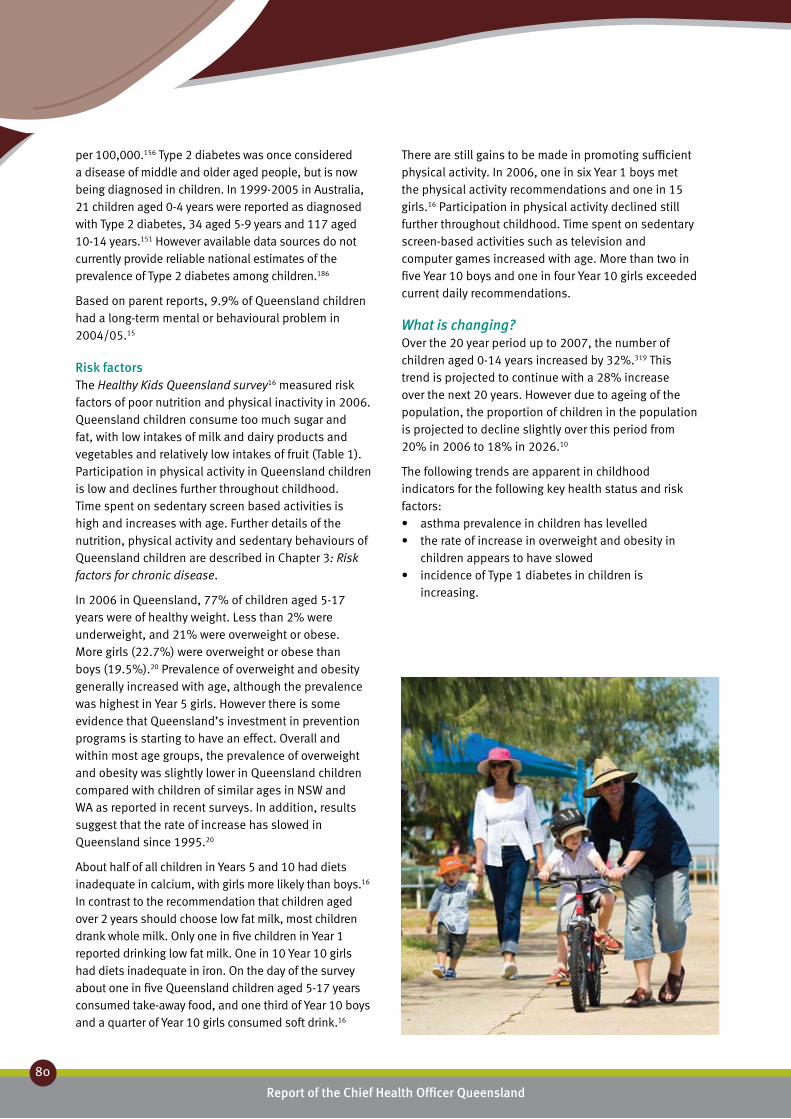
Report of the Chief Health Officer Queensland
80
Prevention of Chronic Disease
per 100,000.156 Type 2 diabetes was once considered a disease of middle and older aged people, but is now being diagnosed in children. In 1999-2005 in Australia, 21 children aged 0-4 years were reported as diagnosed with Type 2 diabetes, 34 aged 5-9 years and 117 aged 10-14 years.151 However available data sources do not currently provide reliable national estimates of the prevalence of Type 2 diabetes among children.186
Based on parent reports, 9.9% of Queensland children had a long-term mental or behavioural problem in 2004/05.15
Risk factorsThe Healthy Kids Queensland survey16 measured risk factors of poor nutrition and physical inactivity in 2006. Queensland children consume too much sugar and fat, with low intakes of milk and dairy products and vegetables and relatively low intakes of fruit (Table 1). Participation in physical activity in Queensland children is low and declines further throughout childhood. Time spent on sedentary screen based activities is high and increases with age. Further details of the nutrition, physical activity and sedentary behaviours of Queensland children are described in Chapter 3: Risk factors for chronic disease.
In 2006 in Queensland, 77% of children aged 5-17 years were of healthy weight. Less than 2% were underweight, and 21% were overweight or obese. More girls (22.7%) were overweight or obese than boys (19.5%).20 Prevalence of overweight and obesity generally increased with age, although the prevalence was highest in Year 5 girls. However there is some evidence that Queensland’s investment in prevention programs is starting to have an effect. Overall and within most age groups, the prevalence of overweight and obesity was slightly lower in Queensland children compared with children of similar ages in NSW and WA as reported in recent surveys. In addition, results suggest that the rate of increase has slowed in Queensland since 1995.20
About half of all children in Years 5 and 10 had diets inadequate in calcium, with girls more likely than boys.16 In contrast to the recommendation that children aged over 2 years should choose low fat milk, most children drank whole milk. Only one in five children in Year 1 reported drinking low fat milk. One in 10 Year 10 girls had diets inadequate in iron. On the day of the survey about one in five Queensland children aged 5-17 years consumed take-away food, and one third of Year 10 boys and a quarter of Year 10 girls consumed soft drink.16
There are still gains to be made in promoting sufficient physical activity. In 2006, one in six Year 1 boys met the physical activity recommendations and one in 15 girls.16 Participation in physical activity declined still further throughout childhood. Time spent on sedentary screen-based activities such as television and computer games increased with age. More than two in five Year 10 boys and one in four Year 10 girls exceeded current daily recommendations.
What is changing?Over the 20 year period up to 2007, the number of children aged 0-14 years increased by 32%.319 This trend is projected to continue with a 28% increase over the next 20 years. However due to ageing of the population, the proportion of children in the population is projected to decline slightly over this period from 20% in 2006 to 18% in 2026.10
The following trends are apparent in childhood indicators for the following key health status and risk factors:
asthma prevalence in children has levelled•the rate of increase in overweight and obesity in •children appears to have slowedincidence of Type 1 diabetes in children is •increasing.
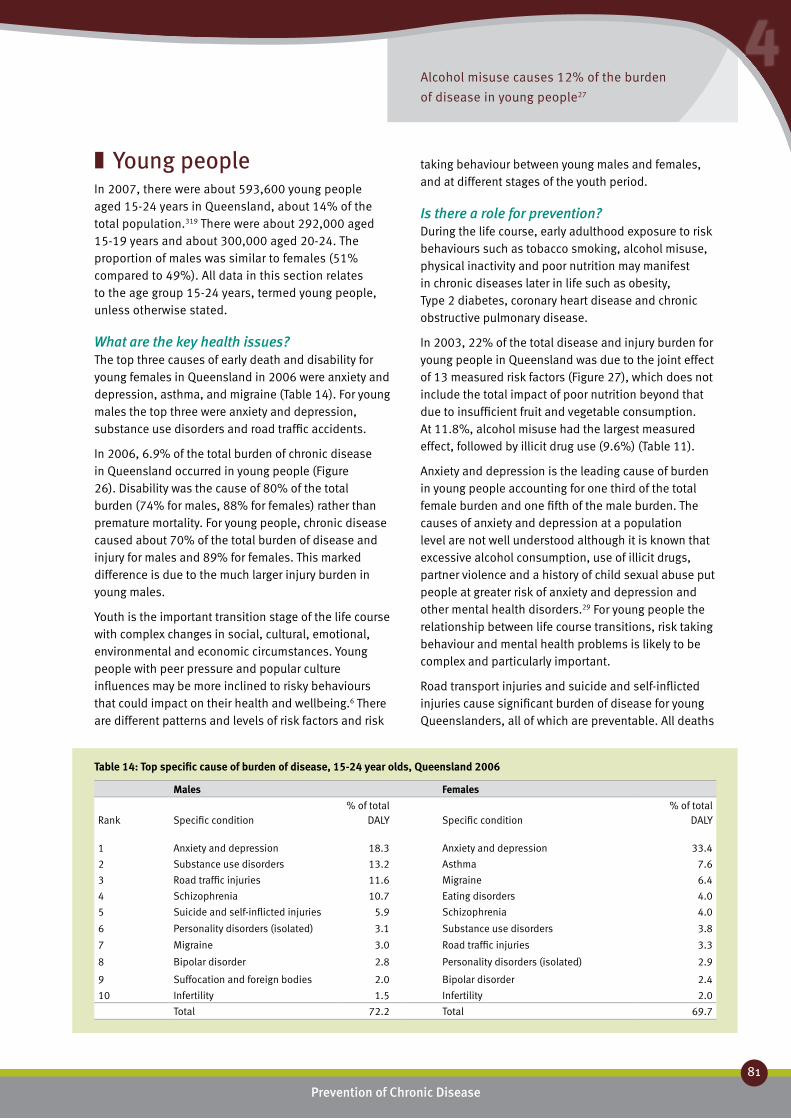
Alcohol misuse causes 12% of the burden
of disease in young people27
Report of the Chief Health Officer Queensland Prevention of Chronic Disease
81
44
Young people ❚In 2007, there were about 593,600 young people aged 15-24 years in Queensland, about 14% of the total population.319 There were about 292,000 aged 15-19 years and about 300,000 aged 20-24. The proportion of males was similar to females (51% compared to 49%). All data in this section relates to the age group 15-24 years, termed young people, unless otherwise stated.
What are the key health issues?The top three causes of early death and disability for young females in Queensland in 2006 were anxiety and depression, asthma, and migraine (Table 14). For young males the top three were anxiety and depression, substance use disorders and road traffic accidents.
In 2006, 6.9% of the total burden of chronic disease in Queensland occurred in young people (Figure 26). Disability was the cause of 80% of the total burden (74% for males, 88% for females) rather than premature mortality. For young people, chronic disease caused about 70% of the total burden of disease and injury for males and 89% for females. This marked difference is due to the much larger injury burden in young males.
Youth is the important transition stage of the life course with complex changes in social, cultural, emotional, environmental and economic circumstances. Young people with peer pressure and popular culture influences may be more inclined to risky behaviours that could impact on their health and wellbeing.6 There are different patterns and levels of risk factors and risk
taking behaviour between young males and females, and at different stages of the youth period.
Is there a role for prevention?During the life course, early adulthood exposure to risk behaviours such as tobacco smoking, alcohol misuse, physical inactivity and poor nutrition may manifest in chronic diseases later in life such as obesity, Type 2 diabetes, coronary heart disease and chronic obstructive pulmonary disease.
In 2003, 22% of the total disease and injury burden for young people in Queensland was due to the joint effect of 13 measured risk factors (Figure 27), which does not include the total impact of poor nutrition beyond that due to insufficient fruit and vegetable consumption. At 11.8%, alcohol misuse had the largest measured effect, followed by illicit drug use (9.6%) (Table 11).
Anxiety and depression is the leading cause of burden in young people accounting for one third of the total female burden and one fifth of the male burden. The causes of anxiety and depression at a population level are not well understood although it is known that excessive alcohol consumption, use of illicit drugs, partner violence and a history of child sexual abuse put people at greater risk of anxiety and depression and other mental health disorders.29 For young people the relationship between life course transitions, risk taking behaviour and mental health problems is likely to be complex and particularly important.
Road transport injuries and suicide and self-inflicted injuries cause significant burden of disease for young Queenslanders, all of which are preventable. All deaths
Males Females Rank
Specific condition
% of total DALY
Specific condition
% of total DALY
1 Anxiety and depression 18.3 Anxiety and depression 33.4
2 Substance use disorders 13.2 Asthma 7.6
3 Road traffic injuries 11.6 Migraine 6.4
4 Schizophrenia 10.7 Eating disorders 4.0
5 Suicide and self-inflicted injuries 5.9 Schizophrenia 4.0
6 Personality disorders (isolated) 3.1 Substance use disorders 3.8
7 Migraine 3.0 Road traffic injuries 3.3
8 Bipolar disorder 2.8 Personality disorders (isolated) 2.9
9 Suffocation and foreign bodies 2.0 Bipolar disorder 2.4
10 Infertility 1.5 Infertility 2.0
Total 72.2 Total 69.7
Table 14: Top specific cause of burden of disease, 15-24 year olds, Queensland 2006

Anxiety and depression was the largest specific cause of premature
death and disability in young people in Queensland – causing
18.3% of the male burden and 33.4% of the female burden27
Report of the Chief Health Officer Queensland
82
Prevention of Chronic Disease
due to road transport injury and suicide are nationally classified as avoidable through prevention and timely and effective treatment.82 As a result of substantial investment in a range of prevention and protection programs, suicide rates have been steadily declining in recent years (Table 1). Suicide and road transport deaths are not considered chronic diseases, and are not further discussed in this report.
What are the opportunities for prevention?Youth is a critical time for the development of health behaviours, as the patterns that develop when people are young often continue into adulthood.334 Health behaviours are an important determinant of both current and future health status of the population, especially of young people. Health behaviours are modifiable actions taken by young people that affect their health either positively, (for example physical activity and nutrition), or negatively (smoking) and can impact on health in the short term (alcohol misuse and road traffic injuries) and/or long term (Type 2 diabetes). It is also important to promote a healthy weight rather than focusing on overweight and obesity, to prevent eating disorders and body image issues which affect a number of Queensland’s young people.
Young people experience health risk factors and risk taking behaviour differently from other age groups. Youth is a time of heightened risk taking behaviours, some of which are undertaken under the influence of alcohol and illicit drugs. Alcohol misuse and illicit drug use are the major risk factors for chronic disease in this age group. Thus prevention of risk taking behaviours will have broad impact on the health and wellbeing of young people now and as they age. Studies indicate that nicotine addition may be heightened if smoking is initiated in adolescence. People who start smoking in their teens are more likely to become lifelong smokers.53 Teens who anticipate quitting as they reach adulthood find it very hard to do so.207
The prevention of chronic disease in Queensland now and in the future requires implementation of interventions that directly target young people, as well as broader interventions for the whole population. Because of the complexity of health behaviours and the determinants of these behaviours, each of these interventions includes multiple strategies and is implemented by multiple sectors in Queensland. Interventions specifically to prevent chronic disease in young people include: ‘Young Women & Alcohol Campaign: “Make up your own mind about drinking”,277
Smart Choices Healthy Food and Drink Supply Strategy for Queensland Schools303 and Smart Moves in Queensland schools.335
Chapter 3: Risk factors for chronic disease describes these risk factors for young people in detail. Chapter 5: Prevention works highlights the breadth of current Queensland activity to prevent chronic disease risk factors and some success stories in preventing the risk factors of chronic disease.
Facts and figures:
DemographicOne third of young people in Queensland in 2006 were dependent students.333 Almost 60% were employed, with about half of these in full time positions, while 26% were not in the labour force. Compared to the total population, a higher proportion of young people live in cities than in regional or remote areas. Over half lived in major cities (56.5%), compared with 48% of total population, 40.8% lived in regional areas and 2.7% lived in remote locations, compared with 45% and 3% respectively. In 2006, 4.8% of Queensland’s young people were Indigenous; 80.5% had been born in Australia, 5.9% were born in mainly English speaking countries and 7.0% in non-English speaking countries.333
Chronic diseaseAlthough young people aged 15-24 years comprised 14.2% of the population they accounted for 7.8% of the total burden of disease and injury in 2006 and 6.9% of the chronic disease burden. The top 10 specific causes of disease burden accounted for about two thirds of the total burden of disease and injury in 2006.
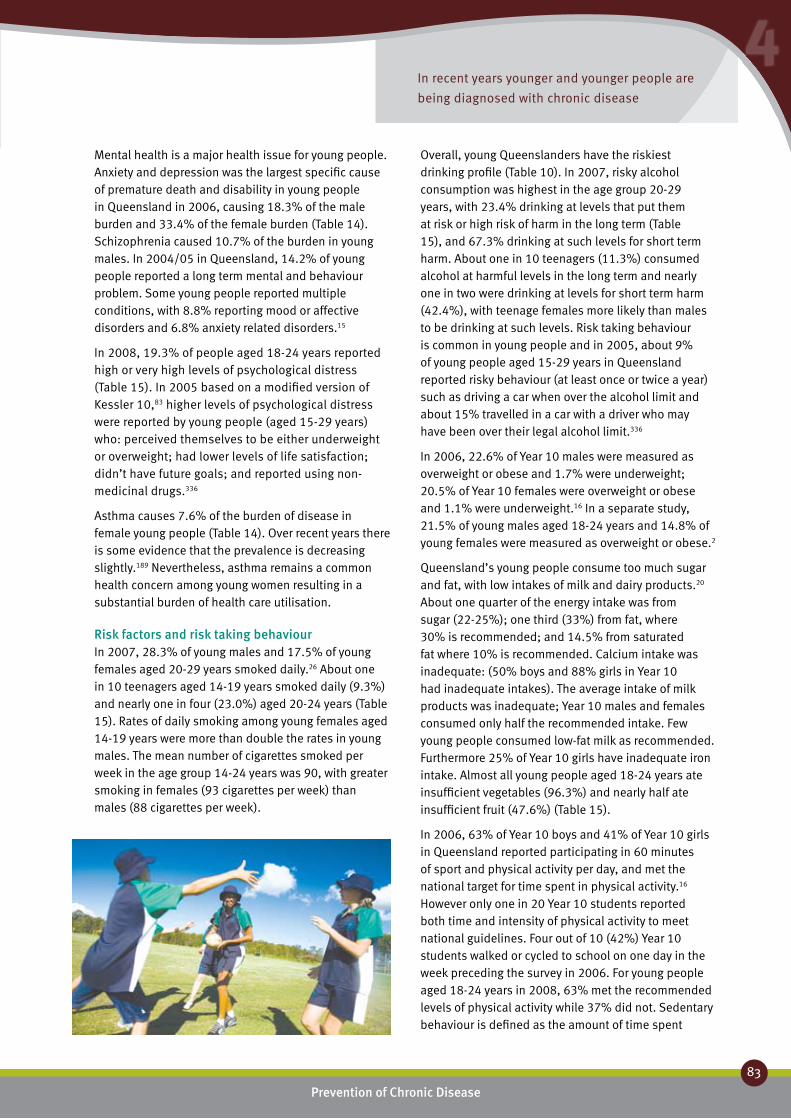
In recent years younger and younger people are
being diagnosed with chronic disease
Report of the Chief Health Officer Queensland Prevention of Chronic Disease
83
44
Mental health is a major health issue for young people. Anxiety and depression was the largest specific cause of premature death and disability in young people in Queensland in 2006, causing 18.3% of the male burden and 33.4% of the female burden (Table 14). Schizophrenia caused 10.7% of the burden in young males. In 2004/05 in Queensland, 14.2% of young people reported a long term mental and behaviour problem. Some young people reported multiple conditions, with 8.8% reporting mood or affective disorders and 6.8% anxiety related disorders.15
In 2008, 19.3% of people aged 18-24 years reported high or very high levels of psychological distress (Table 15). In 2005 based on a modified version of Kessler 10,83 higher levels of psychological distress were reported by young people (aged 15-29 years) who: perceived themselves to be either underweight or overweight; had lower levels of life satisfaction; didn’t have future goals; and reported using non-medicinal drugs.336
Asthma causes 7.6% of the burden of disease in female young people (Table 14). Over recent years there is some evidence that the prevalence is decreasing slightly.189 Nevertheless, asthma remains a common health concern among young women resulting in a substantial burden of health care utilisation.
Risk factors and risk taking behaviourIn 2007, 28.3% of young males and 17.5% of young females aged 20-29 years smoked daily.26 About one in 10 teenagers aged 14-19 years smoked daily (9.3%) and nearly one in four (23.0%) aged 20-24 years (Table 15). Rates of daily smoking among young females aged 14-19 years were more than double the rates in young males. The mean number of cigarettes smoked per week in the age group 14-24 years was 90, with greater smoking in females (93 cigarettes per week) than males (88 cigarettes per week).
Overall, young Queenslanders have the riskiest drinking profile (Table 10). In 2007, risky alcohol consumption was highest in the age group 20-29 years, with 23.4% drinking at levels that put them at risk or high risk of harm in the long term (Table 15), and 67.3% drinking at such levels for short term harm. About one in 10 teenagers (11.3%) consumed alcohol at harmful levels in the long term and nearly one in two were drinking at levels for short term harm (42.4%), with teenage females more likely than males to be drinking at such levels. Risk taking behaviour is common in young people and in 2005, about 9% of young people aged 15-29 years in Queensland reported risky behaviour (at least once or twice a year) such as driving a car when over the alcohol limit and about 15% travelled in a car with a driver who may have been over their legal alcohol limit.336
In 2006, 22.6% of Year 10 males were measured as overweight or obese and 1.7% were underweight; 20.5% of Year 10 females were overweight or obese and 1.1% were underweight.16 In a separate study, 21.5% of young males aged 18-24 years and 14.8% of young females were measured as overweight or obese.2
Queensland’s young people consume too much sugar and fat, with low intakes of milk and dairy products.20 About one quarter of the energy intake was from sugar (22-25%); one third (33%) from fat, where 30% is recommended; and 14.5% from saturated fat where 10% is recommended. Calcium intake was inadequate: (50% boys and 88% girls in Year 10 had inadequate intakes). The average intake of milk products was inadequate; Year 10 males and females consumed only half the recommended intake. Few young people consumed low-fat milk as recommended. Furthermore 25% of Year 10 girls have inadequate iron intake. Almost all young people aged 18-24 years ate insufficient vegetables (96.3%) and nearly half ate insufficient fruit (47.6%) (Table 15).
In 2006, 63% of Year 10 boys and 41% of Year 10 girls in Queensland reported participating in 60 minutes of sport and physical activity per day, and met the national target for time spent in physical activity.16 However only one in 20 Year 10 students reported both time and intensity of physical activity to meet national guidelines. Four out of 10 (42%) Year 10 students walked or cycled to school on one day in the week preceding the survey in 2006. For young people aged 18-24 years in 2008, 63% met the recommended levels of physical activity while 37% did not. Sedentary behaviour is defined as the amount of time spent

Report of the Chief Health Officer Queensland
84
Prevention of Chronic Disease
sitting or in low energy activity such as driving or watching television or at a computer. In 2008, 36% of young people were sitting for an average of seven hours a day, seven days a week (Table 15).
What is changing?In 2007 it was estimated that about 593,000 Queenslanders were aged 15 to 24 years which is 14% of the total Queensland population.319 Over the 20 year period up to 2007, the proportion of the population aged 15-24 years increased by about 30%. The population in this age group is projected to increase by 24% between 2007 and 2026 to reach about 719,000 in 2026.10
The following trends between 2000 and 2006 are apparent for the following key health status and risk factors of importance to young people (where there are sufficient data points to report a trend):
asthma hospitalisation and death rates for females •5-34 years are decreasingsmoking rates are declining•alcohol misuse shows no evidence of improvement•obesity shows an upward trend that is projected to •continuephysical activity shows improvement in recent years•fruit and vegetable consumption is generally •increasing.
Year Age group Persons Males Females
Smoke daily 2007 14-19 9.3 (6.3-13.7) 5.7 (2.7-11.9) 13.1 (8.3-20.3)
Smoke daily 2007 20-24 19.4 (14.7-25.3) 22.5 (15.2-32.0) 16.0 (10.8-23.1)
Risky alcohol consumption-long term harm 2007 14-19 11.3 (7.8-16.1) 9.1 (4.9-16.5) 13.5 (8.6-20.8)
Risky alcohol consumption-long term harm 2007 20-29 23.4 (15.7-34.5) 23.8 (15.7-34.5) 22.9 (16.2-31.4)
Risky alcohol consumption-short term harm 2007 14-19 42.4 (36.2-48.9) 38.5 (29.9-48.0) 46.5 (37.8-55.4)
Risky alcohol consumption-short term harm 2007 20-29 67.3 (60.3-73.6) 69.5 (58.9-78.3) 64.9 (55.5-73.3)
Overweight, obese or severly obese 2008 18-24 29.5 (21.5-39.1) 28.3 (17.9-41.7) 30.9 (19.5-45.3)
Sedentary 2008 18-24 35.5 (26.9-45.2) 34.1 (22.7-47.5) 37.0 (24.7-51.2)
Not sufficient physical activity 2008 18-24 36.9 (28.4-46.3) 30.9 (20.2-44.2) 43.3 (30.7-56.9)
Insufficient fruit 2008 18-24 47.6 (35.1-60.5) 41.9 (25.6-60.1) 53.8 (35.6-71.0)
Insufficient vegetables 2008 18-24 96.3 (88.8-98.9) 95.0 (81.2-98.8) 97.7 (84.6-99.7)
High blood pressure 2005 18-24 4.9 (1.8-12.7) 5.9 (1.3-22.6) 4.0 (1.2-12.6)
High blood cholesterol 2005 18-24 8.8 (3.3-21.3) 5.2 (0.7-31.2) 12.7 (4.2-32.3)
Poor/fair self reported health 2008 18-24 12.4 (7.7-19.4) 9.2 (4.3-18.6) 15.8 (8.4-27.6)
High/very high psychological distress 2008 18-24 19.3 (13.0-27.8) 11.2 (5.3-22.2) 28.1 (17.6-41.7)
Table 15: Prevalence of risk factors, young people, Queensland, 2005,337 2007338 and 2008

Report of the Chief Health Officer Queensland Prevention of Chronic Disease
85
44
Adults ❚In 2007, about one in two Queenslanders were aged between 25 and 64 years (2.2 million people); a total of 53% of the population.319 Of these, 1.2 million were younger adults (aged 25-44 years) and 1.0 million were in the middle years (45-64 years). This age group is essentially the working age population of Queensland. In 2006, through its National Reform Agenda, the Council of Australian Governments (COAG) recognised the fundamental link between good health and increasing national workforce productivity and participation.90
What are the key health issues?The top three causes of early death and disability for females aged 25-44 years in Queensland in 2006 were anxiety and depression, Type 2 diabetes and breast cancer (Table 16). For males the top three were anxiety and depression, substance use disorders and road transport injuries.
For the older cohort (aged 45-64 years) the top three causes of disease burden for females were breast cancer, anxiety and depression and Type 2 diabetes (Table 16). For males they were coronary heart disease, Type 2 diabetes and adult onset hearing loss.
In 2006, 15% of the total burden of chronic disease and early death in Queensland occurred in adults aged 25-44 years and 28.3% occurred in people aged 45-64 years (Figure 26).
Many adults have more than one chronic condition. In 2005, 15% of people aged 25-44 years presented to the GP with two or more conditions, while 47% of middle aged adults (45-64 years) did so.23 Nearly a quarter of people aged 45-64 years presented with three or more conditions. The most common combinations for presentation were arthritis, chronic back pain and vascular disease, although psychological problems were frequently also included. Similarly, people report more than one risk factor for chronic disease. In 2001, about one in two or three adults reported at least two risk factors, and this was common across all age groups. However, a history of chronic disease was generally associated with higher numbers of multiple risk factors irrespective of age. Poor diet and physical inactivity were the two most common risk factors reported.129
Is there a role for prevention?Overall, 35% of the total health burden of premature death in adults aged 25-64 years was due to 13
measurable risk factors (Figure 27) noting that complete data on nutrition was not available for this analysis.29 For people aged 25-44 years, 29% of the total burden was due to these measurable risk factors, higher for males (33%) than females (25%). In people aged 45-64 years, 39% of the disease and injury burden was due to risk factors: 44% in males and 33% in females. Of these preventable risk factors, alcohol misuse at 7.3% and overweight and obesity at 5.6% were the largest causes in the younger cohort, and overweight and obesity at 12.9% and smoking at 12.1% the largest causes in the older cohort (Table 11). For adults aged 45-64 years, physical inactivity and high blood cholesterol each caused about 8% of the disease burden.
In 2008, in a 24 year study of about 77,000 women aged 34 to 59 years and free of cardiovascular disease or cancer at commencement, 28% of early deaths could be attributed to smoking and 55% to the combined effect of smoking, being overweight, inactivity, and poor diet.50 Similar findings could also apply to males. The risk of death from cardiovascular disease was 8.2 times higher among women with these risk factors than those without and risk of death from cancer was 3.3 times higher.
Individually the chronic health conditions affecting both younger adults and those in the middle years have a strong component of preventability. For example, about 80% of coronary heart disease burden is due to preventable risk factors and 60% of Type 2 diabetes is due to overweight and obesity, and physical inactivity.29
Mental disorders were the leading cause of disability in Queensland in 2006, causing one quarter of the total disability burden (24.6%). Within this broad group anxiety and depression was the leading specific cause.339 The causes of anxiety and depression at a population level are not well understood although it is known that excessive alcohol consumption, use of illicit drugs, partner violence and a history of child sexual abuse, put people at greater risk of anxiety and depression and other mental health disorders.29 Mental health problems are very disabling for the individual and their family and friends. They have a major impact on a person’s working life, with productivity losses estimated to be 2.5 times the costs of direct health care costs.182 These productivity costs are associated with absenteeism, reduced performance in the workplace, early retirement, other work cutbacks, reduced opportunities for career development, days ‘out of role’ for people not in the paid workforce and reduced lifetime productivity due to premature death.340
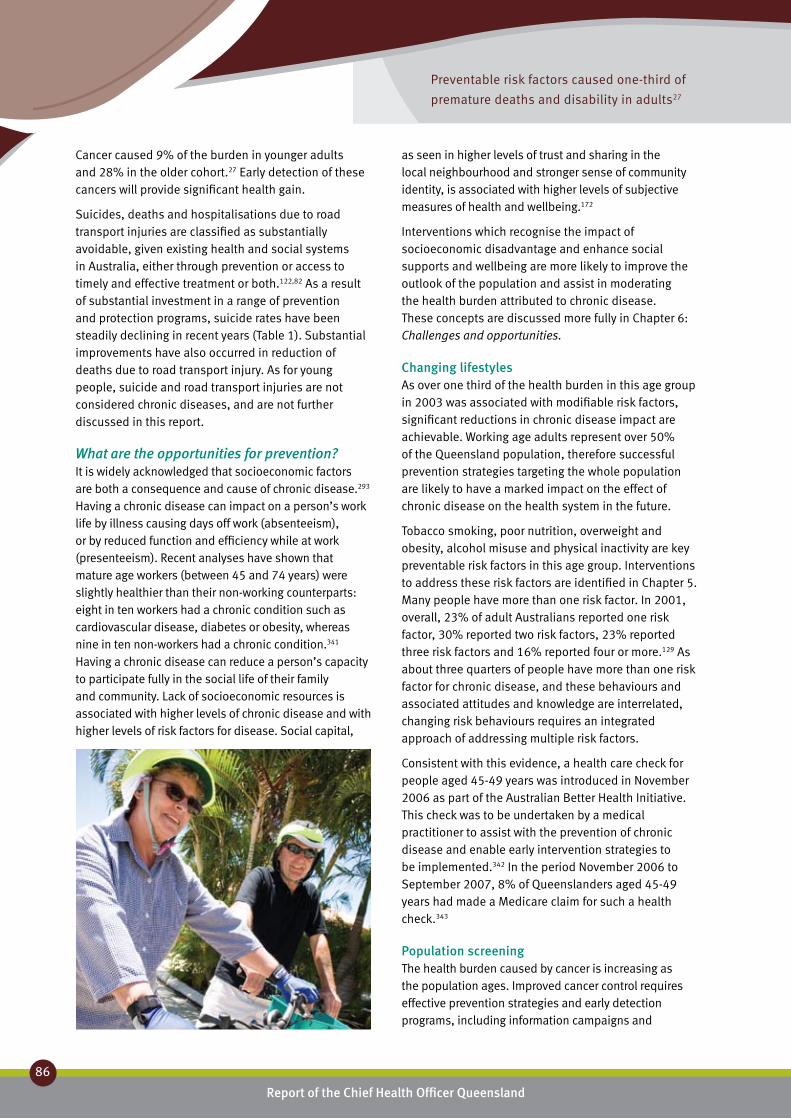
Preventable risk factors caused one-third of
premature deaths and disability in adults27
Report of the Chief Health Officer Queensland
86
Prevention of Chronic Disease
Cancer caused 9% of the burden in younger adults and 28% in the older cohort.27 Early detection of these cancers will provide significant health gain.
Suicides, deaths and hospitalisations due to road transport injuries are classified as substantially avoidable, given existing health and social systems in Australia, either through prevention or access to timely and effective treatment or both.122,82 As a result of substantial investment in a range of prevention and protection programs, suicide rates have been steadily declining in recent years (Table 1). Substantial improvements have also occurred in reduction of deaths due to road transport injury. As for young people, suicide and road transport injuries are not considered chronic diseases, and are not further discussed in this report.
What are the opportunities for prevention?It is widely acknowledged that socioeconomic factors are both a consequence and cause of chronic disease.293 Having a chronic disease can impact on a person’s work life by illness causing days off work (absenteeism), or by reduced function and efficiency while at work (presenteeism). Recent analyses have shown that mature age workers (between 45 and 74 years) were slightly healthier than their non-working counterparts: eight in ten workers had a chronic condition such as cardiovascular disease, diabetes or obesity, whereas nine in ten non-workers had a chronic condition.341 Having a chronic disease can reduce a person’s capacity to participate fully in the social life of their family and community. Lack of socioeconomic resources is associated with higher levels of chronic disease and with higher levels of risk factors for disease. Social capital,
as seen in higher levels of trust and sharing in the local neighbourhood and stronger sense of community identity, is associated with higher levels of subjective measures of health and wellbeing.172
Interventions which recognise the impact of socioeconomic disadvantage and enhance social supports and wellbeing are more likely to improve the outlook of the population and assist in moderating the health burden attributed to chronic disease. These concepts are discussed more fully in Chapter 6: Challenges and opportunities.
Changing lifestylesAs over one third of the health burden in this age group in 2003 was associated with modifiable risk factors, significant reductions in chronic disease impact are achievable. Working age adults represent over 50% of the Queensland population, therefore successful prevention strategies targeting the whole population are likely to have a marked impact on the effect of chronic disease on the health system in the future.
Tobacco smoking, poor nutrition, overweight and obesity, alcohol misuse and physical inactivity are key preventable risk factors in this age group. Interventions to address these risk factors are identified in Chapter 5. Many people have more than one risk factor. In 2001, overall, 23% of adult Australians reported one risk factor, 30% reported two risk factors, 23% reported three risk factors and 16% reported four or more.129 As about three quarters of people have more than one risk factor for chronic disease, and these behaviours and associated attitudes and knowledge are interrelated, changing risk behaviours requires an integrated approach of addressing multiple risk factors.
Consistent with this evidence, a health care check for people aged 45-49 years was introduced in November 2006 as part of the Australian Better Health Initiative. This check was to be undertaken by a medical practitioner to assist with the prevention of chronic disease and enable early intervention strategies to be implemented.342 In the period November 2006 to September 2007, 8% of Queenslanders aged 45-49 years had made a Medicare claim for such a health check.343
Population screening The health burden caused by cancer is increasing as the population ages. Improved cancer control requires effective prevention strategies and early detection programs, including information campaigns and

Two thirds of adults have more than one
chronic disease risk factor23
Report of the Chief Health Officer Queensland Prevention of Chronic Disease
87
44
population based screening programs. Screening and early detection are based on the understanding that the earlier many cancers are treated, the greater the likelihood of a better health outcome. Population based screening has been shown to be effective for breast cancer in detecting small cancers and cervical and bowel cancers where precancerous changes can be detected. These approaches rely on a systematic, organised approach to screen eligible, at-risk populations and optimal use of effective and efficient treatment options.
National screening programs are in place for breast, cervical and bowel cancer. The goal of these programs is to reduce the incidence and mortality associated with these cancers and improve the quality of life of patients and their families.
The target age group for the BreastScreen Queensland Program is women aged 50-69 years.107 Screening by mammography is recommended every two years for women in this age group. The target age group for cervical screening is 20-69 years with screening every two years recommended.108 The National Bowel Cancer Screening Program commenced in August 2006 and is being phased in gradually. The Program has recently concluded its first phase where it offered screening to people turning 55 or 65 years of age, as well as people who were invited to participate in the pilot program which occurred between 2002-04.344 The Program has recently commenced its second phase, and offers screening to people turning 50, 55 or 65 years.
At a state and national level, there have been improvements in breast cancer survival as a result of both early detection through the BreastScreen Queensland Program and also increasingly effective treatment of the disease. Death rates for breast cancer have been falling since 2000, with five year survival rates following diagnosis at an all time high of 87% for the period 1996-2000.123 Although the breast screening participation rate in Queensland is high (57.9%), it falls short of the national target of 70%. In 2004-2005 BreastScreen Queensland participation rate was higher than NSW and Victoria and the national rate, and had significantly increased in the preceding five years.102 In 2005-06, 57.9% of Queensland women in the target age group of 50-69 years were screened by BreastScreen Queensland, with screening rates about 10% lower in Brisbane and in areas of highest socioeconomic advantage.345
Participation rates in the Queensland Cervical Screening Program were lower than national participation rates and lowest of all the states and territories except
Northern Territory in 2005-2006.346 In 2005-06, 57.9% of Queensland women in the target age group had a Pap smear in the preceding two years with lower rates (approximately 10% lower) in areas of greatest socioeconomic disadvantage and remote areas in Queensland.346,104 There has been a recent increase in screening rates with 59.2% screening in 2006-07.104
Participation in the Queensland Bowel Cancer Screening Program is undertaken in response to direct mail invitation. In the period August 2006 to May 2008, 35% of people aged 55 years and 42% of people aged 65 years participated in the Program. These participation rates are lower than the rate in the pilot program conducted in Mackay in 2002-2004 (56%).106
Facts and figures:
DemographicAt the latest census in 2006, there were over two million adults aged between 25 and 64 years resident in Queensland. Although this age group is essentially the working age population, 21% were not in the labour force while 48% were working full time and 18% were working part time.333 In 2006, one in 10 people aged 25-64 years were living in a single person household (this includes only those people living in occupied private dwellings); 70% were living in a married or de facto relationship household and 7% were in lone parent households. In 2006, 2.6% of Queensland’s adult population were Indigenous, 70.8% had been born in Australia, 12.6% were born in mainly English speaking countries and 9.6% in non-English speaking countries. About half (53.4%) lived in major cities, 44.2% lived in regional areas and 2.7% lived in remote locations.
Chronic diseaseAlthough adults aged 25-44 years comprised 28.4% of the population, they accounted for 16.3% of the total
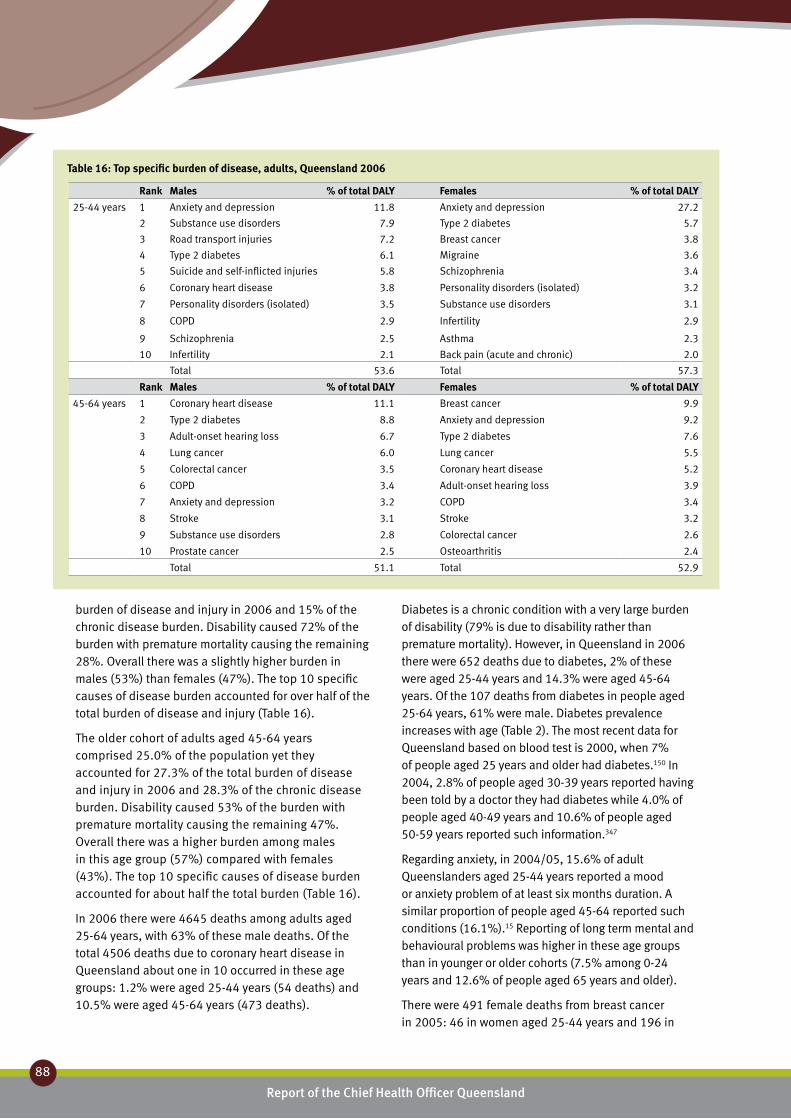
Report of the Chief Health Officer Queensland
88
Prevention of Chronic Disease
burden of disease and injury in 2006 and 15% of the chronic disease burden. Disability caused 72% of the burden with premature mortality causing the remaining 28%. Overall there was a slightly higher burden in males (53%) than females (47%). The top 10 specific causes of disease burden accounted for over half of the total burden of disease and injury (Table 16).
The older cohort of adults aged 45-64 years comprised 25.0% of the population yet they accounted for 27.3% of the total burden of disease and injury in 2006 and 28.3% of the chronic disease burden. Disability caused 53% of the burden with premature mortality causing the remaining 47%. Overall there was a higher burden among males in this age group (57%) compared with females (43%). The top 10 specific causes of disease burden accounted for about half the total burden (Table 16).
In 2006 there were 4645 deaths among adults aged 25-64 years, with 63% of these male deaths. Of the total 4506 deaths due to coronary heart disease in Queensland about one in 10 occurred in these age groups: 1.2% were aged 25-44 years (54 deaths) and 10.5% were aged 45-64 years (473 deaths).
Diabetes is a chronic condition with a very large burden of disability (79% is due to disability rather than premature mortality). However, in Queensland in 2006 there were 652 deaths due to diabetes, 2% of these were aged 25-44 years and 14.3% were aged 45-64 years. Of the 107 deaths from diabetes in people aged 25-64 years, 61% were male. Diabetes prevalence increases with age (Table 2). The most recent data for Queensland based on blood test is 2000, when 7% of people aged 25 years and older had diabetes.150 In 2004, 2.8% of people aged 30-39 years reported having been told by a doctor they had diabetes while 4.0% of people aged 40-49 years and 10.6% of people aged 50-59 years reported such information.347
Regarding anxiety, in 2004/05, 15.6% of adult Queenslanders aged 25-44 years reported a mood or anxiety problem of at least six months duration. A similar proportion of people aged 45-64 reported such conditions (16.1%).15 Reporting of long term mental and behavioural problems was higher in these age groups than in younger or older cohorts (7.5% among 0-24 years and 12.6% of people aged 65 years and older).
There were 491 female deaths from breast cancer in 2005: 46 in women aged 25-44 years and 196 in
Rank Males % of total DALY Females % of total DALY
25-44 years 1 Anxiety and depression 11.8 Anxiety and depression 27.2
2 Substance use disorders 7.9 Type 2 diabetes 5.7
3 Road transport injuries 7.2 Breast cancer 3.8
4 Type 2 diabetes 6.1 Migraine 3.6
5 Suicide and self-inflicted injuries 5.8 Schizophrenia 3.4
6 Coronary heart disease 3.8 Personality disorders (isolated) 3.2
7 Personality disorders (isolated) 3.5 Substance use disorders 3.1
8 COPD 2.9 Infertility 2.9
9 Schizophrenia 2.5 Asthma 2.3
10 Infertility 2.1 Back pain (acute and chronic) 2.0
Total 53.6 Total 57.3
Rank Males % of total DALY Females % of total DALY
45-64 years 1 Coronary heart disease 11.1 Breast cancer 9.9
2 Type 2 diabetes 8.8 Anxiety and depression 9.2
3 Adult-onset hearing loss 6.7 Type 2 diabetes 7.6
4 Lung cancer 6.0 Lung cancer 5.5
5 Colorectal cancer 3.5 Coronary heart disease 5.2
6 COPD 3.4 Adult-onset hearing loss 3.9
7 Anxiety and depression 3.2 COPD 3.4
8 Stroke 3.1 Stroke 3.2
9 Substance use disorders 2.8 Colorectal cancer 2.6
10 Prostate cancer 2.5 Osteoarthritis 2.4
Total 51.1 Total 52.9
Table 16: Top specific burden of disease, adults, Queensland 2006
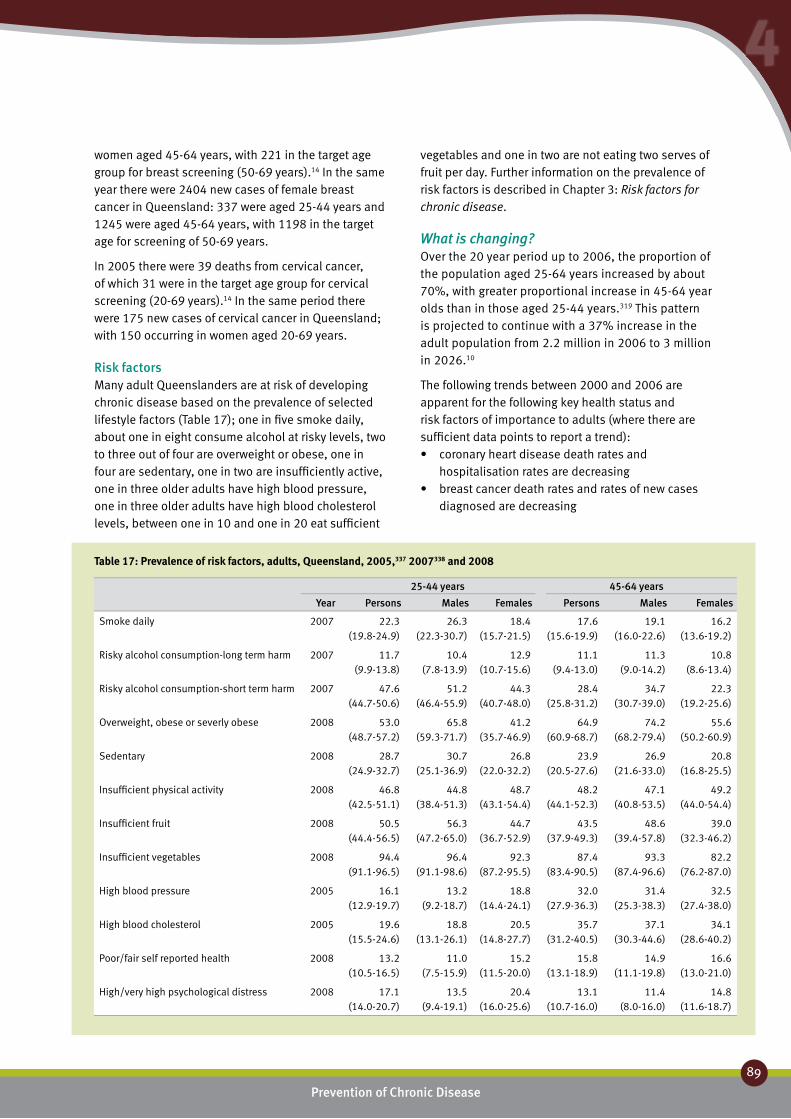
Report of the Chief Health Officer Queensland Prevention of Chronic Disease
89
44
women aged 45-64 years, with 221 in the target age group for breast screening (50-69 years).14 In the same year there were 2404 new cases of female breast cancer in Queensland: 337 were aged 25-44 years and 1245 were aged 45-64 years, with 1198 in the target age for screening of 50-69 years.
In 2005 there were 39 deaths from cervical cancer, of which 31 were in the target age group for cervical screening (20-69 years).14 In the same period there were 175 new cases of cervical cancer in Queensland; with 150 occurring in women aged 20-69 years.
Risk factors Many adult Queenslanders are at risk of developing chronic disease based on the prevalence of selected lifestyle factors (Table 17); one in five smoke daily, about one in eight consume alcohol at risky levels, two to three out of four are overweight or obese, one in four are sedentary, one in two are insufficiently active, one in three older adults have high blood pressure, one in three older adults have high blood cholesterol levels, between one in 10 and one in 20 eat sufficient
25-44 years 45-64 years
Year Persons Males Females Persons Males Females
Smoke daily 2007 22.3 (19.8-24.9)
26.3 (22.3-30.7)
18.4 (15.7-21.5)
17.6 (15.6-19.9)
19.1 (16.0-22.6)
16.2 (13.6-19.2)
Risky alcohol consumption-long term harm 2007 11.7 (9.9-13.8)
10.4 (7.8-13.9)
12.9 (10.7-15.6)
11.1 (9.4-13.0)
11.3 (9.0-14.2)
10.8 (8.6-13.4)
Risky alcohol consumption-short term harm 2007 47.6 (44.7-50.6)
51.2 (46.4-55.9)
44.3 (40.7-48.0)
28.4 (25.8-31.2)
34.7 (30.7-39.0)
22.3 (19.2-25.6)
Overweight, obese or severly obese 2008 53.0 (48.7-57.2)
65.8 (59.3-71.7)
41.2 (35.7-46.9)
64.9 (60.9-68.7)
74.2 (68.2-79.4)
55.6 (50.2-60.9)
Sedentary 2008 28.7 (24.9-32.7)
30.7 (25.1-36.9)
26.8 (22.0-32.2)
23.9 (20.5-27.6)
26.9 (21.6-33.0)
20.8 (16.8-25.5)
Insufficient physical activity 2008 46.8 (42.5-51.1)
44.8 (38.4-51.3)
48.7 (43.1-54.4)
48.2 (44.1-52.3)
47.1 (40.8-53.5)
49.2 (44.0-54.4)
Insufficient fruit 2008 50.5 (44.4-56.5)
56.3 (47.2-65.0)
44.7 (36.7-52.9)
43.5 (37.9-49.3)
48.6 (39.4-57.8)
39.0 (32.3-46.2)
Insufficient vegetables 2008 94.4 (91.1-96.5)
96.4 (91.1-98.6)
92.3 (87.2-95.5)
87.4 (83.4-90.5)
93.3 (87.4-96.6)
82.2 (76.2-87.0)
High blood pressure 2005 16.1 (12.9-19.7)
13.2 (9.2-18.7)
18.8 (14.4-24.1)
32.0 (27.9-36.3)
31.4 (25.3-38.3)
32.5 (27.4-38.0)
High blood cholesterol 2005 19.6 (15.5-24.6)
18.8 (13.1-26.1)
20.5 (14.8-27.7)
35.7 (31.2-40.5)
37.1 (30.3-44.6)
34.1 (28.6-40.2)
Poor/fair self reported health 2008 13.2 (10.5-16.5)
11.0 (7.5-15.9)
15.2 (11.5-20.0)
15.8 (13.1-18.9)
14.9 (11.1-19.8)
16.6 (13.0-21.0)
High/very high psychological distress 2008 17.1 (14.0-20.7)
13.5 (9.4-19.1)
20.4 (16.0-25.6)
13.1 (10.7-16.0)
11.4 (8.0-16.0)
14.8 (11.6-18.7)
Table 17: Prevalence of risk factors, adults, Queensland, 2005,337 2007338 and 2008
vegetables and one in two are not eating two serves of fruit per day. Further information on the prevalence of risk factors is described in Chapter 3: Risk factors for chronic disease.
What is changing?Over the 20 year period up to 2006, the proportion of the population aged 25-64 years increased by about 70%, with greater proportional increase in 45-64 year olds than in those aged 25-44 years.319 This pattern is projected to continue with a 37% increase in the adult population from 2.2 million in 2006 to 3 million in 2026.10
The following trends between 2000 and 2006 are apparent for the following key health status and risk factors of importance to adults (where there are sufficient data points to report a trend):
coronary heart disease death rates and •hospitalisation rates are decreasingbreast cancer death rates and rates of new cases •diagnosed are decreasing

Report of the Chief Health Officer Queensland
90
Prevention of Chronic Disease
cervical cancer death rates are decreasing but no •change in rates of new cases diagnosedanxiety and depression shows insufficient evidence •to note a trenddiabetes prevalence shows an upward trend that is •projected to continuesmoking rates are declining•alcohol misuse shows no evidence of improvement•obesity shows an upward trend that is projected to •continuephysical activity shows improvement in recent years•fruit and vegetable consumption is generally •increasing.

38% of males and 55% of females live to 85 years6
Report of the Chief Health Officer Queensland Prevention of Chronic Disease
91
44
Older people ❚Healthy ageing means that older people are able to be independent and active participants in Australian society348
In 2007, one in eight Queenslanders were aged 65 years and older; there were about 280,000 aged 65-74 years and 230,000 aged 75 years and older, together representing 12.4% of the Queensland population.319
Life expectancy in Queensland is increasing. In 2005 Queenslanders aged 65 years could expect to live for another 20 years (males 18.1 years and females 21.3 years).179 In fact in 2005, 38% of the male population in Queensland live to age 85 years and 55% of the female population reaches this age.6
Increasingly there is a focus on living well in the older years.191 Health strategies for older people should focus on healthy ageing as well as disease management and treatment. In Europe the focus is on health promotion activities that are environmental (e.g. housing), social (e.g. social inclusion), economic (e.g. reducing poverty) and personal (e.g. lifestyle issues such as smoking, healthy weight, physical activity and nutrition).349 In addition the focus is characterised by the goals of universal access to effective health care, in terms of screening and surveillance, disease management, prophylaxis, timely referral, effective treatment, adequate rehabilitation and up to date medical technology.
What are the key health issues?The top three causes of early death and disability for females aged 65-74 years in Queensland in 2006 were coronary heart disease, Type 2 diabetes and lung cancer (Table 18). For males the top three were coronary heart disease, lung cancer and adult onset hearing loss.
For the older cohort (aged 75 years and older), the top three causes of disease burden for both males and females were coronary heart disease, dementia and stroke (Table 18).
In 2006, 16.8% of the total burden of chronic disease and early death in Queensland occurred in adults aged 65-74 years and 25.5% occurred in people aged 75 years and older (Figure 26).
Older people are more likely than younger to have more than one condition. Recent data suggests that four out of five older people visiting a GP in 2005 in Australia
presented with at least two conditions (75% of people aged 65-74 years and 83% of people aged 75 years and older).23 About half presented with three or more conditions.
Is there a role for prevention?Developing chronic disease is not an inevitable consequence of ageing: in many cases, the origins of chronic disease are grounded in health-damaging behaviours practiced by people every day for much of their lives. Overall, 38% of the total health burden in males aged 65 years and older was due to preventable risk factors as was 34% of the burden in females (Figure 27).
The impact of risk factors was slightly higher in the age group 65-74 years (38%) than in those aged 75 years and older (35%). This preventability was due to 13 measurable risk factors.29 The key contributors to health burden in older people were tobacco smoking, high blood pressure, overweight and obesity, physical inactivity and high blood cholesterol (Table 11). The impact of poor nutrition was not fully assessed due to data limitations. Tobacco smoking caused 12.8% of total burden in 65-74 year olds, and 8.3% of the burden in those aged 75 years and older. High blood pressure caused 10% of the 65-74 year burden and 14.8% of burden in the older cohort. Overweight and obesity was the cause of 10% of the burden in younger cohort and 6% in the older cohort. Concurrently, older people are at risk of malnutrition. In 2003-2005 in Queensland, 5-11% of elderly people were malnourished and 15% were at risk of malnutrition.350,351
Prevention strategies are critical. The number of people in this age group is projected to more than double in the next 20 years, and the prevalent burden of disability is projected to concentrate in older age groups.164 Success in prevention will address the health needs of older people by minimising the development of disease and promoting good health for individual gain and for moderating the impact of chronic disease on the health system.
Individually the chronic health conditions affecting older people have a strong component of preventability. For example about 80% of coronary heart disease and 66% of stroke are due to modifiable risk factors, 60% of Type 2 diabetes is due to overweight and obesity and physical inactivity.29
For stroke about 45% of the total burden is due to high blood pressure.29 The diagnosis of high blood pressure
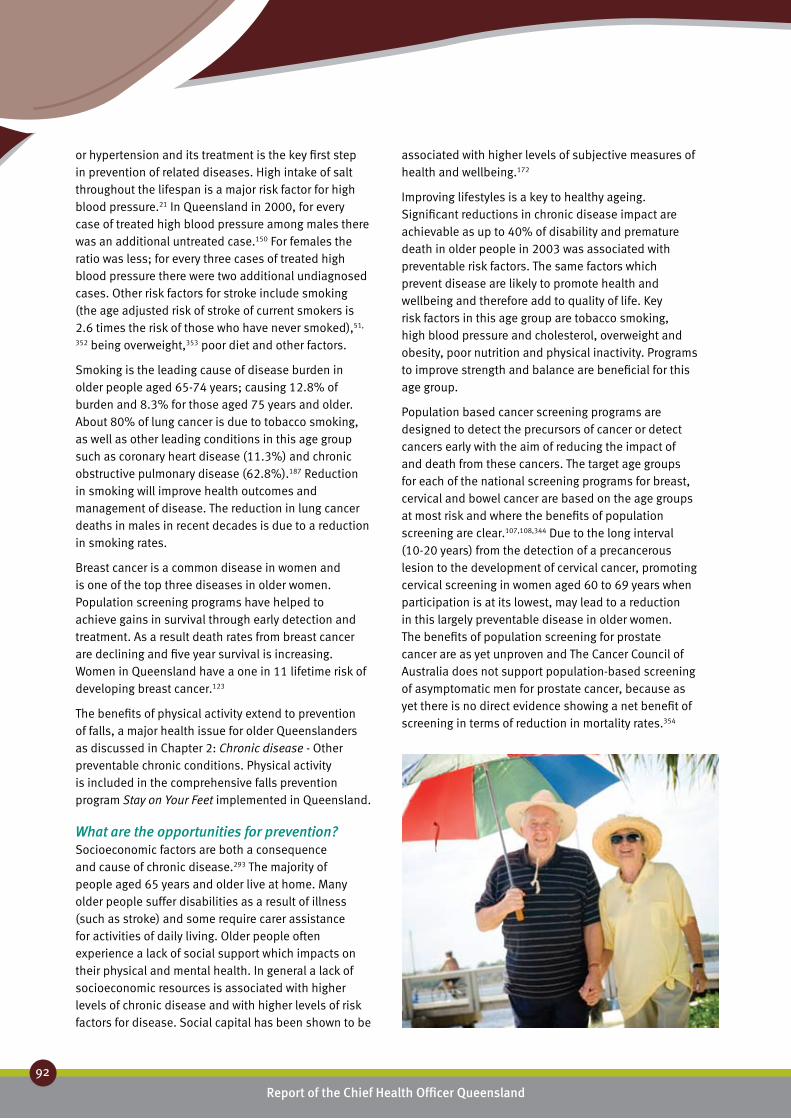
Report of the Chief Health Officer Queensland
92
Prevention of Chronic Disease
or hypertension and its treatment is the key first step in prevention of related diseases. High intake of salt throughout the lifespan is a major risk factor for high blood pressure.21 In Queensland in 2000, for every case of treated high blood pressure among males there was an additional untreated case.150 For females the ratio was less; for every three cases of treated high blood pressure there were two additional undiagnosed cases. Other risk factors for stroke include smoking (the age adjusted risk of stroke of current smokers is 2.6 times the risk of those who have never smoked),51,
352 being overweight,353 poor diet and other factors.
Smoking is the leading cause of disease burden in older people aged 65-74 years; causing 12.8% of burden and 8.3% for those aged 75 years and older. About 80% of lung cancer is due to tobacco smoking, as well as other leading conditions in this age group such as coronary heart disease (11.3%) and chronic obstructive pulmonary disease (62.8%).187 Reduction in smoking will improve health outcomes and management of disease. The reduction in lung cancer deaths in males in recent decades is due to a reduction in smoking rates.
Breast cancer is a common disease in women and is one of the top three diseases in older women. Population screening programs have helped to achieve gains in survival through early detection and treatment. As a result death rates from breast cancer are declining and five year survival is increasing. Women in Queensland have a one in 11 lifetime risk of developing breast cancer.123
The benefits of physical activity extend to prevention of falls, a major health issue for older Queenslanders as discussed in Chapter 2: Chronic disease - Other preventable chronic conditions. Physical activity is included in the comprehensive falls prevention program Stay on Your Feet implemented in Queensland.
What are the opportunities for prevention?Socioeconomic factors are both a consequence and cause of chronic disease.293 The majority of people aged 65 years and older live at home. Many older people suffer disabilities as a result of illness (such as stroke) and some require carer assistance for activities of daily living. Older people often experience a lack of social support which impacts on their physical and mental health. In general a lack of socioeconomic resources is associated with higher levels of chronic disease and with higher levels of risk factors for disease. Social capital has been shown to be
associated with higher levels of subjective measures of health and wellbeing.172
Improving lifestyles is a key to healthy ageing. Significant reductions in chronic disease impact are achievable as up to 40% of disability and premature death in older people in 2003 was associated with preventable risk factors. The same factors which prevent disease are likely to promote health and wellbeing and therefore add to quality of life. Key risk factors in this age group are tobacco smoking, high blood pressure and cholesterol, overweight and obesity, poor nutrition and physical inactivity. Programs to improve strength and balance are beneficial for this age group.
Population based cancer screening programs are designed to detect the precursors of cancer or detect cancers early with the aim of reducing the impact of and death from these cancers. The target age groups for each of the national screening programs for breast, cervical and bowel cancer are based on the age groups at most risk and where the benefits of population screening are clear.107,108,344 Due to the long interval (10-20 years) from the detection of a precancerous lesion to the development of cervical cancer, promoting cervical screening in women aged 60 to 69 years when participation is at its lowest, may lead to a reduction in this largely preventable disease in older women. The benefits of population screening for prostate cancer are as yet unproven and The Cancer Council of Australia does not support population-based screening of asymptomatic men for prostate cancer, because as yet there is no direct evidence showing a net benefit of screening in terms of reduction in mortality rates.354
Report of the Chief Health Officer Queensland Prevention of Chronic Disease
93
44
As more than two thirds of people have more than one chronic disease risk factor,129 and these behaviours and associated attitudes and knowledge are interrelated, changing risk factor behaviours requires an integrated approach of addressing multiple risk factors. Older people are eligible for an annual health screening check by their GP.342 There were 272,000 annual checks done in Australia in 2007, at a cost of $55 million.355,356 The effectiveness of these and other preventative services in this setting is yet to be determined.355,356
Healthy ageing is critical for maintenance of quality of life and independence of older people. In addition, healthy ageing reduces the risk of illness and disease, particularly chronic disease, and increases physical, emotional and mental health, through ongoing activities and behaviours. Healthy ageing through prevention of chronic disease in Queensland requires implementation of interventions that directly target older people, as well as broader interventions for the whole population. The interrelationship between health behaviours and the determinants of these behaviours are very complex and mean that each intervention includes multiple strategies and is implemented by multiple sectors in Queensland.
There are a number of interventions currently designed to change smoking behaviours in the population, for example national advertising campaigns, state legislation to limit smoking in public places and the associated campaign, Nobody smokes here anymore, as described in Chapter 5: Prevention works – Smoking.
Furthermore, there are a number of population strategies to reduce overweight and obesity through improved nutrition and physical activity in Queensland. Within the Eat Well Queensland: 2002-2012 Smart Eating for a Healthier State242 and Be Active Queensland 2006-2010357 strategies there are a number of programs which include or target older people including Eat Well Be Active, Go for 2&5®, Lighten Up to a Healthy Lifestyle, A Better Choice and Healthy Food Access Basket surveys. Several of these are described more fully in Chapter 5: Prevention works.
Facts and figures:
DemographicIn 2007, there were half a million people aged 65 and older in Queensland. Although this age group is considered the retired population, about 8% were employed full time or part time or looking for work.333 In 2006, 62% of people aged 65 years and older were living in a married or de facto relationship household
(this includes only those people living in occupied private dwellings); and 27.6% were living in lone households. In 2006, 0.8% of Queensland’s older population were Indigenous, 65.7% had been born in Australia, 14.2% were born in mainly English speaking countries and 10.5% in non-English speaking countries. About half (50.2%) lived in major cities, 44.7% lived in regional areas and 1.7% lived in remote locations.
Chronic diseaseAlthough adults aged 65 years and older comprised 12.4% of the population, they accounted for 39% of the total burden of disease and injury in 2006 and 42% of the chronic disease burden. Disability caused 38% of the burden with premature mortality causing the remaining 62%. Overall there was an even distribution of burden between the sexes (males 50%, females 50%). The top 10 specific causes of disease burden accounted for about 60% the total burden of disease and injury in this age group (Table 18). Chronic conditions caused 95% of the total burden in this age group in 2003.
In 2006, there was a total of 4506 deaths due to coronary heart disease in Queensland, and most of these were in older people: 13.8% or 586 deaths were of people aged 65-74 years and 74.5% or 3357 deaths were of people aged 75 years and older. Male death rates were 60% higher than female rates. In 2006, there were 2220 deaths due to stroke in Queensland, 9.5% of these were aged 65-74 years and 83.8% were aged 75 years and older. Death rates were similar in males and females.
In 2005 there were 1473 deaths from lung cancer (64% in men); 1045 deaths or 71% of the total in older people (aged 65 years and older).14 In 2005 there were 1779 new cases of lung cancer in Queensland; 1208 or 68% were aged 65 years and older.14 About two thirds (64%) of the lung cancer cases diagnosed in 2005 were male and 69% of these were aged 65 years or older. In 2005 there were 491 female deaths from breast cancer; 249 deaths or 51% of the total were in women aged 65 years and older (221 deaths occurred in women in the target age group for screening 50-69 years).14 In 2005 there were 2404 new cases of female breast cancer in Queensland; 820 or 34% were aged 65 years and older.14
In Queensland in 2006 there were 652 deaths due to diabetes (329 male deaths and 323 female deaths), 84% of these were aged 65 years and older. Diabetes is more prevalent in older age groups. The most recent

Report of the Chief Health Officer Queensland
94
Prevention of Chronic Disease
data for Queensland based on blood test was 2000, when 7% of people aged 25 years and older had diabetes based on blood test.150 In 2006 while 6.7% of the adult population reported having been told by a doctor they had high blood sugar or diabetes, 13.3% of people aged 60-69 years and 18.1% of people aged 70 years and older reported such information.347
Risk factors Many older Queenslanders are at risk of developing chronic disease based on the prevalence of key lifestyle factors (Table 19). Among older people about one in ten smoke daily, one in two have high blood pressure, one in two are overweight or obese, at least one in two are insufficiently active, one in two or three have high blood cholesterol levels, about one in three are not eating sufficient fruit per day and only one in eight are eating recommended number of vegetables per day. Few older people are drinking alcohol at risky levels (about one in 20). Further information on the prevalence of risk factors is described in Chapter 3: Risk factors for chronic disease.
What is changing?In 2007 it was estimated that 0.5 million Queenslanders were aged 65 years and older (12% of the total Queensland population). Over the 20 year period up to 2007, the proportion of the population aged 65 years and older had nearly doubled (90% increase), with greater proportional increases in 75 years and older (125% increase).319 This pattern is projected to continue with a projected doubling of the adult population from 0.5 million in 2006 to 1.1 million
Table 18: Top specific burden of disease, older people, Queensland 2006
Rank Males % of total DALY Females % of total DALY
65-74 years 1 Coronary heart disease 14.2 Coronary heart disease 11.0
2 Lung cancer 8.1 Type 2 diabetes 6.3
3 Adult-onset hearing loss 6.4 Lung cancer 6.1
4 Type 2 diabetes 5.9 Dementia 5.6
5 Prostate cancer 5.0 Breast cancer 5.4
6 Stroke 4.4 COPD 4.7
7 COPD 4.2 Stroke 4.3
8 Colorectal cancer 3.9 Adult-onset hearing loss 3.7
9 Dementia 3.7 Colorectal cancer 3.7
10 Osteoarthritis 1.8 Osteoarthritis 3.6
Total 57.5 Total 54.5
Rank Males % of total DALY Females % of total DALY
75+ years 1 Coronary heart disease 17.9 Coronary heart disease 18.1
2 Dementia 8.0 Dementia 13.7
3 Stroke 7.2 Stroke 10.8
4 Prostate cancer 5.2 Type 2 diabetes 4.4
5 Lung cancer 5.1 COPD 3.0
6 COPD 4.8 Lung cancer 2.3
7 Type 2 diabetes 4.3 Colorectal cancer 2.2
8 Adult-onset hearing loss 3.2 Falls 2.2
9 Colorectal cancer 2.6 Breast cancer 2.1
10 Parkinson’s disease 2.4 Osteoarthritis 1.9
Total 60.6 Total 60.8

Report of the Chief Health Officer Queensland Prevention of Chronic Disease
95
44
in 2026.10 In 2056 one in four people in Queensland will be aged 65 years and older.
The following trends between 2000 and 2006 are apparent for the following key health status and risk factors of importance to older people (where there are sufficient data points to report a trend):
coronary heart disease and stroke death and •hospitalisations rates are decreasingbreast cancer death rates and rate of new cases •diagnosed are decreasing lung cancer death and incidence rates in males are •decreasing, female rates not changingcolorectal cancer death rates are decreasing but there •is no change in incidenceprostate cancer death rates are decreasing and •incidence rates are increasing chronic obstructive pulmonary disease death and •hospitalisation rates in males are decreasingdiabetes prevalence shows an upward trend, female •death rates are increasingsmoking rates are declining•obesity shows an upward trend that is projected to •continuefruit and vegetable consumption is generally increasing.•
65-74 years 75+ yearsYear Persons Males Females Persons Males Females
Smoke daily 2007 9.5 (7.1-12.7)
10.1 (6.6-15.2)
8.9 (5.9-13.2)
4.4 (2.6-7.6)
4.2 (1.9-9.3)
4.6 (2.2-9.4)
Risky alcohol consumption-long term harm* 2007 6.5 (4.9-8.5)
7.5 (5.2-10.6)
5.5 (3.5-8.6)
Risky alcohol consumption-short term harm* 2007 8.1 (6.3-10.3)
12.3 (9.2-16.1)
4.0 (2.4-6.6)
Overweight, obese or severly obese 2008 65.5 (59.2-71.4)
68.3 (58.9-76.4)
62.7 (53.8-70.8)
45.3 (38.3-52.6)
48.3 (36.6-60.1)
43.1 (34.6-52.0)
Not sufficient physical activity 2008 60.2 (54.2-66.0)
61.0 (52.8-68.6)
59.1 (50.5-67.3)
n/a n/a n/a
Insufficient fruit 2008 34.9 (27.3-43.3)
42.5 (30.7-55.3)
27.4 (18.5-38.5)
39.0 (30.2-48.7)
40.9 (26.7-56.8)
37.7 (27.0-49.7)
Insufficient vegetables 2008 83.2 (76.4-88.3)
93.6 (84.5-97.5)
72.9 (61.7-81.8)
88.9 (81.1-93.7)
90.0 (76.5-96.1)
88.1 (77.1-94.2)
High blood pressure 2005 55.2 (47.6-62.6)
49.1 (37.5-60.7)
61.0 (51.3-69.8)
55.9 (47.1-64.3)
48.9 (36.0-62.0)
60.8 (48.9-71.5)
High blood cholesterol 2005 44.0 (36.6-51.8)
44.1 (32.8-56.1)
43.9 (34.5-53.9)
34.9 (27.0-43.8)
36.8 (25.1-50.3)
33.6 (23.4-45.6)
Poor/fair self reported health 2008 27.6 (22.2-33.6)
30.8 (23.1-39.8)
24.2 (17.3-32.8)
34.8 (28.4-41.7)
27.9 (18.7-39.4)
39.9 (31.7-48.6)
High/very high psychological distress 2008 12.8 (9.0-17.8)
8.3 (4.3-15.2)
17.5 (11.6-25.5)
10.4 (7.0-15.2)
6.0 (2.3-14.8)
13.7 (8.9-20.3)
*65 years and older
Table 19: Prevalence of risk factors, older people, Queensland, 2005,337 2007338 and 2008
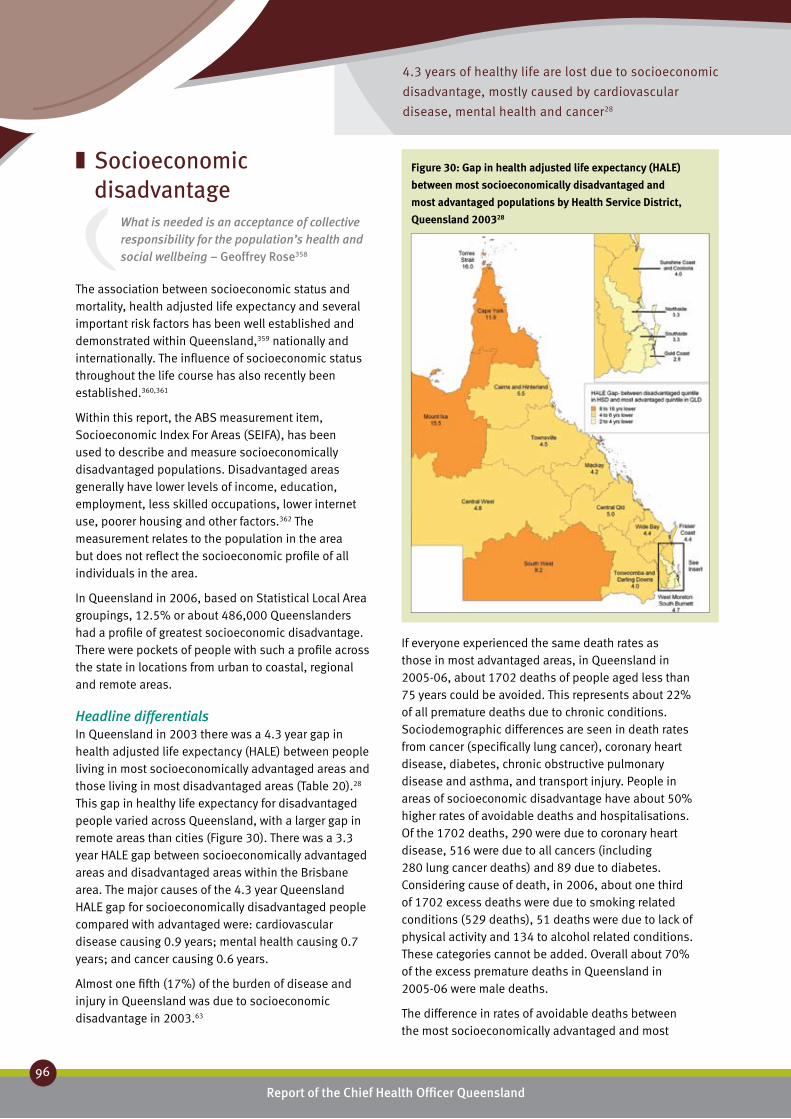
4.3 years of healthy life are lost due to socioeconomic
disadvantage, mostly caused by cardiovascular
disease, mental health and cancer28
Report of the Chief Health Officer Queensland
96
Prevention of Chronic Disease
Socioeconomic ❚
disadvantageWhat is needed is an acceptance of collective responsibility for the population’s health and social wellbeing – Geoffrey Rose358
The association between socioeconomic status and mortality, health adjusted life expectancy and several important risk factors has been well established and demonstrated within Queensland,359 nationally and internationally. The influence of socioeconomic status throughout the life course has also recently been established.360,361
Within this report, the ABS measurement item, Socioeconomic Index For Areas (SEIFA), has been used to describe and measure socioeconomically disadvantaged populations. Disadvantaged areas generally have lower levels of income, education, employment, less skilled occupations, lower internet use, poorer housing and other factors.362 The measurement relates to the population in the area but does not reflect the socioeconomic profile of all individuals in the area.
In Queensland in 2006, based on Statistical Local Area groupings, 12.5% or about 486,000 Queenslanders had a profile of greatest socioeconomic disadvantage. There were pockets of people with such a profile across the state in locations from urban to coastal, regional and remote areas.
Headline differentialsIn Queensland in 2003 there was a 4.3 year gap in health adjusted life expectancy (HALE) between people living in most socioeconomically advantaged areas and those living in most disadvantaged areas (Table 20).28 This gap in healthy life expectancy for disadvantaged people varied across Queensland, with a larger gap in remote areas than cities (Figure 30). There was a 3.3 year HALE gap between socioeconomically advantaged areas and disadvantaged areas within the Brisbane area. The major causes of the 4.3 year Queensland HALE gap for socioeconomically disadvantaged people compared with advantaged were: cardiovascular disease causing 0.9 years; mental health causing 0.7 years; and cancer causing 0.6 years.
Almost one fifth (17%) of the burden of disease and injury in Queensland was due to socioeconomic disadvantage in 2003.63
If everyone experienced the same death rates as those in most advantaged areas, in Queensland in 2005-06, about 1702 deaths of people aged less than 75 years could be avoided. This represents about 22% of all premature deaths due to chronic conditions. Sociodemographic differences are seen in death rates from cancer (specifically lung cancer), coronary heart disease, diabetes, chronic obstructive pulmonary disease and asthma, and transport injury. People in areas of socioeconomic disadvantage have about 50% higher rates of avoidable deaths and hospitalisations. Of the 1702 deaths, 290 were due to coronary heart disease, 516 were due to all cancers (including 280 lung cancer deaths) and 89 due to diabetes. Considering cause of death, in 2006, about one third of 1702 excess deaths were due to smoking related conditions (529 deaths), 51 deaths were due to lack of physical activity and 134 to alcohol related conditions. These categories cannot be added. Overall about 70% of the excess premature deaths in Queensland in 2005-06 were male deaths.
The difference in rates of avoidable deaths between the most socioeconomically advantaged and most
Figure 30: Gap in health adjusted life expectancy (HALE)
between most socioeconomically disadvantaged and
most advantaged populations by Health Service District,
Queensland 200328

Over the past 20 years there has been no reduction in inequality
in preventable deaths between the socioeconomically advantaged
and disadvantaged in Queensland19
Report of the Chief Health Officer Queensland Prevention of Chronic Disease
97
44
disadvantaged areas in Queensland increased by about 1% per year between 1987 and 2006 (Figure 31).19 The avoidable death rate in the most disadvantaged quintile was about 1.5 times that of the most advantaged quintile.
People who live in areas of socioeconomic disadvantage in Queensland have a profile of higher health risk behaviours, compared to those in advantaged areas. These risk factors put people at greater risk of chronic disease and reduced health and wellbeing. They also add to the pressure on the health system. In 2004 smoking rates in disadvantaged areas of Queensland were 90% higher than in advantaged areas.63 After adjusting for age differences, in 2005-06 death rates for smoking related conditions were 43% higher and hospitalisation rates were 70% higher in disadvantaged areas than advantaged areas (Figure 15). In 2008, self reported obesity prevalence in disadvantaged areas was double the prevalence in advantaged areas (Table 7). The prevalence of sufficient physical activity for health benefit was lower in disadvantaged areas, although in 2008, not significantly lower (Table 9). Death rates due to physical inactivity were higher but not significantly higher, but hospitalisation rates were 55% higher in disadvantaged areas compared to advantaged areas even after adjusting for age differences (Figure 21). Although the prevalence of alcohol misuse in disadvantaged areas was similar to advantaged areas in 2007 (Table 10), death rates for alcohol related conditions were 80% higher and hospitalisation rates were about 40% higher (Figure 23).
Challenges and opportunitiesSocioeconomic disadvantage accounts for a high proportion of the burden of disease and injury in Queensland, which means that there is much to gain in the development of programs to address the specific aspects of disadvantaged populations within Queensland. This is a complex task. Responding to the challenge of socioeconomically mediated health differentials and their prevention will require a whole of society approach and strong and sustained focus on reducing inequality through culturally appropriate and evidence based interventions. These are discussed in Chapter 6: Challengers and opportunities. A goal will be to ensure that interventions to improve the health of the population do not inadvertently disadvantage those who most need to reap the benefit.
Reducing inequality is a key strategic direction of Queensland Health Population Health Plan.94
Figure 31: Relative risk of avoidable death of socioeconomically
disadvantaged compared with advantaged quintile, Queensland
1.00
0.00
Avo
idab
le d
eath
rate
rati
o
1987
1988
1989
1990
1991
1992
1993
1994
1995
1996
1997
1998
1999
2000
2001
2002
2003
2004
2005
2006
Ratio: Most disadvantaged to least disadvantaged rates of avoidable mortality
Qld Disadvantaged AdvantagedGap: Disadvantage-
Advantage
HALE (years) 72.8 71.3 75.6 -4.3
Gap- from Qld (years) -1.5 2.7
Top 5 causes of HALE difference from Qld (years) Gap: Disadvantage-Advantage
Cardiovascular -0.29 0.60 -0.9
Mental -0.33 0.34 -0.7
Chronic respiratory -0.15 0.27 -0.4
Diabetes -0.13 0.23 -0.4
Unintentional injuries -0.13 0.28 -0.4
Intentional injuries -0.10 0.12 -0.2
Table 20: Health adjusted life expectancy (HALE), areas of socio-economic
disadvantage, Queensland, 200328
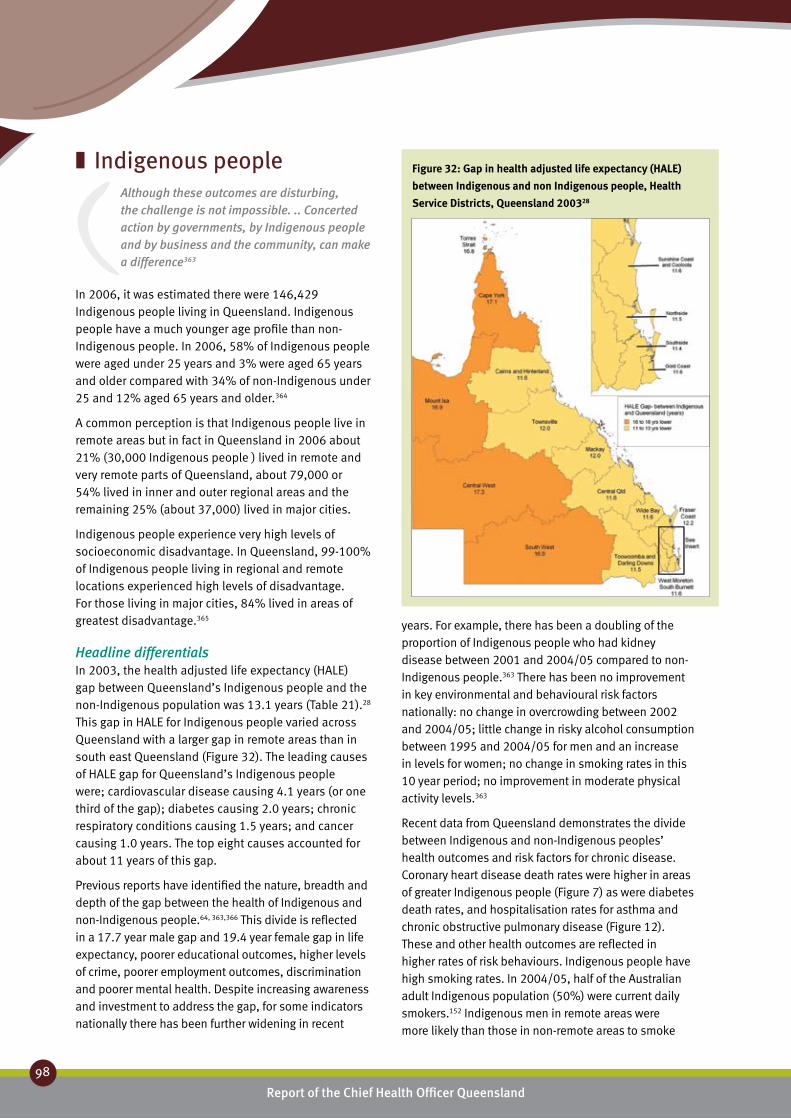
Report of the Chief Health Officer Queensland
98
Prevention of Chronic Disease
Indigenous people ❚Although these outcomes are disturbing, the challenge is not impossible. .. Concerted action by governments, by Indigenous people and by business and the community, can make a difference363
In 2006, it was estimated there were 146,429 Indigenous people living in Queensland. Indigenous people have a much younger age profile than non-Indigenous people. In 2006, 58% of Indigenous people were aged under 25 years and 3% were aged 65 years and older compared with 34% of non-Indigenous under 25 and 12% aged 65 years and older.364
A common perception is that Indigenous people live in remote areas but in fact in Queensland in 2006 about 21% (30,000 Indigenous people ) lived in remote and very remote parts of Queensland, about 79,000 or 54% lived in inner and outer regional areas and the remaining 25% (about 37,000) lived in major cities.
Indigenous people experience very high levels of socioeconomic disadvantage. In Queensland, 99-100% of Indigenous people living in regional and remote locations experienced high levels of disadvantage. For those living in major cities, 84% lived in areas of greatest disadvantage.365
Headline differentialsIn 2003, the health adjusted life expectancy (HALE) gap between Queensland’s Indigenous people and the non-Indigenous population was 13.1 years (Table 21).28 This gap in HALE for Indigenous people varied across Queensland with a larger gap in remote areas than in south east Queensland (Figure 32). The leading causes of HALE gap for Queensland’s Indigenous people were; cardiovascular disease causing 4.1 years (or one third of the gap); diabetes causing 2.0 years; chronic respiratory conditions causing 1.5 years; and cancer causing 1.0 years. The top eight causes accounted for about 11 years of this gap.
Previous reports have identified the nature, breadth and depth of the gap between the health of Indigenous and non-Indigenous people.64, 363,366 This divide is reflected in a 17.7 year male gap and 19.4 year female gap in life expectancy, poorer educational outcomes, higher levels of crime, poorer employment outcomes, discrimination and poorer mental health. Despite increasing awareness and investment to address the gap, for some indicators nationally there has been further widening in recent
Figure 32: Gap in health adjusted life expectancy (HALE)
between Indigenous and non Indigenous people, Health
Service Districts, Queensland 200328
years. For example, there has been a doubling of the proportion of Indigenous people who had kidney disease between 2001 and 2004/05 compared to non-Indigenous people.363 There has been no improvement in key environmental and behavioural risk factors nationally: no change in overcrowding between 2002 and 2004/05; little change in risky alcohol consumption between 1995 and 2004/05 for men and an increase in levels for women; no change in smoking rates in this 10 year period; no improvement in moderate physical activity levels.363
Recent data from Queensland demonstrates the divide between Indigenous and non-Indigenous peoples’ health outcomes and risk factors for chronic disease. Coronary heart disease death rates were higher in areas of greater Indigenous people (Figure 7) as were diabetes death rates, and hospitalisation rates for asthma and chronic obstructive pulmonary disease (Figure 12). These and other health outcomes are reflected in higher rates of risk behaviours. Indigenous people have high smoking rates. In 2004/05, half of the Australian adult Indigenous population (50%) were current daily smokers.152 Indigenous men in remote areas were more likely than those in non-remote areas to smoke

Report of the Chief Health Officer Queensland Prevention of Chronic Disease
99
44
on a daily basis (58% compared with 49%). Similarly Indigenous mothers have high smoking rates (53% compared to 18% in non-Indigenous mothers) and low quit rates during pregnancy (3% compared with 7% in non-Indigenous mothers). Indigenous mothers were less likely to initiate and continue breastfeeding than other mothers. Breastfeeding at hospital discharge was lower
(81% compared with 87% for non-Indigenous mothers in 2006). In 2004/05, 79% of Australian Indigenous children had ever been breastfed compared with 88% of other Australian children.257
While Indigenous people in Australia are less likely to be current drinkers compared to the general population, those who do drink are more likely to do so at risky levels.276 Indigenous youth compared to non-Indigenous youth are 2.3 times more likely to die from alcohol related causes. Death rates for alcohol related conditions in areas of high Indigenous population in Queensland were 2.2 times rates in areas with low Indigenous population in 2005-06. Hospitalisation rates in these areas were five times higher in 2005/06-2006/07 in Queensland.
All available evidence highlights the poor nutritional status of Indigenous people. The prevalence of diet related conditions such as Type 2 diabetes, cardiovascular disease, renal disease, poor oral health, iron deficiency anaemia and some forms of cancer are disproportionately higher among Indigenous Australians.275
The Australian Government has introduced two Health Checks for Indigenous people in Australia to ensure adults and children receive primary health care through early detection, diagnosis and intervention for common treatable conditions that cause illness and early death.332 These are the Aboriginal and Torres Strait Islander Child Health Check and the Aboriginal and Torres Strait Islander Adult Health Check.
Queensland works collaboratively with the Commonwealth government under the National Strategic Framework for Aboriginal and Torres Strait Islander Health 2003-2013.367 To achieve the national goal of closing the life expectancy gap within a generation will require an integrated package of reform initiatives with sustained and ongoing investment across government. This will need to include housing and environmental health, education and employment reform. Reducing chronic disease risk factor incidence and prevalence are of strategic importance in achieving the national goal. This is further discussed in Chapter 6: Challenges and opportunities.
Challenges and opportunitiesClosing the life expectancy gap between Indigenous and non-Indigenous Australians is a key priority of the Australian government,76 with strategies to build on existing interventions and new targets set for achievement in the medium term. These targets
QldIndigenous
peopleNon-Indigenous
people
HALE (years) 72.8 60.0 73.1
Gap- from Qld (years) -12.8 0.3
Gap- from non-Indigenous (years)
-13.1
Top 8 causes of HALE difference from Qld (years)Cardiovascular -3.99 0.07
Diabetes -1.93 0.03
Chronic respiratory -1.50 0.02
Cancer -0.99 0.02
Mental -0.91 0.02
Unintentional injuries -0.58 0.02
Intentional injuries -0.57 0.02
Infectious -0.47 0.01
Table 21: Health adjusted life expectancy (HALE),
Indigenous people, Queensland, 200328
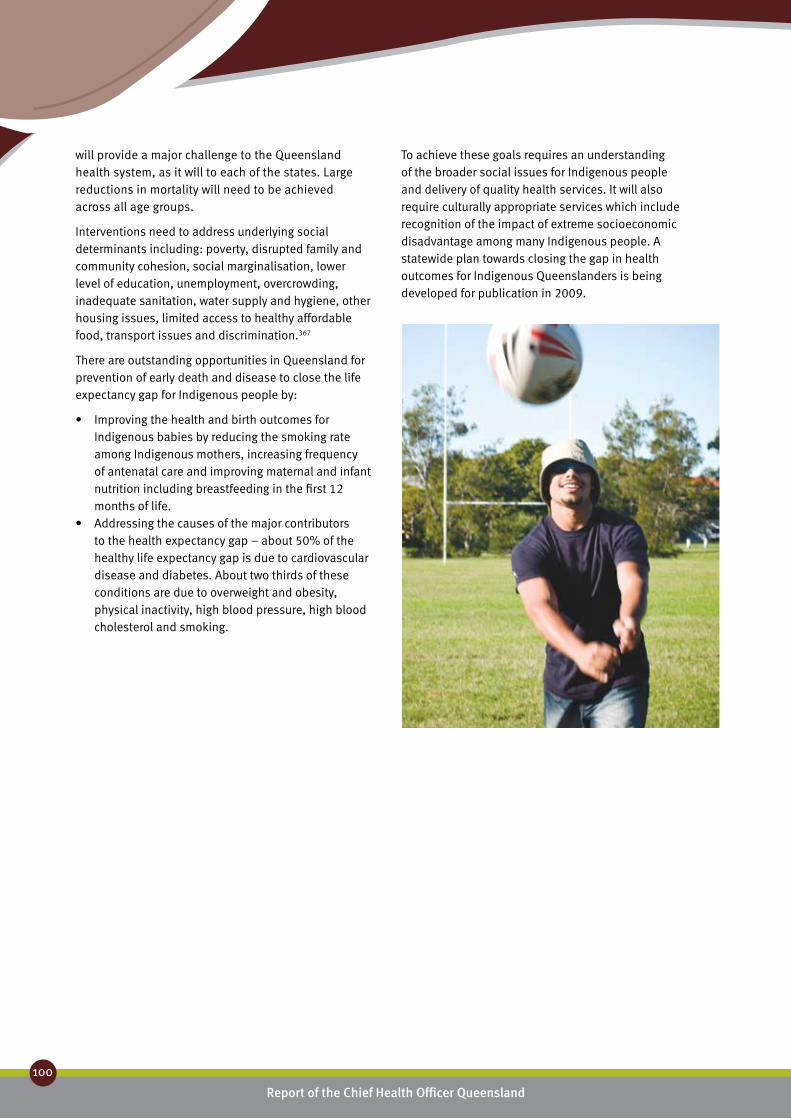
Report of the Chief Health Officer Queensland
100
Prevention of Chronic Disease
will provide a major challenge to the Queensland health system, as it will to each of the states. Large reductions in mortality will need to be achieved across all age groups.
Interventions need to address underlying social determinants including: poverty, disrupted family and community cohesion, social marginalisation, lower level of education, unemployment, overcrowding, inadequate sanitation, water supply and hygiene, other housing issues, limited access to healthy affordable food, transport issues and discrimination.367
There are outstanding opportunities in Queensland for prevention of early death and disease to close the life expectancy gap for Indigenous people by:
Improving the health and birth outcomes for •Indigenous babies by reducing the smoking rate among Indigenous mothers, increasing frequency of antenatal care and improving maternal and infant nutrition including breastfeeding in the first 12 months of life.Addressing the causes of the major contributors •to the health expectancy gap – about 50% of the healthy life expectancy gap is due to cardiovascular disease and diabetes. About two thirds of these conditions are due to overweight and obesity, physical inactivity, high blood pressure, high blood cholesterol and smoking.
To achieve these goals requires an understanding of the broader social issues for Indigenous people and delivery of quality health services. It will also require culturally appropriate services which include recognition of the impact of extreme socioeconomic disadvantage among many Indigenous people. A statewide plan towards closing the gap in health outcomes for Indigenous Queenslanders is being developed for publication in 2009.

Report of the Chief Health Officer Queensland Prevention of Chronic Disease
101
44
Regional and remote ❚
populationsIn 2006, 48% of the Queensland population lived outside the major cities, 45% in regional areas and 3% in remote or very remote areas. Nearly two million people lived outside cities. Population trends have shown declining population in some regional and remote areas and increasing population in others.368
A consideration of the health issues in regional and remote populations is complex. Because remote populations in Queensland have a relatively higher proportion of Indigenous people the specific health issues for people living in remote parts of Queensland can be difficult to separate from Indigenous health issues. The picture is further complicated by socioeconomic differentials where Indigenous people are usually very disadvantaged. The higher health burden of disadvantaged people and Indigenous people are often indistinguishable from the health burden of living in rural and remote areas.315
Headline differentialsIn 2003, the health adjusted life expectancy (HALE) gap between people who live in remote and very remote parts of Queensland and those who live in major cities was 5.6 years (Table 22).28 The gap between regional areas and cities was much smaller at 1.6 years. The leading causes of HALE gap for people in remote areas were; cardiovascular disease causing 0.8 years; unintentional injuries 0.7 years of the gap; diabetes (and specifically Type 2 diabetes) 0.6 years; chronic respiratory conditions 0.5 years and intentional injuries such as suicide caused 0.5 years.
If everyone in Queensland had the same death rates for all causes as those living in major cities about 500 deaths could have been avoided in 2005-06 in people aged less than 75 years. These excess deaths could be attributed to a number of factors including higher proportion of Indigenous people, socioeconomic disadvantage as well as the particulars of living in regional and remote areas. Of these 500 deaths, 90 were due to coronary heart disease and about 50 were due to lung cancer. Considering cause of death, in 2006 about one sixth of the 500 excess deaths were due to smoking related conditions (85 deaths), and 52 to alcohol related conditions. These categories cannot be added.
People who live in regional and remote parts of Queensland have higher rates of some health risk behaviours, compared to those in cities. These risk
factors put people at greater risk of chronic disease and reduced health and wellbeing. They are a cause of early death and increase pressure on the health system through increased hospitalisation rates. In 2004 smoking rates were 50% higher in remote and very remote areas of the state, compared with the major cities.63 Death rates for smoking related conditions were 35% higher and hospitalisation rates for smoking related conditions were double the rates in cities, even after adjusting for age differences (Figure 15). Although levels of physical activity were similar to cities in 2008, hospitalisation rates for physical inactivity related conditions were 85% higher in remote areas compared to cities in 2005/06-2006/07 even after adjusting for age differences (Figure 21). Similarly although the prevalence of alcohol misuse in remote areas was similar to cities in 2007, death rates for alcohol related conditions were 70% higher and hospitalisation rates were 2.3 times the city rates (Figure 23).
Challenges and opportunitiesImprovement in the health of people living in remote parts of Queensland can be achieved by addressing the key risk factors for cardiovascular disease and diabetes, as well as the social and other circumstances that give rise to intentional and unintentional injuries (primarily suicide and road traffic deaths) and in particular alcohol misuse. While there are statewide strategies and programs to address the risk factors for chronic disease,5,242,273 to be successful they will need to recognise the cultural, social and economic characteristics of local communities in regional and remote Queensland.
QldMajor cities
Regional Remote
HALE (years) 72.8 73.8 72.1 68.2
Gap- from Qld (years) 0.9 -0.7 -4.6
Gap- from major cities (years) -1.6 -5.5
Cause of HALE difference from Qld (years)Cardiovascular 0.2 -0.2 -0.8
Unintentional injuries 0.2 -0.1 -0.7
Type 2 diabetes 0.1 0.0 -0.6
Chronic respiratory 0.1 -0.1 -0.5
Intentional injuries 0.1 0.0 -0.5
Table 22: Health adjusted life expectancy (HALE), regional and
remote areas, Queensland 200328
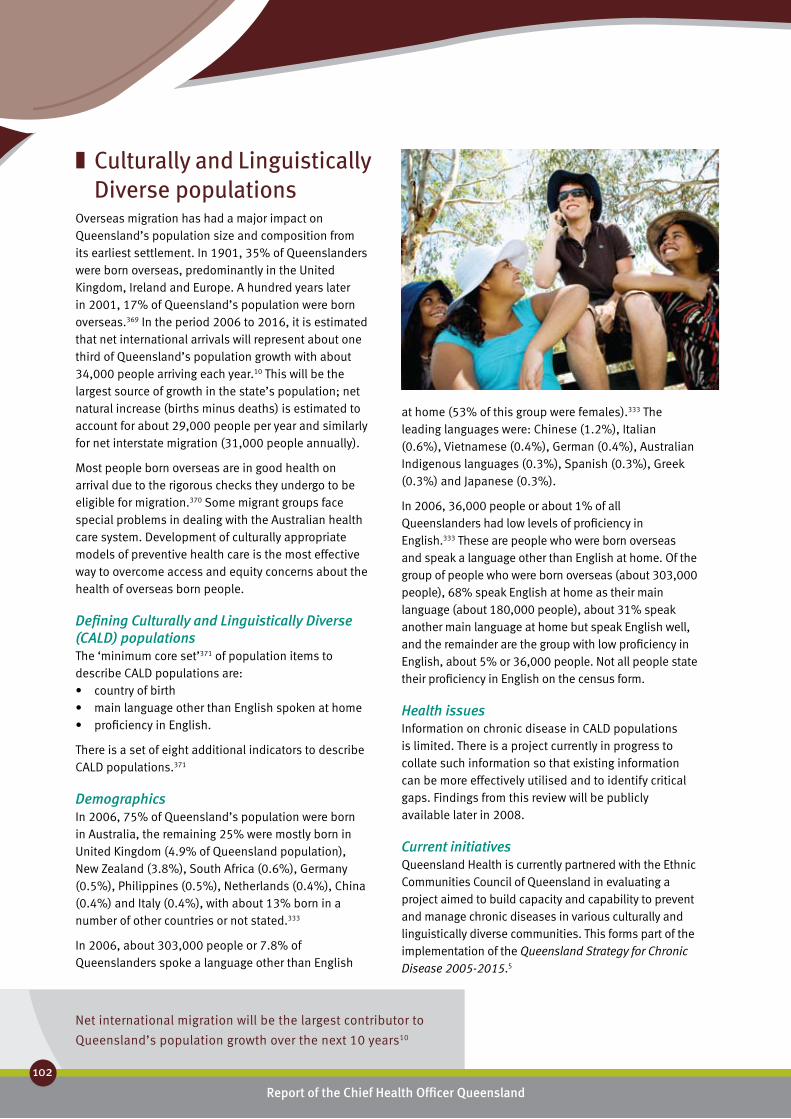
Net international migration will be the largest contributor to
Queensland’s population growth over the next 10 years10
Report of the Chief Health Officer Queensland
102
Prevention of Chronic Disease
Culturally and Linguistically ❚
Diverse populationsOverseas migration has had a major impact on Queensland’s population size and composition from its earliest settlement. In 1901, 35% of Queenslanders were born overseas, predominantly in the United Kingdom, Ireland and Europe. A hundred years later in 2001, 17% of Queensland’s population were born overseas.369 In the period 2006 to 2016, it is estimated that net international arrivals will represent about one third of Queensland’s population growth with about 34,000 people arriving each year.10 This will be the largest source of growth in the state’s population; net natural increase (births minus deaths) is estimated to account for about 29,000 people per year and similarly for net interstate migration (31,000 people annually).
Most people born overseas are in good health on arrival due to the rigorous checks they undergo to be eligible for migration.370 Some migrant groups face special problems in dealing with the Australian health care system. Development of culturally appropriate models of preventive health care is the most effective way to overcome access and equity concerns about the health of overseas born people.
Defining Culturally and Linguistically Diverse (CALD) populationsThe ‘minimum core set’371 of population items to describe CALD populations are:
country of birth •main language other than English spoken at home•proficiency in English.•
There is a set of eight additional indicators to describe CALD populations.371
DemographicsIn 2006, 75% of Queensland’s population were born in Australia, the remaining 25% were mostly born in United Kingdom (4.9% of Queensland population), New Zealand (3.8%), South Africa (0.6%), Germany (0.5%), Philippines (0.5%), Netherlands (0.4%), China (0.4%) and Italy (0.4%), with about 13% born in a number of other countries or not stated.333
In 2006, about 303,000 people or 7.8% of Queenslanders spoke a language other than English
at home (53% of this group were females).333 The leading languages were: Chinese (1.2%), Italian (0.6%), Vietnamese (0.4%), German (0.4%), Australian Indigenous languages (0.3%), Spanish (0.3%), Greek (0.3%) and Japanese (0.3%).
In 2006, 36,000 people or about 1% of all Queenslanders had low levels of proficiency in English.333 These are people who were born overseas and speak a language other than English at home. Of the group of people who were born overseas (about 303,000 people), 68% speak English at home as their main language (about 180,000 people), about 31% speak another main language at home but speak English well, and the remainder are the group with low proficiency in English, about 5% or 36,000 people. Not all people state their proficiency in English on the census form.
Health issuesInformation on chronic disease in CALD populations is limited. There is a project currently in progress to collate such information so that existing information can be more effectively utilised and to identify critical gaps. Findings from this review will be publicly available later in 2008.
Current initiativesQueensland Health is currently partnered with the Ethnic Communities Council of Queensland in evaluating a project aimed to build capacity and capability to prevent and manage chronic diseases in various culturally and linguistically diverse communities. This forms part of the implementation of the Queensland Strategy for Chronic Disease 2005-2015.5
Report of the Chief Health Officer Queensland Prevention of Chronic Disease
103
If we are serious about improving the health and quality of life ... AND keeping our health care budget under control ... we cannot afford to ignore the power of prevention – CDC45
The conditions of everyday life determine whether people are healthy or unhealthy by supporting healthy choices and behaviours. These everyday conditions – that is how our society is organised and how we live our lives – stem from a combination of actions and activities by governments, businesses, communities and individuals. Individual responsibility can have its full effect only when individuals have equitable access to the determinants of a healthy life and are supported to make healthy choices.
Currently many Queenslanders make unhealthy choices. The burden of disease due to chronic disease is high. Many Queenslanders could enjoy three to six additional years of healthy life if the rates of ill health were the same throughout the state. This would also avoid costs associated with chronic disease. There is good evidence that chronic disease can be prevented from occurring in the first place and also from progressing to become a complex problem requiring expensive and intensive medical care.372 Many chronic diseases have their origins at young ages. Consequently there are many opportunities for prevention, beginning with mothers, infants and children.
Key risk factors for developing chronic disease are smoking, alcohol misuse, poor nutrition, physical inactivity and sedentary behaviours. Seven in 10 adults have two or more of these risk factors.129 Reducing the prevalance of these risk factors will prevent many different chronic diseases including Type 2 diabetes, coronary heart disease, stroke, chronic obstructive pulmonary disease and certain cancers (e.g. lung, colorectal). Detailed information on each of these diseases and risk factors is provided
in Chapter 2: Chronic disease, and Chapter 3: Risk factors for chronic disease.
Reducing these risk factors can lead to rapid improvements in health at individual and population levels. Preventing chronic disease not only improves the quality of life for people but also reduces the costs of expensive and intensive medical treatment incurred by individuals, communities and governments. The central strategy for preventing chronic disease, as recommended by WHO, is to develop population wide approaches which are combined with interventions for individuals.8 As chronic disease is caused by many determinants, the complex problem of preventing chronic disease requires multi-strategy solutions at both individual and population levels.
Comprehensive and integrated actions are the means to prevent and control chronic diseases. Implementation from a whole system perspective is fundamental to achieving the goals of public health interventions.373 Population wide approaches seek to reduce the risks throughout the entire population. They have a different focus to other sectors in the health system as they address the causes rather than the consequences of chronic disease. They are characterised by actions that target:
the entire range of risk and protective factors that •determine the health of the community, including environmental and socioeconomic factors, community capacity, health behaviours and person-related factorsthe entire population and/or sub-populations.• 94
Effective population health approaches require the coordinated and integrated implementation of a comprehensive suite of strategies, as proposed by the World Health Organization,8 including:
Laws and regulation• which are fundamental elements of effective public health policy and practice.
Prevention works
Smoking ❚
Alcohol ❚
Nutrition ❚
Physical activity ❚
Cancer screening ❚
In th
is c
hapt
er:
c h a p t e rf i v e

Many Queenslanders could enjoy 3-6 years additional years of healthy
life if rates of ill health were the same throughout the state28
Report of the Chief Health Officer Queensland
104
Prevention of Chronic Disease
Tax and price interventions• which are generally federal responsibilities in Australia.Improving the built environment• which is particularly important for increasing physical activity and healthy eating. Advocacy• which is a method of engagement and influencing which underpins the population health approach to improving health. Advocacy is used in the development of all population health interventions, including community engagement and development.Community based interventions• which target a specified community, which may be a defined geographical area or group of people bonded by common interests, goals, sense of identity or needs.School based interventions• which can be an efficient way of reducing the risk of chronic disease among large numbers of children.Workplace interventions• which are successful in improving the health of employed adults.Screening• where the implementation of population based cancer screening programs is fundamental to reducing the incidence and death rates of a number of cancers.Brief intervention and group based programs• where in a brief intervention advice is given by a health professional opportunistically during routine consultations with clients.
The population health approach to prevention of chronic disease, if applied universally, has benefits for all Queenslanders from the very unhealthy to the very well. For example, the development of supportive
environments for physical activity or increasing availability of heathy food affects not only the well population, but is also important to those already with disease or risk factors.
This chapter describes and gives examples of the types of interventions for the whole population and for individuals, using the population health approach. These strategies have enabled Queensland to reduce the prevalence of risk factors for chronic disease such as tobacco smoking, nutrition and physical inactivity. While this chapter describes strategies in relation to individual risk factors, generally multiple risk factors are addressed together due to the interdependence of the behaviours and the determinants of those behaviours.
It is clear that the health of Queenslanders and the health system of Queensland is under threat from chronic disease. This chapter outlines the evidence to show that the risk factors of chronic disease can be prevented in Queensland using available knowledge. However much more investment is required. Chapter 6: Challenges and opportunities outlines recommendations for policy reform in obesity, tobacco and alcohol. Doing nothing new or doing little will mean a great deal of illness, suffering and premature death that is otherwise preventable. It will mean, as is already being seen, over loading of hospitals, health and welfare services, made more acute by the ageing of the Queensland population. Similarly it will mean rising costs within the health system and losses in workplace productivity.

Report of the Chief Health Officer Queensland Prevention of Chronic Disease
105
5
Smoking ❚Tobacco smoking remains a leading cause of preventable death and disease in Queensland and is a leading cause of health inequality. Prevention efforts aim to stop the uptake of smoking and to help smokers quit. Tobacco is highly addictive and a range of proven strategies, from legislative and behavioural support to pharmacotherapy, are used to support people to stop smoking. Awareness of the serious health consequences of smoking is promoted via statewide Quit campaigns that also persuade smokers to quit with assistance from the Quitline service.
Smoking, more than any other single factor, contributes to the gap in healthy life expectancy between those most advantaged and those most in need.210 The majority of people who start smoking do so before they become adults.210 Both starting and stopping smoking are influenced by a number of social and cultural factors, and so prevention programs and services need to be targeted and appropriate to different groups. Therefore to reduce smoking prevalence in Queensland requires affecting positive change in the social, economic and cultural determinants of health.
Tobacco use in Australia has been reduced as a result of comprehensive tobacco control strategies that increase the price of tobacco products and change social attitudes to smoking through legislation and hard hitting campaigns.210
There is a continuing downward trend in daily smoking; in the three year period between 2004 and 2007 there was 13% drop in smoking prevalence – a 2.6 percentage point difference in the proportion of Queenslanders aged 14 years and older smoking daily from 19.8% to 17.2%.36 However in 2007, Queensland continued to have the third highest proportion of daily smokers of the states and territories of Australia, and 4% greater than the national average.
The current Queensland tobacco control program is proof that muti-strategy solutions work. During the period 2004 to 2007 this program was expanded to include the nation’s leading indoor and outdoor smoking bans, more enforcement officers, public education and high-profile compliance operations, statewide mass media quit smoking campaigns, a new Quitline service and Indigenous programs (see spotlights below). A reduction in daily smoking was the result.36 This solution, and $12 million investment in prevention, will potentially result in more than 5,000 fewer deaths due to cancer, chronic obstructive
pulmonary disease and cardiovascular disease and a saving of $112.4 million in treatment costs over the next 30 years. This equates to a net saving to the health system of $100 million.
Tax and price interventions for reducing tobacco smoking are the responsibility of the federal government. The Queensland implementation of the National Tobacco Strategy 2004-2009210 and the National Drug Strategy 2004-2009374 includes:
Laws and regulation1. : Tobacco taxes are the single most cost effective intervention in relation to reducing tobacco consumption.375 Comprehensive, statewide legislation strictly regulates the advertising, display and promotion of tobacco products, and defines a range of smoke-free laws for indoor and outdoor places (see spotlight Queensland Tobacco Laws below).Improving the built environment2. : Smoking is banned in all enclosed public places and a range of outdoor places in Queensland as a result of legislation.Community based interventions3. : Statewide Quit smoking social marketing initiatives aim to encourage and support people to quit smoking and promote awareness of the serious health effects of smoking.School based interventions4. : Queensland Health works in collaboration with Department of Education, Training and the Arts (DETA) to ensure appropriate education about smoking occurs within the school curricula and environment.Workplace interventions5. : Queensland Health supports and encourages the development and implementation of workplace tobacco control policies. The Queensland Health Smoking Management Policy was introduced in July 2006 and has three components including smoke-free environments, and brief intervention and nicotine replacement therapy for hospital inpatients and the 67,000 staff (see spotlight Quit smoking … for life! below).Brief intervention and group based programs6. : Queensland’s Quitline service provides telephone counselling and brief intervention to support smokers who want to quit. The SmokeCheck program trains health professionals in the provision of evidence based and cuturally appropriate brief intervention with their Indigenous clients who smoke (see spotlight SmokeCheck below).

Report of the Chief Health Officer Queensland
106
Prevention of Chronic Disease
Tobacco control – Queensland’s tobacco laws
An integral part of Queensland’s multi-strategy tobacco control plan is the
State’s comprehensive tobacco laws. These laws are some of the toughest in Australia and aim to: reduce the public’s exposure to environmental tobacco smoke, contribute to a culture that supports smokers trying to quit, and discourage young people from taking up the habit. The laws are also about supporting social change and creating an environment where non-smoking is the norm.
New tobacco laws introduced from January 2005 to July 2006 included banning smoking at all indoor liquor licensed premises and outdoor eating and drinking places, as well as children’s playgrounds, patrolled beaches, major sports facilities and building entrances. The legislation also severely restricts the display, advertising and promotion of tobacco products and prohibits the supply of tobacco products to children. As a result of the introduction of these laws:
85% of smokers claim they have ‘• completely stopped smoking in all areas where it is illegal to smoke at all times’67% are ‘• smoking less in public spaces’ generally22% of smokers report they attempted to quit •smoking.
A recent review of the new laws, focussing on the smoke-free enclosed and outdoor places provisions of the legislation, found strong support from Queenslanders for smoke-free environments in the 642 submissions received. As a result, the following upcoming changes to the legislation were announced:
Banning smoking in cars where children under the •age of 16 years are present.Transferring power to local governments to regulate •smoking at pedestrian malls and at public transport waiting points.Advocating for a nationwide ban on smoking in •casino high roller rooms.
Smoking cessation – Quitline
Queensland Health’s Health Contact Centre was developed as part of the State Government’s 2004 election commitment
to develop a 24-hour, seven-day-a-week, statewide health contact centre. It operates in partnership with Smart Service Queensland.
The Health Contact Centre’s aim is to provide accessible health advice, information, referral and triage to the people of Queensland. Since moving to the Health Contact Centre in November 2007, Quitline (13 QUIT) has joined the 13 HEALTH service and other statewide services and offers telephone-based support for the cost of a local call.
Quitline is a statewide, confidential service which provides individually tailored information, advice and support to people who want to quit smoking. It has been assisting Queensland callers for over 20 years. Quitline advisors provide support, encouragement and resources to callers by:
assessing nicotine dependence •determining habits and routines around smoking •discussing motivations for and barriers to quitting •smokingindividually tailoring a quit plan for each caller•offering ongoing support during the quitting •process.
During the Quit Campaign advertising periods, calls to the Quitline doubled in volume and significant numbers of Queensland smokers were assisted in their quit attempts. In the last seven months, Quitline has assisted over 12,500 smokers in Queensland in their attempts to quit. Twelve months after contacting Quitlines nationally 29% of callers were no longer smoking and 14% had not smoked for six months and 6% had not smoked for 12 months.376
In addition to receiving inbound calls from members of the public, Quitline runs several referral and call-back programs. As well as Queensland Health’s Quit Smoking… for Life! Program, Quitline responds to referrals from GPs and other health professionals, and is involved in the National Smoke-free Pregnancy Project.
SPOTLIGHT SPOTLIGHT

Report of the Chief Health Officer Queensland Prevention of Chronic Disease
107
5
Queensland Health Staff Quit Smoking Program – Quit smoking ... for life!
The workplace smoking cessation initiative, Queensland Health’s Quit Smoking … for Life! program is designed to support staff who are ready to quit smoking. The program is an important component of the Queensland Health Smoking Management Policy. Under the program, eligible staff are offered up to 16 weeks of free nicotine patches and gum, as well as counselling support by Quitline Advisors. Staff are contacted again at three and 12 months for follow up.
Since its start in October 2005 more than 2300 staff have registered for the Quit Smoking … for Life! program. At the end of their regular contacts, 34% of staff successfully quit smoking. Three months after these contacts 22% of staff remain smoke-free. The natural population level quit rate is approximately 8-10%, so the Quit Smoking … for Life! Program accounts for a more than 100% increase in a successful quit attempt at three months.
Indigenous Tobacco Brief Intervention Program – Smokecheck
With smoking rates in the Indigenous population more than double that of the
total population, smoking-related illness is a major health problem for Indigenous Queenslanders. The death rate due to smoking for Indigenous people is around three times higher than the Queensland average. Whilst smoking rates in the general population have declined in the past 20 years, they have not declined in Indigenous populations.275
SmokeCheck has been shown to increase health worker self-efficacy, confidence and skills in conducting brief interventions to assist their Indigenous clients to think about their smoking, move towards being ready to quit, cut down the number of cigarettes they smoke and quit smoking altogether. Since 2005 in Queensland more than 750 health workers have been trained.
Following training:377
87% were very sure that they were more positive •about speaking with clients about smoking35% had gained skills in discussing smoking •27% felt more prepared and capable of delivering •brief interventions47% increased their confidence to deliver the brief •intervention32% agreed that • SmokeCheck had helped staff reduce their own smoking after three months 70% of workers were using •SmokeCheck often with clients.
Following the brief intervention:an increase in quitting attempts within three •monthsup to 12% decrease in prevalence of daily smoking •11 or more cigarettes one month later.
Ready to quit smoking?
We’re ready to help!
SPOTLIGHT SPOTLIGHT

Report of the Chief Health Officer Queensland
108
Prevention of Chronic Disease
Alcohol ❚Alcohol plays an important part in the economy and has an important social role. It is a familiar part of traditions and customs and is often used for relaxation, socialisation and celebration. However alcohol misuse has significant social, economic and health costs in Queensland and can lead to a wide range of harms and dependence. As the drinking culture in Queensland and Australia is extremely strong and entrenched in everyday life, achieving attitude and behaviour change will be difficult and needs to be seen as a long term goal.274
Alcohol consumption in Queensland has not changed over the past decade. Around 11% of the population are drinking at risky levels for long-term harm, and the proportion drinking daily has remained between 6% and 9%.211, 378 The average age at which people had their first full serve of alcohol (16.8 years) has also remained stable.
Preventing alcohol misuse and harm requires a multi-state and multi-sectorial approach. The National Alcohol Strategy 2006-2009274 is a collaboration between Australian government, non-government, industry partners and the broader community. It sets out a plan of action to develop safer drinking cultures and prevent or minimise alcohol-related harm through:
reducing the incidence of intoxication among •drinkersenhancing public safety and amenity of drinking •environments improving health outcomes for individuals and •communities affected by alcohol consumptionfacilitating safer and healthier drinking cultures by •raising community understanding and awareness of alcohol and its impacts, and through regulation of its availability.
Tax and price interventions for reducing alcohol misuse are the responsibility of the federal government. In Queensland, using a whole-of-government approach, the implementation of the National Alcohol Strategy 2006-2009 and the National Drug Strategy 2004-2009274 includes:
1. Laws and regulation: Queensland Treasury is responsible for laws and regulations relating to the licensing of venues, in-venue alcohol promotions and alcohol supply.
2. Improving the built environment: Excessive alcohol consumption is linked to unwanted outcomes such as injury, violence and street crime. The Safer Venues Program aims to reduce these by working with the liquor industry to improve safety in and around licensed premises.
3. Community based interventions: Social marketing campaigns such as the Young Women and Alcohol campaign (see spotlight Make up your own mind about drinking below) aim to reduce harmful alcohol consumption by encouraging people to consider their drinking behaviour. Liquor Accords are a partnership approach to liquor-related issues in local communities. Queensland Health, in collaboration with the Office of Liquor, Gaming and Racing, works with key stakeholders to address alcohol-related problems at the community level. The Good Sports program promotes responsible alcohol management practices for liquor licensed sporting clubs and their members.
4. School based interventions: Queensland Health works in collaboration with Department of Education, Training and the Arts (DETA) to ensure appropriate education about alcohol misuse and harms occurs within the school curricula and environment.
5. Workplace interventions: Queensland Health collaborates with providers of employee assistance programs to help prevent workplace injury and harm from alcohol misuse through referral of employees to the Alcohol and Drug Information Service (ADIS) Queensland Health.
6. Brief intervention and group based programs: ADIS also provides telephone based brief intervention and counselling 24 hours a day, seven days a week.

Report of the Chief Health Officer Queensland Prevention of Chronic Disease
109
5
there has been a significant increase in the •proportion of young women reporting drinking at low-risk levels for short-term harm, from 40% (2004) to 58% (2007).
The campaign had the greatest impact amongst ‘reluctant drinker’ young women with 80% taking action to reduce their harmful alcohol consumption.
The majority (84%) of young women who were interviewed agreed that
‘The ad encourages me to make my own decisions about how much I drink and when I drink’
Young Women & Alcohol Campaign – Make up your own mind about drinking
Queensland Health’s Young Women and Alcohol Campaign first commenced in 2004 in response to research which
showed young Queensland women were increasingly drinking in a risky manner. The campaign encourages young women aged 18 to 22 years to reduce their harmful alcohol consumption by empowering them to take control of how they drink.
Between 2004 and 2007, three phases of the Make up your own mind about drinking campaign were implemented. The campaign put drinking less into perspective, and showed young women that it wasn’t the end of the world to say ‘no thanks’. The campaign messages were delivered through a mix of media including cinema, television, radio, magazine, convenience and outdoor advertising.
This social marketing campaign included media message delivery as well as local initiatives to reinforce and support the messages, such as working with sporting associations to raise awareness of the risk of alcohol misuse.
The population health approach and implementation of multiple strategies in partnership with others resulted in a highly successful campaign with young women making positive changes to how they drink. This included reducing the amount of alcohol consumed at any one time, and the number of drinking occasions.
In 2007 there was:96% total recall of campaign advertising•59% of 18-22 year olds (an estimated 77,580 young •women) reported reducing their harmful drinking since 2004 there has been a significant reduction in •the proportion of young women reporting drinking at high-risk levels for long-term harm, from 60% (2004) to 42% (2007)
SPOTLIGHT

Report of the Chief Health Officer Queensland
110
Prevention of Chronic Disease
Nutrition ❚Nutrition is important for health and wellbeing. Optimum nutrition is essential for normal growth and the physical and cognitive development of infants and children, healthy weight, enhanced resilience and quality of life, good physical and mental health throughout life, resistance to infection and protection against chronic diseases and premature death.242 A balanced diet, as recommended in the NHMRC Dietary Guidelines series,17,21 includes consuming a variety of nutritious foods and drinks to provide appropriate levels of protective dietary components including micro and macro nutrients, and avoiding excessive consumption of energy-dense nutrient-poor foods including those high in salt, saturated fats and sugars. Poor diet is estimated to have a major effect on the health of Queenslanders, similar to that of cancer or cardiovascular disease or that due to socioeconomic disadvantage, and about double that of smoking. 29,379
Poor nutrition can be prevented. Primary prevention at the population level will provide great benefits. Recognising this, Queensland is adding to the existing investment by funding incrementally up to $16 million per year from 2002/03 to 2008/09 for promotion of healthy weight, nutrition and physical activity. This investment supports the work of 148 new primary prevention positions. Over 100 coordinated nutrition and physical activity initiatives are happening under programs such as the Eat Well Be Active – Healthy Kids for Life Action Plan 2005-2008,234 the work plan of the Premier’s Eat Well Be Active Taskforce and Eat Well Queensland 2002-2012,242 Be Active Queensland 2006-2012357 and the Queensland Aboriginal and Torres Strait Islander Food and Nutrition Strategy (QATSINSAP).
A broad, population approach had been adopted for the state wide nutrition strategy Eat Well Queensland.242 This is the State’s first comprehensive, intersectorial whole-of-population strategy to address food and nutrition issues. Where implemented, this approach has achieved significant success. Priority actions from this strategy are:
address food supply•promote healthy eating•increase consumption of fruit and vegetables•enhance health of mothers and children•achieve and maintain a healthy weight•develop infrastructure and capacity. •
To improve nutrition in Queensland requires simultaneous action in all these areas, by the health
sector, across government, communities, business and individuals. Implementation of the strategies could include:
1. Laws and regulation: Food standards are regulated in Australia under Commonwealth legislation. Restriction of TV advertising of junk food and drinks targetting children would assist implementation of healthy eating programs228 and is a cost saving intervention.380
2. Tax and price interventions: Regular reporting of the cost and availability of healthy food throughout the state through the Healthy Food Access Basket surveys enables Queensland Health to advocate for equity in access to healthy food, wherever people live.252 Tax and price interventions on freight, store infrastructure, fat and/or sugar content of food are other possible interventions. Some Australian states have implemented subsidies, for example fuel tax subsidy.
3. Improving the built environment: Interventions in relation to access to healthy and unhealthy food include agricultural land use planning, provision of public breastfeeding facilities, access to fresh food outlets including local grower’s markets, discretionary access to fast food outlets, access to water bubblers/fountains, advertising of foods and drinks, and food distribution and transport systems.
4. Community based interventions: In addition to the Go for 2 & 5® fruit and vegetable promotion program (see spotlight below), the Eat Well Be Active campaign (www.your30.qld.gov.au ) provided healthy weight, nutrition and physical activity information to every Queensland household in March/April 2007. Over 100 coordinated nutrition and physical activity initiatives are being implemented by six government agencies throughout the state under the Eat Well Be Active – Healthy Kids for Life Action Plan 2005-2008; initiatives are focussed in three demonstration sites. The Queensland Community Partnerships Program supports over 60 local projects promoting nutrition and physical activity in communities.
5. School based interventions: Enhancing the nutrition of children is fundamental to reducing the future burden of chronic disease. The school environment, partnerships and curriculum are important areas to improve children’s knowledge, skills and attitudes about healthy eating, as recognised by the Queensland

Report of the Chief Health Officer Queensland Prevention of Chronic Disease
111
5
Health and Department of Education, Training and the Arts Joint Work Plan 2004-2007. The Smart Choices - Healthy Food and Drink Supply Strategy for Queensland Schools aims to support healthy food and drink choices to students (see spotlight below).
6. Workplace interventions: Food supply and practices in workplaces affect food choices at work, and beyond. In Queensland Health facilities, the A Better Choice – healthy food and drink supply strategy became mandatory on 1 September 2008.
Increase fruit and vegetable consumption – Go for 2 & 5®
Queensland Health’s four year Go for 2&5® fruit and vegetable social marketing
campaign started in October 2005 to help reduce the risks of obesity, poor nutrition and chronic disease throughout the state. Partners from the fruit and vegetable industry and non-government sector have licensed into the campaign, extending its reach and impact. In addition, a dedicated Aboriginal and Torres Strait Islander Go for 2&5® campaign will start in late 2008.
Go for 2&5® aims to increase consumption of fruit and vegetables by Queensland adults by an average of one serve per person per day. To achieve this, the multi-faceted campaign incorporates advertising, promotional activity, online information, media and local community initiatives.
The primary target group of adults aged 25–55 years has been further segmented based on consumption beliefs and behaviours, with a particular focus on those that are not eating enough fruit and vegetables, but think that increasing consumption ‘is easy’.
The campaign is in four phases to enable tracking and responding to changes in knowledge, beliefs and behaviours over the campaign period. Phase one increased fruit and vegetable consumption by an average 0.4 serves per person per day in the target age
7. Brief intervention and group based programs: Focusing on Indigenous peoples, three major interventions are the Living Strong program (a group based weight management and healthy lifestyle program), early life nutrition programs, such as Growing Strong Feeding You and Your Baby (an early life nutrition program) resources and training, and the Aboriginal and Torres Strait Islander Nutrition and Physical Activity Brief Intervention Program). Lighten Up to a Healthier Lifestyle program is a group based program for the entire population. See spotlights below for latter two programs.
group in January – March 2006. Ongoing campaign tracking, which commenced in August 2006, has shown a peak increase of 1.1 serves per person per day. Data suggests that recent price increases in fruit and vegetables and long off air periods have eroded some of the gains in fruit and vegetable consumption. Final evaluation data will not be available until mid 2010.
The campaign is reaching people in cities and surrounding areas (71% awareness) as well as regional and remote areas (75% awareness). Of those aware of the campaign, around 82% find the commercials personally relevant, including those from lower income and education groups. The biggest increase in knowledge of the recommended ‘5 serves of vegetables per day’ was amongst households earning less than $25,000 per year.
In Queensland the $4.4 million investment has already potentially saved $30 million a year in treatment services for people who would otherwise have developed diabetes, heart disease and other conditions.
SPOTLIGHT

Report of the Chief Health Officer Queensland
112
Prevention of Chronic Disease
Smart Choices – Healthy Food and Drink Supply Strategy for Queensland Schools
Offering healthy food and drink choices to students in Queensland schools is key to better nutrition of children, to providing an environment that supports a healthy lifestyle and to promoting healthy weight. Smart Choices is part of the Queensland Health and Department of Education, Training and the Arts (DETA) Joint Work Plan 2004-2007.
Consistent with the NHMRC Dietary Guidelines for Children and Adolescents,17 under Smart Choices foods and drinks are placed in three categories: green, amber and red.
Smart Choices is a new way of determining which food and drinks are able to be supplied in schools. The strategy applies to all situations where food or drink is supplied in the school – in tuckshops, vending machines, school excursions, school camps, fundraising, sponsorships, classrooom rewards, school events such as celebration and sports days, and food used in curriculum activities. The Smart Choices strategy became mandatory in all state school in Queensland on 1 January 2006.
In 2007 in Term 2, School Principals, P&C Associations and school tuckshop convenors in state primary and secondary schools participated in an evaluation of the strategy.
The preliminary findings indicate that schools:made significant efforts in a short period of time to •implement Smart Choices across all areas of food and drink supplysupported the rationale for introducing • Smart Choices took steps to engage the school community in •implementation.
A full report of the evaluation results on the implementation of Smart Choices in state schools in Queensland will be available in late 2008.
Healthy living group program – Lighten Up to a Healthy Lifestyle Program
Lighten Up to a Healthy Lifestyle Program is a two month group program developed by Queensland Health for adults at risk of chronic disease. The program promotes healthy eating, physical activity, self esteem, stress management and long-term weight management. The program comprises six two-hour group workshops and three individual appointments for measurements and goal-setting.
This successful program is now available in most Health Service Districts of Queensland Health, although accessibility of the program varies greatly. In 2004 the program was run in 20 Districts with 459 participants, 70% of whom were obese. As a result of these programs, participants:
doubled the minutes spent walking each week from •69 to 137 over two months, which was generally maintained for 12 monthsincreased their average intake of fruit and •vegetables by 0.4 serves of fruit and 0.6 serves of vegetables per day, which was generally maintained for 12 monthsincreased eating four or more vegetables daily from •21% to 51% increased self-rating of ‘good’ health from 43% to •69%lost an average 1.3kg, 3.7cm waist circumferance •and 0.5 units of BMI in 2 months. The average weight loss continued – 2.1kg at six months and 2.4kg at 12 months. At six months 67% had lost weight, 14% maintained weight and 19% gained weight.
Participants said‘Changed my way of living and thinking’
‘Given me the knowledge and ability to live a healthier life’
‘Helped lose weight, feel fitter, sleeping better’.
GREEN ‘Have plenty’ Encourage and promote these food and drinks in schools.
AMBER ‘Select carefully’ Do not let these foods and drinks dominate choices and avoid large serve sizes.
RED ‘Occasional’ Limit the availability of these foods and drinks to no more than two occasions per term.
SPOTLIGHT SPOTLIGHT

Report of the Chief Health Officer Queensland Prevention of Chronic Disease
113
5
Aboriginal and Torres Strait Islander Nutrition and Physical Activity Brief Intervention Program
For Aboriginal and Torres Strait Islander people a brief intervention program to provide advice and support for healthy eating and physical activity has been trialled in North Queensland. It is based on the SmokeCheck intervention (see spotlight above). Resources and training for health workers have been developed including a facilitators’ manual.
The training increased health workers self-efficacy, role legitimacy, confidence and skills in client engagement about conducting a nutrition and physical activity brief intervention.381 Following training;
26% were more confident in providing physical •activity adviceeveryone thought the training was useful, relevant, •organised and interestingeveryone said they would use the brief intervention •program at work.
In 2007/08 22 health professionals received training. These health workers are now conducting training in their Health Service Districts to implement and roll out the program across North Queensland.
The effect of the brief intervention on the healthy eating and physical activity of Aboriginal and Torres Strait Islander clients will be assessed in 2008/09, six months after the intervention.
SPOTLIGHT

Report of the Chief Health Officer Queensland
114
Prevention of Chronic Disease
Early life nutrition
Queensland Health supports the WHO and the NHMRC infant feeding recommendations of exclusive
breastfeeding for the first six months, the introduction of appropriate solid foods around six months of age and continued breastfeeding for at least 12 months.17 Queensland Health’s Optimal Infant Nutrition: Evidence Based Guidelines 2003-2008 reflects the department’s commitment to nutrition in the early years by encouraging intersectoral partnerships and identifying priority strategies.250
Queensland Health’s Child Health Information:Your Guide to the first 12 months booklet has been included in the Personal Health Record since 2003. It is given to every mother who births in Queensland and includes information to support breastfeeding and introducing solids. It has been translated into five different languages in fact sheets on the Queensland Health website.
In 2006 Queensland Health began a social marketing campaign, developed in partnership with the Australian Breastfeeding Association (Qld). The campaign particularly targets younger mothers of lower socioeconomic status and is focussed on the health benefits of breastfeeding for at least 12 months.
The Baby Friendly Health Initiative (BFHI) is an international project to give every baby the best start in life by creating a health care environment which supports and promotes breastfeeding. Queensland
Health supports this initiative by online education for staff and development of resources to assist facilities to become BFHI accredited. There are currently nine BFHI accredited hospitals in Queensland with many additional health facilities complying with the BFHI principles.
The expanding child health workforce has seen the optimal infant nutrition guidelines integrated into the development of relevant training courses and the Child Health and Youth Health Practice Manual. Resources such as Growing Strong Feeding You and Your Baby targeting Aboriginal and Torres Strait Islander mothers and families have been redeveloped to meet workforce and child health check needs.
There have been many improvements in early feeding practices across Queensland in the past five years:
Breastfeeding initiation has increased to 95% •- well above the national target of 90%.Rates of breastfeeding duration have also •increased, with infants fed at one and six months up 5.1% and 4.2% to 83% and 59% respectively, which is less than the 80% national target for six months. Whilst an encouraging trend was observed in •exclusive breastfeeding for the first six months, rising from 3% to 13%, this is well below Queensland Health’s target of 60%. Positive shift to delay the introduction of solids to •around six months, with far fewer infants receiving solids in the first three months of life.
SPOTLIGHT
Report of the Chief Health Officer Queensland Prevention of Chronic Disease
115
5
Physical activity ❚Physical activity is essential for physical and mental health and general well-being of adults and children. While overweight and obesity are a major result of insufficient physical activity, physical activity has many positive outcomes for individuals and communities. The amount of physical activity required for health benefit, as compared to fitness, has been nationally defined for adults as at least 30 minutes of moderate intensity physical activity on most days of the week,44 and for children and adolescents, 60 minutes of moderate to vigorous activity daily.382
Some individuals may choose more strenuous activities such as jogging or playing sport to increase their activity. However a more practical, but just as beneficial concept, is increasing ‘incidental activity’. That is, increasing the amount of walking undertaken on a daily basis through activities such as using stairs instead of lifts, walking to shops or bus/train stations rather than driving and reducing the amount of time spent being sedentary in front of a computer or watching television. In addition to physical inactivity there is a looming threat of increased population levels of sedentary behaviour or prolonged sitting time.
In 2008, 53% of the adult population aged 18-75 years in Queensland did sufficient physical activity for health benefit, with 28% reporting sedentary behaviour, that is sitting for an average of seven hours or more each day in the week.7 The prevalence of physical activity and sedentary behaviour is strongly affected by societal factors as well as individual choices. Changing individual behaviour is complex. Such behaviour change requires strategies to develop environments that support and are conducive of physical activity, are pleasant in which to be physically active and enable safe physical activity. The environments for physical activity are in the workplace, at home, at schools, in transport and in leisure time.
Interventions to increase physical activity in Queensland are described in a number of strategies including Eat Well Be Active – Healthy Kids for Life Action Plan 2005-2008,234 the work plan of the
Premier’s Eat Well Be Active Taskforce. In addition, Be Active Queensland 2006-2010,357 which was developed by the Queensland Public Health Forum, is built around active living – integration of physical activity into daily routines. The diversity of how individuals interact with their environments means that active living interventions should involve multiple strategies across a range of community sectors and settings. A Queensland cross government physical activity strategy is in development for 2008-2013, led by the Department of Sport and Recreation.
To increase physical activity and reduce sedentary or sitting behaviours in Queensland requires simultaneous action in multiple areas by many agencies, communities, business and individuals. Implementation of the strategies includes:
1. Laws and regulation: Laws and regulations for the creation and/or enhanced access to places for physical activity are made by state and local governments. Laws and regulations established through the transport sector (eg. Queensland Transport’s Interest in Planning Schemes – Planning for Movement Networks) and the infrastructure and planning sector can have significant impact on physical activity through incidental activity achieved through everyday transport, particularly active transport.
2. Tax and price interventions: Queensland Health advocates for the establishment of economic interventions to improve access to sport and fitness equipment and a wide range of activities that promote physical activity. Tax interventions can reward the industry and private sector for supporting actions that could increase physical activity e.g. funding based credits for developers that provide better access to public places for physical activity.
3. Improving the built environment: The built environment is crucial to physical activity and is the major focus of work to increase physical activity of Queenslanders. Features of residential areas that may affect physical activity include the distance a householder must travel to access
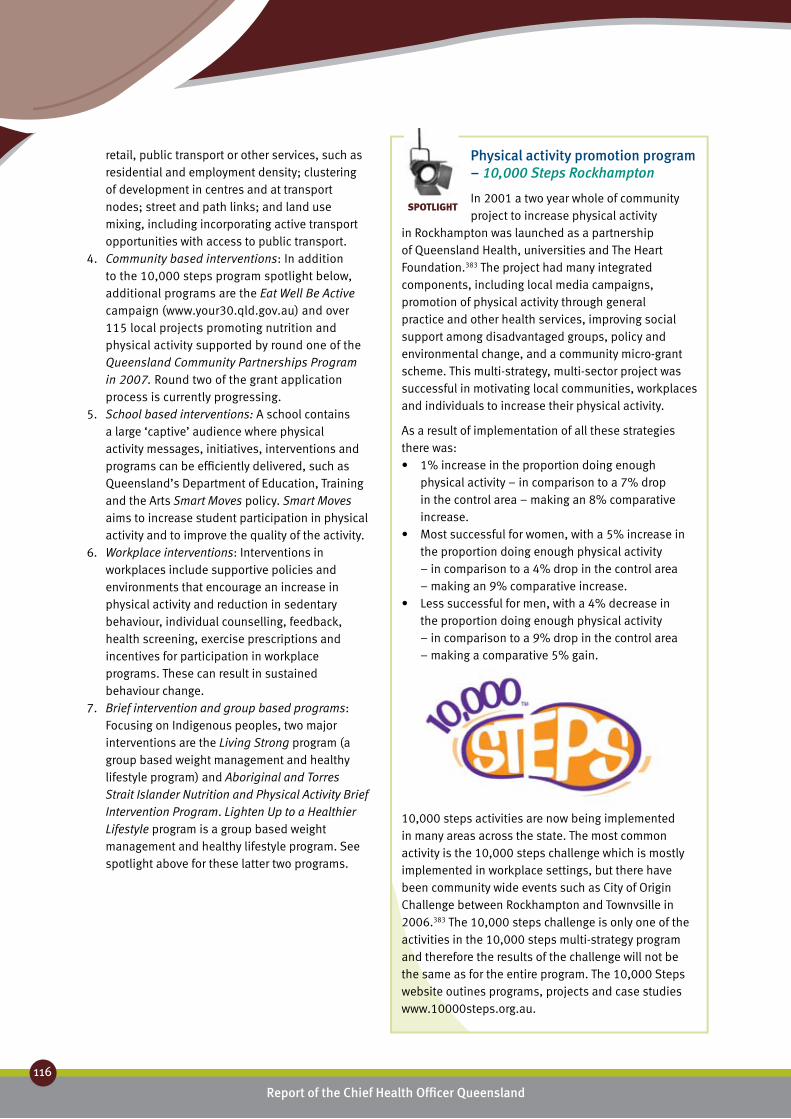
Report of the Chief Health Officer Queensland
116
Prevention of Chronic Disease
retail, public transport or other services, such as residential and employment density; clustering of development in centres and at transport nodes; street and path links; and land use mixing, including incorporating active transport opportunities with access to public transport.
4. Community based interventions: In addition to the 10,000 steps program spotlight below, additional programs are the Eat Well Be Active campaign (www.your30.qld.gov.au) and over 115 local projects promoting nutrition and physical activity supported by round one of the Queensland Community Partnerships Program in 2007. Round two of the grant application process is currently progressing.
5. School based interventions: A school contains a large ‘captive’ audience where physical activity messages, initiatives, interventions and programs can be efficiently delivered, such as Queensland’s Department of Education, Training and the Arts Smart Moves policy. Smart Moves aims to increase student participation in physical activity and to improve the quality of the activity.
6. Workplace interventions: Interventions in workplaces include supportive policies and environments that encourage an increase in physical activity and reduction in sedentary behaviour, individual counselling, feedback, health screening, exercise prescriptions and incentives for participation in workplace programs. These can result in sustained behaviour change.
7. Brief intervention and group based programs: Focusing on Indigenous peoples, two major interventions are the Living Strong program (a group based weight management and healthy lifestyle program) and Aboriginal and Torres Strait Islander Nutrition and Physical Activity Brief Intervention Program. Lighten Up to a Healthier Lifestyle program is a group based weight management and healthy lifestyle program. See spotlight above for these latter two programs.
Physical activity promotion program – 10,000 Steps Rockhampton
In 2001 a two year whole of community project to increase physical activity
in Rockhampton was launched as a partnership of Queensland Health, universities and The Heart Foundation.383 The project had many integrated components, including local media campaigns, promotion of physical activity through general practice and other health services, improving social support among disadvantaged groups, policy and environmental change, and a community micro-grant scheme. This multi-strategy, multi-sector project was successful in motivating local communities, workplaces and individuals to increase their physical activity.
As a result of implementation of all these strategies there was:
1% increase in the proportion doing enough •physical activity – in comparison to a 7% drop in the control area – making an 8% comparative increase. Most successful for women, with a 5% increase in •the proportion doing enough physical activity – in comparison to a 4% drop in the control area – making an 9% comparative increase.Less successful for men, with a 4% decrease in •the proportion doing enough physical activity – in comparison to a 9% drop in the control area – making a comparative 5% gain.
10,000 steps activities are now being implemented in many areas across the state. The most common activity is the 10,000 steps challenge which is mostly implemented in workplace settings, but there have been community wide events such as City of Origin Challenge between Rockhampton and Townvsille in 2006.383 The 10,000 steps challenge is only one of the activities in the 10,000 steps multi-strategy program and therefore the results of the challenge will not be the same as for the entire program. The 10,000 Steps website outines programs, projects and case studies www.10000steps.org.au.
SPOTLIGHT

Report of the Chief Health Officer Queensland Prevention of Chronic Disease
117
5
Cancer screening ❚The health burden caused by cancer is increasing as the population ages. Reducing the impact of cancer requires effective prevention strategies and early detection programs, including organised population-based screening programs. Population screening programs are based on the understanding that the earlier in their development most cancers or their precursors are detected and treated, the greater the likelihood of a better outcome. Population based screening has been shown to be effective in detecting early bowel, breast and cervical cancer and detecting precancerous changes of the bowel and cervix. These approaches rely on a systematic, organised approach to screen eligible, at-risk populations and the optimal use of effective and efficient treatment options.
In Queensland, screening programs are in place for bowel, breast and cervical cancer through BreastScreen Queensland, the Queensland Bowel Cancer Screening Program and the Queensland Cervical Screening Program. The goal of these programs is to reduce the incidence and mortality associated with these cancers and to improve the quality of life of patients and their families.
The target age group for the BreastScreen Queensland Program is women aged 50-69 years and screening is recommended every two years for women in this age group. Women aged 40-49 years and over 70 years are also able to access free BreastScreen Queensland Services.
The Queensland Cervical Screening Program recommends two yearly cervical screening for women
aged 20-69 years. The National Bowel Cancer Screening Program is being phased in, having commenced in August 2006.344 The current phase invites men and women turning 50, 55 and 65 years to participate in screening (see Queensland Bowel Cancer Screening Program spotlight below).
At a state level, gains in breast cancer survival have been achieved as a result of early detection through the BreastScreen Queensland Program and by increasingly effective treatment of disease. Death rates for breast cancer have been falling since 2000, with an overall decrease of 23%, and five year survival rates in the period 1996-2000 at an all time high of 87%.123 In 2004-05 the BreastScreen Queensland participation rate was higher than NSW and Victoria and the national rate, and had significantly increased in the preceding five years.102 In 2005-06, 57.9% of Queensland women in the target age group of 50-69 years were screened by BreastScreen Queensland. In general, participation rates for rural and remote locations (60.9%) are higher than metropolitan areas (55.8%).
Cervical cancer death rates in Queensland have fallen dramatically with a reduction by half in the last decade mostly as a result of the organised screening program. Participation rates in the Queensland Cervical Screening Program were lower than national participation rates and lowest of all the states and territories except Northern Territory in 2005-06.346 In 2005-06, 57.9% of Queensland women in the target age group had a Pap smear in the preceding two years with about 10% lower rates in areas of greatest socioeconomic disadvantage and remote areas.104

Report of the Chief Health Officer Queensland
118
Prevention of Chronic Disease
Queensland Bowel Cancer Screening Program
Bowel cancer is the most commonly diagnosed internal cancer in men and
women in Queensland, with 90% of new cases occurring in people over 50 years of age. Bowel cancer can be prevented or treated successfully if detected in the precursor or early stages. However, currently fewer than 40% of bowel cancers are detected early due to the lack of, or vagueness of symptoms.
International research has demonstrated that regular population screening with a Faecal Occult Blood Test (FOBT) can reduce the risk of dying from bowel cancer by up to one third.62 The National Bowel Cancer Screening Program commenced in Queensland in August 2006 following a successful pilot.384 It is the first population screening program in Australia to invite men to participate. The Queensland Bowel Cancer Screening Program is the state component of this Program that provides a statewide network of Health Promotion Officers and Gastroenterology Nurse Coordinators, and coordinates public sector colonoscopy provision. Phase one of the Program, which invited men and women turning 55 or 65 years of age, as well as people who were invited to participate in the Pilot, concluded on 30 June 2008. In July 2008, the eligibility of the Program was expanded to include men and women turning 50, 55 or 65 years in the period 2008 - 2010.
Eligible men and women are sent an invitation and immunochemical FOBT to complete. An FOBT is a simple, non-invasive test that can be completed in the privacy of the person’s own home. The FOBT can detect small amounts of blood in the bowel motion. Those participants with a positive FOBT result are then referred for further assessment, usually done by colonoscopy.
Between August 2006 and May 2008, 35% of eligible Queenslanders aged 55 years and 42% of eligible
Queenslanders aged 65 years participated in the Program. Between August 2006 and March 2008 Queensland Health had undertaken 1133 assessment colonoscopies for participants who had a positive FOBT result. Of these 71% (802) of people had a polypectomy, 59% (593) had a histopathological confirmed adenoma removed (pre-cancerous lesion); and 5% (57) had a histopathologically confirmed colorectal cancer.
To date, the Program has potentially prevented more than 593 bowel cancers. This successful Program has the potential to significantly reduce deaths from bowel cancer and the impact on individuals, their families and the health system of this disease.
SPOTLIGHT

Report of the Chief Health Officer Queensland Prevention of Chronic Disease
119
The function of protecting and developing health must rank even above that of restoring it when it is impaired – Hippocrates
The people of Queensland enjoy an outdoor lifestyle with world class beaches and waterways, national parks, rainforests and tropical reefs. The pleasant climate allows Queenslanders to enjoy more winter sunshine and warmth than most other Australian states. Queensland also produces an extensive range of nutritious foods including fruits and vegetables. The things that make for a healthy life are available in abundance in this state, and generally Queenslanders are healthy and take full advantage of what their state offers. Queenslanders are living longer and many are living healthier lives.
Despite this general good health, chronic disease poses a clear threat to health, the health system and the state. Chronic disease is a major health problem in Queensland that has grown in recent years. It is expected to get worse. It is not a new problem, neither is it specific to Queensland. The threat has two characteristics: chronic diseases are very common and once developed they persist.
As people age the effects of weight gain, smoking, inactivity, too much alcohol, stress and poor nutrition begin to impact on their health. Diabetes or heart problems develop; respiratory diseases such as emphysema, and other health problems of ageing such as arthritis start to emerge. Feelings of wellbeing and vitality slowly decline. Expectation of disease builds. Close friends or family are diagnosed and sometimes die of cancer. Occasionally there is a death from heart disease or stroke, and tragically a person commits suicide. A visit to the GP produces a stern rebuke on weight gain, cholesterol tests are ordered, various medications prescribed, advice is given to ‘cut down on fats, get more exercise and definitely stop smoking’.
Our modern lifestyles are more sedentary than our parents’ and grandparents’ lifestyles. Meanwhile energy dense, nutrient poor food is readily available and healthy food often more expensive and perceived as being less convenient for quick snacks or meals in a hurry. Chronic stress is common, some of us smoke and some drink too much alcohol. The consequences of these habits affect people immediately and long after they started.
Obesity levels are rising, the public are concerned about children getting fatter, spending too much time in front of the computer or TV, and not getting enough exercise. And at the same time junk food ads dominate children’s viewing time. Excessive drinking in teenagers and young people is recognised as a national problem.
And so the problem of chronic disease continues to take its course.
Tackling this problem requires understanding how to prevent chronic disease, which includes exposing a few common myths. Although it is a myth that chronic disease is a problem only for older people, the burden is certainly greater in older people. Added to that, increasing numbers of people are moving to Queensland making it the fastest growing state in the nation. More people means greater demand for health and other services.
The flow on effect to our public health system is devastating. Regardless of increasing funding, doctors, nurses and other health professionals and infrastructure struggle to meet demand.
Increasingly effective medical treatments result in survival where once death was more common. Chronic diseases are long lasting and in most cases there is no expectation of full recovery. As a result, more people need treatment and support to manage their disease. Pressure builds in the health system - more and more
Challenges and opportunities
Key Challenge 1 – Make prevention of chronic disease everyone’s business ❚
Key Challenge 2 – Make prevention a key to reducing health inequality ❚
Key Challenge 3 – Make healthy weight a priority ❚
In th
is c
hapt
er:
c h a p t e rs i x
Report of the Chief Health Officer Queensland
120
Prevention of Chronic Disease
resources are needed to treat and manage the health problems of Queenslanders. The bathtub of prevalent cases of chronic disease is filling rapidly, as described in the Introduction to Chapter 2: Chronic disease.
As the pressure on the health system and community builds so does the need to focus on prevention. In fact something like 30% of all premature deaths are avoidable through stopping the onset of disease and another 30% could have been avoided through accessing earlier and better health care – early detection, improved treatments and management of disease.
There is a growing awareness among health professionals, in government and parts of the wider community about the increasing levels of chronic disease. The impact of this problem on the health system is known within the health sector and among health professionals generally, but not necessarily more broadly. The effects are more commonly solely attributed to lack of resources without consideration of the unrelenting and increasing demand for services.
What are the challenges and opportunities to prevent chronic disease in Queensland?The social and economic environment is the most powerful determinant of health of the population.18 Thus the challenges confronting the health care system are not going to be solved by focusing only on solutions within health services.206 Health is more than health care.
There are significant challenges to preventing chronic disease and to reducing the threat of chronic disease on the health and quality of life of Queenslanders and on the state economy. To prevent chronic disease we must harness the collective capacity and energy of families, communities, health care professionals, voluntary and professional organisations, the private sector, all levels and sectors of government and academic institutions.45
Robust evidence is critical to mobilising health action and addressing the prevention challenges. Defining and describing the problem is fundamental to finding a solution. Ultimately preventing chronic disease is dependant on translating strategic investment into practical solutions, consistent with the goals and aspirations of the target population. This must be
guided by epidemiological evidence (what and •where are the problems, what causes them and are they changing)
based on intervention evidence (what works in •specific circumstances and evaluation of whether it did work).
Preventing chronic disease means facing a complex set of challenges. Three interrelated challenges may hold the key to success:
1. Make prevention of chronic disease everyone’s business.
2. Make prevention a key to reducing health inequality.
3. Make healthy weight a priority.
Chronic disease myths and facts:1. Chronic disease is a problem only for
older people: 30% of chronic disease impact affects people aged less than 45 years and 58% below 60 years. But the burden is greater in older people.
2. Individuals are to blame for their unhealthy lifestyles: To be held fully responsible for one’s own health, the individual needs the social and economic resources to access and make healthy choices, access to services to help change behaviour and the knowledge and assistance to build a healthy life. This includes children who have no choice about their environment and those less able to understand the long term consequences of their actions.
3. Chronic diseases are rich people’s problems: Chronic disease affects us all, but has its most damaging effects on those who are disadvantaged - poorer, less educated, unemployed or marginalised.
4. Disease and disability are inevitable and can’t be prevented: The major causes of many chronic diseases are known and preventable. If tobacco smoking was eliminated, overweight and obesity levels reduced, poor diets improved, and other key risk factors reduced, about 70% of cardiovascular disease, 60% of diabetes and over 30% of cancers could be prevented.29

Report of the Chief Health Officer Queensland Prevention of Chronic Disease
121
66
Key challenge 1 – ❚ Make prevention of chronic disease everyone’s business
In recent times the message about the preventability of chronic disease has begun to gather force. Similarly the urgency of the situation is also gathering momentum. In 2008, the federal government set up a Preventative Health Taskforce to address this key issue and advise the government as it addresses the challenge nationally. In 2005 the Queensland government passed tough smoking laws which made it illegal to smoke in public places - the first state to take such a comprehensive approach. The supply of healthy food and drinks became mandatory in Queensland government schools in January 2007 and in Queensland Health facilities in September 2008. Smart Moves – Physical Activity Programs in Queensland Schools becomes mandatory by December 2008. In 2008 fluoridation of Queensland’s water supply will commence and be rolled out over a three year period. In August 2008 the Queensland Government outlined five key challenges we need to tackle if Queenslanders are to become the healthiest in Australia.385 The prevention agenda is gathering strength.
While there has been significant policy change in Queensland in the last couple of years, and leadership more recently at a national level, the question remains. What will it take to have real impact on the problem of chronic disease in Queensland, to reduce the life expectancy gaps within our state, to reduce avoidable demand on the hospital system and to improve the health of the people of this state, not just treat disease?
The case for prevention of chronic disease has been described in detail throughout this report and earlier reports both nationally and within Queensland. The same message has been forcefully put by the World Health Organization, recognising that the chronic disease crisis is a global challenge. The success of past and current population health approaches has been demonstrated in downward trends of many diseases and chronic disease risk factors in Queensland over the recent decade. Cardiovascular disease rates are declining largely due to control of risk factors such as high blood pressure, cholesterol and smoking. The rates of many cancers are declining, due to reduction in smoking rates or early detection of
cancers through population screening programs. Our experience in this state and evidence nationally and internationally gives us confidence that we have the solutions within our grasp.
These gains have been achieved through evidence based strategies and interventions at a population level, supported by a limited allocation of the health budget towards prevention. To effectively turn the tide of chronic disease, prevention will need to become a priority and long term initiatives put in place to tackle smoking, poor nutrition, physical inactivity and alcohol misuse and their determinants.
Prevention of chronic disease needs to be a priority both nationally and in Queensland. While a reorientation of the national health care system is needed to adopt a prevention agenda, a whole of society approach is needed to prevent chronic disease through changes in lifestyle behaviours.206 In Queensland a funded universal prevention strategy is needed now and it needs to be comprehensive. It will include an integrated suite of strategies involving:8
laws and regulation•tax and price interventions•improving the built environment•advocacy•community based interventions•school based interventions•workplace interventions•screening•brief intervention and group based programs. •
A universal chronic disease prevention strategy requires leadership and action of both the Queensland and federal governments well beyond health departments, supported by partners in the health sector, and in partnership with industry, business and communities. Families and individuals will need to be supported to make positive behaviour changes to preserve their most precious asset - good health. The Australia 2020 summit determined an ambition that ‘By 2020, Australia will have Health policy focused on prevention – not only within health, but across Government and the whole community’.76 Prevention needs to be everyone’s business. In so doing Queensland will become a leader in promoting and protecting health, as well as a provider of quality health care.
There are clear imperatives for policy reform and further investment for the prevention of chronic disease in Queensland. Strong evidence indicates that sustained investment in these initiatives, including the work

Report of the Chief Health Officer Queensland
122
Prevention of Chronic Disease
force required for implementation in communities across Queensland, will achieve gains in the health of Queenslanders integral to ‘making Queenslanders Australia’s healthiest people’; an ambition of the State Government’s 2020 vision, Toward Q2: Tomorrows Queensland.
ObesityHalting and reversing the rise in overweight and obesity in Queenslanders of all ages will require significant and wide reaching action and investment. While there is more to learn about how to reduce overweight and obesity, this must not stop us acting now – we must act on the basis of what we already know, follow the best advice and evidence available and learn by doing. Evidence informed interventions include:
massive scaling up of physical activity and healthy •eating programs in early learning centres, schools, and workplacestotal ban on junk food advertising to protect •children and others from inappropriate marketing of unhealthy foods and beveragesincreasing the frequency, reach and intensity of •social marketing campaigns to encourage healthier food choices and increased physical activity in all social groupsincreasing policy and accreditation supports for the •promotion of health in childcare facilities and early learning centres strengthening implementation of • Smart Choices and Smart Moves programs in all Queensland schoolsincreasing availability, affordability and •accessibility of healthy foods, especially improving access to healthy food at reasonable prices in remote and Indigenous communitiesenhancing programs and infrastructure to promote •active forms of transport including cycling and pedestrian infrastructure and promotion of travel behaviour change programs such as TravelSmart in schools and workplacesaltering obesity-promoting environments so that •they offer many more opportunities to be active, including provision of end-of-trip facilities and opportunities for incidental physical activity such as stairwell access delivering workplace health promotion programs in •all state government departments and incentives developed to encourage private industry to support evidence based workplace health promotion programs
planning policies which consistently consider •the physical, social and mental health aspects of Queenslanders healthuse of Health Impact Assessment as a tool to inform •planning and decision makingincreasing the use and support of the primary •health care sector to provide community education and advice about nutrition, physical activity and the management of overweight and obesity, including providing an appropriately skilled workforcedeveloping a national food strategy which •integrates food safety, food production, agricultural policy and addresses issues with climate change to ensure a safe and sustainable food supply in Australia.
TobaccoWhilst there have been many gains in tobacco control over recent years, much more remains to be done. Queensland’s multi-strategy plan for tobacco smoking could be enhanced through a range of interventions which include:
higher tobacco taxation•total ban on tobacco product displays at retail •outlets every health professional asking and recording •patient smoking status, providing immediate advice that the best thing for improved health is to not smoke, and following with assistance or referral to Quitline (13 QUIT)increasing the frequency, reach and intensity of •social marketing campaigns to discourage smoking in all social groupsincreasing the availability of nicotine replacement •therapy (NRT)a multi-strategy effort to tackle smoking among •Indigenous people including enhancing Quitline to provide more culturally sensitive services and NRT, expanding the SmokeCheck program, exploring innovative strategies targeting specific groups such as young people and pregnant women, and working with communities to promote and enforce smoke-free environmentsimplementing strategies specifically aimed at •reducing smoking amongst pregnant womenincreasing the multi-strategy effort to reduce •smoking in young people and socioeconomically disadvantaged peopledelivering additional and tailored • Quitline services including a telephone-based quit smoking course with subsidised NRT.
Report of the Chief Health Officer Queensland Prevention of Chronic Disease
123
66
AlcoholThere is strong evidence that substantial reductions in alcohol-related health and social costs could be achieved by implementing, or improving the implementation of, a range of interventions which include:
higher alcohol taxation•total bans on alcohol advertising and other forms of •promotion for example in relation to sportsstronger measures to reduce drink driving, •including more intensive enforcement of random breath testing and lowering the legal blood alcohol concentration level increasing restrictions on the sale of alcohol •through reducing density of supply outlets in particular in disadvantaged areas, reducing outlet opening hours including pubs and clubs, and continuing the prohibition of the sale of alcohol in supermarketsscaling up of interventions by health care •professionals to reduce hazardous alcohol consumption, including significant enhancements to telephone-based counselling.
Prevention – an urgent priorityWhen we measure our nations health, by the length of life or by the quality of that life ... we cannot afford to ignore the urgency of chronic disease45
The Queensland population is growing and ageing. It is projected to double over the next 50 years (to 8 million people in 2056) and to grow older (from an average age of 36 years in 2006 to 44.6 in 2056). In 2007, there were:
0.5 million people aged 65 years and older – that is •one in eight people55,000 people aged 85 years and older – or 11% of •those aged 65 years and older.
In 2056 there will be:2 million people aged 65 years and older - one in •four people500,000 people aged 85 years and older – or 25% •of those aged 65 years and older.
More people generally and older people specifically means rapidly increasing pressure on health services in Queensland. Added to this, we live in environments that promote obesity – described as ‘obesogenic’ environments – which are characterised by;
increased dependency on cars reducing physical •activity built environments that don’t support active living •increased advertising and access to high energy, •nutrient poor foods and drinksincreased costs of healthy food•increased reliance on television and internet for •communication and entertainmentoccupations which impose sedentary behaviours.•
As a consequence, the chronic disease burden is projected to increase by 22% in the next decade. For Type 2 diabetes there will be a 55% increase in disease burden by 2016. By 2031, 600,000-700,000 Queenslanders are expected to have Type 2 diabetes. Fundamental to this increase in diabetes burden is the 45% increase in obesity in adults in the past seven years. Without successful intervention the obesity prevalence is projected to double to 1.4 million obese Queenslanders by 2025.3 Furthermore over the next 20 years the number of hospitalisations is expected to double, with the number increasing 2.7 times for diabetes and four times for renal failure.
However as hospitalisations for diabetes doubled over the past seven years (from 7200 per year to 15,000 per year) these projections may well be an underestimate. Of note, since 2000, the rate of increase in hospitalisations in Queensland has been about double the rate of population increase – there was a 25% increase in the number of hospitalisations while in the same period the population grew by 15%.
The impacts of such changes on health systems are demonstrated in hard facts:
National health spending by government as a •proportion of GDP is projected to double between 2002-03 and 2044-45 from 5.7% to 10.3% with similar changes in state spending predicted.386 This does not include other health spending including out of pocket expenses. In 2006-07 total spending on health was estimated •to be 9% GDP. In South Australia it is projected that ‘… by 2042, without significant change to the health system the entire State budget could be consumed by the health care sector’.75 While similar analyses have not been done for Queensland, the overall magnitude of the outcome is likely to be the same.
This report demonstrates that epidemiological evidence supports the need for prevention. There is also a strong economic rationale of cost savings associated with specific diseases for both the broader economy in
Report of the Chief Health Officer Queensland
124
Prevention of Chronic Disease
terms of the current impact on workforce costs and lost productivity, and welfare provision; economic impacts for families and individuals including reduced quality of life. These are in addition to the health care system costs discussed in this report. Significant savings can be made through investment to change lifestyle behaviours and prevent chronic disease.386
Such a strategy will deliver reduced burden due to ill health in the population as well as economic benefits as there will be fewer people with disease and thus fewer people needing treatment. In contrast, a strategy of investment primarily targeted at improving the treatment of chronic disease while likely to initially reduce the disability burden of the population, will only be achieved by increasingly higher health spending as there will be increasing numbers of people with disease resulting in more people needing treatment.386 This principle has been described in greater detail in the bathtub analogy in Chapter 2: Chronic disease.
In 2006-07, 1.8% of the recurrent $87 billion of national health care spending was spent on public health activities to protect health and prevent disease and injuries before they occur. This relative investment has remained effectively static over time. The dominance of treatment services over prevention, promotion and protection appears to have grown during the era of modern medicine and is now seen as a pressing problem by public health agencies nationally and internationally.72 There is therefore an urgent need to balance the investment in health in Queensland.
Prevention – a priority for governmentThere is now compelling evidence that Australia will reap considerable health, social and economic benefits from making disease prevention and the promotion of lifelong social, mental and physical wellbeing a much higher priority206
A whole of government approach is required for the prevention of chronic disease. Leadership at the highest levels of government is fundamental, as is accountability of all government departments for chronic disease prevention at Cabinet level. New initiatives are required each year to contribute to chronic disease prevention including contestable incentive funding that government departments can apply for.
Healthy public policy will remove obstacles to the adoption of healthy lifestyles and is critical to the creation of physical and social environments that are
supportive of adopting healthier lifestyles. To make Queenslanders the healthiest in Australia46 we must harness the capacity and influence of all levels of government – local, state and national – and all sectors of government – health, housing, treasury, education, transport etc. The Queensland Government’s 2020 vision for the state includes bold targets.46 These include cutting obesity by one third, similarly smoking, risky drinking and unsafe sun exposure. Achieving these targets will be a challenge. While there has been a downward trend in tobacco smoking over the past decade, obesity rates have increased and there has been no improvement in alcohol consumption. Currently about six in 10 adult males are overweight or obese. By 2020 two of these will need to have moved into the healthy weight range. About one in six smokes daily. By 2020 the target is to reduce this to about one in 10. There has been no improvement in alcohol consumption over the last decade, yet to meet the target of about one in 12 people being risky drinkers, successful intervention strategies will need to be implemented more comprehensively and systematically. Improving sun safe behaviours is an ongoing challenge.
Queensland has taken bold steps in recent years to address lifestyle factors through legislation. The introduction of tough laws on smoking in public places in 2005 was followed by a 2.6 percentage point reduction in smoking prevalence in Queensland between 2004 and 2007.26 ,215 This represents a 13% reduction in three years, and was unmatched by any other state or territory. This decline is equivalent to about 87,000 fewer smokers in Queensland, taking into account population growth.
The evidence from research shows that parents want to see junk food advertising removed from children’s television viewing time. However, until recently no government has addressed this issue. In 2008 the Queensland government has announced its intention to protect young children and families from such pressures. The government has recently sought the views of Queenslanders about restricting television advertising to children to support families to make healthier choices.
The Queensland Government has allocated over $150 million towards the implementation of the Queensland Strategy for Chronic Disease 2005-2015 to prevent and better manage chronic disease and avoidable hospital admissions. Its focus is on the promotion of healthy lifestyles to prevent or reduce illness from

Report of the Chief Health Officer Queensland Prevention of Chronic Disease
125
66
chronic disease, earlier identification of disease and better management of existing conditions.5 Already a number of key achievements are changing the way in which chronic disease is prevented and managed in Queensland. Chapter 5: Prevention works describes some of these.
Achievement towards ‘Making Queenslanders Australia’s healthiest people’; an ambition of the State Government’s 2020 vision, must be monitored. The whole of government approach requires public accountability for achievement against performance measures with clear targets at outcome level and at a departmental level specific to their contribution.
Prevention - a priority across the health sectorThe early prevention and better coordinated management of chronic conditions will require changes in methods of financing and paying for health care, inspired and supported by strong leadership from our politicians387
In addition to treating disease and helping prevent or slow disease progression, doctors, nurses and all other health care providers play a critical role in prevention. This includes providing chronic disease risk assessment and early diagnosis, and promoting population screening services. They are also uniquely positioned to influence their patients and other people to adopt healthy behaviours that help prevent chronic disease.
An objective of the Queensland Strategy for Chronic Disease 2005-2015 is to ensure prevention is built into every episode of care for people with a chronic disease or at risk of such a disease. Inclusion of prevention into every episode of care can take multiple forms. A visit to a health practitioner could lead to provision of an appropriate brief intervention such as SmokeCheck; a health screen such as a Pap smear; or a referral to a healthy lifestyle program such as Lighten Up to a Healthy Lifestyle or Quitline. The Prince Charles Hospital Healthy Messages Project builds on clinicians’ capacity to deliver healthy messages brief intervention as part of embedding health promoting messages into the core duties of clinical staff and within clinical pathways.
General practitioners in particular play a role in providing chronic disease risk assessment and early diagnosis, and promotion of population screening services. In Australia over the past decade the role of Divisions of General Practice has grown along with initiatives funded under Medicare such as the Chronic Disease Management program. Some of the Medicare items associated with this program are described
in this report and include the Healthy Kids Check to ensure that every four year old child in Australia has a basic health check,331 a diabetes healthcare check, a health care check for people 45-49 years, a health care check for Indigenous people332 and a health check for older people.342 The effectiveness of these and other preventive services in this setting to achieve measured improvement in the health of the population is yet to be determined.355,356
In future GP Super Clinics, as described in the $2 billion Health and Reform Plan of the federal government, must be sufficiently resourced and scoped to provide targeted prevention services delivered within local communities. This model potentially has the capacity to undertake chronic disease risk assessment and early diagnosis, brief intervention and group based programs as described in the suite of strategies needed to effectively address the chronic disease burden by WHO.8
Prevention - the role of business and industryIndustry has a significant role in prevention of chronic disease in its role as supplier of goods and services, marketer and employer. As well as the economic incentives to reduce health care expenditure, there is growing evidence of reduced participation in the workforce by people with chronic disease as well as reduced productivity when they cannot fully function at work, or have higher rates of absenteeism because they are unwell. Reduced functioning at work has a substantial, negative impact on the Australian economy. In 2005-06, it was estimated that reduced productivity of people at work cost the Australian economy $25.7 billion, or nearly four times the cost of absenteeism.388
While the economic impact of chronic disease on productivity has been estimated, it is likely that many workplaces and work settings are also part of the ‘obesogenic’ environment and directly contribute to the threat of chronic disease. For example in 2008, Queensland adults were spending on average five hours per day on weekdays doing low energy activity such as sitting or driving a car, with one third sitting for seven hours or more. Workplace programs to improve physical activity and offset sedentary behaviour are necessary and effective. The 10,000 steps activities are now being implemented in many areas across the state. The most common activity is the 10,000 steps challenge which is mostly implemented in workplace settings.383
Report of the Chief Health Officer Queensland
126
Prevention of Chronic Disease
Smoking in the workplace has significant economic and health implications. Quit smoking … for life! is a workplace smoking cessation initiative of Queensland Health designed to support staff who are ready to quit smoking. The program is an important component of the Queensland Health Smoking Management Policy which was introduced in July 2006 and has three components including smoke-free environments, and brief intervention and nicotine replacement therapy for hospital inpatients and staff.
Food supply and practices in workplaces affect food choices at work, and beyond. In Queensland Health facilities, A Better Choice – healthy food and drink supply strategy became mandatory on 1 September 2008.
Implementation of healthy lifestyle interventions across both public and private sector workplace settings is a challenge but a critical part of a comprehensive prevention strategy.
Prevention – it begins with familiesThe conditions of everyday life have a big impact on whether people are healthy or unhealthy. The origins of health begin during gestation and probably earlier and continue through infancy and the early years of development. The family provides the nurturing environment, physical, economic and social supports as the child grows and develops. Chronic disease develops over the life course and is influenced by the family setting. Furthermore having a chronic disease can reduce a person’s ability to participate fully in the social life of their family and community, which over time can lead to social isolation. This in turn can affect their employment opportunities, income and that of their family members and carers.
Prevention – take charge of your healthIndividual responsibility can have its full effect only when individuals have equitable access to healthy life, and are supported to make healthy choices – WHO 20058
There is an individual component in the prevention and management of chronic disease. Individuals need to take responsibility for changing behaviours that increase the risk of developing chronic disease. However, chronic disease prevention cannot be achieved by focusing exclusively on the poor health behaviours and risk factors of individuals. A person’s understanding of their health and capacity to change behaviour is shaped by their social histories and circumstances. Additionally the role of a supportive community must be recognised when working with individuals and groups.204
Prevention of chronic disease is everyone’s businessLeadership at the highest level of government is needed to address this complex, multifaceted problem. All sectors of society and all levels of government need to be involved if the urgent and growing threat of chronic disease is to be contained and ultimately reduced. A prevention strategy for this state will involve universal access to appropriate services to change behaviours, built environments and child care, school and workplace settings that support healthy living. Specific strategies are needed to address the special needs of some population sub-groups such as the disadvantaged, Indigenous people and those in remote communities, as well as the most vulnerable: infants, children and older people.
The potential benefits are great:206 improved health and wellbeing across the population, narrowing the health divide, significant benefits to the broader economy, reduced or contained health care costs freeing resources for other needs and goals within this state. The international evidence on what works is growing; we have early successes in Queensland; the national agenda is shifting towards prevention and there is growing support in the community for such a shift of focus. Prevention of the threat of chronic disease can be achieved.
Report of the Chief Health Officer Queensland Prevention of Chronic Disease
127
66
Key challenge 2 – ❚ Make prevention a key to reducing health inequality
Health is a universal aspiration and a basic human need. The development of society, rich or poor, can be judged by the quality of its population’s health, how fairly health is distributed across the social spectrum, and the degree of protection provided from disadvantage due to ill-health – Sir Michael Marmot. WHO Commission on Social Determinants of Health389
The health of many Queenslanders is good and continues to improve. People are living longer, many are taking positive action to preserve their health and build vigorous healthy lives for themselves and for their families. Yet good health is not enjoyed by all. Differences in health occur across many population groups in Queensland; most notably between non-Indigenous and Indigenous people, between those with greater socioeconomic advantage and those with less, and between those living in cities and those living in remote areas. These differences are described throughout this report.
Health inequalities are differences in health status (such as rates of illness and death or self reported health) that result from social, economic and geographic influences that are avoidable, unfair and unnecessary.390 There are three dimensions to health inequality:
1. Inequality of access to healthy choices and services that support health and wellbeing (due to cost, remoteness, services that are not culturally appropriate etc).
2. Inequality of opportunity which refers to the social and economic resources necessary to achieve and maintain good health such as quality education, secure employment and income, safe housing and a supportive environment in which to live. Lack of material resources directly impacts on health. However, health inequalities may also result in psychological and social conditions which further exacerbate poor health outcomes. For example, poor education, unemployment and low income can lead to social isolation and feelings of exclusion from the mainstream community.
3. Inequality of impacts and outcomes due to differences in health status between groups (gender, age, Indigenous people, people with
disabilities, newly arrived refugees etc). It is important to measure health outcomes in order to monitor health and wellbeing and intervene where required to benefit all groups in the community.
Closing the life expectancy gap between Indigenous and non-Indigenous people is a priority of the Australian government. Addressing health inequality is also a priority of the Queensland government. So the questions are: How can the gap between the health advantaged and the health disadvantaged be closed? Can prevention be a key to reducing health inequality?
How serious is health inequality in Queensland?The largest difference in health status in Queensland •is between Indigenous and non-Indigenous people. Life expectancy for Indigenous people is 17.7 years less for males and 19.4 years less for females compared to that of all Queenslanders. In addition there is a further loss of 12.8 years of healthy life for these people due to living with disabling and mostly chronic conditions.For those in areas of socioeconomic disadvantage, •there is a gap of about four years of healthy life compared to those living in advantaged areas.People in remote areas experience about 5.6 less •years of healthy life compared to those in major cities.Around 17% of the total burden of disease and •injury in Queensland is due to socioeconomic disadvantage. To put this in perspective, this is around the same as the burden due to cardiovascular disease or cancer, and equates to some 1702 premature deaths a year. Lower life expectancy for socioeconomically •disadvantaged and Indigenous populations is largely due to higher rates of many chronic diseases.Rates of avoidable deaths and hospitalisations are •about 50% higher among people living in areas of socioeconomic disadvantage than those in advantaged areas. Disadvantaged people rate their health more poorly •and report higher levels of psychological distress.
Is prevention a key to reducing health inequality?Many Queenslanders could enjoy three to six more years of healthy life if the rates of ill health were the same throughout the state. This equates to the gains made in average life expectancy since the early 1980s.
Are we heading for a similar situation to that of USA? In the midst of life expectancy improvements over the past

Report of the Chief Health Officer Queensland
128
Prevention of Chronic Disease
40 to 50 years in the USA, there was initially a narrowing of the health divide, that is the difference in health status between the advantaged and disadvantaged. This narrowing has more recently been reversed, with stagnation in health outcomes for those most at disadvantage.391 That is, there has been a ‘reversal of fortune’ for the disadvantaged since the 1980s.
The level of preventable risk factors for chronic disease is predictably much higher in those populations and areas of Queensland which have the highest rates of chronic disease. People in socioeconomically disadvantaged areas, people living in remote areas and Indigenous people are more likely to smoke, drink alcohol to harmful levels, are more likely to be overweight or obese, more likely to be physically inactive, have poorer nutrition, and are less likely to breastfeed than people in socioeconomically advantaged areas. Reduction in risk factor levels in populations which have the poorest health in Queensland will substantially reduce the divide between those with the best health and those with the worst.
Gains in life expectancy and quality of life over the past century have been largely due to population health interventions to prevent ill health of all the population using population health approaches, rather than reparative care provided by the health system.
Population health interventions are characterised by attempts to address the diversity of risk and protective factors that impact on the health of the community, including health behaviours, community capacity, and the environmental and socioeconomic impacts.94 Some of the strategies used to achieve population level health outcomes and benefit everyone in the community include:
policy, legislation and regulation (e.g. public •smoking bans, drink-driving laws, school food supply policies)social marketing and health promotion (e.g. alcohol, •tobacco, nutrition and physical activity campaigns)environmental protection (e.g. safe food and water •supplies)organisational and community development (e.g. •provision of public housing)disease surveillance and control measures (e.g. •Immunisation and population screening).
Chronic disease prevention can no longer be addressed by focusing exclusively on poor health behaviours and risk factors. We need to understand and modify the ways in which the social and physical environment
in which we live affects our decisions and the health behaviours in which we engage.
What do we need to do?Prevention is indeed a key principle in our determination to reduce health inequality. Health behaviours are not randomly distributed in the population and an individual’s risk of illness cannot be considered in isolation to their social and economic status. The greatest improvements in population health are now being derived from answering the question ‘why does this population have this particular distribution of risk?’ and targeting interventions appropriately.392
Inequality and its causes are complex. To reduce health inequalities it is critical that we understand that how we organise our society and how we live our lives is the result of not just individual action but also of activites across government, in businesses and communities. For an individual to be held fully responsible for these individual actions, a person needs the social and economic resources to make healthy choices, access to services to help change behaviour and the knowledge and assistance to build a healthy life.
Future investments must be based on evidence based principles. Although population health measures benefit everyone in the community, one of the potential challenges of such approaches is that highly educated and resourced individuals tend to demonstrate greater uptake of good health messages and opportunities compared to disadvantaged people.24,393 Available research reinforces the need to integrate the Ottawa Charter394 principles in developing population health initiatives that address inequality in health.24 These principles are:
Build healthy public policy so that health is on the •agenda of policy makers in all sectors and at all levels.Create supportive environments as people and their •environment are inextricably linked.Strengthen community actions in setting priorities •and partnering in initiatives. Develop personal skills to help people exercise •more control over their own health and to make choices conducive to health.Reorient health services towards the promotion •of wellbeing beyond responsibility for providing clinical and curative services.
Prevention strategies need to recognise the specific needs of the target populations. Due to the risk of

Report of the Chief Health Officer Queensland Prevention of Chronic Disease
129
66
unintentionally increasing disadvantage with whole of population approaches, prevention strategies to reduce health inequalities need to include targeted interventions that address both the economic and social needs of disadvantaged groups.24 According to the Queensland Council of Social Sciences (QCOSS), in order to design population level interventions that will be effective for disadvantaged groups, we need to ‘develop an understanding of the lived experience of disadvantage and the multiple factors that impact individual choice and health related behaviours’.24
We have good examples of effective interventions. The QCOSS report24 found that effective population health interventions targeting disadvantaged groups have been underpinned by common elements operating at three levels: the individual level, at community level and at service provision level. A number of current population health interventions that effectively target disadvantaged Queenslanders have been identified-see box below.
Population health prevention strategies are applied throughout the life course and certain life stages are recognised as particularly susceptible periods when the influences of inequality are more pronounced. Research has shown that overall health in middle and late adulthood is shaped by socioeconomic conditions experienced during childhood, and from the accumulation of instances of disadvantage over an individual’s lifetime.395
Inequalities begin in childhood. A national quality framework for early childhood education is currently under discussion.396 There is now extensive evidence supporting the value of quality early childhood education and care with respect to such skills as language and school readiness. While all children benefit, positive outcomes are particularly demonstrated in disadvantaged children. Historically,397 Australia’s investment in early education has been well below the OECD average, and so increased funding and commitment could have significant impacts for children not just in the short term but also by reducing health inequalities and their impacts on health outcomes in later life.
Defining, measuring and monitoring inequality is important. Unless health inequalities are monitored in Queensland we do not know whether interventions are effective and we do not know if they are narrowing the gap or actually widening the gap in health inequality. Therefore it is critical to develop a suite
of indicators to monitor health inequalities. It is also critical to routinely collect, analyse and report such information.398
Prevention is a key to reducing health inequalityGovernment and other agencies are clearly focussed on reducing the gap; underpinned by wide public support. It is clear that many major drivers of population health and health inequalities are not the direct responsibility of the clinical and curative services of health departments.399 Queensland Health therefore works in partnership with other government and non-government agencies to improve the circumstances and health of all Queenslanders. Furthermore, there is investment in a range of programs across government which will improve the determinants of health among those most disadvantaged in Queensland. Ensuring these investments are ongoing and effective and that there is effective monitoring of health outcomes of those at greatest disadvantage is critical to reducing health inequality in Queensland.
Population health interventions identified by QCOSS that effectively target disadvantaged Queenslanders:24
For women living in rural and remote areas – the •Rural and Remote Women’s Health: Royal Flying Doctor Service which aims to combine primary medical care with both prevention and health promotion service delivery.For disadvantaged young people – the Brisbane •Youth Service provides an extensive range of outreach, referral and follow-up support services to homeless and disadvantaged youth.For Culturally and Linguistically Diverse communities •– The Logan Women’s Health and Wellbeing Cervical Screening Project which provides culturally appropriate services to CALD women, many of whom report having never had a Pap smear.For Indigenous people – Ipswich Indigenous Young •Men’s Project has developed a young men’s rugby training program, which in addition to encouraging a sense of belonging and physical activity, incorporates health education messages related to reduced alcohol and substance abuse and healthy eating.

Report of the Chief Health Officer Queensland
130
Prevention of Chronic Disease
Key challenge 3 – ❚ Make healthy weight a priority
The epidemic of overweight and obesity is one of the major challenges facing all health systems of the world. The epidemic is in both children and adults. This challenge is due not only to the immediate negative health impacts of overweight and obesity, but also to the subsequent risk of chronic disease such as Type 2 diabetes, cardiovascular disease and some cancers. Overweight is caused by an imbalance in energy intake and expenditure. Although many factors may influence an individual’s weight, at a basic level an individual will gain weight when over a sufficient period, the energy intake from their diet exceeds the energy expended through daily living and physical activity.222
Improving the nutrition of Queenslanders and increasing levels of physical activity has benefits beyond addressing overweight and obesity. Nutrition is an important determinant of health and wellbeing of the population. Optimum nutrition is essential for the normal growth and the physical and cognitive development of infants and children, enhanced resilience and quality of life, good physical and mental health throughout life, resistance to infection, and protection against chronic disease and premature death.242
Regular physical activity, in addition to promoting healthy weight, reduces high blood pressure and high blood cholesterol.186 It also strengthens the musculoskeletal system reducing the likelihood of osteoporosis and the risk of falls and fractures in older people. In addition it improves mental wellbeing by reducing feelings of stress as well as anxiety and depression.55
What is the problem?Levels of overweight and obesity are high:
At least 2.4 million Queenslanders are overweight •or obese: more than half of all adults2 and one in five children are overweight or obese.20 The obesity rate is double for Indigenous adults.152
Levels have increased rapidly and are projected to •rise dramatically. Rates of obesity have increased by 45% for adults since 2001. Between 2008 and 2025 it is projected that obesity levels will double if current trends continue – one in four or 1.4 million Queenslanders will be obese.3
The impact is high:Obesity causes 55% of the burden of disease due •to diabetes and 20% of that due to cardiovascular disease.29
Obesity prevalence in young people means that •their life expectancy may be shorter than their parents.238 Ten obesity related diseases were included in •the 15 diseases which drove the 56% increase in health care expenditure in Australia between 1987 and 2000.74 Obesity currently costs the Queensland society •$11.6 billion per year; an increase of 42% since 2005.3
What causes it?The nutrition and physical activity levels of Queenslanders are influenced by many sectors of society, including food producers, retailers and transporters, the media, education providers, health providers, land uses and social policy makers of local, state and federal governments. The conditions of everyday life influence whether people are healthy or unhealthy by supporting health choices and behaviours.
Physical inactivityInsufficient physical inactivity caused 6.6% of the •burden of disease - the third largest single cause.29
Adults and children in Queensland are not doing •enough physical activity to support good health: about half the adults do not engage in sufficient physical activity for health benefit and one in eight report sedentary behaviour.7 For children 43% of those aged 5-12 years met activity recommendations for daily steps and 51% of those aged 14-17 years met recommendations of 60 minutes per day.16
Poor nutritionPoor diet caused about 16% of the total •burden of disease and injury, similar to that of cancer or cardiovascular disease or that due to socioeconomic disadvantage, and about double that of smoking.29,261 Queensland adults do not consume sufficient •vegetables: only about 6% of males and 13% of females eat at least five serves of vegetables per day.193 Fruit consumption was higher with 55% of adults consuming two or more serves per day. Before the Go for 2 and 5® fruit and vegetable promotion campaign commenced in 2006, Queensland adults ate an average 2.1

Report of the Chief Health Officer Queensland Prevention of Chronic Disease
131
66
serves of vegetables per day and 1.4 serves of fruit, an average 3.5 serves of fruit and vegetable combined. Phase one increased fruit and vegetable consumption by an average 0.4 serves per person per day in January – March 2006. Ongoing campaign tracking, which commenced in August 2006, has shown a peak increase of 1.1 serves per person per day.Queensland children consume too much sugar and •fat, with low intakes of milk and dairy products and vegetables and relatively low intakes of fruit.16
Breastfeeding is not sustained for long enough •in Queensland. By six months the rate of any breastfeeding had fallen to 59% and the rate of exclusive breastfeeding for the first six months was 13%.254
Low birth weight caused 20% of the total disease •burden for those aged 0-1 year. Maternal nutritional status significantly affects birth weight, as does smoking.
What are the potential gains?The potential gains are large:
In 10 years the burden of disease due to Type 2 •diabetes is projected to increase by more than 50%. But more importantly the rate of burden is projected to increase by 18%; for most other conditions the rate is decreasing, in particular for cardiovascular disease and cancer. Reducing cardiovascular disease is key to improving •the health of Queenslanders and fundamental to this is reducing overweight and obesity. Coronary heart disease death rates are 11% higher than nationally and 8% higher for stroke.12 These conditions caused about a quarter of the difference in health adjusted life expectancy between Queenslanders.
How can we address it?Addressing our ‘obesogenic’ environment is challenging. The Queensland Government’s first action plan to promote healthy weight in children, Eat well, be active – healthy kids for life234 is a plan to tackle this challenge.
From 2002/03 to 2008/09, Queensland added to existing investments by funding incrementally up to $16 million per year to promote healthy weight, nutrition and physical activity. This investment has supported the work of 148 new primary prevention positions. Over 100 coordinated nutrition and physical activity initiatives are currently being implemented under many integrated strategies. Many of these initiatives have reported success, but challenges remain if further gains are to be made.
Further gains can be made:Just one extra serve of fruit and vegetables will •make a difference. In 2001 in Australia it was reported that increasing average vegetable and fruit consumption by just one serve daily would result in direct health care system savings of $513 million a year.57,58 In Queensland, each 0.1 serve increase per person per day results in savings of approximately $5 million per year in treatment services.Every 1% increase in the Australian population •undertaking sufficient physical activity (i.e. 30 minutes on most days) would save at least $88 million per year.56
A modest weight loss of 5-10% of starting body •weight is sufficient to achieve clinically relevant health benefits.241 It has been estimated that if all overweight or obese Australians lost 5 kg, there would be a $44 million saving per year in health care costs associated with Type 2 diabetes and its complications.240
The risk of diabetes can be reduced by up to 58% •by improving nutrition and increasing physical activity.45 Lower intake of fat and energy, along with an average 30 minutes walking five days per week, can result in a weight loss of about 5kg and a subsequent 58% reduced risk of getting Type 2 diabetes up to six years later for those at high risk of the disease – those defined as pre-diabetic.45
Similarly reducing BMI by 10% in overweight •and obese women is predicted to decrease hypertension by 12% and diabetes by 23% up to eight years later.37 These reductions could be achieved with very moderate reductions in kilojoule intake (equivalent to a chocolate biscuit a day) combined with a moderate increase in daily physical activity (an extra 2000 steps).A minimum of $11.5 million could be saved each •year in Australia if the prevalence of exclusive breastfeeding at three months was increased from less than 60% to 80%.60 Breastfed babies are 22% less likely to be overweight and obese as adults and 37% less likely to develop Type 2 diabetes.249
Making healthy weight a priority is part of the broader challenge of both making prevention of chronic disease everyone’s business and making prevention a key to reducing inequality. Addressing those challenges will make significant progress in reducing the proportion of Queenslanders who are overweight or obese.

Report of the Chief Health Officer Queensland
132
Prevention of Chronic Disease
Healthy weight as a priorityWhile addressing overweight and obesity in children, young people and adults will significantly reduce the threat of chronic disease, the challenge is to invest sufficiently in prevention and treatment services to avert the threat. Further investment is required if current successful initiatives are to be sustained and if all Queenslanders are to have equitable access to prevention services and healthy lifestyle programs to treat overweight and obesity such as Living Strong and Lighten Up to a Healthier Lifestyle, described in Chapter 5: Prevention works. At present in Queensland there is very limited availability of effective treatment programs for the growing number of obese children.
Report of the Chief Health Officer Queensland Prevention of Chronic Disease
133
66
Methodology ❚All data sources are cited. For further information, contact [email protected].
Unless otherwise indicated all data refer to the total population (0-85+ years).
Australian Bureau of Statistics (ABS) data is used with permission from the ABS. Copyright in ABS data vests with the Commonwealth of Australia. www.abs.gov.au
All death data were derived from the Queensland Registrar of Births, Deaths and Marriages, where cause of death and usual residential address were recorded on death certificates. All disease specific death data in this report were derived using the principal cause of death and refer to year of registration of deaths of Queensland residents. Data were coded by the ABS using the International Classification of Diseases, version 10 (ICD-10), with code sets for specific conditions consistent with Queensland Health guidelines and aligned with national reporting.400 International comparisons may be limited by inconsistencies in coding in different countries.
Hospital separation data were derived from the Queensland Hospital Admitted Patient Data Collection, including private and public hospitals. All disease-specific hospital separations were derived using the principal diagnosis of inpatient episodes of care. All separations were coded using the International Classification of Diseases version 10 Clinical Modification (ICD-10-CM) using standard code sets.400
Death, cancer incidence and hospitalisation rates for all diseases and conditions are reported as age standardised rates. Adjustment of rates for age allows comparisons between populations that have different age structures, for example between youthful and older communities. The direct standardisation method was used in this report, where age specific rates are multiplied against a standard reference population. The 2001 Australian population (persons) was used as the standard population. For all OECD comparisons however, the OECD population of 1980 was used as the reference population. The 95% confidence intervals for rates were estimated by assuming Normal approximations to the Poisson distribution.
The projected admission rates are based on linear regression of the most recent seven years of statewide admission.1 For each Enhanced Service Related Groups/Age Group/Stay Type combination, the projected population of a residence is multiplied by
the projected state admission rate to yield an expected number of admissions.401
Survey data are reported as percentage and 95% confidence intervals. Unless otherwise noted, all survey data refer to self report and are not standardised. All sources are cited and information about specific surveys including sample size can be obtained from the custodian.
Socioeconomic disadvantage/advantage was determined using the ABS Index of Relative Socioeconomic Advantage/Disadvantage.402 This Index is one of a suite described as Socio-Economic Indexes for Areas (SEIFA). The Index of Relative Advantage/Disadvantage has been designed to rank areas based on their relative social and economic well-being, using census measures including proportion low income/high income, educational attainment, employment status and occupation.403. Excess deaths due to socioeconomic disadvantage or remoteness were calculated using the methodology fully described by Australian Institute of Health and Welfare.404
Accessibility/remoteness was determined using the Accessibility/Remoteness Index of Australia (ARIA). ARIA is a geographic variable which measures the remoteness of a point based on the physical road distance to the nearest urban centre. The six category Remoteness Areas (RA) index was used; Major cities, Inner regional, Outer regional, Remote, Very remote and Migratory.405
Abbreviations ❚ABS Australian Bureau of StatisticsARIA Accessibility/Remoteness Index of AustraliaBMI Body mass indexCI Confidence intervalCHD Coronary heart diseaseCOPD Chronic obstructive pulmonary diseaseDALY Disability adjusted life yearESKD End stage kidney diseaseGDP Gross Domestic ProductGP General practitionerHALE Health adjusted life expectancyNHMRC National Health and Medical Research
CouncilOECD Organization for Economic Co-operation and
Development SEIFA Socio-Economic Indexes for AreasWHO World Health Organization
Report of the Chief Health Officer Queensland
134
Prevention of Chronic Disease
References ❚1. Queensland Health. Queensland hospital admitted patient
data collection.
2. Queensland Health. National Oral Health Survey 2006: Queensland healthy lifestyle additional module. personal communication. 2008.
3. Access Economics. The growing cost of obesity in 2008; three years on: Report prepared for Diabetes Australia; 2008.
4. National Health and Medical Research Council. Australian alcohol guidelines for low-risk drinking. Draft for public consultation 2007.
5. Queensland Government. Queensland Strategy for Chronic Disease 2005-2015 Brisbane: Queensland Government.
6. Australian Bureau of Statistics. Australian Social Trends. Canberra: Australian Bureau of Statistics; 2007. Cat. no. 4102.0.
7. Queensland Health. Statewide omnibus survey-2008. Brisbane: Health Statistics Centre, Reform and Development Division, Queensland Health; 2008.
8. World Health Organisation. Preventing chronic disease: A vital investment. 2005.
9. Armstrong T, Dixon T. The global burden of physical inactivity (In prep). Brisbane 2002.
10. Queensland Government. Queensland Government population projections to 2056: Queensland and statistical divisions, 2008 edition,. 2008.
11. Department of Health and Ageing. Australia’s physical activity recommendations for 5-12 year olds. Canberra: Department of Health and Ageing; 2004.
12. Australian Bureau of Statistics. Deaths, Australia 2004. Canberra: Australian Bureau of Statistics; 2004. Cat. no. 3202.0.
13. Queensland Transport. Queensland Transport website: Alcohol and drugs; Anti-drink driving. Accessed 29/08/2008; 2008.
14. Queensland Cancer Registry. Cancer in Queensland. Incidence and mortality 1982 to 2005. Statistical tables.: The Cancer Council Queensland; 2008.
15. Australian Bureau of Statistics. National Health Survey: Summary of results, Queensland. Canberra: Australian Bureau of Statistics; 2004/05. Cat. no 4362.0.
16. Abbott R, Macdonald D, Mackinnon L, Stubbs CO, Lee AJ, Harper C, Davies PSW. Healthy Kids Queensland Survey 2006 Summary Report. Brisbane: Queensland Health; 2007.
17. National Health and Medical Research Council. Dietary guidelines for children and adolescents in Australia incorporating the infant feeding guidelines for health workers. Canberra 2003.
18. Standing Senate Committee on Social Affairs Science and Technology. The health of Canadians-The Federal role, Volume 1, The story so far. 2001.
19. Glover J, PHIDU,. Socioeconomic differentials in avoidable deaths 1987-2001, Queensland. In: Harper C, ed; 2008.
20. Abbott A, Macdonald D, Stubbs CO, Lee AJ, Harper C, Davis PSW. Healthy kids Queensland survey 2006. Brisbane: Queensland Health & University of Queensland; 2007.
21. National Health and Medical Research Council. Dietary guidelines for Australian adults. Canberra: NHMRC, Canberra, Australia; 2003.
22. International Agency for Research on Cancer. Mammography screening can reduce deaths from breast cancer. www.iarc.fr. 2002.
23. Britt H, Harrison CM, Miller GC, Knox SA, . Prevalence and patterns of multimorbidity in Australia. Medical Journal of Australia. 2008;189(2):72-77.
24. Queensland Council of Social Services. Identifying population health interventions that effectively target disadvantaged Queenslanders. Brisbane: Prepared for Population Health Branch, Queensland Health; 2008.
25. Department of Health and Ageing. Returns on investment. An epidemiological and economic analysis prepared for Department of Health and Ageing. Canberra: Applied Economics; 2003.
26. Australian Institute of Health and Welfare. 2007 National Drug Strategy Household Survey. State and territory supplement. Canberra: Australian Institute of Health and Welfare; 2008. AIHW Cat. no PHE 102.
27. Queensland Health: Begg S, Khor SL, Bright M, Stanley L, O’Brien J, Harper C. Age group differences in burden of disease and injury in Queensland, 2003 Brisbane: Queensland Health; 2008. Queensland Burden of Disease and Injury circular series 1, no 3.
28. Queensland Health: Begg S, Khor SL, Bright M, Stanley L, Harper C,. Burden of disease and health adjusted life expectancy in Health Service Districts of Queensland Health, 2003. Brisbane: Queensland Health; 2008.
29. Queensland Health: Begg S, Khor SL, Bright M, Stanley L, O’Brien J, Harper C. Risk factor impact on the burden of disease and injury in Queensland, 2003. Brisbane: Queensland Health; 2008. Queensland Burden of Disease and Injury circular series 1, no 4.
30. Frank F, Anderson MA, Schmidt TL,. Obesity relationships with community design, physical activity, and time spent in cars. American Journal of Preventive Medicine. 2004;27(2):87-96.
31. Begg S, Vos T, Goss J, Mann N. An alternative approach to projecting health expenditure in Australia. Australian Health Review. 2007;32(1):148-155.
32. Australian Institute of Health and Welfare. A picture of Australia’s children. Canberra: Australian Institute of Health and Welfare; 2005. AIHW Cat. no. PHE 58.
33. Ruffin R, Wilson D, Appleton S,. When you can’t breathe.....nothing else matters* (*Australian Lung Foundation- Trade Mark). Public Health Bulletin. South Australia. 2006;3:13-16.
34. Catford JC, Caterson I D. Snowballing obesity: Australians will get run over if they sit there. Medical Journal of Australia. 1/15 December 2003;179:577-579.
35. Australian Institute of Health and Welfare. Indigenous mothers and their babies, 2001-2004. Canberra: Australian Institute of Health and Welfare; 2007. AIHW Cat. no. PER 38.
36. Australian Institute of Health and Welfare. 2007 National Drug Strategy Household Survey-first results. Canberra: Australian Institute of Health and Welfare; 2008. Cat. no. PHE 98.

Report of the Chief Health Officer Queensland Prevention of Chronic Disease
135
66
37. Brown W, Hockey A, Dobson A. Rose revisited: a “middle road” prevention strategy to reduce noncommunicable chronic disease risk. Bulletin of the World Health Organization. 2007;85(11):886-887.
38. Taylor R, Dobson A, Mirzaei M Contribution of changes in risk factors to the decline of coronary heart disease mortality in Australia over three decades. European Journal of Cardiovascular Prevention and Rehabilitation. European Society of Cardiology. 2006;13(5):760-768.
39. Department of Health and Ageing. Australia’s physical activity recommendations for 12-18 year olds. Canberra: Department of Health and Ageing; 2004.
40. World Health Organization. The optimal duration of exclusive breastfeeding. Report of an expert consultation. Geneva: World Health Organization; 2001. WHO Geneva (Document WHO/NDH/01.09).
41. National Health and Medical Research Council. Clinical practice guidelines for weight control and obesity management in adults. Canberra: National Health and Medical Research Council; 2003.
42. Lean E, Han TS, Seidell JC. Impairment of health and quality of life in people with large waist circumference. Lancet 1998;351:853-856.
43. National Health and Medical Research Centre. Dietary guidelines for Australians. Canberra 2002.
44. Department of Health and Ageing. National physical activity guidelines for adults. Canberra: Department of Health and Ageing; 1999 (reprinted 2005).
45. Centres for Disease Control and Prevention. The power of prevention. Reducing the health and economic burden of chronic disease. Atlanta: US Department of Health and Human Services; 2003.
46. Queensland Government. Toward Q2. Tomorrow’s Queensland. 2008.
47. Gerberding J. Protecting health- the new research imperative (doi: 10.1001/jama.294.11.1403). Journal of American Medical Association. 2005;294(11):1403-1406.
48. Collins D, Lapsley HM. The costs of tobacco, alcohol and illicit drug abuse to Australian society in 2004/05. Canberra: Commonwealth of Australia; 2008.
49. SIGNAL. Eat well Australia: An agenda for action for public health nutrition 2001-2010. Canberra: National Public Health Partnership; 2001.
50. van Dam R, Li T, Spiegelman D, Franco OH, Hu FB. Combined impact of lifestyle factors on mortality: prospective cohort study in US women. doi:10.1136/bmj1440. British Medical Journal. 2008;337:a1440.
51. Kawachi I, Colditz GA, Stampfer MJ, Willett WC, Manson JE, Rosner B, Speizer FE, Hennekens CH. Smoking cessation and decreased risk of stroke in women. Journal of American Medical Association. 1993;269(2):232-236.
52. International Agency for Research in Cancer (IARC). Reversal of risk after quitting smoking. IARC Handbooks of Cancer Prevention 11. 2007.
53. VicHealth Centre for Tobacco Control. Tobacco control: A blue chip investment in public health. Melbourne: The Cancer Council of Victoria; 2001.
54. Marks G, Coyne T, Pang G. Type 2 diabetes costs in Australia-the potential impact of changes in diet, physical activity and levels of obesity. Canberra: Commonwealth Department of Health and Ageing; 2001.
55. Dunn A, Trivendi M, O’Neal H. Physical activity dose response effects on outcomes of depression and anxiety. Medicine and Science in Sports and Exercise. 2001;33:S587-S597.
56. Stephenson J, Bauman A, Armstrong T, Smith B, Bellew B. The costs of illness attributable to physical inactivity: a preliminary study. Canberra.: Commonwealth Department of Health and Aged Care and Australian Sports Commission. ; 2000.
57. Miller M. Eat more fruit and vegetable - the case for a five-year campaign to increase more fruit and vegetable consumption in Australia. 2002.
58. Marks G, Pang G, Coyne T, Picton P. Cancer costs in Australia- the potential impact of dietary change: Australian Food and Nutrition Monitoring Unit; 2001. ISBN 0 642 82054 6.
59. Australian Fruit and Vegetable Coalition (AFVA). Better health. Its simple. A national fruit and vegetable campaign. we need to act now. Sydney.
60. Drane D. Breastfeeding and formula feeding: a preliminary economic analysis. Breastfeeding Review. 1997;5(1):7-15.
61. Hakama M. Potential contribution of screening to cancer mortality reduction. Cancer Detect Prev. 1993;17(4-5):513-520.
62. Australian Cancer Network Colorectal Cancer Guidelines Revision Committee. Guidelines for the prevention, early detection and management of colorectal cancer. Sydney: The Cancer Council Australia and Australian Cancer Network; 2005.
63. Queensland Health. The Health of Queenslanders 2006. Report of the Chief Health Officer Queensland. Brisbane: Queensland Health; 2006.
64. Queensland Health:, Harper C, Cardona M, Bright M, Neill A, McClintock C, McCulloch I, Hunter I, Bell M. Health Determinants Queensland 2004. Brisbane: Public Health Services, Queensland Health; 2004.
65. Queensland Health. The state of health of the Queensland population 2004. Brisbane: Queensland Health; 2004.
66. Queensland Health. Health indicators for Queensland: Southern Zone 2001. Brisbane: Public Health Services, Queensland Health; 2001.
67. Queensland Health. Health indicators for Queensland: Central Zone 2001. Brisbane: Public Health Services, Queensland Health; 2001.
68. Queensland Health. Health indicators for Queensland: Northern Zone 2001. Brisbane: Public Health Services, Queensland Health; 2001.
69. Martin Luther King. Beyond Vietnam. Address delivered to the clergy and layman concerned about Vietnam, at Riverside Church. 4 April. New York City; 1967.
70. Australian Institute of Health and Welfare. Health expenditure Australia 2006-07. Canberra: Australian Institute of Health and Welfare; 2008. Cat. no. HWE 42.
Report of the Chief Health Officer Queensland
136
Prevention of Chronic Disease
71. Australian Institute of Health and Welfare. National public health expenditure report 2005-06. Canberra: Australian Institute of Health and Welfare; 2008. AIHW cat. no. HWE 39.
72. Centers for Disease Control and Prevention. CDC futures initiative. Webcast presentation slides and script.
73. World Health Organization. Constitution of the World Health Organization. 1946.
74. Gross P. Mind the gaps: increasing personal health security via prevention and economic incentives: Health Group Strategies Pty Limited and The Institute of Health Economics and Technology Assessment; 2006.
75. Smith T. South Australia’s strategic plan and HiAP- perfect partners. Public Health Bulletin. South Australia. 2008;5(1):23-26.
76. Australian Government. Australia 2020. Australia 2020 Summit. Initial Summit Report 2008.
77. Australian Bureau of Statistics. Causes of death, Australia. Canberra: Australian Bureau of Statistics. Cat. no. 3303.0.
78. Public Health Information Development Unit (PHIDU). Atlas of avoidable mortality in Australia and New Zealand. Adelaide: The University of Adelaide; 2006.
79. Page A, Ambrose S, Glover J, Hetzel D,. Atlas of avoidable hospitalisations in Australia: ambulatory care-sensitive conditions. Adelaide: PHIDU, University of Adelaide; 2007.
80. Australian Bureau of Statistics. Deaths Australia-2006. Canberra: Australian Bureau of Statistics; 2007. Cat no. 3302.0.
81. Australian Institute of Health and Welfare. Australian hospital statistics 2004-05. Canberra: Australian Institute of Health and Welfare; 2004-05. AIHW Cat. no. HSE 41.
82. Jackson G, Tobias M,. Potentially avoidable hospitalisations in New Zealand, 1989-98. Australian and New Zealand Journal of Public Health. 2001;25:212-221.
83. Australian Bureau of Statistics. Information Paper - Use of the Kessler Psychological Distress Scale in Australian Bureau of Statistics health surveys. Canberra: Australian Bureau of Statistics; 2003. Cat. no. 4817.0.55.001.
84. Queensland Health: Begg S, Khor SL, Bright M, Stanley L, O’Brien J, Harper C. Differentials in the burden of disease and injury in Queensland, 2003. Brisbane: Queensland Health; 2008. Queensland Burden of Disease and Injury Circular series 1 no. 5.
85. Australian Institute of Health and Welfare. Health system expenditure of diseases and injuries in Australia 2000-01 (2nd Ed). Canberra: Australian Institute of Health and Welfare; 2005. AIHW Cat. no. HWE-28.
86. World Health Organization. Global strategy for the prevention and control of non-communicable diseases. Report of the Director General. Geneva: WHO; 2000.
87. Eckersley R. Measuring progress. Is life getting better? Collingwood: CSIRO Publishing; 1998.
88. Australian Institute of Health and Welfare. Chronic diseases and associated risk factors in Australia, 2006. Canberra: Australian Institute of Health and Welfare; 2006. AIHW Cat. No. PHE 81.
89. Page A, Tobias M, Glover J, Wright C, Hetzel D, Fisher E Australian and New Zealand atlas of avoidable mortality. Adelaide: PHIDU, University of Adelaide; 2006.
90. The Department of Premier and Cabinet Victoria. Next steps in Australian health reform. The proposals of the Victorian Premier. June 2008.
91. Sterman J. Business dynamics: systems thinking and modelling for a complex world. Boston: Irwin/McGraw-Hill; 2000.
92. Homer J, Hirsch GB. Systems dynamic modelling for public health; background and opportunities. American Journal of Public Health. 2006;96(3):452-458.
93. Homer J, Milstein B, Wile K, Pratibhu P, Farris R, Orenstein D. Modelling the local dynamics of cardiovascular health: risk factors, context, and capacity. Public Health Research, Practice, and Policy. 2008;5(2):1-5.
94. Queensland Health. Queensland Health Population Health Plan 2007-2012. Brisbane: Queensland Government; 2007.
95. International Agency for Research in Cancer (IARC). Monographs on the Evaluation of Carcinogenic Risks to Humans: Human Papilloma Viruses. 2007;90.
96. Green A MR, Youl P and Martin N. ‘Site Distribution of Cutaneous Melanoma in Queensland’. International Journal of Cancer. 1993;53:232-236.
97. Gies P Roy C Toomey S MacLennan R and Watson M. Solar UVR Exposure of Primary School Children at Three Locations in Queensland. Photochemistry and Photobiology 1998;68(1):78-83.
98. Kimlin M & Parisi A. ‘Ultraviolet Radiation Exposure of School Children in a Rural Location in South East Queensland’ Paper presented at: 2000 Infront Outback Conference, 2000; Toowoomba QLD Australia.
99. The Cancer Council of Australia. National Cancer Prevention Policy 2007-09. New South Wales: The Cancer Council Australia; May 2007 2007.
100. World Cancer Research Fund / American Institute for Cancer Research. Food Nutrition, Physical Activity, and the Prevention of Cancer: A Global perspective. Washington DC: AICR: World Cancer Research Fund / American Institute for Cancer Research; 2007.
101. World Health Organization. National cancer control programmes : policies and managerial guidelines. 2nd edition ed. Geneva: WHO; 2002.
102. Australian Institute of Health and Welfare. BreastScreen Australia monitoring report 2004-2005. Canberra: Australian Institute of Health and Welfare; 2008. Cat. no. CAN 37.
103. Hakama M, Miller AB, Day NE. Screening for cancer of the uterine cervix. Lyon, France: International Agency for Research on Cancer; 1986.
104. Queensland Health. Pap Smear Register.
105. Young GP Levin B Rozen P. Prevention and early detection of colorectal cancer London: WB Saunders; 1996.
106. Queensland Health. Bowel cancer screening rates. Brisbane: Cancer Screening Services Unit, Population Health Branch, Queensland Health; 2008.
107. Australian Government Department of Health and Ageing. BreastScreen Australia. Canberra: Department of Health and Ageing, Population Health Division. www.breastscreen.info.au/
Report of the Chief Health Officer Queensland Prevention of Chronic Disease
137
66
108. Australian Government Department of Health and Ageing. National Cervical Screening Program. Canberra: Department of Health and Ageing, Population Health Division http://www.cervicalscreen.health.gov.au/ncsp/index.html.
109. The Cancer Council Australia. National Cancer Prevention Policy 2007-09: The Cancer Council Australia.
110. Weller D, Pinnock C, Aldeman C, Moss J, Doust J. Screening for prostate cancer: update of the 1996 AHTAC report. Unpublished document on behalf of the Australian Cancer Network. Adelaide: Department of Evidence-based Care and General Practice, Flinders University of South Australia; 1998.
111. Begg C, Riedel ER, Bach PB, Kattan MW, Schrag D, Warren JL, Scardino PT. Variations in morbidity after radical prostatectomy. New England Journal of Medicine. 2002;352(19):1977-1984.
112. Australian Institute of Health and Welfare. Cancer survival and prevalence in Australia. Cancers diagnosed from 1982 to 2004. Canberra: Australian Institute of Health and Welfare; 2008. Cat. no. CAN 38.
113. McDermid I. Cancer incidence projections Australia 2002 to 2011. Canberra: The Australian Institute of Health and Welfare, The Australasian Association of Cancer Registries, The National Cancer Strategies Group; 2005.
114. Staples M, Elwood M, Burton RC, Williams JL, Marks R, Giles GG,. Non-melanoma skin cancer in Australia: the national survey and trends since 1985. Medical Journal of Australia. 2006;184(1):6-10.
115. National Health and Medical Research Council. Primary prevention of skin cancer in Australia: report of the Sun Protection Programs Working Party: National Health and Medical Research Council; 1996.
116. Homewood J, Coory M, Dinh B,. Cancer among people living in rural and remote Indigenous communities in Queensland; an update 1997-2002. Brisbane: Health Information Branch, Queensland Health; 2005. Information Circular 70.
117. Coory M, Thompson A, Ganguly I,. Cancer among people living in rural and remote Indigenous communities. Medical Journal of Australia. 2000;173:301-304.
118. Dinh M, Khor S, Coory M. Mortality and incidence trends for leading cancers in Queensland, 1982 – 2003: Health Information Branch, Queensland Health; 2005. Information Circular No 71.
119. Queensland Cancer Registry. Cancer in Queensland: Incidence and mortality, 1981-2001. Brisbane 2003.
120. Australian Institute of Health and Welfare. Cancer in Australia: an overview, 2006. Canberra: Australian Institute of Health and Welfare; 2006. AIHW Cat. no. CAN 32.
121. OECD (Organisation for Economic Cooperation and Development). OECD Health data: Statistics and indicators for 30 countries: OECD.
122. Public Health Information Development Unit. Australian and New Zealand Atlas of Avoidable Mortality: University of Adelaide; 2006.
123. Youlden D, Baade P, Coory M. Cancer survival in Queensland, 2002. Brisbane: Queensland Health and Queensland Cancer Fund; 2005.
124. Australian Institute of Health and Welfare. Australia’s health 2006. Canberra: Australian Institute of Health and Welfare; 2008. AIHW Cat. no. AUS 73.
125. Australian Institute of Health and Welfare. Diabetes: Australian Facts 2008: Australian Institute of Health and Welfare; 2008.
126. Lynch J. The importance of causes in population health; thinking about columns and Rose. Paper presented at: Australasian Population Health Congress. A global world-practical action for health and well being, 2008; Brisbane.
127. Manuel D, Kwong K, Tanuseputro P, Lim J, Mustard CA, Anderson GM, Ardal S, Alter DA, Laupacis A,. Effectiveness and efficiency of different guidelines on statin treatment for modelling deaths from coronary heart disease: modelling study (doi: 10.1136/bmj.38849.487546.DE). British Medical Journal. 2006;332:1419.
128. Starfield B, Hyde J, Gervas J, Heath I. The concept of prevention: a good idea gone astray? Journal of Epidemiology and Community Health. 2008;62:580-583 doi:510.1136/jech.2007.071027.
129. Australian Institute of Health and Welfare. Living dangerously. Australians with multiple risk factors for cardiovascular disease. Bulletin. 2005; Issue 24.
130. Ben-Shlomo Y, Kuh D. A life course approach to chronic disease epidemiology: conceptual models, empirical challenges and interdisciplinary perspectives. International journal of Epidemiology 2002;31(April):285-293.
131. Lynch J, Everson SA, Kaplan GA, Salonen R, Salonen JT. Does socioeconomic status potentiate the effects of heightened cardiovascular responses to stress on the progression of carotid atherosclerosis? American Journal of Public Health. 1998;88(3):389-394.
132. The Center for Weight and Health. Prevention of childhood overweight - what should be done?: University of California; 2001.
133. Forsdahl A. Are poor living conditions in childhood and adolescence an important risk factor for arteriosclerotic heart disease? . British Journal of Preventative Medicine. 1977;31:91-95.
134. Freedman D, Khan LK, Serdula MK, Dietz WH, Srinivasan SR, Berenson GS,. The relation of childhood BMI to adult adiposity: the Bogalusa Heart Study. Pediatrics. 2005;115(1):22-27.
135. Kaplan R, Ong M. Rationale and public health implications of changing CHD risk factor definitions. Annual Review Public Health. 2007;28:321-344.
136. Manuel D, Lim J, Tanauseputro P, Anderson GM, Alter DA, Laupacis A, Mustard CA,. Revisiting Rose: strategies for reducing cornary heart disease (doi: 1136/bmj.332.7542.659). British Medical Journal. 2006;332:659-662.
137. Knox S, Harrison CM, Britt HC, Henderson JV. Estimating prevalence of common chronic morbidities in Australia. Medical Journal of Australia. 2008;189(2):66-70.
138. Queensland Health: Begg S, Khor SL, Bright M, Stanley L, Harper C. Burden of disease and injury in Queensland Health Service Districts, 2003. Brisbane: Queensland Health; 2008. Queensland Burden of Disease and Injury circular series 1, no 6.
Report of the Chief Health Officer Queensland
138
Prevention of Chronic Disease
139. Australian Institute of Health and Welfare. Health system expenditure on disease and injury in Australia, 2000-01. Canberra: Australian Institute of Health and Welfare; 2004. AIHW Cat. no. HWE 26.
140. Begg S. An alternative approach to projecting health expenditure in Australia; 2007.
141. World Health Organization. The World Health Report 2002: Reducing risks, promoting healthy life. France 2002.
142. World Health Organization. Definition, diagnosis and classification of diabetes mellitus and its complications. Part 1: Diagnosis and classification of Diabetes mellitus. Geneva 1999.
143. Atkinson MA & Eisenbarth GS. Type 1 diabetes: new perspectives on disease pathogenesis and treatment. The Lancet. 2001;358:221-229.
144. Daneman. Type 1 diabetes. The Lancet. 2006;367:847-858.
145. Guha M. Diabetes Mellitus - the lifestyle disease. Public Health Bulletin. South Australia. 2006;3:21-22.
146. Tuomilehto J, Lindstrom J, Eriksson JG, et al. Prevention of Type 2 diabetes mellitus by changes to lifestyle among subjects with impaired glucose tolerance. For the Finnish Diabetes Prevention Group. New England Journal of Medicine. 2001;344(18):1343-1350.
147. General Practice Queensland. Practice Incentives Program-personal communication; 2008.
148. Australian Institute of Health and Welfare. Chronic diseases and associated risk factors in Australia, 2001. Canberra: Australian Institute of Health and Welfare; 2002. AIHW cat. no. PHE 33.
149. Donald M, Crowther R, Ware R, Jamrozik K. Mortality, prevalence, incidence, health status and QoL. Brisbane: University of Queensland; 2007. No. 1.
150. Dunstan D, Cameron, A, deCourten M, Coyne T. The Australian Diabetes Obesity and Lifestyle study (AusDiab) data report: Queensland. Brisbane: Queensland Health; 2004.
151. Australian Institute of Health and Welfare: Catanzariti L FK, Waters A-M National Diabetes Register: statistical profile report 2005. Canberra: Australian Institute of Health and Welfare; 2007. AIHW Cat. no. CVD 39.
152. Australian Bureau of Statistics. National Aboriginal and Torres Strait Islander Health Survey 2004-05. Canberra: Australian Bureau of Statistics; 2006. Cat. no. 4715.0.
153. Leonard D, McDermott R, O’Dea K, et al. Obesity, diabetes and associated cardiovascular risk factors among Torres Strait Islander people. Australian and New Zealand Journal of Public Health. 2002;26:144-149.
154. Australian Bureau of Statistics. National Health Survey: Summary tables, Australia. Canberra: Australian Bureau of Statistics; 2004/05. Cat. no. 4362.0.
155. International Diabetes Federation. Diabetes Atlas, 3rd edition. Brussels 2006.
156. Australian Institute of Health and Welfare. Incidence of Type 1 diabetes in Australia: first results. Diabetes series no. 9. Cat. no. CVD 42. Canberra: AIHW; 2008.
157. Colagiuri S B-JK, Glumer C & Vistisen D. There really is an epidemic of type 2 diabetes. Diabetologia 2005 2005;48(8):1459-1463.
158. Hardes and Associates. Hospital projections: May 2008. Brisbane 2008.
159. Australian Bureau of Statistics. Self-assessed health in Australia: a snapshot: 2004-05, 2001. Canberra: Australian Bureau of Statistics; 2007. Cat. no. 4828.0.55.001.
160. Australian Institute of Health and Welfare. Australia’s Health 2004. Canberra: Australian Institute of Health and Welfare; 2004. AIHW Cat. no. AUS 44.
161. International Diabetes Institute. Tracking the accelerating epidemic: Its cause and outcomes. Melbourne 2006.
162. World Health Organization. The Global strategy on diet, physical activity and health. Geneva: World Health Organization; 2006.
163. Australian Bureau of Statistics. National Health Survey: summary of results. Canberra: Australian Bureau of Statistics; 2004/05. Cat. no. 4364.0.
164. Begg S, Voss T, Barker B, Stevenson C, Stanley L, Lopez A. The burden of disease and injury in Australia 2003: University of Queensland and Australian Institute of Health and Welfare; 2007.
165. Idler E, Benyamini Y. Self rated health and mortality: a review of twenty-seven community studies. Journal of Health and Social Behaviour. 1997;38:21-37.
166. McCallum J, Shadbolt B, Wang D. Self-rated health and survival: a 7-year follow-up study of Australian elderly. American Journal of Public Health. 1994;84:1100-1105.
167. Rabin R, de Charro F. EQ-5D: a measure of health status from EuroQoL Group. Annals of Medicine. 2001;33(5):337-343.
168. Cohen S, Janicki-Deverts D, Miller G,. Psychological stress and disease. Journal of American Medical Association. 2007;298(14):1685-1687.
169. Rozanski A, Blumenthal JA, Kaplan J. Impact of psychological factors on the pathogenesis of cardiovascular disease and implications for therapy. Circulation. 1999;99(16):2192-2217.
170. Bjorntorp P. Do stress reactions cause abdominal obesity and comorbidities. Obesity Reviews. 2001;2(2):73-86.
171. Kouvonen A, Kivimaki M, Virtanen M, Pentti J, Vahtera J,. Work stress, smoking status, and smoking intensity; an observational study of 46,190 employees. Journal of Epidemiology and Community Health. 2005;59(1):63-69.
172. Queensland Health. An investigation of the corridors to self-reported health and wellbeing. Further analysis from the 2002 Social Capital Survey. Brisbane: Public Health Services Branch and Health information Branch. Queensland Health.; 2005.
173. Berry H. Social capital and mental health in a coastal community. Paper presented at: Population Health Congress 2008. A global world - practical action for health and well-being, 2008; Brisbane.
174. Australian Bureau of Statistics. Mental Health in Australia: A Snapshot, 2004-05. Canberra: Australian Bureau of Statistics; 2006. Cat. no. 4824.0.55.001.

Report of the Chief Health Officer Queensland Prevention of Chronic Disease
139
66
175. Taylor A, Chittleborough C, Freeman M,. The relationship between psychological distress, chronic conditions, and age. Paper presented at: Population Health Congress 2008. A global world - practical action for health and well-being, 2008; Brisbane.
176. University of Queensland, Evans R, Donald M, Ware R, Lutsenko H, Cornes B,. Health risk behaviours and supportive environments for healthy behaviour. Baseline evaluation report for the Queensland Strategy for Chronic Disease 2005-2015 Brisbane 2007. Number 3.
177. Gray MC, Hunter B H, Taylor J. Health expenditure, income and health status among Indigenous and other Australians. CAEPR Research Monograph Series Canberra: ANU Press; 2004.
178. South Australian Department of Health and Western Australian Department of Health. SNAPS Survey: Queensland survey methodology: CATI data pooling pilot project: filling the gaps in data pooling 2004.
179. Australian Bureau of Statistics. Australian Social Trends- Data cube. Canberra: Australian Bureau of Statistics; 2006. Cat. no. 4102.0.
180. Mcdaid D, Curran C, Knapp M Promoting mental well-being in the workplace: A European policy perspective International Review of Psychiatry. 2005;17(5):365-373.
181. Whiteford H, Teeson M, Scheurer R, Jamison D,. Responding to the burden of mental illness. Report prepared for the WHO Commission on Macroeconomics and Health 2001.
182. Greenberg P, Stiglin LE, Finkelstein SN, etal. The economic burden of depression in 1990. Journal of Clinical Psychiatry. 1993;54:405-418.
183. Berndt E, Finkelstein S, Greenberg P, Keith A, Bailit H,. Illness and productivity; objective workplace evidence. Cambridge, Massachusetts: Sloan School of Management, Massachusetts Institute of Technology; 1997. WP#42-97.
184. Queensland Government. Queensland Plan for Mental Health 2007-2017. Brisbane: Queensland Government; 2008.
185. Whiteford H. Responding to the global burden of mental illness. Paper presented at: Australian College of Health Service Executives (ACHSE) Breakfast Forum 26 October, 2004; Brisbane.
186. Australian Institute of Health and Welfare. Australia’s Health 2008. 2008. AIHW Cat. no. AUS 99.
187. International Agency for Research on Cancer. Monographs on the Evaluation of Carcinogenic Risks to Humans: Tobacco Smoke and Involuntary Smoking. 2004;83.
188. Anthonisen N, Connett JE, Kiley JP, etal,. Effects of smoking intervention and the use of inhaled anticholinergic bronchodilator on the rate of decline of FEV1: the Lung Health Study. Journal of American Medical Association. 1994;272:1497-1505.
189. Australian Centre for Asthma Monitoring, Woolcock Institute of Medical Research. Asthma in Australia 2005: Australian Institute of Health and Welfare; 2005. AIHW Cat. no. ACM6.
190. Department of Health and Ageing. Asthma and Allergy - A guide for health professionals. Canberra: Australian Government; 2004.
191. Australian Government Department of Health and Ageing. HealthInsite. Healthy ageing. http://www.seniors.gov.au/internet/seniors/publishing.nsf/Content/Healthy+ageing; Accessed: 1 August 2008.
192. Britt H, Miller GC, Charles J, Pan Y, Valenti L, Henderson J, Bayram C, O’Halloran J, Knox S. General practice activity in Australia 2005-06. Canberra: Australian Institute of Health and Welfare; 2007.
193. Queensland Health. Omnibus survey. Brisbane: Epidemiology Services Unit, Health Information Centre, Queensland Health; 2006.
194. Australian Institute of Health and Welfare. Chronic kidney disease in Australia 2005. Canberra: Australian Institute of Health and Welfare; 2005. AIHW Cat. no. PHE 68.
195. Chadban S, Briganti EM, Kerr PG, et al,. Prevalence of kidney damage in Australian adults: the AusDiab kidney study. Journal of the American Society of Nephrology. 2003;14(Suppl. 2):S131-138.
196. Chen J, Munter P, Hamm LL, etal,. The metabolic syndrome and chronic kidney disease in US adults. Annals of Internal Medicine. 2004;140:167-174.
197. eMedicine CKB. High blood pressure. http://www.imedicine.com/. Accessed 16 July 2008.
198. McDonald S, Chang S, Excell L. ANZDATA Registry. The thirtieth report. Adelaide: Australia and New Zealand Dialysis and Transplant Registry; 2007.
199. Queensland Government. Eat well, be active - healthy kids for life. The Queensland Government’s first action plan 2005-2008. Brisbane 2005.
200. Murray C, Lopez AD,. The global burden of disease. WHO: Harvard University Press; 1996.
201. Australian Institute of Health and Welfare and Department of Health and Ageing. A picture of osteoarthritis in Australia. Canberra: Australian Institute of Health and Welfare; 2007. AIHW Cat. No. PHE 93.
202. Access Economics. Painful realities: The economic impact of arthritis in Australia in 2007: Arthritis Australia; 2007.
203. National Public Health Partnership. Preventing Chronic Disease: A strategic framework. Canberra: Department of Health and Ageing; 2001.
204. Labonte R. How our programs affect population health determinants: A workbook for better planning and accountability. Ottawa: Health Canada; 2003.
205. Queensland Health: Begg S, Khor SL, Bright M, Stanley L, Harper C,. Smoking, nutrition, alcohol, physical activity and overweight (SNAPO) indicators for Health Service Districts in 2006: Population Health Branch and Planning and Coordination Branch, Queensland Health; 2008.
206. Oldenburg B, Harper T. Investing in the future: prevention a priority at last. Medical Journal of Australia. 2008;189(5):267-268.
207. Australian Government. Every cigarette is doing you damage. The National Tobacco Campaign. 30/06/2008; http://www.quitnow.info.au/internet/quitnow/publishing.nsf/Content/damage-lp.

Report of the Chief Health Officer Queensland
140
Prevention of Chronic Disease
208. Hill D, Borland R. Adult’s accounts of onset of regular smoking: influences of school, work and other settings. Public Health Reports. 1991;109:181-185.
209. Fong G, Hammond D, Laux FL, Zanna MP, Cummings KM, Borland R, Ross H,. The near universal experience of regret among smokers in four countries: Findings from the International Tobacco Control Policy Evaluation Survey. Nicotine and Tobacco Research. 2004;6(Supplement 3):S341-S351.
210. Ministerial Council on Drug Strategy. National Tobacco Strategy, 2004-2009 2004.
211. Australian Institute of Health and Welfare. 2007 National Drug Strategy Household Survey-Queensland results (Queensland Health) 2008.
212. Smith D, Leggat PA. Tobacco smoking by occupation in Australia: results from the 2004 to 2005 National Health Survey. Journal of Occupational and Environmental Medicine. 2007;49(4):437-445.
213. Wills R, Coory M. A preliminary look at the rates of cigarette smoking among mothers giving birth in Queensland. Health Statistics Centre, Queensland Health, Information Circular 77. 2008.
214. Laws P, Abeywardana S, Walker J, Sullivan EA. Australia’s mothers and babies 2005. Sydney: AIHW National Perinatal Statistics Series no 20. Cat. no. PER 40; 2007.
215. Australian Institute of Health and Welfare. 2004 National Drug Strategy Household Survey: State and territory supplement. Canberra: Australian Institute of Health and Welfare; 2005. AIHW Cat. no. PHE 61.
216. McDermott L, Russell A, Dobson A, for Department of Health and Ageing. Cigarette smoking among women in Australia: National Tobacco Strategy 1999 to 2002-03 occasional paper; 2002.
217. Queensland Health. Quarterly public hospitals performance report: June quarter. Brisbane 2008.
218. British Medical Association. Smoking and reproductive life. the impact of smoking on sexual, reproductive and child health: Board of Science and Education & Tobacco Control Resource Centre. British Medical Association; 2004.
219. Ward C, Lewis S, Coleman T. Prevalence of maternal smoking and environmental tobacco smoke exposure during pregnancy and impact on birth weight: retrospective study using Millennium Cohort. BioMed Central Public Health. 2007;7:81.
220. Phung H, Bauman A, Nguyen TV, Young L, Tran M, Hillman K,. Risk factors for low birth weight in a socioeconomically disadvantaged population: parity, marital status, ethnicity and cigarette smoking European Journal of Epidemiology. 2003;18:235-243.
221. Cook D, Strachan DP,. Health effects of passive smoking-10: Summary of effects of parental smoking on respiratory health of children and implication for research. Thorax. 1999;54(4):357-366.
222. World Health Organization. Obesity: Preventing and managing the global epidemic. Geneva: WHO; 2000.
223. Cole T, Bellizi MC, Flegal KM, Dietz WH,. Establishing a standard definition for child overweight and obesity worldwide: international survey. British Medical Journal. 2002;320(7244):1240-1243.
224. Wang J. Waist circumference: a simple, inexpensive, and reliable tool that should be included as part of physical examinations in the doctor’s office. American Journal of Clinical Nutrition. 2003;78(5):902-903.
225. Welborn T, Dhaliwal, SS, Bennett, SA. Waist-hip ratio is the dominant risk factor predicting cardiovascular death in Australia. Medical Journal of Australia. 2003;179:580-584.
226. Darmon N, Ferguson E, Briend A. Do economic constraints encourage the selection of energy-dense diets? Appetite. 2003;41:315-322.
227. Chou S-Y, Grossman M, Saffer H. An economic analysis of adult obesity: results from the Behavioural Risk Factor Surveillance System. Journal of Health Economics. 2004;23:565-587.
228. Stubbs C. Determinants of the global obesity epidemic: Contributions of early life, nutrition, physical activity, television, smoking, and economic and social change. In: Ditmier L, ed. New Developments in Obesity Research. New York: Nova Science Publishers, Inc.; 2006.
229. Seidell J, Han T, Feskens E, Lean M. Narrow hips and broad waist circumferences independently contribute to increased risk of non-insulin-dependent diabetes mellitus. Journal of Internal Medicine. 1997;242:401-406.
230. Wei M, Gaskill SP, Haffner SM and Stern MP. Waist circumference as the best predictor of non-insulin-dependent diabetes mellitus compared to BMI, waist/hip ratio over other anthropometric measurements in Mexican Americans: a 7-year prospective study. Obesity. 1997;Res. 5:16-23.
231. Dixon T, Waters AM. A growing problem: trends and patterns in overweight and obesity among adults in Australia, 1980 to 2001. Canberra: Australian Institute of Health and Welfare; 2003. AIHW Cat. no. AUS 36 Bulletin No. 8.
232. Taylor A, Dal Grande E, Gill TK, Chittleborough CR, Wilson DH, Adams RJ, Grant JF, Phillips P, Appleton S, Ruffin RE. How valid are self-reported health and weight? A comparison between CATI self report and clinic measurements using a large cohort study. Australian and New Zealand Journal of Public Health. 2006;30(3):238-246.
233. World Health Organization. Infobase.
234. Queensland Health. Eat well, be active: healthy kids for life. The Queensland Government’s first action plan 2005-2008. Brisbane: Queensland Health; 2005.
235. Csabi G, Torok K, Jeges S, Molnar D. Presence of metabolic cardiovascular syndrome in obese children. European Journal of Pediatrics. 2000;159:91-94.
236. Sinha R, Fisch G, Teague B, Tamborlane WV, Banyas B, Allen K, Savoye M, Rieger V, Taksali S, Barbetta G, Sherwin RS, Caprio S. . Prevalence of impaired glucose tolerance among children and adolescents with marked obesity. New England Journal of Medicine. 2002;346:802-810.
237. Ong K, Dunger DB. Birth weight, infant growth and insulin resistance. European Journal of Endocrinology. 2004;151(Suppl 3):U131-139.
238. Olshansky S, Passaro DJ, Hershow RC, Layden J, Carnes BA, Brody J, Hayflick L, Butler RN, Allison DB, Ludwig DS,. A potential decline in life expectancy in the United States in the 21st century. New England Journal of Medicine. 2005;352:1138-1145.

Report of the Chief Health Officer Queensland Prevention of Chronic Disease
141
66
239. World Health Organization. Obesity and Overweight: WHO Global Strategy on Diet, Physical Activity and Health. Geneva 2003.
240. Marks G, Coyne T, Pang G. Type 2 diabetes costs in Australia-the potential impact of changes in diet, physical activity and levels of obesity. Canberra: Commonwealth Department of Health and Ageing; 2002.
241. National Health and Medical Council. Clinical Practice Guidelines for the Management of Overweight and Obesity in Adults. Canberra: NHMRC, Commonwealth of Australia; 2003.
242. Queensland Public Health Forum. Eat Well Queensland: 2002-2012 Smart Eating for a Healthier State. Brisbane: Queensland Public Health Forum; 2002.
243. Australian Bureau of Statistics. National Nutrition Survey - Nutrient Intakes and Physical Measurements, Australia 1995. Canberra: Australian Bureau of Statistics and Commonwealth Department of Health and Aged Care; 1995. Cat. no. 4805.0.
244. Australian Institute of Health and Welfare. Indicators for chronic diseases and their determinants 2008. Canberra, AIHW 2008.
245. Baghurst P, Beaumont-Smith N, Baghurst K, Cox D. The relationship between the consumption of fruits and vegetables and health status. Report to Department of Health and Aged Care and the Strategic Intergovernmental Nutrition Alliance 1999.
246. Joshipura KJ, Hu F B, Manson J E, Stamfer M J, Rimm E B, Speizer F E, Colditz G A, Ascherio A, Rosner B, Spiegelman D, Willett W C,. The effect of fruit and vegetable intake on risk for coronary heart disease. Annals of Internal Medicine. 2001;134(12):1106-1114.
247. Ip S, Chung M, Raman G, Chew P, Magula N, DeVine D, Trikalinos T, Lau J. Breastfeeding and maternal and infant health outcomes in developed countries. Evidence Report/Technology Assessment. 2007;153(April):1-186.
248. Horta B, Bahl R, Martines J, Victora C. Evidence on the long-term effects of breastfeeding: Systematic reviews and meta-analyses. Geneva: World Health Organization; 2007.
249. World Health Organization, ed. Evidence on the long-term effects of breastfeeding. Systematic reviews and meta-analyses: World Health Organization; 2007. Horta B, Bahl R, Martines J, Victora C, ed.
250. Queensland Health. Optimal infant nutrition: evidence-based guidelines 2003-2008. Brisbane: Queensland Health; 2003.
251. Drewnowski A. The real contribution of added sugars and fats to obesity. Epidemiologic Reviews. 2007;29:160-171.
252. Queensland Government. The 2006 Healthy Food access Basket (HFAB) Survey. Brisbane: Queensland Health and Queensland Treasury; 2006.
253. Queensland Health. Perinatal statistics. Brisbane: Health Statistics Centre, Reform and Development Division, Queensland Health.
254. Queensland Health. Infant Nutrition Survey. Brisbane: Population Health Branch; 2008.
255. Ros Gabriel, Gayle Pollard, Ghazala Suleman, Terry Coyne, Helen Vidgen. Infant and child nutrition in Queensland 2003: summary report. Brisbane: Queensland Health; 2005.
256. Queensland Health. Infant and child nutrition survey. Brisbane: Health Information Centre, Queensland Health; 2003.
257. Australian Bureau of Statistics. National Aboriginal and Torres Strait Islander Health Survey. Canberra: Australian Bureau of Statistics; 2004/05. Cat. No. 4715.3.55.005
258. Australian Bureau of Statistics. National Health Survey: Summary Results, Australian States and Territories. Canberra: Australian Bureau of Statistics; 1995. Cat. no. 4368.0.
259. Australian Bureau of Statistics. Breastfeeding in Australia. Canberra: Australian Bureau of Statistics; 2003. Cat.no. 4810.0.55.001.
260. Queensland Health. Omnibus survey program.
261. Rayner M, Scarborough P. The burden of food related ill health in the UK. Journal of Epidemiology and Community Health. 2005;59:1054-1057.
262. Healy GN, Wijndaele K, Dunstan DW, et al. Objectively measured sedentary time, physical activity, and metabolic risk: The Australian Diabetes, Obesity and Lifestyle Study (AusDiab). Diabetes Care. February 1, 2008 2008;31(2):369-371.
263. Owen N, Leslie E, Salmon J, Fotheringham MJ Environmental determinants of physical activity and sedentary behavior. Exercise and Sport Sciences Reviews. 2000;28:153 – 158.
264. Brisbane City Council. Brisbane Active Transport Strategy: Walking and Cycling Plan 2005-2010.
265. Bauman A, Bellow B, Vita P Brown W, Owen N. Getting Australia active. Towards better practice for the promotion of physical activity. Melbourne: National Public Health Partnership; 2002.
266. Lilly K, Hall L, Davis J, Stumer L, . Healthy neighbourhoods. A report on physical activity, local environments and food habits on the Sunshine Coast and Cooloola: Central Area Population Health Services, Queensland Health 2008.
267. Heath G, Brownson RC, Kruger J, Miles R, Powell KE, Ramsey LT and the Task Force on Community Preventive Services,. The effectiveness of urban design and land use and transport policies and practices to increase physical activity: A systematic review. Journal of Physical Activity and Health. 2006;3(Suppl 1):S55-S76.
268. Booth M, Okely AD, Denney-Wilson E, Hardy L, Yang B, Dobbins T. NSW Schools physical activity and nutrition survey (SPANS) 2004: Full report. Sydney: NSW Department of Health; 2006.
269. United States Department of Health and Human Services. The Surgeon General’s report on physical activity and health. Washington, DC: US Government Printing Office; 1996.
270. Brown D, Blanton C. Physical activity, sport participation, and suicidal behaviour among college students. Medicine and Science in Sports and Exercise. 2001:1087-1096.
271. Econtech Estimates - Medibank. The cost of physical inactivity. What is the lack of participation in physical activity costing Australia? 2007.
Report of the Chief Health Officer Queensland
142
Prevention of Chronic Disease
272. National Health and Medical Research Council. Australian alcohol guidelines: health risks and benefits. Canberra: National Health and Medical Research Council; 2001.
273. Queensland Government. Queensland Drug Strategy 2006-2010. Brisbane: Queensland Government; 2006.
274. Ministerial Council on Drug Strategy. National Alcohol Strategy 2006-2009. Canberra: Commonwealth of Australia; 2006.
275. Australian Bureau of Statistics, Australian Institute of Health and Welfare The health and welfare of Australia’s Aboriginal and Torres Strait Islander peoples. Canberra 2008. Cat. no 4704.0 AIHW Cat. no. IHW 21.
276. Chikritzhs T, Pascal R,. Trends in youth alcohol consumption and related harms in Australian jurisdiction, 1990-2002. Perth: National Drug Research Institute; 2004. National alcohol indicators bulletin no. 6.
277. Queensland Government. Young Women and Alcohol Campaign. Brisbane: Queensland Health; 2004.
278. Elliot & Shanahan (E&S) Research. A study of attitudes and behaviours of drinkers at risk (Research Report). Canberra: Commonwealth of Australia; 2002.
279. Australian Institute of Health and Welfare. 2004 National Drug Strategy Household Survey: first results. Canberra: Australian Institute of Health and Welfare; 2005. Drug Statistics Series 13.
280. Elmer P, Obarzanek E, Vollmer WM, Simons-Morton D, Stevens VJ, Young DR, Lin PH, Champagne C, Svetkey LP, Ard J, Brantley PJ, Proschan MA, Erlinger TP, Appel LJ. Effects of comprehensive lifestyle modification on diet, weight, physical fitness, and blood pressure control: 18-month results of a randomised trial. Annals Internal Medicine. 2006;144(7):485-495.
281. Australian Institute of Health and Welfare. High blood pressure. 8 December 2004 http://www.aihw.gov.au/riskfactors/bloodpressure.cfm.
282. Australian Institute of Health and Welfare. Penm E. Cardiovascular disease and its associated risk factors in Aboriginal and Torres Strait Islander peoples. Cat. no. CVD 41. Cardiovascular disease series no. 29. Canberra: AIHW; 2008.
283. Barr E, Magliano DJ, Zimmet PZ, Polkinghorne KR, Atkins RC, Dunstan DW, Murray SG, Shaw JE. AusDiab 2005 The Australian Diabetes, Obesity and Lifestyle Study. Melbourne: International Diabetes Institute; 2006.
284. International Society of Hypertension. International Society of Hypertension (ISH): Statement on blood pressure lowering and stroke prevention. Journal of Hypertension. 2003;21(4):651-663.
285. Dunford E, Webster J. Drop the salt. Intouch newsletter of the Public Health Association of Australia Inc. Vol 25; 2008:8.
286. National Heart Foundation of Australia. Position Statement Phytosterol/stanol enriched foods; 2007.
287. Lawes C, Hoorn S, Law M, Rodgers A. High Cholesterol. In: Ezzati M, Lopez A, Rodgers, A, Murray C, ed. Comparative Quantification of Health Risks. Geneva: World Health Organization; 2008.
288. Huxley R, Neal B, Clifton P, Perkovic V, Woodward M. How many Australian deaths from heart disease and stroke could be avoided by a small reduction in population cholesterol levels? Paper presented at the Population Health Congress, Brisbane 2008: The George Institute for International Health, NSW; 2008.
289. Hertzman C, Power C,. Health and human development: understandings from life-course research. Developmental Neuropsychology. 2003;24(2&3):719-744.
290. Baghurst P. The impact of early life on the subsequent development of chronic disease. Public Health Bulletin, Department of Health, South Australia. 2006;3:12.
291. Usherwood T. Chronic illness in the middle years. Medical Journal of Australia. 2003;179(5):239.
292. Access Economics. Dementia estimates and projections: Australian states and territories. Report for Alzheimer’s Australia: Access Economics Pty Limited; 2005.
293. Marmot M, Wilkinson R,. Social determinants of health: Oxford University Press; 2006.
294. National Public Health Partnership (NPHP). The national injury prevention and safety promotion plan: 2004-2014. Canberra: National Public Health Partnership; 2004.
295. UNICEF. Child poverty in rich countries 2005. Florence: UNICEF Innocenti Research Centre; 2005. Innocenti Report Card no. 6
296. Clifford TJ. A Life Course Approach to Women’s Health (doi: 10.1136/bmj.326.7394.887). British Medical Journal. 2003;326 887.
297. Australian Bureau of Statistics. Australian Social Trends-Data cube. Canberra: Australian Bureau of Statistics; 2007. Cat. no. 4102.0.
298. Cherrell Hirst. Re-birthing. Report of the Review of Maternity Services in Queensland 2005.
299. Rajaleid K, Manor O, Koupil I. Does the strength of the association between foetal growth rate and ischaemic heart disease mortality differ by social circumstances in early or later life? Journal of Epidemiology and Community Health. May 1 2008;62(5):e6-e6.
300. Barker D. The fetal origins of coronary heart disease. European Heart Journal, The European Society of Cardiology. 1997;18:883-884.
301. Kramer M. Invited commentary: Association between restricted fetal growth and adult chronic disease: Is it causal? Is it important? . American Journal of Epidemiology. 2000;152(7):605-608.
302. Eriksson J, Osmond C, Kajantie E, Forsen TJ, Barker DJP Patterns of growth among children who later develop type 2 diabetes or its risk factors. (doi:10.1007/s00125-006-0459-1). Diabetologica. 2006;49(12):2853-2858.
303. Queensland Government. Smart Choices - Healthy Food and Drink Supply Strategy for Queensland Schools. Brisbane: Queensland Government; 2004.
304. Queensland Health. Growing Strong - Feeding You and Your Baby Manual. Brisbane: Queensland Government; 2002.
305. Stettler N. Nature and strength of epidemiological evidence for origins of childhood obesity in the first year of life. International Journal of Obesity. 2007; 31:1035-1043.
Report of the Chief Health Officer Queensland Prevention of Chronic Disease
143
66
306. National Health and Medical Research Centre. Infant feeding guidelines. Canberra 2002.
307. Paediatrics & Child Health Division. Health Policy Unit. Breastfeeding. Sydney: Royal Australasian College of Physicians; 2001.
308. The Australian Food and Nutrition Monitoring Unit. Towards a national system for monitoring breastfeeding in Australia. Canberra: Commonwealth Department of Health and Aged Care; 2001.
309. Amir L, Donath SM. Socioeconomic status and rates of breastfeeding in Australia: evidence from three national health surveys. Medical Journal of Australia. 2008;189(5):254-256.
310. Lieberman E GI, Lang JM, Cohen AP,. Low birthweight at term and timing of fetal exposure to maternal smoking. American Journal of Public Health. 1994;84(7):1127-1131.
311. Australian Institute of Health and Welfare. Australia’s mothers and babies. Sydney: Australian Institute of Health and Welfare; 2005. AIHW Cat. no. PER 40.
312. Office of Economic and Statistical Research, Queensland Treasury,. Age-specific fertility rates (a) and total fertility rates (b), Queensland, 1947 to 2006; 2008.
313. Maciosek M, Coffield AB, Edwards NM, Flottemesch TJ, Goodman MJ, Solberg LI. Priorities among effective clinical preventive services. Results of a systematic review and analysis. American Journal of Preventive Medicine. 2006;pre-publication.
314. Medicare Australia. The Australian Childhood Immunisation Register (ACIR). www.hic.gov.au.
315. Coory M. Can a mortality excess in remote areas of Australia be explained by indigenous status? A case study using neonatal mortality in Queensland Australian & New Zealand Journal of Public Health 2003;27 (4):425-427.
316. Australian Institute of Health and Welfare. Maternal deaths in Australia 2003-2005. Canberra: Australian Institute of Health and Welfare; 2008. Cat. no. PER 42.
317. Johnston T, Coory M. Trends in perinatal mortality, birthweight and gestational age among Aboriginal, Torres Strait Islander, and non Indigenous babies in Queensland. Brisbane: Health Information Branch, Queensland Health; 2004. Information Circular 67.
318. Productivity Agenda Working Group. A national quality framework for early childhood education and care. A discussion paper 2008.
319. Australian Bureau of Statistics. Population by age and sex, Australian States and Territories. Canberra: Australian Bureau of Statistics; 2008. Cat. no. 3201.0.
320. Australian Institute of Health and Welfare. Australia’s Health 2008. Canberra: AIHW. Cat. no. AUS 99.
321. Australian Bureau of Statistics. Disability, ageing and carers: summary of findings, 2003. Canberra: ABS; 2004. ABS Cat. no. 4433.0.
322. Armfield J, Roberts-Thomson K, Spencer A. The Child Dental Health Survey, Australia 1999. AIHW Cat. no. DEN 95. Adelaide: The University of Adelaide; 2003.
323. Najman J, Aird R, Bor W, O’Callaghan M, Williams G, Shuttlewood G. The generational transmission of socioeconomic inequalities in child cognitive development and emotional health. Social Science and Medicine. 2004;58:1147-1158.
324. Australian Institute of Health and Welfare. Key national indicators of children’s health, development and wellbeing. Canberra: Australian Institute of Health and Welfare; 2008. Bulletin 58.
325. National Health and Medical Research Council. The health effects of passive smoking: a scientific information paper. Canberra: AGPS; 1997.
326. Armstrong R, Waters E, David E, Harper C, Priest N. The development of evidence based recommendations to support policy and practice (executive summary). Brisbane: Queensland Health; 2007.
327. van Zutphen M, Bell A, Kremer P and Swinburn B. Association between the family environment and television viewing in Australian children. Journal of Paediatrics and Child Health. 2007;43:458-463.
328. Morley B. National community survey of TV food advertising to children for Coalition on Food Advertising to Children. Victoria: The Cancer Council Victoria; 2007.
329. Queensland Health. Child health survey. Brisbane: Queensland Health; 2008.
330. Communicable Disease Branch Queensland Health. July 2008.
331. Department of Health and Ageing. Medicare Healthy Kids Check Fact Sheet: Australian Government; 2008.
332. Australian Government: Department of Health and Ageing. Medicare Benefits Schedule. Aboriginal and Torres Strait Islander Health Checks. Medicare items 708 (child) and 710 (adult) http://www9.health.gov.au/mbs/
333. Australian Bureau of Statistics. Census of population and housing. Canberra: Australian Bureau of Statistics; 2006. Cat. no. 2015.0.
334. Dimitrakaki C, Tountas Y,. Health education for youth. Paediatric Endocrinology Review. 2006;3(1):222-225.
335. Queensland Government: Department of Education Training and the Arts. Smart moves-physical activity programs in Queensland State schools. Brisbane: Department of Education Training and the Arts; Local Government, Sport and recreation; Queensland Health; 2007.
336. Queensland Health. Queensland Young Adults Longitudinal Study 2005. Research findings. Brisbane: Population Health Branch; 2008.
337. Queensland Health. Omnibus Survey. Brisbane: Epidemiology Services Unit, Health Information Centre, Queensland Health; 2005.
338. Australian Institute of Health and Welfare. 2007 National Drug Strategy Household Survey. Canberra: Australian Institute of Health and Welfare; 2008.
339. Queensland Health: Begg S, Khor SL, Bright M, Stanley L, O’Brien J, Harper C. Leading causes of burden of disease and injury in Queensland, 2003. Brisbane: Queensland Health; 2008. Queensland Burden of Disease and Injury circular series 1, no 2.

Report of the Chief Health Officer Queensland
144
Prevention of Chronic Disease
340. Knapp M, McDaid D, Mossialos E, Thornicroft G,. Mental health policy and practice across Europe: The future direction of mental health European Observatory on Health Systems and Policies Series: Open University Press; 2007.
341. Australian Bureau of Statistics. Health of mature age workers in Australia: A snapshot 2004-05: Australian Bureau of Statistics; 2008. Cat. no. 4837.0.55.001.
342. Australian Government Medicare Australia. Medicare Benefits Schedule (MBS). https://www.medicareaustralia.gov.au/provider/medicare/mbs.shtml.
343. Chan A, Amoroso C, Harris M. New 45-49 year health checks. Australian Family Physician. 2008;37(9):765-768.
344. Queensland Health. Quality Management Plan - Queensland Bowel Cancer Screening Program. Endorsed by Quality Management Committee 23 February 2006.
345. Queensland Health. BreastScreen Queensland. Brisbane: Cancer Screening Services Unit, Population Health Branch, Queensland Health.
346. Australian Institute of Health and Welfare. Cervical screening in Australia 2005-2006. Canberra: Australian Institute of Health and Welfare; 2008. Cat. no. CAN 36.
347. Queensland Health. Omnibus Survey. Brisbane: Epidemiology Services Unit, Health Information Centre, Queensland Health; 2004.
348. Australian Institute of Health and Welfare. Older Australians at a glance. Canberra: Australian Institute of Health and Welfare; 1997. AIHW Cat. no. AGE 4.
349. Elgie R, Crown J, Tremblay M. A long life - and all of it healthy: the ideal of healthy ageing in Europe. Eurohealth. 2005;11(4):15-20.
350. Leggo M, Banks M, Isenring E, Stewart L, Tweeddale M,. A quality improvement nutrition screening and intervention program available to Home and Community Care eligible clients. Nutrition & Dietetics. 2008;65(2):162-167.
351. Banks M, Ash S, Bauer J, Gaskill D,. Prevalence of malnutrition in adults in Queensland public hospitals and residential aged care facilities. Nutrition and Dietetics. 2007;64(3):172-178.
352. Doll R, Peto R, Boreham J, Sutherland I,. Mortality in relation to smoking: 50 years’ observations on male British doctors. British Medical Journal. 2004;328:1519.
353. Patterson R, Frank LL, Kristal AR, White E,. A comprehensive examination of health conditions associated with obesity in older adults. American Journal of Preventive Medicine. 2004;27(5):385-390.
354. The Cancer Council Australia. Prostate cancer screening position statement April. 2005.
355. Russell L, Boxall A, . Prevention quality better than quantity. The Weekend Australian July 26-27, 2008.
356. Russell L. A primary care reform agenda for Australia. Discussion paper Menzies Foundation Fellow. : Menzies Centre for Health Policy; 2008.
357. Queensland Public Health Forum. Be active Queensland 2006-2010. Brisbane 2006.
358. Rose G, Day S,. The population mean predicts the number of deviant individuals. British Medical Journal. 1990;301:1031-1034.
359. Johnston T, Muller S, Harper C, Bright M, McClintock C. Socioeconomic-based mortality differentials in Queensland, 1991-1993 and 2001-2003. Brisbane: Health Information Branch, Queensland Health; 2006. Information Circular 73.
360. Melchior M, Moffitt TE, Milne BJ, Poulton R, Caspi A, . Why do children from socioeconomically disadvantaged families suffer from poor health when they reach adulthood? A life-course study. American Journal of Epidemiology. 2007;166(8):966-974.
361. Power C, Atherton K, Strachan DP, Shepherd P, Fuller E, Davis A, Gibb I, Kumari M, Lowe G, Macfarlane GJ, Rahi J, Rodgers B, Stansfeld S,. Life-course influences on health in British adults: effects of socio-economic position in childhood and adulthood. International Journal of Epidemiology. 2007;36(3):532-539.
362. Australian Bureau of Statistics. Socioeconomic Indexes for Areas. Canberra: Australian Bureau of Statistics; 2006. Cat. no. 2039.0.
363. Steering Committee for the Review of Government Service Provision (SCRGSP). Overcoming Indigenous disadvantage. Key indicators 2007. Canberra: Productivity Commission; 2007.
364. Office of Economic and Statistical Research, Queensland Treasury, and Statistical & Library Services Centre, Queensland Health,. 2006 Experimental Indigenous estimated resident populations by ages, sex and Statistical Local Areas - Queensland as at 30 June 2006.
365. Kennedy B, Firman D. Indigenous SEIFA-revealing the ecological fallacy. Paper presented at: Australian Population Association conference, 2004; Canberra.
366. Steering Committee for the Review of Government Service Provision (SCRGSP). Overcoming Indigenous disadvantage: Key indicators 2005. Canberra: Productivity Commission; 2005.
367. Australian Government Department of Health and Ageing. National Strategic Framework for Aboriginal and Torres Strait Islander Health 2003-2013. Australian Government Implementation Plan. Canberra 2003.
368. Queensland Government. Estimated resident population by local government area, Queensland, 1997 to 2007 (preliminary). Brisbane: Queensland Treasury; 2008.
369. Australian Bureau of Statistics. Census of population and housing. Canberra: Australian Bureau of Statistics; 2001. Cat. no. 2015.0.
370. Australian Government. The health requirement. Canberra: Department of Immigration and Citizenship; 2007. Factsheet 22.
371. Australian Government: Department of Immigration and Citizenship. The guide: implementing the standards for Statistics on Cultural and Linguistic Diversity. Canberra: Department of Immigration and Citizenship 2007.
372. Centers for Disease Control and Prevention. Preventing chronic disease: Investing wisely in health. 2005.
373. Heirich M. Rethinking health care. Innovation and change in America. Boulder, Colorado: Westview Press; 1999.
374. Ministerial Council on Drug Strategy. The national drug strategy-Australia’s integrated framework 2004-2009. Canberra: Australian Government; 2004.

Report of the Chief Health Officer Queensland Prevention of Chronic Disease
145
66
375. World Bank: (O Adeyi O Smith and S Robles). Public policy and the challenge of chronic noncommunicable diseases, Washington DC: World Bank 2007.
376. Wakefield M, Miller C,. Australia’s national tobacco campaign. Evaluation report. Volume 1: Commonwealth Department of Health and Ageing; 1999.
377. Queensland Health. Smokecheck evaluation report. Brisbane: Centre for Drug and Alcohol Studies, Alcohol and Drug Service, Northside Health Service District; 2006.
378. Australian Institute of Health and Welfare-prepared for Queensland Health. 2004 National Drug Strategy Household Survey. Selected results for Queensland. Canberra: Australian Institute of Health and Welfare; 2005.
379. Queensland Health: Begg S, Khor SL, Bright M, Stanley L, O’Brien J, Harper C. Overview of the burden of disease and injury in Queensland, 2003. Brisbane: Queensland Health; 2008. Queensland Burden of Disease and Injury circular series 1, no 1
380. Victorian Government Department of Human Services. ACE-obesity. Assessing cost-effectiveness of obesity interventions in children and adolescents. Summary of results 2006.
381. Queensland Health. The Aboriginal and Torres Strait Islander nutrition and physical activity brief intervention program. Final evaluation report.: Tropical Population Health Network; 2008.
382. Australian Government Department of Health and Ageing. Australia’s physical activity recommendations for children and young people. Canberra: Australian Government; 2005.
383. Brown W, Mummery K, Eakin E, Schofield G, . 10,000 Steps Rockhampton: evaluation of a whole of community approach to improving population levels of physical activity. Journal of Physical Activity Health. 2006;3(1):1-14.
384. Australian Government Department of Health and Ageing. Australia’s Bowel Cancer Screening Pilot and Beyond Final Evaluation Report Canberra 2005.
385. Queensland Government. Making Queenslanders Australia’s healthiest people. Advancing Health Action. 2008.
386. Productivity Commission. Economic implications of an ageing Australia. Canberra: Research Report; 2005.
387. Gross P, Leeder SR, Lewis MJ. Australia confronts the challenge of chronic disease. Medical Journal of Australia. 2003;179:233-234.
388. Medibank Private. Sick at work: the cost of presenteeism to your business, employees and the economy: Medibank Private; 2007.
389. Marmot M. Commission on Social Determinants of Health. Achieving health equity: from root causes to fair outcomes. Lancet. 2007;370(9593):1153-1163
390. Victorian Health Promotion Foundation. Background Paper to VicHealth Position Statement on Health Inequalities. Melbourne: Victorian Health Promotion Foundation; 2005.
391. Ezzati M, Friedman AB, Kulkarni, SC, Murray C. The reversal of fortunes: trends in county mortality and cross-county mortality disparities in the United States. PLoS Med. April 2008;5(4):e66 doi: 10.1371/journal.pmed.0050066.
392. Queensland Health. Social determinants of health: The role of public health services. Brisbane 2001.
393. Draper G, Turrell G, Oldenburg B. Health inequalities in Australia: Mortality. Canberra: Queensland Institute of Technology and Australian Institute of Health and Welfare; 2004. AIHW Cat no. PHE 55.
394. World Health Organization. The Ottawa Charter for Health Promotion. First International Conference on Health Promotion, Ottawa, 21 November 1986: World Health Organization; 1986.
395. Turrell G, Lynch JW, Leite C, Raghunathan T, Kaplan GA. Socioeconomic disadvantage in childhood and across the life course and all-cause mortality and physical function in adulthood: evidence from the Alameda County Study Journal of Epidemiology and Community Health. 2007;61(8):723-730.
396. Productivity Agenda Working Group. Education, skills, training and early childhood development. A national quality framework for early childhood education and care – a discussion paper. Canberra 2008.
397. Organisation for Economic Co-operation and Development (OECD). Education at a glance. Paris: OECD; 2007.
398. Wilson A, Oldenburg BF, Lopez AD. Targeted approaches for reducing inequalities in chronic disease. Medical Journal of Australia. 2003;179:231-232.
399. Macintyre S. Prevention and the reduction of health inequalities. British Medical Journal. 2000;320:1399-1400.
400. Queensland Health. ICD coding standards: reference codesets for major health indicators. 2005. Brisbane: Health Information Branch and Public Health Services Branch, Queensland Health; 2005.
401. Hardes and Associates. Acute inpatient model.
402. Australian Bureau of Statistics. Socioeconomic Indexes for Areas. Canberra: Australian Bureau of Statistics; 2001. Cat. no. 2039.0.
403. Australian Bureau of Statistics. Information Paper. Socioeconomic Indexes for Areas. Canberra: Australian Bureau of Statistics; 2001. Cat. no. 2039.0.
404. Australian Institute of Health and Welfare:, Moon l, Waters A-M. Socioeconomic inequalities in cardiovascular disease in Australia: current picture and trends since the 1990s. Bulletin no. 37. Canberra: Australian Institute of Health and Welfare; 2006. AIHW cat. no. AUS 74.
405. Australian Bureau of Statistics. Australian Standard Geographical Classification (ASGC). Canberra: Australian Bureau of Statistics; 2002. Cat no. 1216.0.