Are PCB Levels in Fish from the Canadian Great Lakes Still ...labs.eeb.utoronto.ca/jackson/Bhavsar...
14
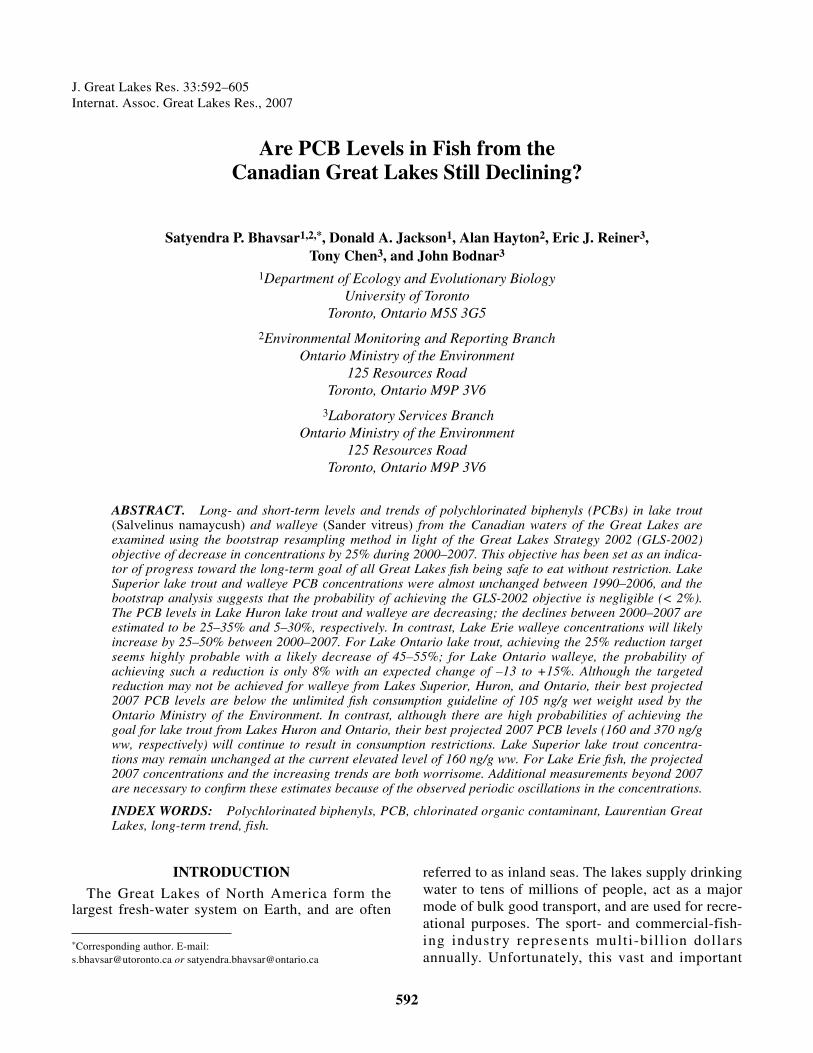
Are PCB Levels in Fish from the Canadian Great Lakes Still Declining? Satyendra P. Bhavsar 1,2,* , Donald A. Jackson 1 , Alan Hayton 2 , Eric J. Reiner 3 , Tony Chen 3 , and John Bodnar 3 1 Department of Ecology and Evolutionary Biology University of Toronto Toronto, Ontario M5S 3G5 2 Environmental Monitoring and Reporting Branch Ontario Ministry of the Environment 125 Resources Road Toronto, Ontario M9P 3V6 3 Laboratory Services Branch Ontario Ministry of the Environment 125 Resources Road Toronto, Ontario M9P 3V6 ABSTRACT. Long- and short-term levels and trends of polychlorinated biphenyls (PCBs) in lake trout (Salvelinus namaycush) and walleye (Sander vitreus) from the Canadian waters of the Great Lakes are examined using the bootstrap resampling method in light of the Great Lakes Strategy 2002 (GLS-2002) objective of decrease in concentrations by 25% during 2000–2007. This objective has been set as an indica- tor of progress toward the long-term goal of all Great Lakes fish being safe to eat without restriction. Lake Superior lake trout and walleye PCB concentrations were almost unchanged between 1990–2006, and the bootstrap analysis suggests that the probability of achieving the GLS-2002 objective is negligible (< 2%). The PCB levels in Lake Huron lake trout and walleye are decreasing; the declines between 2000–2007 are estimated to be 25–35% and 5–30%, respectively. In contrast, Lake Erie walleye concentrations will likely increase by 25–50% between 2000–2007. For Lake Ontario lake trout, achieving the 25% reduction target seems highly probable with a likely decrease of 45–55%; for Lake Ontario walleye, the probability of achieving such a reduction is only 8% with an expected change of –13 to +15%. Although the targeted reduction may not be achieved for walleye from Lakes Superior, Huron, and Ontario, their best projected 2007 PCB levels are below the unlimited fish consumption guideline of 105 ng/g wet weight used by the Ontario Ministry of the Environment. In contrast, although there are high probabilities of achieving the goal for lake trout from Lakes Huron and Ontario, their best projected 2007 PCB levels (160 and 370 ng/g ww, respectively) will continue to result in consumption restrictions. Lake Superior lake trout concentra- tions may remain unchanged at the current elevated level of 160 ng/g ww. For Lake Erie fish, the projected 2007 concentrations and the increasing trends are both worrisome. Additional measurements beyond 2007 are necessary to confirm these estimates because of the observed periodic oscillations in the concentrations. INDEX WORDS: Polychlorinated biphenyls, PCB, chlorinated organic contaminant, Laurentian Great Lakes, long-term trend, fish. J. Great Lakes Res. 33:592–605 Internat. Assoc. Great Lakes Res., 2007 INTRODUCTION The Great Lakes of North America form the largest fresh-water system on Earth, and are often * Corresponding author. E-mail: [email protected] or [email protected] 592 referred to as inland seas. The lakes supply drinking water to tens of millions of people, act as a major mode of bulk good transport, and are used for recre- ational purposes. The sport- and commercial-fish- ing industry represents multi-billion dollars annually. Unfortunately, this vast and important
Transcript of Are PCB Levels in Fish from the Canadian Great Lakes Still ...labs.eeb.utoronto.ca/jackson/Bhavsar...
Are PCB Levels in Fish from theCanadian Great Lakes Still Declining?
Satyendra P. Bhavsar1,2,*, Donald A. Jackson1, Alan Hayton2, Eric J. Reiner3,Tony Chen3, and John Bodnar3
1Department of Ecology and Evolutionary BiologyUniversity of Toronto
Toronto, Ontario M5S 3G5
2Environmental Monitoring and Reporting BranchOntario Ministry of the Environment
125 Resources RoadToronto, Ontario M9P 3V6
3Laboratory Services BranchOntario Ministry of the Environment
125 Resources RoadToronto, Ontario M9P 3V6
ABSTRACT. Long- and short-term levels and trends of polychlorinated biphenyls (PCBs) in lake trout(Salvelinus namaycush) and walleye (Sander vitreus) from the Canadian waters of the Great Lakes areexamined using the bootstrap resampling method in light of the Great Lakes Strategy 2002 (GLS-2002)objective of decrease in concentrations by 25% during 2000–2007. This objective has been set as an indica-tor of progress toward the long-term goal of all Great Lakes fish being safe to eat without restriction. LakeSuperior lake trout and walleye PCB concentrations were almost unchanged between 1990–2006, and thebootstrap analysis suggests that the probability of achieving the GLS-2002 objective is negligible (< 2%).The PCB levels in Lake Huron lake trout and walleye are decreasing; the declines between 2000–2007 areestimated to be 25–35% and 5–30%, respectively. In contrast, Lake Erie walleye concentrations will likelyincrease by 25–50% between 2000–2007. For Lake Ontario lake trout, achieving the 25% reduction targetseems highly probable with a likely decrease of 45–55%; for Lake Ontario walleye, the probability ofachieving such a reduction is only 8% with an expected change of –13 to +15%. Although the targetedreduction may not be achieved for walleye from Lakes Superior, Huron, and Ontario, their best projected2007 PCB levels are below the unlimited fish consumption guideline of 105 ng/g wet weight used by theOntario Ministry of the Environment. In contrast, although there are high probabilities of achieving thegoal for lake trout from Lakes Huron and Ontario, their best projected 2007 PCB levels (160 and 370 ng/gww, respectively) will continue to result in consumption restrictions. Lake Superior lake trout concentra-tions may remain unchanged at the current elevated level of 160 ng/g ww. For Lake Erie fish, the projected2007 concentrations and the increasing trends are both worrisome. Additional measurements beyond 2007are necessary to confirm these estimates because of the observed periodic oscillations in the concentrations.
INDEX WORDS: Polychlorinated biphenyls, PCB, chlorinated organic contaminant, Laurentian GreatLakes, long-term trend, fish.
J. Great Lakes Res. 33:592–605Internat. Assoc. Great Lakes Res., 2007
INTRODUCTION
The Great Lakes of North America form thelargest fresh-water system on Earth, and are often
*Corresponding author. E-mail: [email protected] or [email protected]
592
referred to as inland seas. The lakes supply drinkingwater to tens of millions of people, act as a majormode of bulk good transport, and are used for recre-ational purposes. The sport- and commercial-fish-ing industry represents multi-billion dollarsannually. Unfortunately, this vast and important
PCB Levels in Fish from the Canadian Great Lakes 593
freshwater system has been impaired by elevatedconcentrations of bioaccumulative, toxic, and per-sistent organic pollutants (POPs) and other stressors(Environment Canada and U.S.EPA. 2003).
Contamination of the Great Lakes with polychlo-rinated biphenyls (PCBs) began in the 1930s whenPCBs were first synthesized, and peaked in the1960s–70s (Tanabe 1988). PCBs were used exten-sively in a wide range of applications, including di-electric fluids for capacitors and transformers, heattransfer and hydraulic fluids, lubricating and cuttingoils, and as additives in pesticides, paints, paper, ad-hesives, sealants, and plastics. In the 1970s, PCBproduction was effectively banned in North Americaand the use of PCBs declined. It is well documentedthat the levels of PCBs in the Great Lakes declinedrapidly during the late 1970s and 1980s (Baumannand Whittle 1988, Jeremiason et al. 1994, Swack-hamer 2005); however, the rate of decrease dimin-ished in the 1990s (De Vault et al. 1996, Hickey etal. 2006).
Although the current levels of PCBs are lowcompared to the historical peak values, they remainof concern due to the potential health risk theypose, especially to humans. This is evident from thelarge number of PCB-driven fish consumption advi-sories placed for most of the locations in andaround the Great Lakes (U.S.EPA 2003, MOE2005a). As such, it is important to monitor thetrends of PCB levels in the Great Lakes and to as-sess if the system is responding positively to vari-ous contamination abatement strategies that arebeing implemented.
Biomonitors have been used as valuable indica-tors of ecosystem health. This is because water con-centrations of contaminants are highly variable andsediment concentrations are spatially heteroge-neous. In contrast, fish integrate temporal and spa-tial variability over the area they travel and can actas cost-effective surrogates over the long term (DeVault et al. 1996). Short-lived fish species such asspottail shiners (Notropis hudsonius) are generallyused as biomonitors for site-specific assessments(Suns et al. 1993, Scheider et al. 1998), while toppredators such as lake trout (Salvelinus namaycush)are monitored to assess lake-wide conditions(Bentzen et al. 1999). Although fish concentrationsrespond slowly to changes in water concentrationsand thereby external loadings, they can portray anoverall condition of the aquatic system by encom-passing both water and sediment concentrationsthrough pelagic and benthic exposure. In addition,fish are the primary link for contaminant transfer
from an aquatic system to humans and wildlife.Therefore, long-term biomonitoring programs havebeen recognized as a valuable tool for assessing po-tential hazards associated with contaminant levelsin aquatic systems, understanding contaminant dy-namics, developing predictive models, and deter-mining the effectiveness of regulatory strategies(Mackay 1989, Bentzen et al. 1999, Carlson andSwackhamer 2006).
The U.S. Policy Committee (USPC) created theGreat Lakes Strategy 2002 (GLS-2002) to advancethe restoration and protection of the Great LakesBasin Ecosystem (U.S.EPA 2002). In order to quan-tify progress toward the long-term goal of no fishadvisories due to toxic substances in the GreatLakes fish, the strategy set a key objective of a 25%decline in lake trout and walleye PCB concentra-tions between 2000 and 2007 (U.S.EPA 2002). ForLake Michigan lake trout, Stow et al. (2004) per-formed a trend analysis on data collected between1972–2000 and estimated that the declines in thePCB concentrations between 2000–2007 would bein the range of 5–10%. It is recognized that trendanalysis helps in describing past behavior of differ-ent processes, understanding the mechanisms be-hind changes, assessing the impacts of managementactions, and extrapolating data for policy guidance.Although monitoring data are essential for verify-ing projected values, trend analysis aids in makingtimely decisions.
In order to assess historical as well as recent spa-tial distributions and temporal trends of PCB levelsin lake trout and walleye from the Canadian watersof the Great Lakes, we analyze long-term(1970s–2006) biomonitoring data collected by theSports Fish Contaminant Monitoring Program(SFCMP) of the Ontario Ministry of the Environ-ment (MOE, Canada). Using trend analysis per-formed on the long-term (1970s–2006) and recent(1990–2006) fish measurements, we assess whetherPCB levels in fish from the Canadian waters of theGreat Lakes are still decreasing, have leveled off, orif the trend has been reversed due to increasing con-centrations. We then use bootstrap resamplinganalysis to examine if the GLS-2002 target of 25%decrease in lake trout and walleye PCB concentra-tions from 2000–2007 is feasible.
MATERIALS AND METHODS
Sample Collection
The SFCMP of MOE has been monitoring conta-minant concentrations in Ontario sport fish for ap-
594 Bhavsar et al.
proximately 30 years. As a part of this program,fish samples are collected from the Canadian watersof the Great Lakes generally on an annual basis incollaboration with the Ontario Ministry of NaturalResources (MNR), Canada. Lake trout and walleye(Sander vitreus) were collected in varying numbersfrom several locations in each of Lakes Superior,Huron, Erie and Ontario from 1976–2006 duringlate summer or early fall using gill nets and electro-fishing. The samples were not necessarily collectedfrom the same location in a lake every year. Aftercollection, fish were stored frozen as whole fish andshipped to MOE laboratories for chemical analysis,where they were measured for length and weight,sexed and filleted (skin-off) before analysis.
Extraction and Analysis
A skinless, boneless fillet of the dorsal muscle ofeach fish was used to quantify total-PCB levelsusing the MOE method E3136 (MOE 2005b). Thismethod entails hydrochloric acid digestion of ho-mogenized fish tissue, followed by extraction withhexane/dichloromethane. Complete procedureshave been described in detail elsewhere (MOE2005b). Briefly, fish tissue homogenates wereweighed (5.0 g) and transferred to centrifuge tubes.A 0.5 mL aliquot of a 5:2 mixture of decachloro-biphenyl and 1,3,5-tribromobenzene (100 µg/mL)was added to each sample as a surrogate spike, fol-lowed by 18 mL of concentrated, reagent grade hy-drochloric acid and left to digest over night. A 20mL aliquot 25% (v/v) dichloromethane (DCM) inhexane was added to each sample to extract organiccompounds from the acid digestate. Solutions weremixed for 45 minutes on a bench top rotator, andthen allowed to stand for 24–48 hours to permitseparation of emulsion (if present). The top solventlayer was quantitatively withdrawn and transferredto 100 mL volumetric flasks, and volumes made upto 100 mL with DCM/hexane. Sample extractswere evaporated to 1 mL, added to dry packedFlorisil® columns and allowed to drain to the top ofthe packing. Pure hexane was then added in 1 mLportions until the columns were completely wet. A25 mL aliquot of hexane was used to elute PCBs.Column effluents, containing PCB and mirex (frac-tion 1), were collected in 40 mL graduated tubesand any hexane remaining at the top of the columnswas drained off. The remaining compounds (mostlyorganochlorine pesticides; fraction 2) were theneluted with a 25% (v/v) DCM/hexane and collectedin 40 mL tubes. Pure iso-octane (1 mL) was added
to fractions 1 and 2, and the sample extracts wereevaporated to 1 mL final volumes.
Gas-liquid chromatography was used to deter-mine total-PCB concentrations using an HP 5890Series-II gas chromatograph and Ni63 electron cap-ture detector (ECD). A J&W DB-17 0.53 mm i.d.,0.1 µm film was used. The column head pressurewas 3.5 PSI and the temperature program for frac-tion 1 was 80°C for 1 min; 80 to 180°C at10°C/min; 180 to 260°C at 5°C/min; 260°C for 6min. Total–PCBs were determined using a 4:1 mix-ture of Aroclors 1254:1260 for quantification. Thisratio of Aroclors best resembled the congener pat-terns detected for most fish samples. The chro-matography was detuned to resemble classicalpacked column chromatography for classical Aro-clor matching analysis. Quantification was carriedout using the 23 largest “Aroclor” peaks obtained inthe pseudo packed column technique. For lowerlevel samples, a minimum of 11 peaks was requiredfor a positive identification. The areas of the peaksdetected were summed and compared to thesummed areas of the 4:1 mixture of Aroclor1254:1260. A five point calibration curve with sin-gle point continuing calibration was used to quan-tify samples. The method detection limit (MDL) is20 ng/g. A blank and spiked blank matrix samplewas processed with each set of samples (20 to 30).The method performance is monitored through lab-oratory intercalibration studies (the Northern Cont-aminants Program (NCP) and Quality Assurance ofInformation for Marine Environmental Monitoringin Europe (QUASIMEME)).
Statistical Analysis
In general, the concentrations of PCBs in fish in-crease with fish size (Miller 1994). The size of thefish samples collected varied over a wide range onboth an inter- and intra-annual basis. The meanlengths for Canadian Great Lakes lake trout andwalleye are approximately 60 and 50 cm, respec-tively (Bhavsar et al. In press). To compare the an-nual levels of dioxins and furans, Bhavsar et al. (Inpress) standardized the contaminant concentrationsat these mean fish lengths using lake-specific an-nual regressions. However, such a standardizationis appropriate when the annual regression slopes oflogarithmic concentration versus fish length areparallel (Somers and Jackson 1993). For PCB con-centrations considered in this study, we observedstatistically significant differences in the slopes(lake and fish specific P values varying from

PCB Levels in Fish from the Canadian Great Lakes 595
< 0.001–0.5). As such, instead of standardization,we opted to narrow down the size of fish consid-ered in this study to 55–65 and 45–55 cm for laketrout and walleye, respectively. The selection ofthese ranges was somewhat arbitrary to include theobserved mean lengths of 60 and 50 cm, respec-tively, to maximize the sample size, and to mini-mize the influence of fish length on PCB level.
In this study, the measurements for GeorgianBay, a large bay of Lake Huron, were combinedwith measurements for Lake Huron in order tomaximize sample size. We had limited Lake Erielake trout samples due to their low population in thelake. As such, for Lake Erie, we primarily relied onPCB measurements for walleye rather than for laketrout. Data are reported on a wet weight basis andnot on a lipid normalized basis, first, to be consis-tent with previous studies on temporal contaminanttrends in the Great Lakes (e.g., Baumann and Whit-tle 1988, Huestis et al. 1996, Hickey et al. 2006),and second, because lipid normalization can be in-appropriate and potentially misleading (Hebert andKeenleyside 1995, Stow et al. 1997).
The GLS-2002 sets a goal of 25% decreasespecifically in “whole fish” rather than fillet con-centrations. The primary purpose of the SFCMP ofMOE is to issue fish consumption advisories; there-fore, the SFCMP measurements are for contaminantlevels in fish fillets. A previous study found an al-most linear relationship between fillet and whole-fish PCB concentrations for Lake Michigan cohosalmon (Oncorhynchus kisutch) and rainbow trout(O. mykiss) (Amrhein et al. 1999). As such, trendsin fillet measurements should reflect trends in thecorresponding wholefish levels as well (Stow et al.2004).
For the temporal trend assessment, the concentra-tions were log transformed to stabilize variance be-fore performing regression analyses using SPSS(version 10.1.3, 2001, SPSS Inc., Chicago, IL,USA). A nonparametric Mann-Kendall test (Gilbert1987) was also performed to assess monotonic tem-poral trends in the recent PCB levels. A non-para-metric Sen’s method (Gilbert 1987) was then usedto estimate the magnitude of trends. The calcula-tions were performed using an Excel® (version2003; Microsoft Corp., Redmond, WA, USA) tem-plate MAKESENS – Mann-Kendall test for trendand Sen’s slope estimates (Salmi et al. 2002).
The bootstrap method was used to prepare confi-dence intervals of the standard regression estimatedchanges in fish concentrations from 2000–2007.The analysis was performed using Resampling Stats
for Excel software (version W3.20; ResamplingStats Inc., Arlington, VA, USA) and 10,000 itera-tions. In this analysis, a new set of regression slopeand intercept was prepared for log-transformed con-centrations by resampling data points at every itera-tion with replacement from the original sample. The10,000 combinations of slope and intercept werethen used to estimate fish concentration in year2007. These estimated 10,000 values for the year2007 concentrations were compared with the fishconcentration for the year 2000, which was calcu-lated using the standard regression from SPSS. Theexpected percentage changes in the concentrationsduring 2000–2007 were reported using frequencydistribution histograms.
RESULTS AND DISCUSSION
Spatial Differences
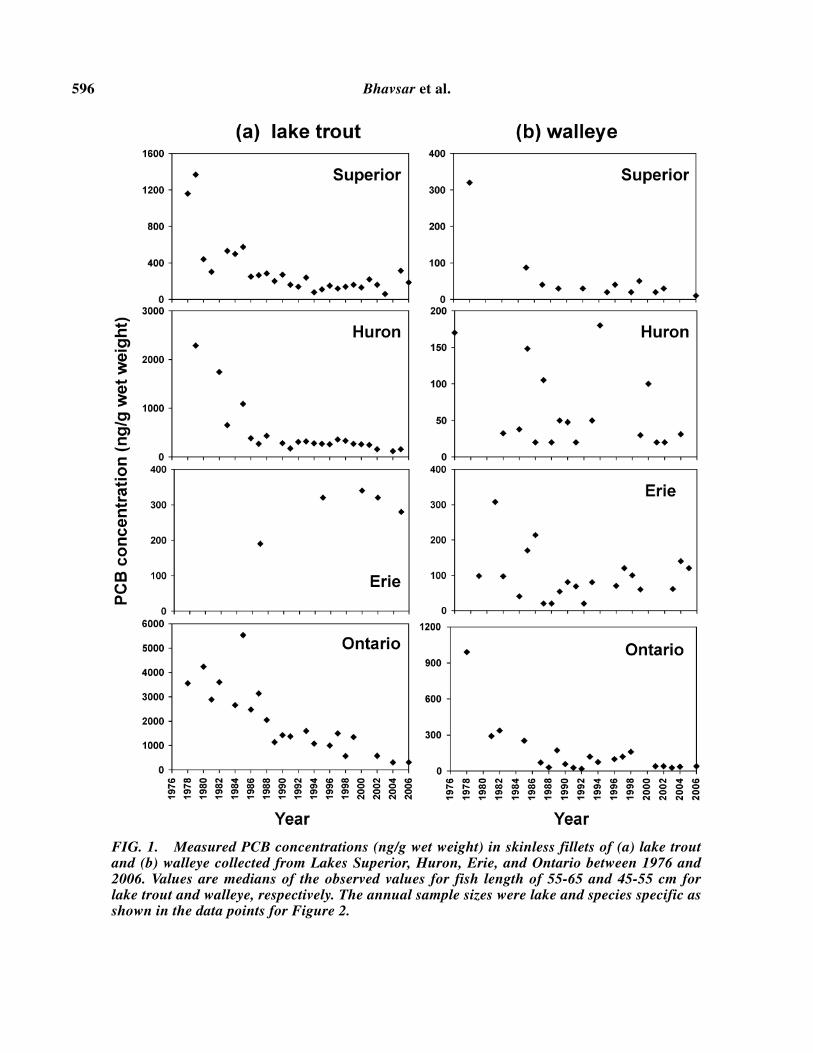
During 1970–80s, the inter-lake differences inthe Canadian Great Lakes lake trout and walleyePCB concentrations were 2–9-fold with Lake On-tario fish having the highest concentrations (Fig. 1).The historical levels were generally in the order ofLakes Superior < Huron ≈ Erie << Ontario (Fig. 1).PCB concentrations in lake trout from Lake Michi-gan (Hickey et al. 2006), the fifth lake of the GreatLakes, were comparable to those in Lake Ontario.The PCB concentrations in lake trout ranged from200–1,400 ng/g wet weight (ww) in Lake Superiorto 1,000–5,000 ng/g ww in Lake Ontario. The lev-els in walleye ranged from approximately 25–325ng/g ww in Lakes Superior, Huron and Erie to100–1,000 ng/g ww in Lake Ontario. Similar spatialheterogeneity in historical fish concentrations havebeen reported (Baumann and Whittle 1988, DeVault et al. 1996). These inter-lake differences werealso reflected in the limited measurements of waterconcentrations (Stevens and Neilson 1989).
During late 1990s (i.e., 1998–2000) the among-lake differences in the fish PCB levels decreased to2–6-fold. The median PCB concentrations (ng/gww) in 1998–2000 were still in the historical order:for lake trout, Lakes Superior (130–160) < Huron(260–330) ≈ Erie (340) << Ontario (570–1,350); forwalleye, Lakes Superior (20–50) < Huron (30–100)≈ Erie (60–100) << Ontario (160) (Fig. 1). Thisorder reported here from the 1998–2000 data col-lected by SFCMP of MOE is consistent with theobservations of the Great Lakes Fish MonitoringProgram (GLFMP) administered by the U.S.EPAGreat Lakes National Program Office (GLNPO)(Carlson and Swackhamer 2006). However, the re-
596 Bhavsar et al.
FIG. 1. Measured PCB concentrations (ng/g wet weight) in skinless fillets of (a) lake troutand (b) walleye collected from Lakes Superior, Huron, Erie, and Ontario between 1976 and2006. Values are medians of the observed values for fish length of 55-65 and 45-55 cm forlake trout and walleye, respectively. The annual sample sizes were lake and species specific asshown in the data points for Figure 2.

PCB Levels in Fish from the Canadian Great Lakes 597
cent (2000–2006) measurements suggest that al-though the lake trout median PCB levels (ng/g ww)are still in the historical order of Lakes Superior(60–220) < Huron (120–260) < Erie (280–340) <Ontario (310–580), the walleye median PCB levels(ng/g ww) are now in the order of Lakes Superior(20–30) < Huron (25–45) ≈ Ontario (28–40) < Erie(60–140). The among-lake differences have de-creased and are now 2–4-fold.
Temporal Trends
In general, PCB levels in lake trout and walleyedeclined rapidly by about an order of magnitudeduring the late 1970s and 1980s (Fig. 1) (Borgmannand Whittle 1991, Suns et al. 1993, Bentzen et al.1999). A similar rate of decline in Lake Superiorwater concentrations from 2.4 ng/L in 1980 to 0.18ng/L in 1992 has been reported and attributed toloss by volatilization (Jeremiason et al. 1994). De-creases in Lake Ontario fish concentration can beprimarily linked to source reductions in the NiagaraRiver (Durham and Oliver 1983, Whittle and Fitzsi-mons 1983). This is supported by decreasing laketrout PCB concentrations from west to east in LakeOntario (Borgmann and Whittle 1991).
The downward trend in concentrations, however,has leveled off to a certain extent since the early1990s (Fig. 1). Measurements from other monitor-ing programs and studies have also indicated rela-tively stable concentrations in the Great Lakes fishsince late 1980s (Stow et al. 1995, De Vault et al.1996, Hickey et al. 2006). Many explanations havebeen proposed to explain this change in the declinepattern. For example, a decrease in external PCBinputs may have affected the dynamics of contami-nants in the systems. Sediments that historicallyserved as a net sink for PCBs may have turned intoa net source (Mackay 1989, Pearson et al. 1996).Under the new dynamics, PCB cycling between at-mosphere and water through wet and dry depositionand volatilization might be playing an importantrole in PCB movement (Mackay 1989, Jeremiasonet al. 1994).
Another factor that has affected the PCB trend inlake trout and walleye from the Great Lakes is foodweb structure. Introduction of many invasivespecies especially during the late 1980s and early1990s have been reported (Sprules et al. 1990,Mills et al. 1993). This may have altered the waycontaminants are accumulated in predator fish dueto modifications in the structure of the food chains(Morrison et al. 1998). Changes in alewife popula-
tion, a major prey of lake trout, have been corre-lated with PCB levels in lake trout (Borgmann andWhittle 1991). Similarly, a decline in lake troutlipid content also contributed to decreased PCB lev-els (Borgmann and Whittle 1991). This hypothesisof the effect of changes in food web structure issupported by the leveling off of biota levels despitecontinued decreases in water concentrations (DeVault et al. 1996). It is also likely that PCBs are ef-ficiently recycled within the biota of the food web(Stow et al. 2004).
Model Forecast
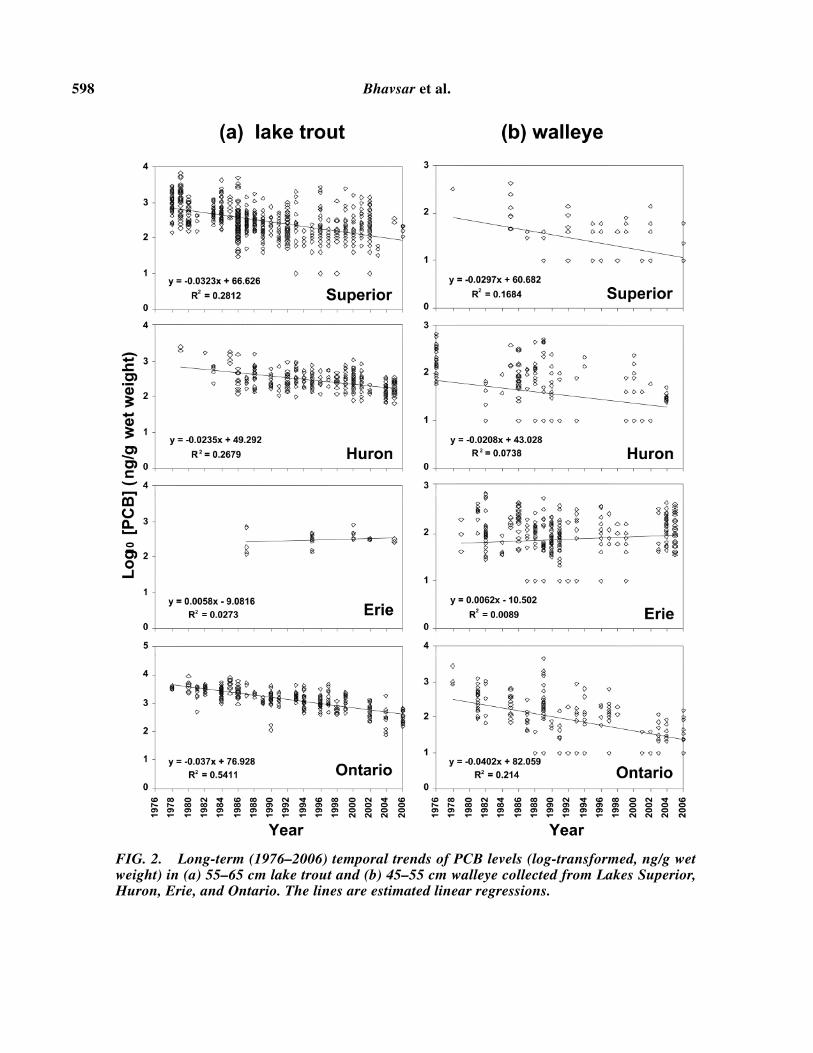
Figure 2 presents regressions for long-term(1970s–2006) PCB trends. For Lakes Superior,Huron, and Ontario, regressions for the lake troutdata provided a better fit (R2 = 0.24 to 0.49) thanfor the walleye data (R2 = 0.1 to 0.25) (Fig. 2). ForLake Erie, the greater scatter in the observed con-centrations resulted in lower amounts of variationbeing explained (R2 < 0.01) for walleye. As men-tioned above, PCB concentrations in fish are corre-lated to fish length. Selection of size ranges (55–65and 45–55 cm for lake trout and walleye, respec-tively) rather than standardization to mean fishlengths produced relatively large scatter in the an-nual data points, i.e., the variation associated withindividual fish rather than sample means are beingevaluated. Further, it is likely that the year-to-yearvariation in the contaminant levels is a result of realdifferences in local populations within a lake be-cause the samples were not necessarily collectedfrom the same location every year (Carlson andSwackhamer 2006). However, temporal trends overthe relatively long time period evaluated in thisstudy should portray a good overall picture of cont-aminant levels in lake trout and walleye due to theirmovements over large areas.
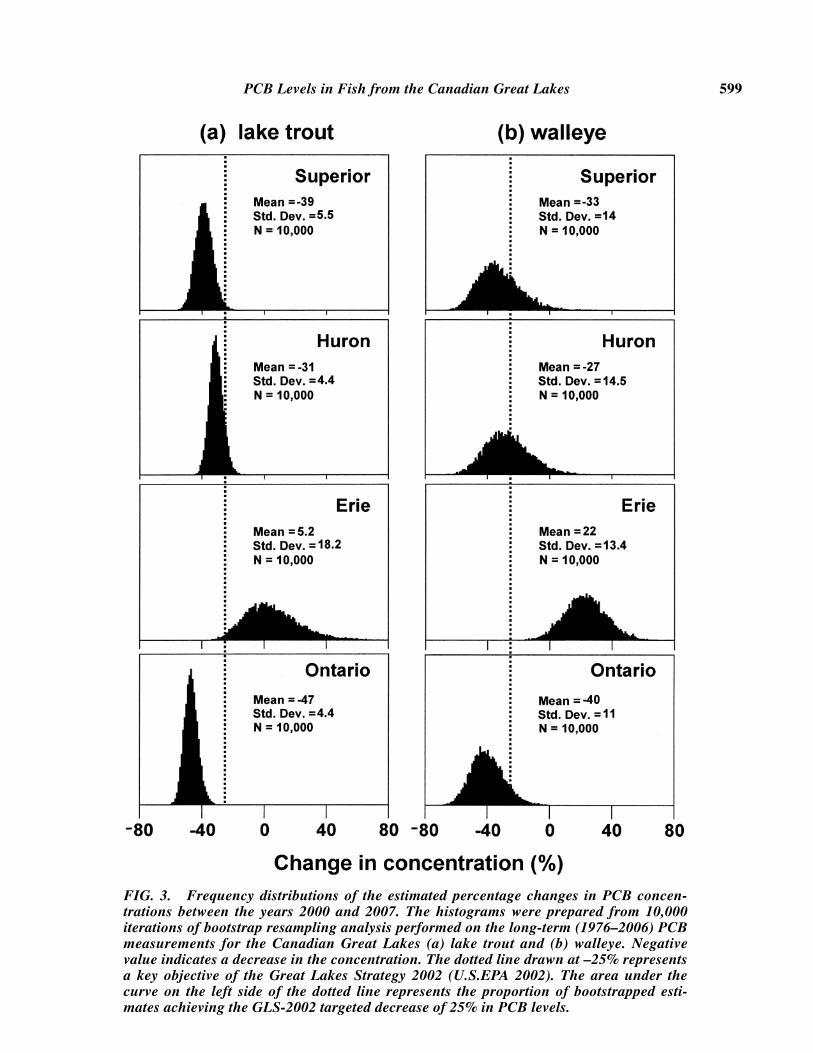
When we performed the bootstrap resamplinganalysis on these long-term regressions (Fig. 2) toproject likely concentrations in the year 2007, theanalysis suggested that the GLS-2002 targeted de-crease of 25% in PCB levels between 2000 and2007 is achievable in all lakes except Lake Erie(Fig. 3). The long-term trajectories suggest a veryhigh likelihood to achieve concentration decreasesof at least 25% in lake trout from Lakes Superior,Huron, and Ontario (Fig. 3a). For walleye, morethan 90% of the bootstrapped values exceeded thisdecrease for Lake Ontario whereas 75% and 60% ofthe values showed at least a 25% reduction forLakes Superior and Huron (Fig. 3b). In contrast, for
598 Bhavsar et al.
FIG. 2. Long-term (1976–2006) temporal trends of PCB levels (log-transformed, ng/g wetweight) in (a) 55–65 cm lake trout and (b) 45–55 cm walleye collected from Lakes Superior,Huron, Erie, and Ontario. The lines are estimated linear regressions.
PCB Levels in Fish from the Canadian Great Lakes 599
FIG. 3. Frequency distributions of the estimated percentage changes in PCB concen-trations between the years 2000 and 2007. The histograms were prepared from 10,000iterations of bootstrap resampling analysis performed on the long-term (1976–2006) PCBmeasurements for the Canadian Great Lakes (a) lake trout and (b) walleye. Negativevalue indicates a decrease in the concentration. The dotted line drawn at –25% representsa key objective of the Great Lakes Strategy 2002 (U.S.EPA 2002). The area under thecurve on the left side of the dotted line represents the proportion of bootstrapped esti-mates achieving the GLS-2002 targeted decrease of 25% in PCB levels.
600 Bhavsar et al.
Lake Erie, the best estimated average change (i.e.,mean boostrapped value) in Lake Erie lake troutand walleye PCB concentrations are increases of5% and 22%, respectively (Fig. 3). Therefore,based on the long-term trends, it appears that LakeErie lake trout and walleye will most likely notachieve the 25% PCB reduction goal of the GLS-2002.
As discussed in the temporal trend section, manystudies have found that the original first-order de-clining trend of PCB concentrations in fish from theGreat Lakes has slowed since the late 1980s (Stowet al. 1995, De Vault et al. 1996, Hickey et al.2006). Therefore, it is more appropriate to projectfuture concentrations using recent temporal trends.We recognize that estimates from such a trendanalysis can be highly sensitive to the time periodselected. Therefore, to avoid the influence of short-term (3–6 years) oscillations observed in the annualfish concentrations (French et al. 2006), to attain amoderate number of data points, and to harmonizethe time frame with possible significant changes inthe system dynamics as discussed earlier, we se-lected the 1990–2006 data for the recent trendanalysis.
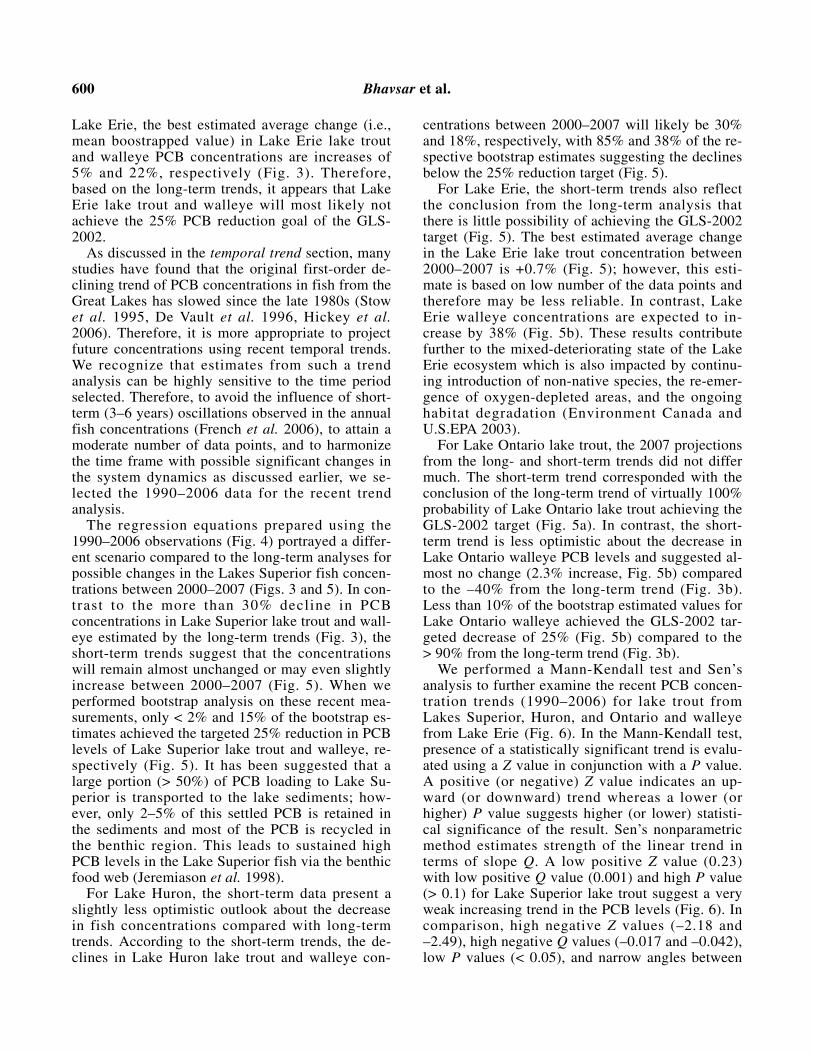
The regression equations prepared using the1990–2006 observations (Fig. 4) portrayed a differ-ent scenario compared to the long-term analyses forpossible changes in the Lakes Superior fish concen-trations between 2000–2007 (Figs. 3 and 5). In con-trast to the more than 30% decline in PCBconcentrations in Lake Superior lake trout and wall-eye estimated by the long-term trends (Fig. 3), theshort-term trends suggest that the concentrationswill remain almost unchanged or may even slightlyincrease between 2000–2007 (Fig. 5). When weperformed bootstrap analysis on these recent mea-surements, only < 2% and 15% of the bootstrap es-timates achieved the targeted 25% reduction in PCBlevels of Lake Superior lake trout and walleye, re-spectively (Fig. 5). It has been suggested that alarge portion (> 50%) of PCB loading to Lake Su-perior is transported to the lake sediments; how-ever, only 2–5% of this settled PCB is retained inthe sediments and most of the PCB is recycled inthe benthic region. This leads to sustained highPCB levels in the Lake Superior fish via the benthicfood web (Jeremiason et al. 1998).
For Lake Huron, the short-term data present aslightly less optimistic outlook about the decreasein fish concentrations compared with long-termtrends. According to the short-term trends, the de-clines in Lake Huron lake trout and walleye con-
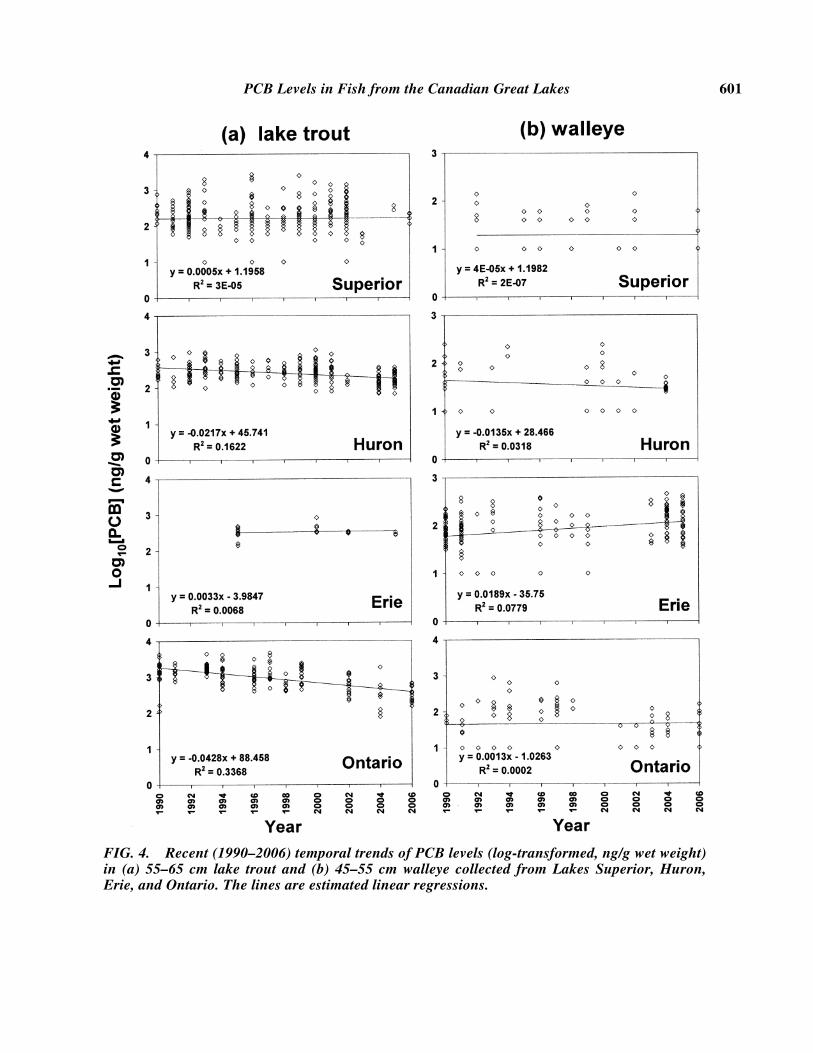
centrations between 2000–2007 will likely be 30%and 18%, respectively, with 85% and 38% of the re-spective bootstrap estimates suggesting the declinesbelow the 25% reduction target (Fig. 5).
For Lake Erie, the short-term trends also reflectthe conclusion from the long-term analysis thatthere is little possibility of achieving the GLS-2002target (Fig. 5). The best estimated average changein the Lake Erie lake trout concentration between2000–2007 is +0.7% (Fig. 5); however, this esti-mate is based on low number of the data points andtherefore may be less reliable. In contrast, LakeErie walleye concentrations are expected to in-crease by 38% (Fig. 5b). These results contributefurther to the mixed-deteriorating state of the LakeErie ecosystem which is also impacted by continu-ing introduction of non-native species, the re-emer-gence of oxygen-depleted areas, and the ongoinghabitat degradation (Environment Canada andU.S.EPA 2003).
For Lake Ontario lake trout, the 2007 projectionsfrom the long- and short-term trends did not differmuch. The short-term trend corresponded with theconclusion of the long-term trend of virtually 100%probability of Lake Ontario lake trout achieving theGLS-2002 target (Fig. 5a). In contrast, the short-term trend is less optimistic about the decrease inLake Ontario walleye PCB levels and suggested al-most no change (2.3% increase, Fig. 5b) comparedto the –40% from the long-term trend (Fig. 3b).Less than 10% of the bootstrap estimated values forLake Ontario walleye achieved the GLS-2002 tar-geted decrease of 25% (Fig. 5b) compared to the > 90% from the long-term trend (Fig. 3b).
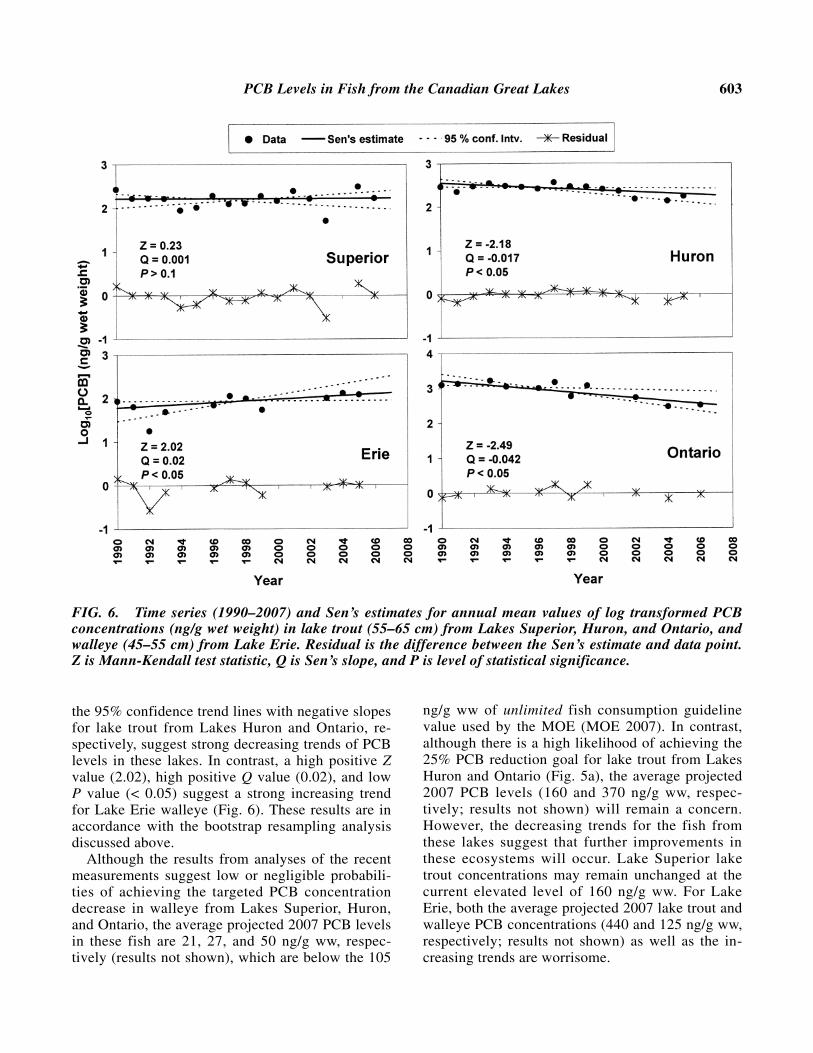
We performed a Mann-Kendall test and Sen’sanalysis to further examine the recent PCB concen-tration trends (1990–2006) for lake trout fromLakes Superior, Huron, and Ontario and walleyefrom Lake Erie (Fig. 6). In the Mann-Kendall test,presence of a statistically significant trend is evalu-ated using a Z value in conjunction with a P value.A positive (or negative) Z value indicates an up-ward (or downward) trend whereas a lower (orhigher) P value suggests higher (or lower) statisti-cal significance of the result. Sen’s nonparametricmethod estimates strength of the linear trend interms of slope Q. A low positive Z value (0.23)with low positive Q value (0.001) and high P value(> 0.1) for Lake Superior lake trout suggest a veryweak increasing trend in the PCB levels (Fig. 6). Incomparison, high negative Z values (–2.18 and–2.49), high negative Q values (–0.017 and –0.042),low P values (< 0.05), and narrow angles between
PCB Levels in Fish from the Canadian Great Lakes 601
FIG. 4. Recent (1990–2006) temporal trends of PCB levels (log-transformed, ng/g wet weight)in (a) 55–65 cm lake trout and (b) 45–55 cm walleye collected from Lakes Superior, Huron,Erie, and Ontario. The lines are estimated linear regressions.
602 Bhavsar et al.
FIG. 5. Frequency distributions of the estimated percentage changes in PCB concen-trations between the years 2000 and 2007. The histograms were prepared from 10,000iterations of bootstrap resampling analysis performed on the recent (1990–2006) PCBmeasurements for the Canadian Great Lakes (a) lake trout and (b) walleye. Negativevalue indicates a decrease in the concentration. The dotted line drawn at –25% repre-sents a key objective of the Great Lakes Strategy 2002 (U.S.EPA 2002). The area underthe curve on the left side of the dotted line represents the proportion of bootstrapped esti-mates achieving the GLS-2002 targeted decrease of 25% in PCB levels.
PCB Levels in Fish from the Canadian Great Lakes 603
the 95% confidence trend lines with negative slopesfor lake trout from Lakes Huron and Ontario, re-spectively, suggest strong decreasing trends of PCBlevels in these lakes. In contrast, a high positive Zvalue (2.02), high positive Q value (0.02), and lowP value (< 0.05) suggest a strong increasing trendfor Lake Erie walleye (Fig. 6). These results are inaccordance with the bootstrap resampling analysisdiscussed above.
Although the results from analyses of the recentmeasurements suggest low or negligible probabili-ties of achieving the targeted PCB concentrationdecrease in walleye from Lakes Superior, Huron,and Ontario, the average projected 2007 PCB levelsin these fish are 21, 27, and 50 ng/g ww, respec-tively (results not shown), which are below the 105
ng/g ww of unlimited fish consumption guidelinevalue used by the MOE (MOE 2007). In contrast,although there is a high likelihood of achieving the25% PCB reduction goal for lake trout from LakesHuron and Ontario (Fig. 5a), the average projected2007 PCB levels (160 and 370 ng/g ww, respec-tively; results not shown) will remain a concern.However, the decreasing trends for the fish fromthese lakes suggest that further improvements inthese ecosystems will occur. Lake Superior laketrout concentrations may remain unchanged at thecurrent elevated level of 160 ng/g ww. For LakeErie, both the average projected 2007 lake trout andwalleye PCB concentrations (440 and 125 ng/g ww,respectively; results not shown) as well as the in-creasing trends are worrisome.
FIG. 6. Time series (1990–2007) and Sen’s estimates for annual mean values of log transformed PCBconcentrations (ng/g wet weight) in lake trout (55–65 cm) from Lakes Superior, Huron, and Ontario, andwalleye (45–55 cm) from Lake Erie. Residual is the difference between the Sen’s estimate and data point.Z is Mann-Kendall test statistic, Q is Sen’s slope, and P is level of statistical significance.
604 Bhavsar et al.
If we are to evaluate the success of 25% PCB re-duction goal of the GLS-2002 based on the mea-surements in years 2000 and 2007 only, theassessment may result in erroneous conclusions dueto periodic short-term (3–6 years) oscillations ob-served in the concentrations. For example, Frenchet al. (2006) found short-term fluctuations that re-lated to short-term climatic cycles such as El Ninoeffects, and the associated impacts on prey-fishyear-class strengths and the associated changes incontaminant transfer within the foodweb. There-fore, it will require a few years of measurementsbeyond 2007 to confirm the projected 2007 concen-trations, as well as whether the concentration on anaverage basis decreased by 25% between2000–2007.
In summary, trends of PCB levels in lake troutand walleye from the Canadian Great Lakes arepresented using long-term biomonitoring data col-lected by the SFCMP of MOE. In general, PCBtrends are lake and fish-species specific. The PCBfish levels appear to have leveled off in Lake Supe-rior but are decreasing in Lake Huron. The concen-trations are increasing in Lake Erie walleye.Conversely, for Lake Ontario lake trout and wall-eye, PCB levels are decreasing and have leveledoff, respectively.
ACKNOWLEDGMENTS
We thank Emily Awad, Vedrana Pantelic, AlinaMiscalu, Corina Lucaciu, B.K. Loo, and MaryannBogard of the Ontario Ministry of the Environment(MOE), and two anonymous reviewers for theirthoughtful comments on an earlier draft of thisarticle.
REFERENCESAmrhein, J.F., Stow, C.A., and Wible, C. 1999. Whole-
fish versus filet polychlorinated-biphenyl concentra-tions: An analysis using classification and regressiontree models. Environ. Toxicol. Chem. 18:1817–1823.
Baumann, P.C., and Whittle, D.M. 1988. The status ofselected organics in the Laurentian Great Lakes—anoverview of DDT, PCBs, dioxins, furans, and aro-matic hydrocarbons. Aquat. Toxicol. 11:241–257.
Bentzen, E., Mackay, D., Hickie, B.E., and Lean, D.R.S.1999. Temporal trends of polychlorinated biphenyls(PCBs) in Lake Ontario fish and invertebrates. Envi-ron. Rev. 7:203–223.
Bhavsar, S.P., Awad, E., Fletcher, R., Hayton, A.,Somers, K.M., Kolic, T., MacPherson, K., and Reiner,E.J. In press. Temporal trends and spatial distribution
of dioxins and furans in lake trout or lake whitefishfrom the Canadian Great Lakes. Chemosphere
Borgmann, U., and Whittle, D.M. 1991. Contaminantconcentration trends in Lake Ontario lake trout(Salvelinus namaycush)—1977 to 1988. J. GreatLakes Res. 17:368–381.
Carlson, D.L., and Swackhamer, D.L. 2006. Resultsfrom the US Great Lakes fish monitoring program andeffects of lake processes on bioaccumulative contami-nant concentrations. J. Great Lakes Res. 32:370–385.
De Vault, D.S., Hesselberg, R., Rodgers, P.W., andFeist, T.J. 1996. Contaminant trends in lake trout andwalleye from the Laurentian Great Lakes. J. GreatLakes Res. 22:884–895.
Durham, R.W., and Oliver, B.G. 1983. History of LakeOntario contamination from the Niagara River by sed-iment radiodating and chlorinated hydrocarbon analy-sis. J. Great Lakes Res. 9:160–168.
Environment Canada, and U.S.EPA. 2003. State of theGreat Lakes 2003. Environment Canada and UnitedStates Environmental Protection Agency, Ottawa, ONand Washington, DC. EPA 905-R-03-004.
French, T.D., Campbell, L.M., Jackson, D.A., Cassel-man, J.M., Scheider, W.A., and Hayton, A. 2006.Long-term changes in legacy trace organic contami-nants and mercury in Lake Ontario salmon in relationto source controls, trophodynamics, and climatic vari-ability. Limnol. Oceanogr. 51:2794–2807.
Gilbert, R.O. 1987. Statistical methods for environmen-tal pollution monitoring. New York: Van NostrandReinhold Co.
Hebert, C.E., and Keenleyside, K.A. 1995. To normalizeor not to normalize? Fat is the question. Environ. Tox-icol. Chem. 14:801–807.
Hickey, J.P., Batterman, S.A., and Chernyak, S.M. 2006.Trends of chlorinated organic contaminants in GreatLakes trout and walleye from 1970 to 1998. Arch.Environ. Contam. Toxicol. 50:97–110.
Huestis, S.Y., Servos, M.R., Whittle, D.M., and Dixon,D.G. 1996. Temporal and age-related trends in levelsof polychlorinated biphenyl congeners andorganochlorine contaminants in Lake Ontario Laketrout (Salvelinus namaycush). J. Great Lakes Res.22:310–330.
Jeremiason, J.D., Hornbuckle, K.C., and Eisenreich, S.J.1994. PCBs in Lake Superior, 1978–1992—Decreasesin water concentrations reflect loss by volatilization.Environ. Sci. Technol. 28:903–914.
——— , Eisenreich, S.J., Baker, J.E., and Eadie, B.J.1998. PCB decline in settling particles and benthicrecycling of PCBs and PAHs in Lake Superior. Envi-ron. Sci. Technol. 32:3249–3256.
Mackay, D. 1989. Modeling the long-term behavior ofan organic contaminant in a large lake—Applicationto PCBs in Lake Ontario . J. Great Lakes Res.15:283–297.
PCB Levels in Fish from the Canadian Great Lakes 605
Miller, M.A. 1994. Organochlorine concentrationdynamics in Lake Michigan chinook salmon(Oncorhynchus tshawytscha). Arch. Environ. Contam.Toxicol. 27:367–374.
Mills, E.L., Leach, J.H., Carlton, J.T., and Secor, C.L.1993. Exotic species in the Great Lakes—a history ofbiotic crises and anthropogenic introductions. J. GreatLakes Res. 19:1–54.
MOE. 2005a. 2005–06 Guide to eating Ontario sportfish. Toronto, ON, Canada: Ontario Ministry of theEnvironment.
——— . 2005b. The determination of polychlorinatedbiphenyls (PCBs), organochlorines (OCs) andchlorobenzenes (CBs) in fish, clams and mussels bygas liquid chromatography-electron capture detection(GLC-ECD). Laboratory Services Branch MethodPFAOC-E3136. Ontario Ministry of the Environment,Toronto, Ontario, Canada.
——— . 2007. 2007–08 Guide to eating Ontario sportfish. Toronto, ON, Canada: Ontario Ministry of theEnvironment.
Morrison, H.A., Gobas, F., Lazar, R., Whittle, D.M., andHaffner, G.D. 1998. Projected changes to the tropho-dynamics of PCBs in the western Lake Erie ecosys-tem attributed to the presence of zebra mussels(Dreissena polymorpha) . Environ Sci Technol32:3862–3867.
Pearson, R.F., Hornbuckle, K.C., Eisenreich, S.J., andSwackhamer, D.L. 1996. PCBs in Lake Michiganwater revisited. Environ. Sci. Technol. 30:1429–1436.
Salmi, T., Määttä, A., Anttila, P., Ruoho-Airola, T., andAmnell, T. 2002. Detecting trends of annual values ofatmospheric pollutants by the Mann-Kendall test andSen’s slope estimates-the excel template applicationMAKESENS . Finnish Meteorological Institute,Helsinki.
Scheider, W.A., Cox, C., Hayton, A., and Hitchin, G.1998. Current status and temporal trends in concentra-tions of persistent toxic substances in sport fish andjuvenile forage fish in the Canadian waters of theGreat Lakes. Environ. Monit. Assess. 53:57–76.
Somers, K.M., and Jackson, D.A. 1993. Adjusting mer-cury concentration for fish-size covariation—a multi-
variate alternative to bivariate regression. Can. J.Fish. Aquat. Sci. 50:2388–2396.
Sprules, W.G., Riessen, H.P., and Jin, E.H. 1990.Dynamics of the Bythotrephes Invasion of the StLawrence Great-Lakes . J. Great Lakes Res.16:346–351.
Stevens, R.J.J., and Neilson, M.A. 1989. Interlake andintralake distributions of trace organic contaminantsin surface waters of the Great Lakes. J. Great LakesRes. 15:377–393.
Stow, C.A., Carpenter, S.R., Eby, L.A., Amrhein, J.F.,and Hesselberg, R.J. 1995. Evidence that PCBs areapproaching stable concentrations in Lake Michiganfishes. Ecol. Appl. 5:248–260.
——— , Jackson, L.J., and Amrhein, J.F. 1997. An exam-ination of the PCB:lipid relationship among individ-ual fish. Can. J. Fish. Aquat. Sci. 54:1031–1038.
——— , Lamon, E.C., Qian, S.S., and Schrank, C.S.2004. Will Lake Michigan lake trout meet the GreatLakes strategy 2002 PCB reduction goal? Environ.Sci. Technol. 38:359–363.
Suns, K.R., Hitchin, G.G., and Toner, D. 1993. Spatialand temporal trends of organochlorine contaminantsin spottail shiners from selected sites in the Great-Lakes (1975–1990). J. Great Lakes Res. 19:703–714.
Swackhamer, D.L. 2005. Aquatic processes and systemsin perspective—The past, present, and future of theNorth American Great Lakes: what lessons do theyoffer? J. Environ. Monit. 7:540–544.
Tanabe, S. 1988. PCB problems in the future—foresightfrom current knowledge. Environ. Pollut. 50:5–28.
U.S.EPA. 2002. Great Lakes Strategy 2002 (available athttp://www.epa.gov/glnpo/gls/glstoc.html).
——— . 2003. Update: National listing of fish andwildlife advisories. Office of Water, U.S.EPA., Wash-ington, DC. EPA-823-F-03-003.
Whittle, D.M., and Fitzsimons, J.D. 1983. The influenceof the Niagara River on contaminant burdens of LakeOntario biota. J. Great Lakes Res. 9:295–302.
Submitted: 27 December 2006Accepted: 4 June 2007Editorial handling: Peter F. Landrum