Are Melbourne’s transport systems of world standard?
13
Are Melbourne’s transport systems of world standard? By Jan Scheurer, Peter Newman and Jeff Kenworthy Melbourne has consistently ranked very highly in the liveability ratings of the Economist Intelligence Unit annual survey, coming second behind Vancouver in 2008. 1 This contribution examines a range of indicators to position the performance of Melbourne’s transport system for the sustainability and wellbeing of the city against a group of contenders for the title of the world’s most liveable city – all cities that have been rated as being highly liveable. We have summarised some of the comparative findings contained and discussed in more detail in a policy document written in 2005 for the Metropolitan Transport Forum. 2 Figure 1 shows the relative significance of public transport in the world’s most liveable cities, both in absolute numbers of trips per person per year, and as a modal share of total travel. In this comparison, Melbourne’s public transport system carries only a small proportion of all trips within the metropolitan area. 3 At a share of 7% of all trips (9% of motorised trips) in 1995, the importance of public transport for urban mobility in Melbourne lags behind our nearest neighbour, Sydney, and significantly behind every non-Australian city in the sample, except Vancouver. Passenger numbers relative to population remained almost stagnant between 90 and 102 boardings per capita per year for about 25 years, after a substantial decline during the 1960s and 1970s (in 1961, there were 222 and in 1971, 142 boardings per capita per year). 4 By 2007, they had recovered to about 114 boardings per capita per year. 5 1 Economist Intelligence Unit (EIU, 2008) Economist Intelligence Unit Global Liveability Rankings (January 2008). Available online at www.eiu.com 2 Scheurer J, Kenworthy J, Newman P (2005) Most Liveable and Best Connected? The Economic Benefits of Investing in Public Transport in Melbourne. Metropolitan Transport Forum (MTF), Melbourne 3 All data in this section (unless stated otherwise) from: Kenworthy J, Laube F (2001) The Millennium Cities Database for Sustainable Transport. International Union of Public Transport (UITP), Brussels, Belgium and ISTP, Murdoch University, Perth (WA). The data generally refers to the years 1995-96. 4 Kenworthy J, Laube F (1999) An International Sourcebook of Automobile Dependence in Cities, 1960-1990. Niwot (CO), USA Mees P (2000) A Very Public Solution. Transport in the Dispersed City. Melbourne Australian Institute of Urban Studies (AIUS), City of Melbourne (2005) Environmental Indicators for Metropolitan Melbourne. Bulletin 8, October 5 Department of Transport (2008) Patronage Growth Fact Sheet, available online at www.transport.vic.gov.au
Transcript of Are Melbourne’s transport systems of world standard?

Are Melbourne’s transport systems of world standard?
By Jan Scheurer, Peter Newman and Jeff Kenworthy
Melbourne has consistently ranked very highly in the liveability ratings of the Economist Intelligence Unit annual survey, coming second behind Vancouver in 2008.1 This contribution examines a range of indicators to position the performance of Melbourne’s transport system for the sustainability and wellbeing of the city against a group of contenders for the title of the world’s most liveable city – all cities that have been rated as being highly liveable. We have summarised some of the comparative findings contained and discussed in more detail in a policy document written in 2005 for the Metropolitan Transport Forum.2
Figure 1 shows the relative significance of public transport in the world’s most liveable cities, both in absolute numbers of trips per person per year, and as a modal share of total travel. In this comparison, Melbourne’s public transport system carries only a small proportion of all trips within the metropolitan area.
3 At a share of 7% of all trips (9% of motorised trips) in 1995, the importance of public transport for urban mobility in Melbourne lags behind our nearest neighbour, Sydney, and significantly behind every non-Australian city in the sample, except Vancouver. Passenger numbers relative to population remained almost stagnant between 90 and 102 boardings per capita per year for about 25 years, after a substantial decline during the 1960s and 1970s (in 1961, there were 222 and in 1971, 142 boardings per capita per year).4 By 2007, they had recovered to about 114 boardings per capita per year.5
1 Economist Intelligence Unit (EIU, 2008) Economist Intelligence Unit Global Liveability Rankings (January 2008).
Available online at
www.eiu.com 2 Scheurer J, Kenworthy J, Newman P (2005) Most Liveable and Best Connected? The Economic Benefits of
Investing in Public Transport in Melbourne. Metropolitan Transport Forum (MTF), Melbourne 3 All data in this section (unless stated otherwise) from: Kenworthy J, Laube F (2001) The Millennium Cities
Database for Sustainable Transport. International Union of Public Transport (UITP), Brussels, Belgium and ISTP, Murdoch University, Perth (WA). The data generally refers to the years 1995-96.
4 Kenworthy J, Laube F (1999) An International Sourcebook of Automobile Dependence in Cities, 1960-1990. Niwot (CO), USA Mees P (2000) A Very Public Solution. Transport in the Dispersed City. Melbourne Australian Institute of Urban Studies (AIUS), City of Melbourne (2005) Environmental Indicators for Metropolitan Melbourne. Bulletin 8, October
5 Department of Transport (2008) Patronage Growth Fact Sheet, available online at www.transport.vic.gov.au

To improve the modal split, the 2002 metropolitan strategy (Melbourne 2030) sets a target to boost public transport’s share of the travel market to 20% of all motorised trips by 2020 (15% of all trips). On current trends for population growth, and assuming undiminished mobility needs, this translates into a 2.5-fold increase of passenger numbers in absolute terms - from 430 million per year or about 1.2 million per day in 2007 to more than 1 billion per year, or 3 million per day, in 2030.6 At a projected metropolitan population of 5 million,7 this implies that there would be more than 200 public transport boardings per capita per year across Melbourne – a similar level to that currently experienced in cities like Montreal (206), Copenhagen (212) and Oslo (221).8
Such a shift is ambitious and unprecedented in Melbourne’s post-war history. If achieved, it will incur significant changes to the role of mobility and activity patterns for Melbourne’s households as well as businesses. It will require a significant increase in infrastructure spending for public transport. This is now on the agenda in Melbourne through the latest Victorian Transport Plan and the process involving Infrastructure Australia.
9
Figure 2 correlates the level of public transport use, measured in annual trips per capita, with the proportion of metropolitan wealth (Gross Regional Product or GRP per capita) spent on building, maintaining and operating the cities’ transport systems by all public and private sources. Since transport is a cost to the economy, it is in the interest of cities to keep such expenditure low. There is a clear trend for more public transport-oriented cities, largely in Europe, to be more successful in minimising these costs and thus making more of their wealth
Other measures below help to shed light on the nature of the investment required.
6 Department of Infrastructure (DOI, 2002) Melbourne 2030. Planning for Sustainable Growth. Melbourne
Department of Transport (2008) Patronage Growth Fact Sheet, available online at www.transport.vic.gov.au McDougall W (2005) Sustainable Transport - What Does 20/2020 Mean for Melbourne? 20-2020 Vital for Melbourne Forum, Environment Victoria et al, 11 May
7 Department of Planning and Community Development (DPCD, 2008) Victoria in Future 2008. Victorian State Government Population and Household Projections 2006-2036, available online at www.dpcd.vic.gov.au
8 Scheurer J, Kenworthy J, Newman P (2005) Most Liveable and Best Connected? The Economic Benefits of Investing in Public Transport in Melbourne. Metropolitan Transport Forum (MTF), Melbourne. The figures for public transport boardings differ from those for public transport trips shown in Figure 1, as boardings count each section of a trip involving transfers between public transport modes separately.
9 State of Victoria (2008) The Victorian Transport Plan. Available online at www.transport.vic.gov.au

available for other, more productive economic activities. In contrast, cities that spend relatively much of their wealth on transport are largely characterised by comparatively poorly used public transport systems.
Two important indicators of infrastructure have been shown to impact on the level of public transport use in cities. Figure 3 shows the amount of car parking supplied relative to employment (parking spaces per 1000 jobs) within each of the cities’ Central Business District, correlated to the level of public transport use in annual trips per capita. Melbourne’s CBD, at 349 spaces per 1000 employees, has a relatively generous supply of parking, not only compared to European cities, but also to Toronto and Sydney. This correlation shows that there is a modest trend for cities with tighter parking supplies in their CBDs to attract more public transport trips, or put differently, for cities with a greater role for public transport to require less central area parking to function well.
In Sydney and Perth, the introduction of a car parking levy in the late 1990s has slowed the growth of CBD parking. In Melbourne, where such a levy only came into force in 2006, CBD
parking kept on growing continuously. In 1981 there were 270 spaces per 1,000 jobs,10 and between 1995 and 2000, off-street parking in the CBD increased further by more than 45 percent. (CBD employment grew by 39% during the 10 years from 1992 to 2002).11
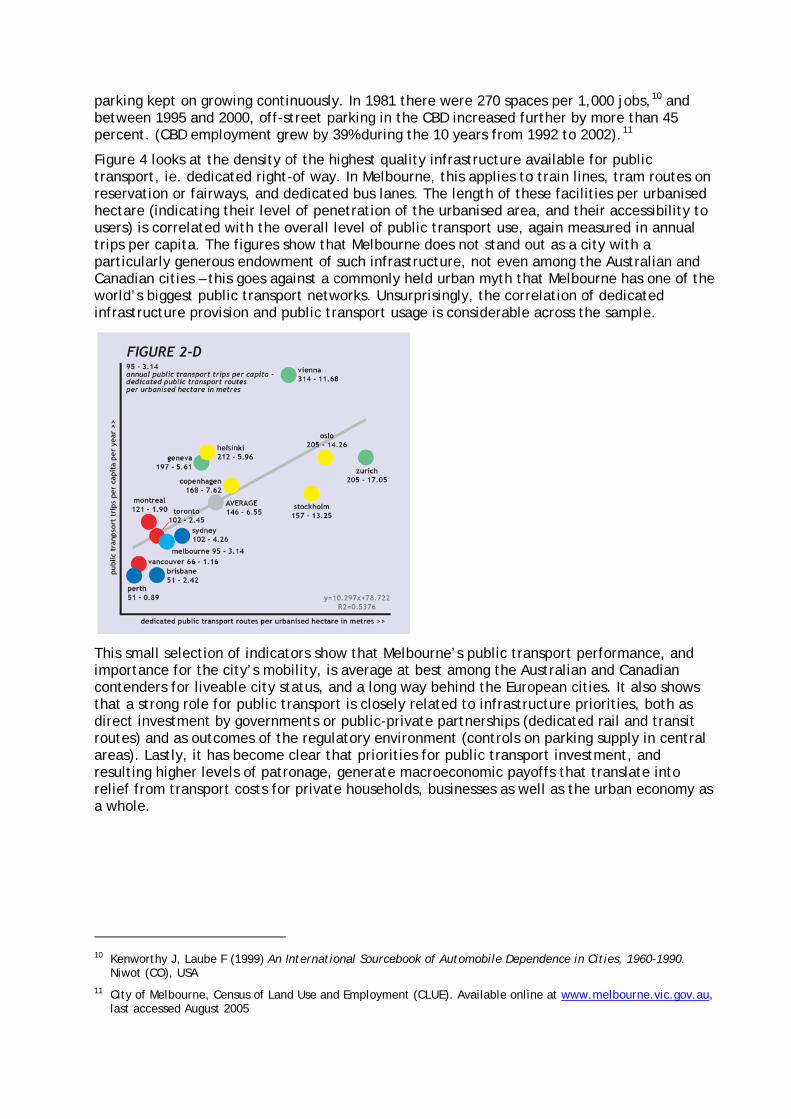
Figure 4 looks at the density of the highest quality infrastructure available for public transport, ie. dedicated right-of way. In Melbourne, this applies to train lines, tram routes on reservation or fairways, and dedicated bus lanes. The length of these facilities per urbanised hectare (indicating their level of penetration of the urbanised area, and their accessibility to users) is correlated with the overall level of public transport use, again measured in annual trips per capita. The figures show that Melbourne does not stand out as a city with a particularly generous endowment of such infrastructure, not even among the Australian and Canadian cities – this goes against a commonly held urban myth that Melbourne has one of the world’s biggest public transport networks. Unsurprisingly, the correlation of dedicated infrastructure provision and public transport usage is considerable across the sample.
This small selection of indicators show that Melbourne’s public transport performance, and importance for the city’s mobility, is average at best among the Australian and Canadian contenders for liveable city status, and a long way behind the European cities. It also shows that a strong role for public transport is closely related to infrastructure priorities, both as direct investment by governments or public-private partnerships (dedicated rail and transit routes) and as outcomes of the regulatory environment (controls on parking supply in central areas). Lastly, it has become clear that priorities for public transport investment, and resulting higher levels of patronage, generate macroeconomic payoffs that translate into relief from transport costs for private households, businesses as well as the urban economy as a whole.
10 Kenworthy J, Laube F (1999) An International Sourcebook of Automobile Dependence in Cities, 1960-1990.
Niwot (CO), USA 11 City of Melbourne, Census of Land Use and Employment (CLUE). Available online at www.melbourne.vic.gov.au,
last accessed August 2005
Road Congestion and Public Transport Competitiveness
How can Melbourne’s public transport system perform better, both on its own terms and as a component of the overall mobility mix? Recent years have seen the transport policy debate focus strongly on congestion, both on the rail system and on the road network. An inquiry into managing transport congestion undertaken by the Victorian Competition and Efficiency Commission (VCEC) on the initiative of State Government during 2005-06 identifies three approaches to addressing transport congestion: supply-side (modulation of infrastructure to increase capacity), demand-side (modulation of usage patterns to reduce demand) and urban planning (modulation of land use to induce lower travel intensity and greater public transport orientation).12
The legacy of conventional transport planning has been to focus strongly on supply-side, or capacity-boosting, solutions to traffic congestion. It regarded the development of urban transport infrastructure primarily as a technical task, predicting future traffic volumes and then providing the road capacity these appear to require. This approach is now widely discredited among transport experts. It has been understood that it is neither economically possible nor politically or environmentally desirable for cities to ‘build their way out of congestion’ by supplying sufficient infrastructure to satisfy all demand.
13 Furthermore, mobility patterns in cities have proven far harder to predict than the linear models of conventional transport planning suggested. Unintended effects include induced traffic (trips not previously made, or increased travel distances, that are encouraged by new or upgraded roads) and feedback effects of transport infrastructure provision on land use patterns, businesses operations and individual lifestyles.14
The recognition that there is no ‘rational equilibrium’ between infrastructure supply and traffic demand (and hence congestion levels), has led to a widespread departure of transport policy from the goal of ‘solving congestion’. Instead, the emphasis is on transformation of the land-use and transport interplay, redefinition of mobility, accessibility and connectivity, and programs of transport behaviour change.
Of course, the opposite effect to ‘induced traffic’ has also occurred where road capacity has been removed, as in pedestrianisation schemes, and traffic has simply disappeared. This phenomenon has informed the suggestion that traffic behaves more like a ‘gas’ than a ‘liquid’, expanding and contracting to fill the road space provided for it.
15
The business case for transport investment needs to be built around accessibility and place-making in areas of economic activity, rather than the attempt to increase efficiency in moving freight by applying the extraordinarily blunt instrument of expanding road capacity
12 Victorian Competition and Efficiency Commission (VCEC, 2005) Inquiry into Managing Transport Congestion.
Issues Paper, Melbourne, October 13 Banister D (2002) Transport Planning. Second Edition. London, UK
Downs A (2004) Why Traffic Congestion Is Here to Stay - and Will Get Worse. Access, No 25 14 Standing Advisory Committee on Trunk Road Assessment (SACTRA, 1994) Trunk Roads and the Generation of
Traffic. Department of Transport, London, UK Goodwin P (1998) Unintended Effects of Transport Policies. In Banister D (1998, Ed) Transport Policy and the Environment. London, UK Sager T (2005) Footloose and Forecast-Free: Hypermobility and the Planning of Society. AESOP 2005 Congress, Vienna, Austria, 13-16 July
15 Straatemeier T (2005) Access for All? Accessibility as Conceptual Framework to Address Strategic Planning Issues. AESOP 2005 Congress, Vienna, Austria, 13-16 July Banister D (2002) Transport Planning. Second Edition. London, UK Mogridge M J H (1997) The Self-Defeating Nature of Urban Road Capacity Policy. A Review of Theories, Disputes and Available Evidence. Transport Policy, Vol 4

for all motorised traffic. It also needs to address the question how the cost of transport to society can be reduced relative to economic output.
The Committee for Melbourne claimed in 2005 that declining average traffic speeds are set to hurt Melbourne’s economic competitiveness.16 Figure 5 compares the average road traffic speed across the sample of most liveable cities in relation to metropolitan wealth. This indicator shows that the correlation between the level of wealth and the speed of traffic is not strong and above all, negative (wealthier cities tend to have slower traffic). Figure 6 correlates average traffic speeds with the percentage of metropolitan wealth spent on transport and reveals a trend for higher traffic speeds to come at a substantial macroeconomic cost to cities (the obvious exception to this trend, Copenhagen, can possibly be attributed to that city’s atypically low rate of car ownership, encouraged by very high vehicle sales taxes and well-developed bicycle mobility). The argument that congestion relief, measured in increasing average traffic speeds, contributes to wealth creation or economic efficiency is clearly invalid when comparing different cities at a singular point in time.
16 Committee for Melbourne (2005) Committee for Melbourne Identifies Melbourne’s Worst Transport Crisis
Points. Media Release and Background Paper, Melbourne (VIC), June

Figures 7 shows another proxy indicator for the level of traffic congestion in the sample of the fourteen most liveable cities. It compares the total annual vehicle km travelled in the metropolitan area with the length of the road network and thus delivers a measure of relative congestion. While this ratio represents a relatively crude average across the entire road network of the city, thus invariably discounting localised or time-specific occurrences of traffic congestion, it can be regarded as a trend for the ease a particular distance can be travelled by private vehicle, or the facility with which an average car trip can be taken. In this context, Melbourne offers a low level of resistance to private vehicle travel, implying that the city’s congestion problems are on the whole less severe than in most or all other cities in the sample.
This measure of road congestion correlates remarkably positively with public transport use (Figure 8), meaning that cities with less traffic per km of road tend to have a lower number of public transport trips per capita and that as congestion increases, so does the significance of public transport. Or, put differently: where public transport is allowed to grow into an important pillar of urban mobility, a higher level of road congestion is acceptable for a city.

Figure 9 further shows a negative correlation of traffic per km of road with transport emissions, thus countering claims that supplying more free-flowing road capacity will have an ameliorating effect on air pollution.
If traffic congestion is nonetheless seen as a stifling burden on Melbourne, with estimates that the length of roads congested at peak hours will double, and the cost of congestion to society treble by the 2020s,17
In Melbourne, each person takes an average of about a thousand passenger trips in cars per year, roughly twice the level experienced in most European cities in the sample, and Toronto
this perception needs to be regarded in the context of the role of the car in the mobility of Melburnians. Without addressing this larger question of the extent of car use, Melbourne will continue in the delusion that it is possible for a city to build its way out of congestion. Clearly, this is not the case, as shown in Los Angeles where incremental additions to the road system over more than half a century, especially freeways, have succeeded only in creating one of the world’s most vulnerable transport systems.
17 Government of Victoria (undated) Linking Melbourne. Metropolitan Transport Plan. Melbourne (p25)

(Figure 10). Only Sydney, Brisbane and Perth have even more car trips per capita. Car use is at the heart of the problem and is ultimately more amenable to reduction, than it is to continually increase the supply of roads to reduce congestion.
This section will now continue to explore the role of traffic congestion in the context of competitiveness between road traffic and public transport, and argue for an approach that capitalises on the synergies between these factors, rather than addressing each as isolated problems.
Speed
Figure 11 shows the average traffic speed across the entire road network in each city, on a 24 hour-7 day basis. This factor is influenced by congestion levels as well as the ratio of vehicle movement to road space and the layout of the road network. Road network speed is contrasted with the average speed of road-based public transport - buses and trams in Melbourne. While surface public transport is slower than road traffic in every city of the sample, Melbourne buses and trams struggle to achieve even half the speed of cars, which is the worst result for public transport among the Australian cities, and worse than every European city except Copenhagen (where road speeds are atypically high). This is not necessarily an inherent characteristic of cities with extensive first-generation tram systems, which are operated in a number of other cities in the sample, primarily in the inner areas where speed is likely to be naturally slower. Rather, it is a function of the relative priority given to public transport over car traffic, or vice versa.

Public transport’s most competitive components in the travel market of the world’s most liveable cities are their rail networks, which are generally segregated from road traffic. As shown in Figure 12, these modes achieve higher average speeds than the road system in nine out of the 14 cities. Unfortunately, Melbourne’s trains fall short of keeping up with the speed of cars - at an average speed of 40 km/h, the rail system is the fourth slowest in the sample.
These figures point to one of Melbourne’s transport system’s fundamental weaknesses: there simply are not many trip relations where the use of public transport offers advantages in travel time over the use of the car. Instead, motorists can generally arrive faster than if they had caught public transport, even after allowing for time lost to congestion, or to cruising for a parking space. There are, on the face of it, two ways to resolve this discrepancy: make public transport faster, or make road traffic slower.
Faster public transport requires priority programs for trams and buses to minimise the travel time these modes lose to obstructions from other road users. Speeding up the train system requires action on a different level: Firstly, it would be advisable that standard operating frequencies (those prevalent throughout the day on weekdays) on most of the network, but most definitely throughout the inner and middle suburbs, are increased to a level that makes

timetable consultation unnecessary (15 minutes as a maximum, though 12 or 10 minutes is better). Secondly, there is a need for permanent express services with stopping patterns that reflect the connectivity of the network as a whole (ie. every train should stop at important train/tram/bus interchanges) and remain fixed at all times.
Slowing down the road system is another policy option to reduce the speed advantage of cars over public transport. This should not be understood as advocacy to deliberately reduce traffic speeds (although in some areas, such as strip shopping centres, this is appropriate, as recognised by State and Local Government policy). Instead, it means to accept rather than counter the decline in traffic speeds that accompanies the build-up of congestion in Melbourne, and regard congestion as an opportunity to effect mode shifts to a better public transport system, rather than a threat to mobility that needs to be addressed by road capacity increases.18
Connectivity and the Network Effect
Another aspect of competitiveness between public transport and road traffic is the level of connectivity provided throughout the system. While Melbourne has a highly interconnected road network that facilitates movement between any two points in the metropolitan area, with only congestion and parking constraints acting as minor deterrents, the same cannot be said for the public transport system. All train and most tram routes serve radial corridors centred on the CBD, and the quality, legibility and effectiveness of interchange points is underdeveloped. Despite recent improvements with SmartBus routes along some suburban corridors, the provision of orbital tram and bus routes is still very insufficient to allow for ease of movement through the system that comes anywhere close to what road users are accustomed to. As a result, many non-CBD focused trip relations in Melbourne, particularly in (but not restricted to) the outer and middle suburbs, simply cannot be made on public transport within reasonable limits of time and convenience.
The antithesis to the current configuration of Melbourne’s public transport network would be a lattice-shaped system with a multitude of transfer points, preferably situated in activity centres, between train, tram and bus routes that are run at the same high frequencies and offer coordinated transfers at attractive facilities (see Figure 13). While transfers are an inevitable feature of complex public transport networks in large cities,19
18 Peñalosa E (2005) Keynote Address. The Eco Edge - Urban Environments or Urban Disasters? Melbourne, 9-12
February Taniguchi C (2005) Keynote Address. The Eco Edge - Urban Environments or Urban Disasters? Melbourne, 9-12 February
an interconnected network could ensure that the number of transfers is effectively minimised for an overwhelming majority of trips. Optimisation of the network effect in Melbourne would open up substantial new markets for public transport and incidentally contribute to relieving busy radial routes from congestion. This is because public transport trips can diffuse more effectively through an interconnected network, in a similar way to road traffic finding alternatives to chronically congested routes. Inter-suburban trips and even trips to and from the CBD fringe can thus be performed more easily without traversing the CBD. In fact, this network configuration is similar to the way the central city tram network operates now as a kind of service-saturated grid network, allowing easy transfers between trams operating in opposite compass directions.
19 Mees P (2000) A Very Public Solution. Transport in the Dispersed City. Melbourne
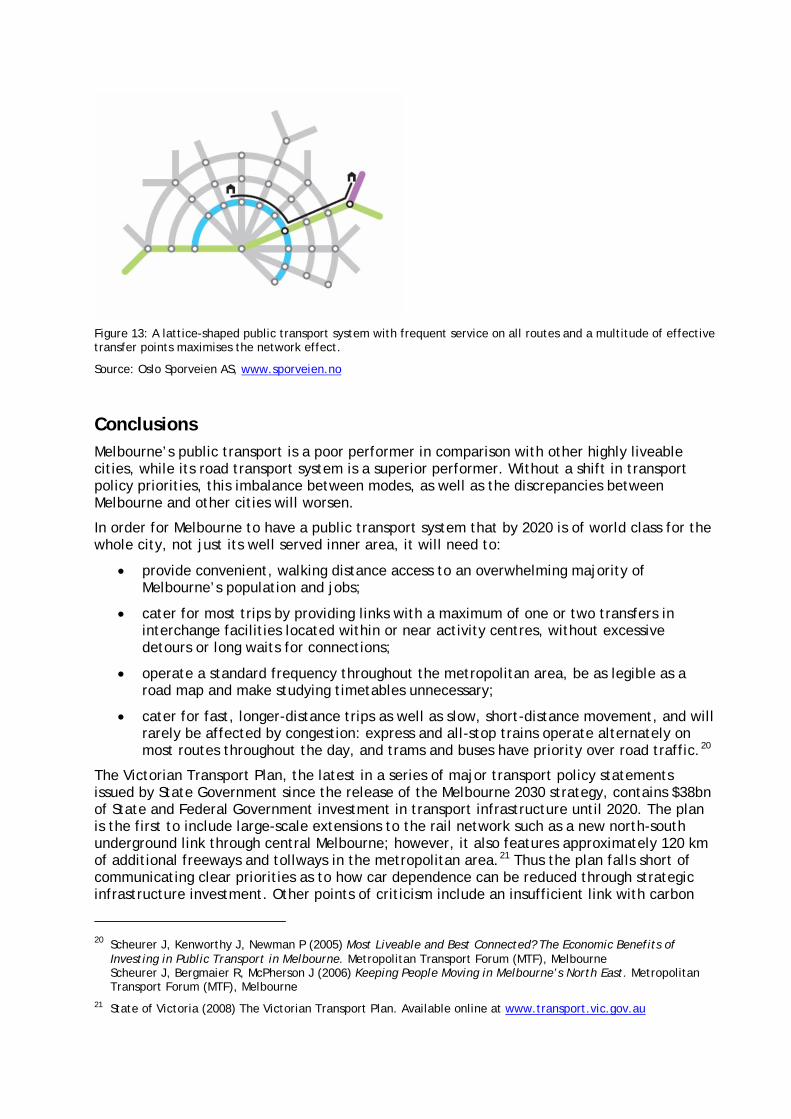
Figure 13: A lattice-shaped public transport system with frequent service on all routes and a multitude of effective transfer points maximises the network effect.
Source: Oslo Sporveien AS, www.sporveien.no
Conclusions Melbourne’s public transport is a poor performer in comparison with other highly liveable cities, while its road transport system is a superior performer. Without a shift in transport policy priorities, this imbalance between modes, as well as the discrepancies between Melbourne and other cities will worsen.
In order for Melbourne to have a public transport system that by 2020 is of world class for the whole city, not just its well served inner area, it will need to:
• provide convenient, walking distance access to an overwhelming majority of Melbourne’s population and jobs;
• cater for most trips by providing links with a maximum of one or two transfers in interchange facilities located within or near activity centres, without excessive detours or long waits for connections;
• operate a standard frequency throughout the metropolitan area, be as legible as a road map and make studying timetables unnecessary;
• cater for fast, longer-distance trips as well as slow, short-distance movement, and will rarely be affected by congestion: express and all-stop trains operate alternately on most routes throughout the day, and trams and buses have priority over road traffic.20
The Victorian Transport Plan, the latest in a series of major transport policy statements issued by State Government since the release of the Melbourne 2030 strategy, contains $38bn of State and Federal Government investment in transport infrastructure until 2020. The plan is the first to include large-scale extensions to the rail network such as a new north-south underground link through central Melbourne; however, it also features approximately 120 km of additional freeways and tollways in the metropolitan area.
21
20 Scheurer J, Kenworthy J, Newman P (2005) Most Liveable and Best Connected? The Economic Benefits of
Investing in Public Transport in Melbourne. Metropolitan Transport Forum (MTF), Melbourne Scheurer J, Bergmaier R, McPherson J (2006) Keeping People Moving in Melbourne’s North East. Metropolitan Transport Forum (MTF), Melbourne
Thus the plan falls short of communicating clear priorities as to how car dependence can be reduced through strategic infrastructure investment. Other points of criticism include an insufficient link with carbon
21 State of Victoria (2008) The Victorian Transport Plan. Available online at www.transport.vic.gov.au

reduction targets in the transport sector, an excessive focus on ‘big-ticket’ infrastructure items in lieu of substantial public transport improvements across underserviced local areas, and a tendency to overinflate projected expenditure on infrastructure and rolling stock.22
22 Bowen D (2008) Little Difference to most Melburnians. The Age, 7 December
Davidson K (2008) The Real Plan is to Push us back into Cars. The Age, 15 December Wakeham M (2008) What Will the Brumby Transport Plan Mean for Melbourne? Presentation at GAMUT Forum, University of Melbourne, 10 December