Melbourne’s North: Socio-economic overview
31
Melbourne’s North: Socio-economic overview Prepared by the National Institute of Economic and Industry Research (NIEIR) © copyright 2011 Melbourne’s Northern Economic Wedge Inc Trading as NORTH Link November 2011 Supported by
Transcript of Melbourne’s North: Socio-economic overview

Melbourne’s North:
Socio-economic overview
Prepared by the National Institute of Economic and Industry Research (NIEIR) © copyright 2011 Melbourne’s Northern Economic Wedge Inc Trading as NORTH Link
November 2011
Supported by

2
While the National Institute endeavours to provide reliable forecasts and believes the material is accurate, it will not be liable for any claim by any party acting on such information.

3
Contents
Page no.
1.
Regional Map
Melbourne’s North economic update
4
5
10 key facts about Melbourne’s NorthMulti-million dollar developments in Melbourne’s North
2. Strategic issues 9
3. SWOT Analysis 17
3.1 Strengths
3.2 Weaknesses
3.3 Opportunities
3.4 Threats
4. Key recommendations: building the region’s economic future 19
5. Melbourne’s North: key data 21
Appendix A: Melbourne’s North Inner LGAs: (Moreland, Darebin, Banyule and Yarra)
22
Appendix B: Melbourne’s North Outer LGAs: (namely Hume, Whittlesea and Nillumbik)
26
Appendix C: Gross product definition and data sources 30

4

5
1. Melbourne’s North economic update
1.1 An economy in transition
Melbourne’s North is defined as the region covering the seven local government areas of Banyule, Darebin, Hume, Moreland, Nillumbik, Whittlesea and Yarra. The region is highly diverse, and its inner regions are rapidly transitioning to knowledge economy and creative industry type development as manufacturing, logistics and warehousing activities develop in the outer parts of the region.
The region has experienced population growth of 136,556 over the past ten years. Experts predict that the rate of growth will increase more significantly over the next ten years with an additional 250,000 new residents expected. This will place further pressure on already strained regional infrastructure and services.
Melbourne's North has evolved from a manufacturing region to a knowledge economy region in which high tech manufacturing has been retained and significant research hubs are being developed. The region’s diverse and increasingly skilled residents provide an opportunity for the growth and relocation of businesses. Parts of the region such as Yarra, Northcote, Brunswick and Nillumbik are strongholds of the arts and entertainment. The region has quality residential precincts and still manages to provide affordable housing. With developing infrastructure and major assets such as Melbourne Airport, freight hubs, transport networks and the relocating wholesale markets, the growth potential for Melbourne’s North is high. The region still retains large areas of its natural environment combined with strong lifestyle attributes.
The developing role of activity centres and Central Activities Areas such as Broadmeadows in Hume, where renewal, housing and commercial development is taking place, reduce the focus of employment and commerce from the Melbourne CBD and create new opportunities in Melbourne’s North.
These initiatives are broadening the emphasis of future development, from growth driven by core city centric activities to a locally integrated model of commercial, industrial and residential development, strengthening existing centres in the region and developing new centres for growth.
Melbourne’s North can be described by its diversity. The region embraces diversity in built form, from among the oldest to the newest suburbs and a corresponding diversity in the culture, educational and ethnic background of its resident population. Per capita, the region is becoming wealthier in the long term.
Melbourne’s North had increased its share of Victorian GDP to 13 per cent even though it has traditionally been a manufacturing region.
The region’s share of Melbourne out of state exports is 17.5 per cent. Melbourne’s North is important to Melbourne’s overall economic performance, particularly as 20 per cent of the region’s out of state exports are for international markets.
The region has strong capacity for employment growth. Improving household productivity (including skills) in Melbourne’s North would increase employment by at least 7 per cent.
By 2030, the National Broadband Network (NBN) will have created productivity gains in Melbourne’s North of between 7 and 12 per cent.

6
Different areas, different images: this map highlights the diversity and strengths of Melbourne’s North.

7
10 key facts about Melbourne’s North
1. Competitive low cost business environment – greenfield sites and redevelopment opportunities, low set-up costs and affordable skilled labour.
2. Abundance of business parks for sustainable industrial development, connected to infrastructure and clustered with like companies.
3. A strategic location – a transport hub containing Melbourne Airport, which is connected to and within minutes of the CBD and the Port of Melbourne.
4. A highly skilled workforce, at a competitive cost – over 36% of the region’s workforce speaks a language other than English.
5. Renowned liveability – safe, multicultural, cosmopolitan and on the doorstep of Melbourne, one of the world’s most liveable cities.
6. Innovative industry in ICT and biotechnology, supported by R&D parks, educational institutions and government.
7. Uniquely competitive, with the highest concentration of advanced manufacturing in Australia.
8. Business incubators closely connected to government and education support programs.
9. World-class, innovative and outward looking education facilities and courses.
10. A connected business environment, with established networks and collaboration between industries – education, community and government are willing and able to meet industry needs.
Multi-million dollar developments in Melbourne’s North
1. The Coburg Initiative: $1 billion mixed use development, including over 8,000 sqm of office commercial accommodation; one completed and sold out plus new second office suite to be built.
2. University Hill at Bundoora: $1.1 billion mixed use, including two office buildings of over 8,000 sqm with small to medium sized offices.
3. Preston Civic Precinct Master Plan: $160 billion development including 17,000 sqm of office commercial accommodation.
4. Melbourne International Airport Development (including business and office parks): $400 million development to date on 50 ha – another 150 ha to go for total of $1.1 billion. Over $600 million proposed to be spent over the next three years.
5. Cooper Street Development at Epping (including the Melbourne Wholesale Market): $300 million government + private partnerships. Over 60,000 sqm of buildings – double current and with $1.5 billion turnover on 130 ha.
6. Hume Central Precinct Master Plan (including Broadmeadows Transit City): over $200 million mixed use development, and Craigieburn Town Centre over $200 million development.
7. Broadmeadows Place offices.
8. Greensborough Shopping Centre Precinct: over $220 million, including office commercial accommodation.
9. High Street Northcote redevelopment (including Australian Horizons): over $250 million, including 10,000 sqm office and commercial.

8
10. Biosciences Research Centre at La Trobe University: over $250 million and jobs for over 450 scientists.
11. Rydges Bell City: over $120 million – 4½ star hotel; over 800 rooms and apartments, the biggest hotel in Victoria
12. Merrifield Project: over $8 billion and Victoria’s largest fully master planned and integrated business and employment hub
13. Regional Indoor Sports Centre: over $35 million in Fitzroy North.
14. Collingwood Town Hall: refurbishment over $12 million
15. Nillumbik Green Wedge Management Plan: produces over $42 million pa of agricultural product.

9
2. Strategic issues
This section includes commentary on strategic issues that are likely to shape the future development of Melbourne’s North especially:
improvement of transport links within the region and with the CBD
a lifetime learning enhancement of existing resident skills to bring them into balance with what is required to better access catchment employment opportunities
encouraging local industry to exploit the region’s catchment in terms of knowledge based resources to increase productivity and integrate more efficiently with the region’s catchment supply chains
a connected region: implement an intensive region-wide rollout of the NBN.
2.1 Employment by industry
Figure 2.1: Total employment in Melbourne’s North by industry
0
10,000
20,000
30,000
40,000
50,000
60,000
70,000
1999 2000 2001 2002 2003 2004 2005 2006 2007 2008 2009 2010 2011
Employm
ent
C Manufacturing
Q Health Care and Social Assistance
G Retail Trade
E Construction
P Education and Training
I Transport, Postal and Warehousing
H Accommodation and Food Services
M Professional, Scientific and Technical Services
F Wholesale Trade
S Other Services
O Public Administration and Safety
N Administrative and Support Services
K Financial and Insurance Services
J Information Media and Telecommunications
L Rental, Hiring and Real Estate Services
R Arts and Recreation Services
D Electricity, Gas, Water and Waste Services
A Agriculture, Forestry and Fishing
B Mining

10
2.2 Share of value added
Figure 2.2: Melbourne’s North share of value added
2.3 Manufacturing and employment
The global financial crisis (GFC) has created challenges for regions around the globe. For Melbourne’s North and particularly the rapidly developing LGA of Hume, there has been a decline in manufacturing employment in industries such as the automotive sector. Many of these job losses have occurred as part of a realignment of global strategies, a realignment forced on large international companies by the impact of the GFC. It has therefore been difficult for local policy makers to influence this trend, which is driven by the cheaper prices available in China and elsewhere in Asia. Car sales have improved again post-GFC but high petrol costs and changing lifestyles are impacting on large car sales, the traditional manufacturing niche for Australian based automotive manufacturers. Ford has announced further job cuts, which will impact on manufacturing employment numbers in Melbourne’s North.
Retraining therefore becomes a regional issue, as do networks for retrenched workers to find equivalently skilled and paid work. The capacity to compete for new employment may also be an issue for some of the residents of Hume because of low level of skills, in at least some of the resident population.
If there are major automotive manufacturing closures or downsizing of operations in the region, while new jobs are being created in other parts of the manufacturing sector (food processing for example), stranding of the lowest skilled workers in casual work or long term structural unemployment remains an issue for both Hume and Whittlesea.
0.0%
2.0%
4.0%
6.0%
8.0%
10.0%
12.0%
14.0%
16.0%
18.0%
1999 2000 2001 2002 2003 2004 2005 2006 2007 2008 2009 2010
Melb's North Proportion of Value Added
MN Relative to Melb SD
MN Relative to VIC
MN Relative to AUST

11
Figure 2.3 and 2.4 illustrate that, although employment is declining, productivity in the leading manufacturing sectors is not declining and is showing an upturn since the GFC.
Figure 2.3: Manufacturing employment in Melbourne’s North by sector
Figure 2.4: Manufacturing value added in Melbourne’s North by sector
0
2,000
4,000
6,000
8,000
10,000
12,000
1999 2000 2001 2002 2003 2004 2005 2006 2007 2008 2009 2010 2011
Employed
23 Transport Equipment
11 Food Product
24 Machinery and Equipment
13 Textile, Leather, Clothing and Footwear
25 Furniture and Other
19 Polymer Product and Rubber Product
22 Fabricated Metal Product
21 Primary Metal and Metal Product
16 Printing (+ Reproduction of Recorded Media)
18 Basic Chemical and Chemical Product
15 Pulp, Paper and Converted Paper Product
20 Non‐Metallic Mineral Product
14 Wood Product
12 Beverage and Tobacco Product
17 Petroleum and Coal Product
0
250
500
750
1000
1250
1999 2000 2001 2002 2003 2004 2005 2006 2007 2008 2009 2010
$m (2007/08)
Transport Equipment
Food Product
Chemical
Machinery and Equipment
Textile, Leather, Clothing and Footwear
Furniture and Other
Fabricated Metal Product
Primary Metal and Metal Product
Printing
Pulp, Paper and Converted Paper Product
Non‐Metallic Mineral Product
Wood Product
Beverage and Tobacco Product
Petroleum and Coal Product

12
Figure 2.4: Manufacturing value added Melbourne’s North – by LGA
2.4 Significance of Melbourne Airport to Hume and to Melbourne’s North
Melbourne Airport employment continues to grow and provides major opportunity for further development in the region, particularly surrounding the airport. Many of the jobs created will be knowledge intensive and there are opportunities for innovation, research and education within the greater complex.
More than $1 billion in investment planned in next two years.
Employment for 12,500 people (11,000 full time equivalent positions).
Main employment areas are:
retail
aviation
air traffic control
air and road transport
airport management
security
hospitality.
Melbourne Airport experienced 22 per cent employment growth in the five years to 2008.
2.5 Relocation of the Wholesale Market
The relocation of the Wholesale Market, which should be considered as a major infrastructure project in its own right (with more than $1 billion of planned invested in the redevelopment cycle over the next 10 years), will provide a major benefit and ongoing opportunities for Melbourne’s North. The Wholesale Market currently has an annual turnover of more than $1.6 billion.
The rationale for the relocation of the Wholesale Market is to create a modern facility with improved access and a contemporary and integrated trading environment, and greater
13
opportunity for future development and growth in a related cluster of developments within the new food precinct. These developments could include businesses that are concerned with logistics and distribution of fresh produce, associated processing and packaging, various trading and export related activities, and education and training.
2.6 Cost of carbon and redefining Melbourne’s North
A long-term issue for Melbourne’s North has been one of perception. Old and outmoded perceptions are hard to shift.
Is the image of the Melbourne’s North one that will attract high tech, globally connected and high value adding firms? How can its image be redefined within a contemporary and forward looking economic context? Policies that help to redefine the region as a carbon efficient economy will enhance its future competitiveness and will be attractive to both new business and skilled residents.
Redefining the region’s image means efficient buildings – housing, commercial and industrial developments that require less energy in daily use. It means efficient local communities, where residents are close to employment or efficient modes of transport. It means appropriately skilled residents who can build and work in this environment. It means companies that can develop intellectual property to meet the needs of contemporary low carbon economies, and industry that can use new technologies to reduce energy consumptions and carbon emissions. It means continually improving amenity and cultural and recreational opportunities for residents. It means solid links between the region’s businesses and tertiary and research centres. And it means communities that are water efficient and internet enabled.
2.7 High speed internet and the NBN
Over the next one to two decades, high speed internet will result in a high degree of structural change in the demand for occupations. More importantly, a great deal more flexibility will be introduced to the location of employment to service the requirements of the region. These changes will also create an opportunity to strengthen the regional skills base in terms of a growing online economy. Given the region’s educational and research infrastructure, with change comes first mover advantage and an opportunity to define Melbourne’s North as a growing information economy.
By 2030, NIEIR projects productivity gains from the introduction of the NBN of the order of 11-12 per cent for inner regions of Melbourne, whereas the equivalent gains in most of the suburban regions are between 7 and 9 per cent. The benefit for non-metropolitan regions is lower, at around 5 per cent.
An intensive rollout of the NBN in Melbourne’s North will provide a strong return on investment with significant gains in productivity and regional integration. And this will occur, because of its existing assets and greater potential for improved efficiency, at higher levels than in most other regions.
2.8 Housing affordability, greenfield developments and the importance of public transport
The consequences of low dwelling construction rates are that the housing shortage is likely to increase, with consequences for all regions including Melbourne’s North.

14
High dwelling prices and rents in regions with good employment access (chiefly the inner and middle suburbs of the metropolitan cities) will reserve these regions for high-income earners and those with the luck to have inherited a house in the region.
These high-employment regions will also be characterised by increasing average
household size, particularly when measured in numbers of adults per household. The increase will be due to adult children who have not left their parents’ home and the formation of group households of varying degrees of functionality. The only way in which low-income tenants not provided with social housing will be able to afford the rents will be by overcrowding – and given the economic incentives, this will be difficult to prevent.
At the other extreme, the population of regions with poor employment access will
continue to increase as people are attracted to low-cost housing, particularly social security recipients who have given up hope of working.
The population living in marginal housing such as backyard caravans will also increase.
Higher levels of investment in transport, social and industry infrastructure, and on community services, will play a critical role in improving the level of accessible and affordable housing in Melbourne’s North.
2.9 Education and knowledge economy
The Melbourne’s North: the new knowledge economy report discussed the importance of the knowledge economy and industry and research links to the region’s future development prospects.
Issues and opportunities include:
equity in school education funding
accommodating students in the region
patents
incubators
building on the NBN (new media, digital economy, social media, film, audio, publishing)
design and engineering exports
business services
medicine and social services
arts and culture.

15
2.10 Percentage of households with bachelor or higher qualification, 2012 (as highest qualification)
The level of resident skills and qualifications is a strategic issue for some parts of the region.
NIEIR modelling and Data Envelopment Analysis shows that the gains in household productivity in Melbourne’s North from efficiency improvements, including improving skills, would be of the order of 20 per cent, while the increase in employment would be at least 7 per cent. The largest benefits would accrue to Banyule, Darebin and Moreland, with an average improvement in the performance indicators of approximately 20 per cent. Hume and Whittlesea would improve their performance indicators by around 10 per cent (from Melbourne’s North: the new knowledge economy report, 2009).

16
2.11 Benefitting from internationalisation
Trends indicate that the number of residents in Melbourne’s North who consider they are not proficient in spoken English had declined from 58,700 in 1996 to 55,000 in 2006. However the proportion that speak a language other than English increased, indicating that either individual migrants had improved their English skills between 1996 and 2006 or the newer arrivals have better English skills. It is likely to be a combination of both trends.
2.12 Amenity and environment
Continual improvement of amenities and environmental standards will assist Melbourne’s North in making the region the place to be for families and businesses, including:
design and architectural standards
housing for the future – building in regional competitiveness
high quality office accommodation
places to stay
industrial and commercial buildings – design, efficiency and co-generation
water supply and systems.
2.13 Energy use considerations
Future-proofing regional competitiveness includes:
industrial access to gas supply
creating communities with local jobs
effective transport systems
alternative sources of energy
construction of energy efficient housing, commercial and industrial buildings.
2.14 Transport system considerations
Transport related considerations are:
rail extensions
light rail
congestion in the inner parts of Melbourne’s North
airport and connectivity.
2.15 Industrial/commercial considerations
Wholesale markets – considerable opportunities to build cluster.
Manufacturing – there are positive stories here.
Airport precinct – potential for development of high tech clusters, and a knowledge and training precinct relating to aerospace.
Knowledge based exports, particularly education.

17
3. SWOT Analysis
3.1 Strengths
The existing asset base of the region can be leveraged to further improve economic performance. These assets include Melbourne Airport, the region’s medical precincts, and colleges and universities. New assets such as the development of the wholesale markets, freight hubs and master plan developments will add to existing opportunities.
A diverse economic base, development of which has managed to offset the decline of the manufacturing industry in the region.
A growing tertiary sector with developing research capacity.
The knowledge economy strengths of the inner region combined with the industrial strengths of parts of the outer region.
The opportunity, because of redevelopment options in the inner parts of the region and available greenfield sites in the outer parts, to develop well planned and sustainable communities.
Being a region-wide gateway to Melbourne, with major transport links to the north and with Melbourne Airport providing access to interstate and international markets.
3.2 Weaknesses
Inefficient and ineffective transport links reduce households’ capacity for mobility in some parts of the region, including sparse road, rail, tram and bus links within a given employment catchment and especially to major employment nodes.
Historical perception – it remains important to remind policy makers that the region has changed in terms of its amenity and capacity to provide local employment in a developing and diverse set of industries.
Level of household skills and the imbalance between skills demand of local industry when compared to resident skills. This is a critical policy issue and will drive the local economic outcomes and resident wellbeing for the former manufacturing zones within the region. Issues of skills imbalance also go beyond local industry. The region’s household skills mix will need to include residents with the capacity to access CBD knowledge type employment. This will assist the rapidly expanding cities of Hume and Whittlesea to provide improved business services to local industries, as highly qualified individuals switch from CBD type employment to local employment as more opportunities arise.
Relatively poor linkages between local enterprises, catchment enterprises and catchment industries, making relatively poor use of catchment skills. This is a knowledge and information based issue requiring improved business and employment networks with better communications and links.
Strategic drivers of regional productivity form supply chains oriented outside the catchment or are highly capital intensive, with low value added ratios accruing to catchment residents. This requires more activity at a local level that generates local investment in research and innovation to create greater value adding opportunities and the capacity to retain profits in the region, rather than exporting them.
3.3 Opportunities
Build in competitive advantage by creating sustainable housing and sustainable communities in greenfield sites in outer parts of the region and redevelopment areas in

18
the inner parts of the region. That is, create energy and water efficient buildings and local skilled employment opportunities.
Leverage regional assets to reduce regional inefficiencies.
Improve transport systems and, in doing so, lift regional productivity and amenity.
Improve supply chain efficiency and industry links, both internal and external to the region, by attracting export oriented enterprises to establish in the region and increasing knowledge intensity of local production to improve value adding ratios.
Build on opportunities to diversify some of the region’s employment opportunities into emerging knowledge economy sectors.
Focus employment growth strategies and training efforts on growth sectors, including some aspects of the manufacturing industry and regional assets including Melbourne Airport (aviation, transport and logistics), medical precincts and universities (research and commercialisation of intellectual property), wholesale markets (food processing and manufacturing, food logistics and exports), and niche education developments (such as the aviation college).
3.4 Export opportunities
Export of skills, such as design and engineering skills, and business services skills.
Export of intellectual property rights in bioscience, manufacturing, media, aerospace systems and technology, and green technologies.
Export of specialist food items and manufactures.
Export of education and skills development.
Licensing of locally developed intellectual property, such as inventions relating to climate change adaptation technologies or renewable energy.
3.5 Threats
Offshoring of employment, particularly in the manufacturing industry and automotive manufacturing industry.
Continued hollowing out of manufacturing industry supply chains, creating future declines in this sector.
The low skill levels of residents in some parts of the north and increasing skills demands of local industry, leading to long term structural unemployment and stranding of residents away from suitable employment nodes.
A carbon price shock damaging competitiveness of region, particularly exports.
Lack of opportunity for local enterprises to access new business generated by mining/energy export boom, particularly steel fabrication and engineering.
The impact of the economic development of India and China on the region, particularly manufacturing.
The strength of the Australian dollar and its impact on the region’s economic structure longer term.

19
4. Key recommendations: building the region’s economic future
1. Improve regional productivity and efficiency by an intensive rollout of the NBN in Melbourne’s North.
2. Invest more in secondary education manage transition pathways and develop the role of Local Learning Education Networks (LLENs).
3. Create vertical integration of school, university or TAFE with associated industry and focus on specific and locally relevant sectors in which to grow knowledge and skills.
4. Further strengthen the local knowledge economy by more closely integrating tertiary institutes into the region and encourage the development of associated activity clusters and business networks.
5. Invest in retraining strategies to assist the resident workforce to adapt to industrial change. Avoid the situation where workers move to insecure and low paid employment.
6. Continue investment in transport infrastructure and public transport, road and rail infrastructure, defining how rail and road systems will interact in the future, particularly as population growth in Melbourne’s North increases the need for a greater frequency of train services. Major barriers to economic efficiency without any apparent solution include the number of level crossings (there are 22 crossings in a distance of four kilometres, between Bell Street and Brunswick Road). This type of transport congestion issue must be resolved, otherwise growth in the middle and outer parts of Melbourne’s North will be constrained.
7. Differentiate Melbourne’s North through the number of business incubators located across the region, and create more incubators such as a technology incubator for Broadmeadows.
8. Greater provision of high quality office space to accommodate the growth businesses of the future.
9. Build on major investments in research and continue to build the knowledge cluster in Plenty Road.
10. Retain at least some of the highly qualified workers that Melbourne’s North is now exporting, to resource increasingly knowledge based industries.
11. Develop business networks at a regional level to improve the capacity of local businesses by encouraging knowledge diffusion and more R&D. Medical precincts and the like should be encouraged.
12. Strengthen manufacturing by creating a regional strategy that defines manufacturing output and associated services. Tap growth in the market for environmental products and services, and use resident manufacturing skills and know how.
13. Use the inner regions as a catalyst for diffusion of more knowledge intensive activities to the outer regions, particularly specialised business services.
14. The outer regions of the region need further consolidation, bringing together community and business, amenity and retail.
15. Stronger local communities will drive retail development at the local level; this includes a greater level of supply chain integration and greater use of the internet.
16. ‘Build in’ competitive advantage across the region by ensuring that the built form embraces the highest possible environmental standards.
17. Plan infrastructure development within the extended northern growth boundaries before commencing residential or commercial developments.

20
18. Develop an integrated jobs growth strategy for the region’s outer LGAs.
19. Recognise the importance of retaining employment lands in the inner and middle regions of Melbourne’s North.
20. Create opportunities for the further development of creativity, the arts and entertainment in Melbourne’s North to improved amenity and liveability.
21. Create a culture of home based entrepreneurship and working from home opportunities for residents by improving internet access and bandwidth. Where possible, encourage regional businesses to adapt to new ways of working to reduce transport congestion and greenhouse emissions.
22. Melbourne’s North needs more clusters of activity. The relocation of the wholesale markets provides opportunities to develop a range of specialised logistics and food businesses. New technologies in intensive agriculture, the cost of food miles and increasing local demand may create the opportunity for intensive high value agriculture at the urban fringe. The inter-relationships and opportunities, particularly given the strengths of the region’s post-school education provides in agriculture and agricultural research, should be investigated.
23. The cultural amenity (creative industries, festivals and arts infrastructure within the region) is driving cultural tourism to the inner parts of Melbourne’s North including Richmond, Collingwood, Abbotsford, Northcote, Westgarth, Brunswick and Fitzroy. The City of Yarra has more than 70 art spaces, many recognised nationally, in its various arts precincts. This growth in cultural and creative output and its associated amenity, including cafes, restaurants and accommodation, should be used to describe the region’s future capacity to drive amenity, innovation, design and cultural tourism.
21
5. Melbourne’s North: key data
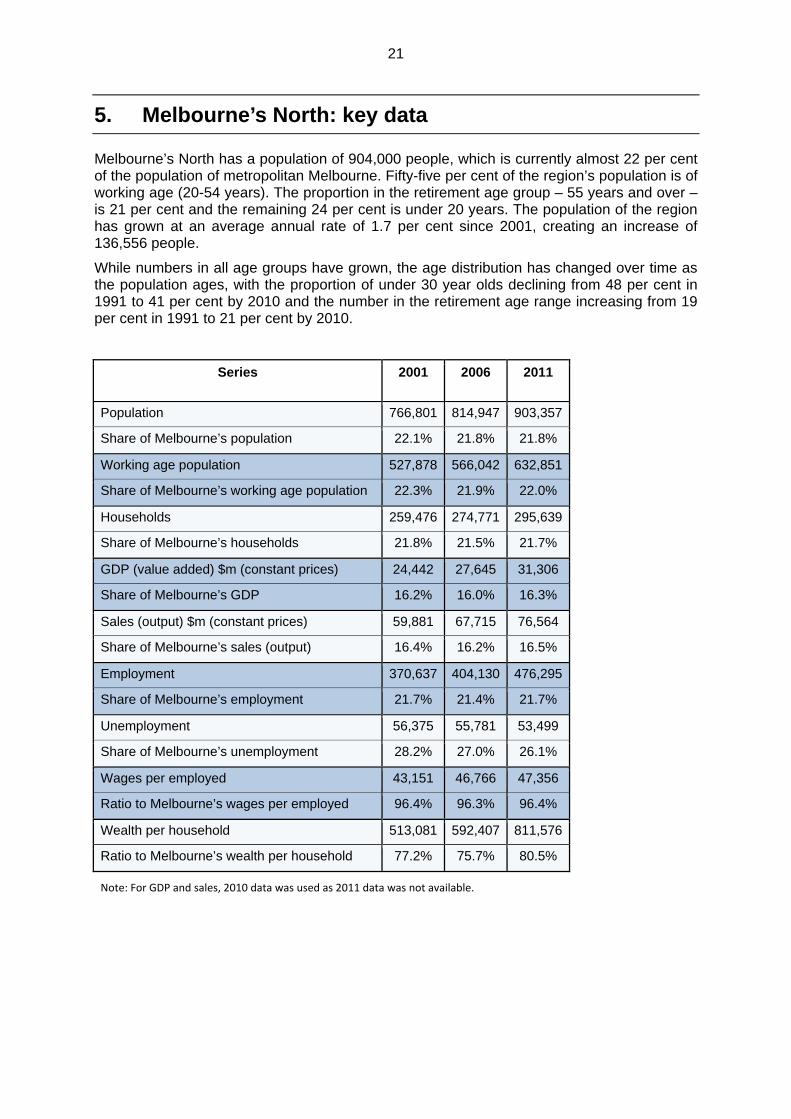
Melbourne’s North has a population of 904,000 people, which is currently almost 22 per cent of the population of metropolitan Melbourne. Fifty-five per cent of the region’s population is of working age (20-54 years). The proportion in the retirement age group – 55 years and over – is 21 per cent and the remaining 24 per cent is under 20 years. The population of the region has grown at an average annual rate of 1.7 per cent since 2001, creating an increase of 136,556 people.
While numbers in all age groups have grown, the age distribution has changed over time as the population ages, with the proportion of under 30 year olds declining from 48 per cent in 1991 to 41 per cent by 2010 and the number in the retirement age range increasing from 19 per cent in 1991 to 21 per cent by 2010.
Series 2001 2006 2011
Population 766,801 814,947 903,357
Share of Melbourne’s population 22.1% 21.8% 21.8%
Working age population 527,878 566,042 632,851
Share of Melbourne’s working age population 22.3% 21.9% 22.0%
Households 259,476 274,771 295,639
Share of Melbourne’s households 21.8% 21.5% 21.7%
GDP (value added) $m (constant prices) 24,442 27,645 31,306
Share of Melbourne’s GDP 16.2% 16.0% 16.3%
Sales (output) $m (constant prices) 59,881 67,715 76,564
Share of Melbourne’s sales (output) 16.4% 16.2% 16.5%
Employment 370,637 404,130 476,295
Share of Melbourne’s employment 21.7% 21.4% 21.7%
Unemployment 56,375 55,781 53,499
Share of Melbourne’s unemployment 28.2% 27.0% 26.1%
Wages per employed 43,151 46,766 47,356
Ratio to Melbourne’s wages per employed 96.4% 96.3% 96.4%
Wealth per household 513,081 592,407 811,576
Ratio to Melbourne’s wealth per household 77.2% 75.7% 80.5%
Note: For GDP and sales, 2010 data was used as 2011 data was not available.

22
Appendix A: Melbourne North Inner LGAs – (Moreland, Darebin, Banyule and Yarra)
Melbourne North begins five kilometres north of the CBD, on the other side of Royal Park, and extends to the inner ring road. The western half
of the region is relatively flat, and its development was originally based on brick‐making manufacturing. For over a century this part of the region was working class but the decline of manufacturing has resulted in its joining the hillier eastern half of the region gentrification and commuting. LaTrobe University is the centre of a knowledge precinct and
Heidelburg of a medical precinct. The region is noted for its ethnic diversity.
Major centres:
Coburg, Richmond, Greensborough
LABOUR FORCE
Number ('000s) Percentage Change %p.a. growth
2006 2007 2008 2009 2010 20112006
to 20072007
to 20082008
to 20092009
to 2010 2010
to 2011 2006‐2009
2009‐2011
Population 469 476 482 491 496 500 1.5% 1.4% 1.7% 1.1% 0.8% 1.5% 0.9%No. Households 171 172 173 174 175 178 0.3% 0.6% 0.7% 0.8% 1.3% 0.5% 1.0%NIEIR Workforce 255 260 273 271 283 293 2.1% 4.8% ‐0.8% 4.6% 3.3% 2.0% 4.0%NIEIR Employment 236 244 258 256 266 276 3.6% 5.5% ‐0.7% 4.1% 3.5% 2.7% 3.8%NIEIR Unemployment 19.4 16.2 15.3 14.9 16.8 17.0 ‐16.6% ‐5.4% ‐2.7% 12.6% 1.1% ‐8.4% 6.7%
UNEMPLOYMENT AND UNDER EMPLOYMENT
Percentage Percentage Point Change Average % Point
Change pa
2006 2007 2008 2009 2010 20112006
to 20072007
to 20082008
to 20092009
to 2010 2010
to 2011 2006‐2009
2009‐2011
NIEIR U/E Rate 7.6% 6.2% 5.6% 5.5% 5.9% 5.8% ‐1.4 ‐0.6 ‐0.1 0.4 ‐0.1 ‐0.7 0.1Headline U/E Rate 6.1% 5.1% 4.7% 4.4% 5.0% 4.9% ‐1.0 ‐0.4 ‐0.3 0.6 ‐0.1 ‐0.6 0.3NIEIR Structural U/E Rate 10.0% 9.5% 9.2% 8.7% 8.5% 8.2% ‐0.5 ‐0.2 ‐0.5 ‐0.2 ‐0.3 ‐0.4 ‐0.3Social Security Takeup 12.3% 11.4% 10.7% 11.1% 10.4% 10.6% ‐0.9 ‐0.7 0.4 ‐0.7 0.2 ‐0.4 ‐0.3Hours Per Week (1) 23.5 23.8 24.6 23.7 24.0 24.9 0.3 0.9 ‐0.9 0.3 0.9 0.1 0.6Not Employed Share (1) 27.9% 26.5% 23.7% 25.7% 24.3% 22.6% ‐1.4 ‐2.8 2.1 ‐1.5 ‐1.7 ‐0.7 ‐1.6Not In Employment (1) 38.1% 37.4% 35.2% 37.6% 36.7% 34.5% ‐0.7 ‐2.3 2.5 ‐0.9 ‐2.3 ‐0.2 ‐1.6Note: (1) Relat iv e to Working Age Population.
INCOME FLOWS & PRODUCTIVITY
Level $m cvm Per Capita $cvm%p.a. Growthof Level
2006 2007 2008 2009 2010 2011 2006 2007 2008 2009 2010 2011 2006‐2009
2009‐2011
Wages/Salaries 11,271 12,116 12,935 12,798 12,967 13,431 24,049 25,467 26,822 26,087 26,156 26,807 4.3% 2.4%Taxes Paid 3,067 2,984 3,390 3,318 3,119 3,584 6,545 6,272 7,028 6,763 6,290 7,153 2.6% 3.9%Benefits 2,191 2,218 2,179 2,768 2,403 2,468 4,674 4,662 4,518 5,642 4,848 4,925 8.1% ‐5.6%Business Income 1,788 1,993 1,945 1,797 1,854 1,834 3,814 4,190 4,033 3,662 3,740 3,661 0.2% 1.0%Interest Paid 1,280 1,610 1,918 1,690 1,827 2,184 2,732 3,384 3,977 3,445 3,685 4,360 9.7% 13.7%Property Income 2,089 2,420 2,700 2,544 2,763 3,100 4,456 5,087 5,598 5,186 5,572 6,187 6.8% 10.4%Disposable Income 15,801 17,135 17,731 18,374 18,599 18,809 33,715 36,017 36,767 37,452 37,516 37,541 5.2% 1.2% Rank 18 17 18 22 20 26 %Rank #1 65% 63% 63% 63% 60% 58% Resident GRP (Local) 18,836 20,429 21,921 21,790 22,039 21,749 57,568 61,462 64,939 63,276 62,671 61,113 5.0% ‐0.1% Rank 19 15 14 15 16 18 Industry GRP (Local) 16,390 17,436 18,241 18,033 18,395 17,864 81,712 85,608 87,500 86,904 85,688 80,244 3.2% ‐0.5% Rank 15 12 13 13 15 22 Note: (1) All years stated above are fiscal year ending.
(2) Figures for wages/salaries include superannuation supplements. (3) Figures for disposable income (less depreciat ion expense) include imputed income from ownership of dwellings.
(4) Figures for Resident GRP ( Local) are per working age population and figures for Industry GRP (Local) are per industry employee. (5) $m cvm = $ million chain volume measure, which is f lows of constant 2008‐09 value converted f rom current values by the ABS using their chain volume methodology.

23
SOCIAL SECURITY
% Pop Australian Average
Disability Support (aged 15‐20) 0.07% 0.09%Disability Support (aged 21‐24) 0.12% 0.14%Disability Support (aged 25+) 3.64% 3.31%Parenting Payment ‐ Single (aged 15‐20) 0.02% 0.04%Parenting Payment ‐ Single (aged 21‐24) 0.15% 0.20%Parenting Payment ‐ Single (aged 25+) 0.96% 1.23%Unemployed Long Term 1.55% 1.45%Unemployed Short Term 0.95% 0.92%Youth Allowance ‐ Non Student 0.23% 0.39%Youth Allowance ‐ Student 1.78% 1.29%
Cash Benefits Share of Disposable Income Share Rank2010 13.1% 442009 12.9% 442008 15.1% 422007 12.3% 432006 12.9% 422005 13.9% 38
POPULATION CHANGE 1996 2001 2006 2011
Share of Population Age 0‐19 22.5% 21.8% 21.0% 19.7% Age 20‐29 19.3% 17.8% 17.7% 19.5% Age 30‐54 34.9% 36.8% 37.5% 37.9% Age 55+ 23.3% 23.7% 23.7% 22.9%Population Change (average between years) Age 0‐19 ‐589 1 19 Age 20‐29 ‐1,261 553 2,854 Age 30‐54 1,953 1,930 2,713 Age 55+ 443 873 612Average Annual Growth 0.1% 0.7% 1.3%
Average Temperature
19
19
20
20
21
21
22
22
2001
2002
2003
2004
2005
2006
2007
2008
2009
2010
2011
PATENT APPLICATIONS
No Aust Avg RankAverage p.a. (1994‐2009) 70.72 3,109.81 13Average p.a. per capita 15.34 15.69 15Hi Tech p.a. (1994‐2009) 22.42 864.69 12Hi Tech p.a. per capita 4.86 4.33 13Info. Tech p.a. (1994‐2009) 7.15 342.17 15Info. Tech p.a. per capita 1.55 1.70 14Average per capita (1994‐2001) 11.85 13.06 18Average per capita (2001‐2009) 18.50 18.09 142001‐09 avg./1994‐00 avg. 1.56 1.39 10Note: Per capita = 100,000 people 2010 data not available
Patent Applications per 100,000 residents
05
10
15
20
25
1994
1995
1996
1997
1998
1999
2000
2001
2002
2003
2004
2005
2006
2007
2008
2009
Melbourne Northern Inner Australian Average
Populat ion Change by Age Group
‐2,000
‐1,0000
1,000
2,000
3,000
4,000
1996‐2001 2001 ‐2006 2006‐2011
0‐19 20‐29 30‐54 54+
Annual Rainfall
0
200
400
600
800
1,000
2001
2002
2003
2004
2005
2006
2007
2008
2009
2010
2011
TEMPERATURE AND RAINFALL 2001 2002 2003 2004 2005 2006 2007 2008 2009 2010 2011
Temperature (Avg (C)) 21 21 21 20 21 20 22 21 21 22 20 Rank 53 49 49 51 48 56 50 50 49 48 45Rainfall (mm) 906 599 371 539 720 520 368 378 346 469 598 Rank 24 40 51 42 32 46 54 56 62 55 56
POPULATION 1992 1993 1994 1995 1996 1997 1998 1999 2000 2001 2002 2003 2004 2005 2006 2007 2008 2009 2010 2011
Population 450 447 445 446 449 451 450 451 450 452 454 456 458 462 469 476 482 491 496 500
INNOVATIVE STARTUPS 1992 1993 1994 1995 1996 1997 1998 1999 2000 2001 2002 2003 2004 2005 2006 2007 2008 2009 2010
Startups 62.5 85.1 93.3 84.5 114.4 121.4 116.5 101.2 75.5 39.6 48.8 55.4 53.4 43.5 30.1 32.0 22.9 16.9 6.5 Rank 16 13 21 17 13 13 6 8 9 16 9 7 7 9 22 11 13 13 25Note: (1) Data source Dun and Bradstreet database. The Dun and Bradstreet database does not represent all business entities. (2) Counts are per 100,000 employed.

24
HOUSEHOLD WEALTH & DEBT
Year Rank %Rank 1 Indicator 2001 2006 2011 2001 2006 2011 2001 2006 2011Wealth per Household ($cvm '000s) 579 679 939 13 15 10 31% 33% 40% Value of Property and Unincorporated Business 489 596 886 10 14 7 46% 48% 64% Value of Financial Assets 172 222 255 37 34 30 19% 22% 22% Value of Household Liabilities 82 139 202 45 33 29 54% 55% 46% Disposable Income after Debt Service Costs 73 86 96 42 35 43 60% 57% 47%Household Debt Service Ratio 12% 17% 22% 49 36 17 62% 68% 82%Household Debt to Gross Income Ratio 0.96 1.37 1.70 49 36 17 62% 68% 82%
RESIDENTIAL AND NON‐RESIDENTIAL BUILDING CONSTRUCTION
2002 ‐2004 2005 2006 2007 2008 2009 2010 2011
PercentageIncrease2006‐08
to 2009‐11Value $m cvm per annum Residential 1,529 655 600 546 572 727 807 1,068 51% Non Residential 1,399 312 334 390 439 502 560 536 37% Total 2,928 967 934 936 1,011 1,229 1,367 1,604 46%Value per capita $cvm Residential 1,117 1,418 1,281 1,147 1,186 1,482 1,628 2,132 45% Non Residential 1,023 674 712 820 911 1,023 1,129 1,069 32% Total 2,140 2,092 1,993 1,967 2,097 2,505 2,757 3,201 40%Rank (value per capita) Residential 48 47 48 53 51 34 30 16 Non Residential 18 50 54 47 47 33 33 41 Total 38 50 53 54 54 33 31 27 Note: (1) Percentage increase represents the increase (or decrease) of the last three years average when compared to the average of the three years prior to those.
EMPLOYMENT GENERATING CAPACITY Indicator Value Rank
Commercial Floorspace Generating Capacity 5,238 19% of National Employment Generating Capacity 1.51% 19Ratio of Generating Capacity to Working Age Pop 0.82 51
MINING BOOM Production Impact
Indicator
Construction (Annual Average)
Gross expansion(1 Year)
Gross crowding out
(1 Year)
Net full crowding out
(1 Year)
Net half crowding out
(1 Year)
Net full crowding out
(5 Years)
Net half crowding out
(5 Years)
Industry Hours 0.62 0.20 ‐0.94 ‐0.74 ‐0.27 ‐3.63 ‐1.33Local Industry Product 0.69 0.23 ‐0.95 ‐0.72 ‐0.25 ‐3.56 ‐1.24Resident Employment 0.59 0.22 ‐0.77 ‐0.55 ‐0.16 ‐2.70 ‐0.81Note: Indicator values represent percent change from base case (where the base case excludes accelerated mining expansion) .
CONSUMPTION
Indicator 1999 2000 2001 2002 2003 2004 2005 2006 2007 2008 2009 2010 GrowthConsumption ($m cvm) 10,442 10,686 11,070 11,369 11,750 12,444 12,713 13,021 13,511 13,754 13,931 14,188 2.8%Consumption Per Cap ($cvm) 23,187 23,716 24,593 25,159 25,891 27,302 27,756 28,158 28,829 28,911 28,887 29,420 2.2%Consumption Per Cap Rank 15 17 16 16 15 17 18 17 17 18 17 18 33Note: All years stated above are calendar years.
Consumption per capita
0
5,000
10,000
15,000
20,000
25,000
30,000
35,000
1999
2000
2001
2002
2003
2004
2005
2006
2007
2008
2009
2010

25
HOUSING
Housing Indicator 1991.3 1997.3 2001.3 2006.3 2008.2 2010.2 2011.2 1997.3 Rank
2011.1 Rank
Annual Growth1997‐11
Avg value of dwellings ($cvm '000s) 174.5 197.3 316.8 426.7 506.0 560.7 548.7 19 11 7.7%Avg dwelling prices to household disposable income (%) n/a 2.9 4.3 5.1 5.9 6.2 6.2 17 5 5.6%Mortgage burden on average dwel ling purchase (%) n/a 23.4 34.7 40.5 46.7 49.7 49.5 17 5 5.6%Greenfield construction costs to avg dwelling price (%) n/a n/a n/a 1.1 1.0 0.9 0.9 n/a 49 n/aCatchment dwelling purchase income support ($cvm) 56,594 64,015 70,389 86,368 89,835 86,721 87,360 11 16 2.3%Dwelling affordability ‐ average mortgage on existing dwelling to catchment income support (%) n/a 24.6 35.9 39.4 45.0 51.6 50.1 22 12 5.3%Dwelling affordability ‐ average mortgage on new dwelling to catchment income support (%) n/a n/a n/a 45.1 43.9 47.0 47.2 n/a 11 n/aCommunity services available in catchment ‐ hours/capita 140.7 158.8 165.6 175.7 181.9 189.2 189.1 8 2 1.3%Adult population per dwelling 2.3 2.2 2.2 2.2 2.3 2.3 2.3 23 34 0.3%
NATIONAL BROADBAND NETWORK
Indicator 2015 2020 2025 2030 2035 20402015 Aust
2020 Aust
2025 Aust
2030 Aust
2035 Aust
2040 Aust
Functionality Relative to Requirements ‐ Base Case 73.7 33.0 19.5 15.2 15.2 15.2 53.0 36.3 29.5 24.9 24.1 24.1Functionality Relative to Requirements ‐ NBN Case 100.0 98.0 98.0 97.0 97.0 97.0 73.9 92.8 92.6 91.1 91.0 91.0Actual Productivity Extraction ‐ percent (Base Case) 2.4 2.9 3.0 3.0 2.9 2.9 2.0 2.6 3.2 3.6 4.0 4.2Actual Productivity Extraction ‐ percent (NBN Case) 2.5 4.1 6.5 9.2 11.6 13.3 2.1 3.5 5.8 8.3 10.4 12.0Industry Hours of Work (% of Base Case) 0.0 ‐0.1 ‐0.5 ‐0.9 ‐1.1 ‐1.2 0.0 ‐0.1 ‐0.2 ‐0.3 ‐0.4 ‐0.4Real Wages (% of Base Case) 0.0 0.8 2.7 5.1 7.3 8.9 0.0 0.7 2.2 4.2 6.0 7.4Resident Income (% of Base Case) 0.0 0.7 2.0 3.8 5.5 6.8 0.0 0.6 2.1 3.9 5.6 6.9Local Industry Product (% of Base Case) 0.0 0.7 2.2 4.1 6.1 7.5 0.0 0.6 2.0 3.8 5.6 7.0Resident Employment (% of Base Case) 0.0 ‐0.2 ‐0.5 ‐0.9 ‐1.2 ‐1.4 0.0 ‐0.1 ‐0.3 ‐0.5 ‐0.6 ‐0.6Consumption Expenditure (% of Base Case) 0.0 0.8 2.5 4.6 6.5 7.9 0.0 0.6 2.1 3.8 5.4 6.6
EMPLOYED, HOURS WORKED AND INCOME (UR=Place of Residence, JTW=Place of Work)
Indicator 1991.3 1996.3 2001.3 2006.3 2011.11991.3Rank
1996.3 Rank
2001.3 Rank
2006.3Rank
2011.1Rank
UR Emp 208,403 208,714 216,947 242,136 278,437 12 13 17 15 14UR Hours 92,027 92,920 93,237 103,251 115,561 12 13 16 15 14UR Income 2,260 2,532 2,890 3,833 4,344 15 15 15 17 16JTW Emp 170,038 180,268 188,343 205,805 223,885 11 12 12 14 15JTW Hours 74,917 79,341 79,974 86,903 92,099 12 12 12 14 14JTW Income 1,933 2,200 2,485 3,159 3,378 13 12 12 11 13UR Avg Weekly Hours Per Employee 34.0 34.2 33.1 32.8 31.9 40 34 35 42 48UR Avg Hourly Rate Per Employee ($cvm) 24.6 27.3 31.0 37.1 37.6 61 48 42 17 25JTW Avg Weekly Hours Per Employee 33.9 33.9 32.7 32.5 31.6 40 44 43 47 51JTW Avg Hourly Rate Per Employee ($cvm) 25.8 27.7 31.1 36.4 36.7 51 43 40 18 30
INDUSTRY GROUPS
Place of Residence (UR) Place of Work (JTW) 1991.3 1996.3 2001.3 2006.3 2011.1 1991.3 1996.3 2001.3 2006.3 2011.1A Agriculture, Forestry and Fishing 571 637 769 676 759 244 274 289 239 261B Mining 213 370 423 447 626 131 187 177 217 302C Manufacturing 37,458 32,146 26,106 23,090 24,056 31,629 30,580 27,000 25,391 25,362D Electricity, Gas, Water & Waste Services 1,977 1,268 1,364 1,860 1,729 832 603 618 884 1,069E Construction 11,242 11,289 12,761 16,488 20,533 9,485 10,076 11,704 15,446 19,365F Wholesale Trade 9,659 10,116 8,837 9,752 8,932 10,764 11,879 10,752 12,082 9,704G Retail Trade 22,874 20,517 22,883 22,270 22,248 23,111 22,041 25,139 24,583 23,703H Accommodation and Food Services 9,866 12,948 14,505 15,512 20,308 7,232 9,850 11,195 11,798 14,459I Transport, Postal and Warehousing 14,581 10,203 9,059 10,204 12,139 7,403 5,758 5,144 5,875 6,426J Information Media and Telecoms 6,209 6,553 8,058 9,484 10,571 3,964 4,287 4,948 5,455 5,501K Financial and Insurance Services 9,896 9,268 9,975 12,735 13,113 6,302 5,898 5,906 7,230 7,351L Rental, Hiring and Real Estate Services 3,121 2,020 2,807 3,279 3,226 2,515 1,841 2,554 3,073 2,796M Prof, Scientific & Technical Services 11,759 16,422 19,561 24,971 27,698 8,362 11,356 12,809 15,566 17,941N Administrative and Support Services 5,099 6,963 8,705 8,719 9,329 3,472 4,885 6,076 6,098 6,958O Public Administration and Safety 13,651 12,338 12,738 15,310 16,264 8,258 7,747 7,608 8,746 8,849P Education and Training 16,155 17,988 19,783 23,226 25,305 11,645 13,258 14,549 16,444 18,136Q Health Care and Social Assistance 21,262 23,936 25,165 28,387 38,766 23,297 27,560 29,906 33,427 39,562R Arts and Recreation Services 2,475 4,031 4,690 6,326 9,084 1,565 2,463 2,703 3,461 3,719S Other Services 10,335 9,700 8,757 9,400 13,750 9,826 9,725 9,266 9,791 12,422 Total 208,403 208,714 216,947 242,136 278,437 170,038 180,268 188,343 205,805 223,885 Hi Tech 24,044 26,345 27,125 32,152 35,124 18,787 21,147 21,126 24,069 26,233 Hi Income 24,121 30,058 35,032 43,545 47,032 16,478 20,221 22,290 26,534 29,505 Infrastructure Services 39,892 45,955 49,639 57,939 73,155 36,508 43,281 47,157 53,332 61,417

26
Appendix B: Melbourne North Outer LGAs: (namely Hume, Whittlesea and Nillumbik)
The western part of Melbourne Outer North comprises gentle basalt slopes, the sites of manufacturing industries and increasingly of
wholesale and logistics enterprises attached to the southern end of the Hume Highway and Melbourne Airport – which lies on the boundary of Western Melbourne. The population of this half of the region was traditionally working class and ethnically diverse, and so quite distinct from the people of the hilly commuter residential area which comprises
the east of the region. Latrobe University l ies at the junction of the two.
Major centres:
Whittlesea, Broadmeadows
LABOUR FORCE Number ('000s) Percentage Change %p.a. growth
2006 2007 2008 2009 2010 20112006
to 20072007
to 20082008
to 20092009
to 2010 2010
to 2011 2006‐2009
2009‐2011
Population 346 355 366 378 391 404 2.5% 3.0% 3.3% 3.6% 3.2% 2.9% 3.4%No. Households 103 105 108 110 114 118 1.9% 2.2% 2.4% 3.1% 3.7% 2.2% 3.4%NIEIR Workforce 185 190 196 201 211 220 2.9% 3.2% 2.6% 4.6% 4.3% 2.9% 4.5%NIEIR Employment 168 175 181 186 193 201 4.1% 3.4% 2.6% 3.7% 4.1% 3.4% 3.9%NIEIR Unemployment 16.4 15.0 15.2 15.6 18.0 19.2 ‐8.7% 1.8% 2.5% 15.4% 6.2% ‐1.6% 10.7%
UNEMPLOYMENT AND UNDER EMPLOYMENT
Percentage Percentage Point Change Average % Point
Change pa
2006 2007 2008 2009 2010 20112006
to 20072007
to 20082008
to 20092009
to 2010 2010
to 2011 2006‐2009
2009‐2011
NIEIR U/E Rate 8.9% 7.9% 7.8% 7.8% 8.6% 8.7% ‐1.0 ‐0.1 0.0 0.8 0.2 ‐0.4 0.5Headline U/E Rate 6.1% 5.1% 4.9% 4.9% 6.0% 6.2% ‐1.0 ‐0.2 0.0 1.1 0.2 ‐0.4 0.7NIEIR Structural U/E Rate 9.7% 9.4% 9.3% 9.0% 8.8% 8.8% ‐0.3 0.0 ‐0.4 ‐0.1 ‐0.1 ‐0.2 ‐0.1Social Security Takeup 12.3% 11.7% 11.3% 11.9% 11.2% 11.7% ‐0.6 ‐0.4 0.6 ‐0.7 0.5 ‐0.1 ‐0.1Hours Per Week (1) 23.1 23.2 23.2 22.8 22.9 23.1 0.1 0.0 ‐0.4 0.1 0.3 ‐0.1 0.2Not Employed Share (1) 29.5% 28.5% 28.4% 29.0% 28.3% 27.5% ‐1.0 ‐0.1 0.6 ‐0.7 ‐0.7 ‐0.2 ‐0.7Not In Employment (1) 39.3% 38.9% 38.9% 40.1% 39.8% 39.1% ‐0.4 0.1 1.1 ‐0.3 ‐0.7 0.3 ‐0.5Note: (1) Relat iv e to Working Age Population.
INCOME FLOWS & PRODUCTIVITY
Level $m cvm Per Capita $cvm%p.a. Growthof Level
2006 2007 2008 2009 2010 2011 2006 2007 2008 2009 2010 2011 2006‐2009
2009‐2011
Wages/Salaries 7,629 8,189 8,583 8,718 8,840 9,124 22,031 23,075 23,477 23,080 22,593 22,538 4.5% 2.3%Taxes Paid 1,896 1,850 2,023 1,988 1,887 2,150 5,474 5,214 5,533 5,262 4,823 5,310 1.6% 4.0%Benefits 1,376 1,432 1,389 1,847 1,639 1,721 3,974 4,037 3,798 4,889 4,190 4,251 10.3% ‐3.5%Business Income 965 1,086 1,021 946 980 971 2,787 3,059 2,794 2,506 2,504 2,398 ‐0.6% 1.3%Interest Paid 946 1,053 1,258 1,202 1,190 1,515 2,733 2,968 3,441 3,182 3,040 3,743 8.3% 12.3%Property Income 1,184 1,362 1,496 1,435 1,563 1,728 3,420 3,838 4,093 3,798 3,995 4,268 6.6% 9.7%Disposable Income 10,138 11,142 11,334 12,029 12,239 12,324 29,278 31,397 31,001 31,844 31,278 30,443 5.9% 1.2% Rank 48 43 51 56 56 57 %Rank #1 56% 55% 53% 53% 50% 47% Resident GRP (Local) 11,724 12,587 13,103 13,260 13,583 13,458 49,085 51,379 51,813 50,686 50,535 48,591 4.2% 0.7% Rank 48 40 42 45 48 55 Industry GRP (Local) 10,082 10,877 11,366 11,438 11,890 11,756 72,737 74,419 74,443 73,311 72,879 69,499 4.3% 1.4% Rank 45 41 48 50 53 60 Note: (1) All years stated above are fiscal year ending. (2) Figures for wages/salaries include superannuation supplements.
(3) Figures for disposable income (less depreciat ion expense) include imputed income from ownership of dwellings. (4) Figures for Resident GRP ( Local) are per working age population and figures for Industry GRP (Local) are per industry employee.
(5) $m cvm = $ million chain volume measure, which is f lows of constant 2008‐09 value converted f rom current values by the ABS using their chain volume methodology.

27
SOCIAL SECURITY
% Pop Australian Average
Disability Support (aged 15‐20) 0.09% 0.09%Disability Support (aged 21‐24) 0.14% 0.14%Disability Support (aged 25+) 3.64% 3.31%Parenting Payment ‐ Single (aged 15‐20) 0.01% 0.04%Parenting Payment ‐ Single (aged 21‐24) 0.03% 0.20%Parenting Payment ‐ Single (aged 25+) 0.35% 1.23%Unemployed Long Term 1.48% 1.45%Unemployed Short Term 0.94% 0.92%Youth Allowance ‐ Non Student 0.37% 0.39%Youth Allowance ‐ Student 1.84% 1.29%
Cash Benefits Share of Disposable Income Share Rank2010 14.0% 392009 13.4% 412008 15.4% 412007 12.3% 452006 12.9% 442005 13.6% 43
POPULATION CHANGE 1996 2001 2006 2011
Share of Population Age 0‐19 33.4% 32.1% 30.7% 29.4% Age 20‐29 16.3% 14.4% 14.1% 15.1% Age 30‐54 37.7% 38.3% 37.2% 35.8% Age 55+ 12.6% 15.2% 18.0% 19.7%Population Change (average between years) Age 0‐19 1,215 1,047 2,531 Age 20‐29 ‐183 662 2,449 Age 30‐54 2,685 1,670 3,096 Age 55+ 2,421 2,893 3,407Average Annual Growth 2.1% 1.9% 3.1%
Average Temperature
18
19
19
20
20
21
21
22
2001
2002
2003
2004
2005
2006
2007
2008
2009
2010
2011
PATENT APPLICATIONS
No Aust Avg RankAverage p.a. (1994‐2009) 37.08 3,109.81 26Average p.a. per capita 11.34 15.69 23Hi Tech p.a. (1994‐2009) 7.92 864.69 26Hi Tech p.a. per capita 2.38 4.33 22Info. Tech p.a. (1994‐2009) 1.79 342.17 31Info. Tech p.a. per capita 0.54 1.70 35Average per capita (1994‐2001) 7.98 13.06 35Average per capita (2001‐2009) 14.17 18.09 202001‐09 avg./1994‐00 avg. 1.78 1.39 2Note: Per capita = 100,000 people 2010 data not available
Patent Applications per 100,000 residents
05
10
15
20
25
1994
1995
1996
1997
1998
1999
2000
2001
2002
2003
2004
2005
2006
2007
2008
2009
Melbourne Northern Outer Australian Average
Populat ion Change by Age Group
‐1,000
0
1,000
2,000
3,000
4,000
1996‐2001 2001 ‐2006 2006‐2011
0‐19 20‐29 30‐54 54+
Annual Rainfall
0
100
200
300
400
500
600
700
2001
2002
2003
2004
2005
2006
2007
2008
2009
2010
2011
TEMPERATURE AND RAINFALL 2001 2002 2003 2004 2005 2006 2007 2008 2009 2010 2011
Temperature (Avg (C)) 21 21 21 20 21 20 21 21 21 20 19 Rank 54 48 50 52 49 58 57 56 53 57 52Rainfall (mm) 586 453 282 431 601 527 401 382 448 549 650 Rank 53 54 61 56 44 44 50 55 50 51 54
POPULATION 1992 1993 1994 1995 1996 1997 1998 1999 2000 2001 2002 2003 2004 2005 2006 2007 2008 2009 2010 2011
Population 263 270 274 279 284 288 294 301 307 315 321 327 333 340 346 355 366 378 391 404
INNOVATIVE STARTUPS 1992 1993 1994 1995 1996 1997 1998 1999 2000 2001 2002 2003 2004 2005 2006 2007 2008 2009 2010
Startups 46.9 70.2 86.0 76.5 89.8 79.9 83.5 80.1 57.0 30.8 38.0 45.0 49.3 40.2 30.8 34.8 23.1 16.9 13.6 Rank 30 24 25 23 23 32 16 19 17 24 17 16 9 14 20 4 12 14 3Note: (1) Data source Dun and Bradstreet database. The Dun and Bradstreet database does not represent all business entities. (2) Counts are per 100,000 employed.
28
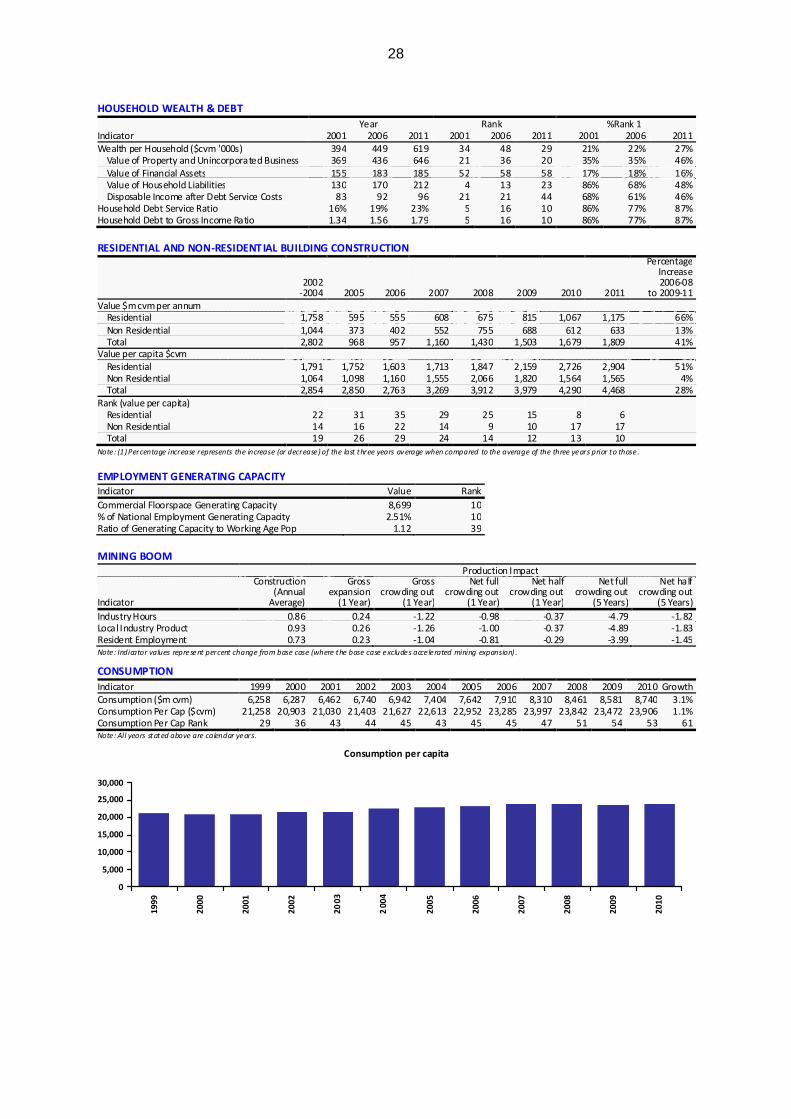
HOUSEHOLD WEALTH & DEBT
Year Rank %Rank 1 Indicator 2001 2006 2011 2001 2006 2011 2001 2006 2011Wealth per Household ($cvm '000s) 394 449 619 34 48 29 21% 22% 27% Value of Property and Unincorporated Business 369 436 646 21 36 20 35% 35% 46% Value of Financial Assets 155 183 185 52 58 58 17% 18% 16% Value of Household Liabilities 130 170 212 4 13 23 86% 68% 48% Disposable Income after Debt Service Costs 83 92 96 21 21 44 68% 61% 46%Household Debt Service Ratio 16% 19% 23% 5 16 10 86% 77% 87%Household Debt to Gross Income Ratio 1.34 1.56 1.79 5 16 10 86% 77% 87%
RESIDENTIAL AND NON‐RESIDENTIAL BUILDING CONSTRUCTION
2002 ‐2004 2005 2006 2007 2008 2009 2010 2011
PercentageIncrease2006‐08
to 2009‐11Value $m cvm per annum Residential 1,758 595 555 608 675 815 1,067 1,175 66% Non Residential 1,044 373 402 552 755 688 612 633 13% Total 2,802 968 957 1,160 1,430 1,503 1,679 1,809 41%Value per capita $cvm Residential 1,791 1,752 1,603 1,713 1,847 2,159 2,726 2,904 51% Non Residential 1,064 1,098 1,160 1,555 2,066 1,820 1,564 1,565 4% Total 2,854 2,850 2,763 3,269 3,912 3,979 4,290 4,468 28%Rank (value per capita) Residential 22 31 35 29 25 15 8 6 Non Residential 14 16 22 14 9 10 17 17 Total 19 26 29 24 14 12 13 10 Note: (1) Percentage increase represents the increase (or decrease) of the last three years average when compared to the average of the three years prior to those.
EMPLOYMENT GENERATING CAPACITY Indicator Value Rank
Commercial Floorspace Generating Capacity 8,699 10% of National Employment Generating Capacity 2.51% 10Ratio of Generating Capacity to Working Age Pop 1.12 39
MINING BOOM Production Impact
Indicator
Construction (Annual Average)
Gross expansion(1 Year)
Gross crowding out
(1 Year)
Net full crowding out
(1 Year)
Net half crowding out
(1 Year)
Net full crowding out
(5 Years)
Net half crowding out
(5 Years)
Industry Hours 0.86 0.24 ‐1.22 ‐0.98 ‐0.37 ‐4.79 ‐1.82Local Industry Product 0.93 0.26 ‐1.26 ‐1.00 ‐0.37 ‐4.89 ‐1.83Resident Employment 0.73 0.23 ‐1.04 ‐0.81 ‐0.29 ‐3.99 ‐1.45Note: Indicator values represent percent change from base case (where the base case excludes accelerated mining expansion) .
CONSUMPTION
Indicator 1999 2000 2001 2002 2003 2004 2005 2006 2007 2008 2009 2010 GrowthConsumption ($m cvm) 6,258 6,287 6,462 6,740 6,942 7,404 7,642 7,910 8,310 8,461 8,581 8,740 3.1%Consumption Per Cap ($cvm) 21,258 20,903 21,030 21,403 21,627 22,613 22,952 23,285 23,997 23,842 23,472 23,906 1.1%Consumption Per Cap Rank 29 36 43 44 45 43 45 45 47 51 54 53 61Note: All years stated above are calendar years.
Consumption per capita
0
5,000
10,000
15,000
20,000
25,000
30,000
1999
2000
2001
2002
2003
2004
2005
2006
2007
2008
2009
2010

29
HOUSING
Housing Indicator 1991.3 1997.3 2001.3 2006.3 2008.2 2010.2 2011.2 1997.3 Rank
2011.1 Rank
Annual Growth1997‐11
Avg value of dwellings ($cvm '000s) 174.5 163.9 239.3 319.1 340.4 406.0 406.2 29 25 6.8%Avg dwelling prices to household disposable income (%) n/a 2.0 2.9 3.5 3.7 4.3 4.5 39 24 5.9%Mortgage burden on average dwel ling purchase (%) n/a 16.3 23.1 27.6 29.8 34.5 36.0 39 24 5.9%Greenfield construction costs to avg dwelling price (%) n/a n/a n/a 1.2 1.2 1.0 1.0 n/a 41 n/aCatchment dwelling purchase income support ($cvm) 53,485 60,034 65,030 77,626 80,669 77,937 78,503 30 33 2.0%Dwelling affordability ‐ average mortgage on existing dwelling to catchment income support (%) n/a 21.8 29.4 32.8 33.7 41.6 41.3 34 23 4.8%Dwelling affordability ‐ average mortgage on new dwelling to catchment income support (%) n/a n/a n/a 40.3 39.3 42.1 42.2 n/a 25 n/aCommunity services available in catchment ‐ hours/capita 131.4 147.0 151.5 159.2 164.7 169.3 169.3 22 16 1.0%Adult population per dwelling 2.5 2.4 2.4 2.4 2.5 2.5 2.5 7 9 0.4%
NATIONAL BROADBAND NETWORK
Indicator 2015 2020 2025 2030 2035 20402015 Aust
2020 Aust
2025 Aust
2030 Aust
2035 Aust
2040 Aust
Functionality Relative to Requirements ‐ Base Case 44.9 19.2 13.4 11.4 11.4 11.4 53.0 36.3 29.5 24.9 24.1 24.1Functionality Relative to Requirements ‐ NBN Case 44.9 98.0 98.0 97.0 97.0 97.0 73.9 92.8 92.6 91.1 91.0 91.0Actual Productivity Extraction ‐ percent (Base Case) 1.7 1.8 1.7 1.7 1.6 1.6 2.0 2.6 3.2 3.6 4.0 4.2Actual Productivity Extraction ‐ percent (NBN Case) 1.7 2.5 4.5 6.6 8.4 9.7 2.1 3.5 5.8 8.3 10.4 12.0Industry Hours of Work (% of Base Case) 0.0 ‐0.1 ‐0.1 0.1 0.3 0.6 0.0 ‐0.1 ‐0.2 ‐0.3 ‐0.4 ‐0.4Real Wages (% of Base Case) 0.0 0.6 2.5 4.7 6.8 8.3 0.0 0.7 2.2 4.2 6.0 7.4Resident Income (% of Base Case) 0.0 0.6 2.2 4.3 6.3 7.8 0.0 0.6 2.1 3.9 5.6 6.9Local Industry Product (% of Base Case) 0.0 0.5 2.4 4.8 7.1 8.9 0.0 0.6 2.0 3.8 5.6 7.0Resident Employment (% of Base Case) 0.0 ‐0.1 ‐0.3 ‐0.4 ‐0.4 ‐0.3 0.0 ‐0.1 ‐0.3 ‐0.5 ‐0.6 ‐0.6Consumption Expenditure (% of Base Case) 0.0 0.6 2.2 4.2 6.0 7.3 0.0 0.6 2.1 3.8 5.4 6.6
EMPLOYED, HOURS WORKED AND INCOME (UR=Place of Residence, JTW=Place of Work)
Indicator 1991.3 1996.3 2001.3 2006.3 2011.11991.3Rank
1996.3 Rank
2001.3 Rank
2006.3Rank
2011.1Rank
UR Emp 113,026 133,604 151,731 173,637 200,231 25 25 23 23 23UR Hours 49,996 59,857 65,494 74,339 83,581 25 25 24 23 22UR Income 1,482 1,673 1,911 2,492 2,790 24 24 27 26 27JTW Emp 109,833 119,299 126,880 142,181 168,865 21 23 23 23 20JTW Hours 48,728 54,331 55,834 62,058 71,827 21 23 23 21 20JTW Income 1,329 1,461 1,599 2,038 2,358 21 23 24 22 24UR Avg Weekly Hours Per Employee 34.0 34.5 33.2 32.9 32.1 39 27 32 35 43UR Avg Hourly Rate Per Employee ($cvm) 29.7 27.9 29.2 33.5 33.4 17 43 53 39 61JTW Avg Weekly Hours Per Employee 34.1 35.0 33.9 33.6 32.7 36 11 20 13 32JTW Avg Hourly Rate Per Employee ($cvm) 27.3 26.9 28.6 32.8 32.8 30 51 53 41 62
INDUSTRY GROUPS
Place of Residence (UR) Place of Work (JTW) 1991.3 1996.3 2001.3 2006.3 2011.1 1991.3 1996.3 2001.3 2006.3 2011.1A Agriculture, Forestry and Fishing 1,106 1,532 1,382 1,117 1,043 1,206 1,615 1,514 1,262 1,199B Mining 146 209 155 294 393 113 148 140 201 275C Manufacturing 24,937 29,263 28,802 28,910 31,379 33,253 34,846 33,296 32,934 34,864D Electricity, Gas, Water & Waste Services 1,349 1,097 1,131 1,578 1,213 1,458 1,118 1,091 1,529 1,588E Construction 7,328 9,164 12,171 17,995 23,059 7,476 8,744 11,032 15,640 20,212F Wholesale Trade 5,875 7,223 7,123 8,204 7,378 5,997 7,020 6,654 7,537 10,679G Retail Trade 13,841 15,206 19,173 19,381 20,583 10,513 10,936 13,281 13,339 15,679H Accommodation and Food Services 3,502 6,252 8,663 9,565 14,118 3,130 5,171 6,652 7,248 10,115I Transport, Postal and Warehousing 9,559 10,364 10,332 13,096 15,870 17,390 15,888 15,487 19,132 24,038J Information Media and Telecoms 2,834 2,821 3,353 3,491 3,836 1,029 1,045 1,188 1,261 1,293K Financial and Insurance Services 5,621 5,409 5,581 6,572 6,214 1,294 1,251 1,180 1,377 1,428L Rental, Hiring and Real Estate Services 1,545 1,218 1,871 2,314 2,507 1,334 1,017 1,447 1,795 1,861M Prof, Scientific & Technical Services 4,699 6,660 7,545 9,003 10,965 2,086 2,943 3,067 3,586 4,229N Administrative and Support Services 2,406 3,789 5,299 5,854 6,419 1,691 2,566 3,347 3,577 4,064O Public Administration and Safety 6,235 6,311 7,078 8,880 8,879 4,435 4,373 4,552 5,506 5,621P Education and Training 6,202 7,481 9,059 10,765 11,174 6,617 7,746 8,826 10,269 10,882Q Health Care and Social Assistance 8,814 11,415 13,676 16,225 19,851 5,916 7,333 8,263 9,518 11,549R Arts and Recreation Services 1,167 1,766 2,114 2,571 3,142 778 1,149 1,266 1,532 1,618S Other Services 5,860 6,423 7,222 7,822 12,209 4,115 4,389 4,596 4,938 7,671 Total 113,026 133,604 151,731 173,637 200,231 109,833 119,299 126,880 142,181 168,865 Hi Tech 13,496 16,833 17,230 19,642 22,102 13,398 14,651 13,802 15,170 16,088 Hi Income 11,493 14,131 15,706 18,555 20,435 4,231 5,653 6,001 6,941 7,911 Infrastructure Services 16,182 20,662 24,849 29,561 34,166 13,311 16,228 18,356 21,319 24,048

30
Appendix C: Gross product definition and data sources
Gross Product is identical with Gross Value Added for any geographic area. It comprises the sale value of goods and services produced in the region in a time period, less the costs of raw materials and other inputs purchased from other businesses, less taxes. The basic concept is very similar to the tax base for GST. Ideally, Gross Local Product would have the same definition as Gross National Product or Gross State Product. However, it is not possible to allocate the Gross Operating Surplus of corporate businesses (including any surplus of government enterprises) to LGAs. (The Gross Operating Surplus comprises corporate Gross Value Added less wages and related payments). Gross Local Product therefore comprises:
employee compensation paid in respect of production in the LGA; plus
gross value added by unincorporated enterprises in the LGA less employee compensation paid by those enterprises (equivalent to Gross Mixed Income generated in the LGA); plus
imputed Gross Value Added of owner-occupied houses in the LGA.
Corporate businesses are those incorporated with shareholders, who ultimately control the company and are entitled to dividends when paid. Various other forms of legal incorporation, which lack the shareholder-dividend component, are not treated as incorporated, save that the definition includes branches of overseas companies and is extended by the ABS on an ad-hoc basis to include businesses organised as co-operatives, credit unions and mutual societies where these businesses maintain full accounts and operate in a manner similar to shareholder companies. The extension includes trusts whose chief activity is the holding of financial assets. All other businesses and non-profit-making organisations are excluded from the definition – these exclusions include partnerships, trusts which operate businesses (especially in the agricultural sector), community and philanthropic non-profit institutions and any other non-shareholder organisations not specifically transferred to the corporate sector. In all cases Gross Mixed Income generated by the organisation is calculated after employee compensation is paid. It will be noted that non-profit organisations are exempt from personal and corporation taxes so that the Gross Mixed Income they generate has to be estimated directly.
As regards organisations which generate taxable Mixed Income, the ABS definition is influenced by the definition used by the Tax Commissioner. This allows taxpayers to declare as business income any income in which compensation for the taxpayer’s labour is mixed with a capital return which is not legally separable from the labour return (as it is when incorporation requires the separation of employee compensation from dividends to shareholders). The Tax Commissioner allows the declaration of mixed income in respect of trusts operating in primary industry, but not otherwise. The ABS adjusts the net taxable income so declared back to Gross Mixed Income, adding back deductions declared by taxpayers, estimates for various non-taxable components and finally an estimate for understatement on tax returns. This is published by industry and postcode of taxpayer residence.
Control totals for Gross Local Product are available from the ABS State Accounts. NIEIR distributes the components as follows.
Employee compensation by local employment by industry (Census JTW adjusted and updated) and earnings (Census JTW, also tax statistics imputed by industry from area of residence back to area of work by JTW).
Gross taxable mixed income (including losses) generated by a similar process to employee compensation.

31
Gross non-taxable mixed income by local employment in such industries, from Census JTW.
Data sources
Labour Force
Census
Journey to Work Matrix
Tax data
NIEIR modelling.