Are Emily and Greg More Employable Than Lakisha and Jamal ...
23
Are Emily and Greg More Employable Than Lakisha and Jamal? A Field Experiment on Labor Market Discrimination By MARIANNE BERTRAND AND SENDHIL MULLAINATHAN* We study race in the labor market by sending fictitious resumes to help-wanted ads in Boston and Chicago newspapers. To manipulate perceived race, resumes are randomly assigned African-American- or White-sounding names. White names receive 50 percent more callbacks for interviews. Callbacks are also more respon- sive to resume quality for White names than for African-American ones. The racial gap is uniform across occupation, industry, and employer size. We also find little evidence that employers are inferring social class from the names. Differential treatment by race still appears to still be prominent in the U.S. labor market. (JEL J71, J64). Every measure of economic success reveals significant racial inequality in the U.S. labor market. Compared to Whites, African-Ameri- cans are twice as likely to be unemployed and earn nearly 25 percent less when they are em- ployed (Council of Economic Advisers, 1998). This inequality has sparked a debate as to whether employers treat members of different races differentially. When faced with observ- ably similar African-American and White ap- plicants, do they favor the White one? Some argue yes, citing either employer prejudice or employer perception that race signals lower pro- ductivity. Others argue that differential treat- ment by race is a relic of the past, eliminated by some combination of employer enlightenment, affirmative action programs and the profit- maximization motive. In fact, many in this latter camp even feel that stringent enforcement of affirmative action programs has produced an environment of reverse discrimination. They would argue that faced with identical candi- dates, employers might favor the African- American one. 1 Data limitations make it difficult to empirically test these views. Since researchers possess far less data than employers do, White and African-American workers that appear similar to researchers may look very different to employers. So any racial difference in labor market outcomes could just as easily be attributed to differences that are observable to employers but unobservable to researchers. To circumvent this difficulty, we conduct a field experiment that builds on the correspon- dence testing methodology that has been pri- marily used in the past to study minority outcomes in the United Kingdom. 2 We send resumes in response to help-wanted ads in Chi- cago and Boston newspapers and measure call- back for interview for each sent resume. We * Bertrand: Graduate School of Business, University of Chicago, 1101 E. 58th Street, R0 229D, Chicago, IL 60637, NBER, and CEPR (e-mail: marianne.bertrand@gsb. uchicago.edu); Mullainathan: Department of Economics, Massachusetts Institute of Technology, 50 Memorial Drive, E52-380a, Cambridge, MA 02142, and NBER (e-mail: [email protected]). David Abrams, Victoria Bede, Simone Berkowitz, Hong Chung, Almudena Fernandez, Mary Anne Guediguian, Christine Jaw, Richa Maheswari, Beverley Martis, Alison Tisza, Grant Whitehorn, and Christine Yee provided excellent research assistance. We are also grateful to numerous colleagues and seminar participants for very helpful comments. 1 This camp often explains the poor performance of African-Americans in terms of supply factors. If African- Americans lack many basic skills entering the labor market, then they will perform worse, even with parity or favoritism in hiring. 2 See Roger Jowell and Patricia Prescott-Clarke (1970), Jim Hubbuck and Simon Carter (1980), Colin Brown and Pat Gay (1985), and Peter A. Riach and Judith Rich (1991). One caveat is that some of these studies fail to fully match skills between minority and nonminority resumes. For ex- ample some impose differential education background by racial origin. Doris Weichselbaumer (2003, 2004) studies the impact of sex-stereotypes and sexual orientation. Rich- ard E. Nisbett and Dov Cohen (1996) perform a related field experiment to study how employers’ response to a criminal past varies between the North and the South in the United States. 991
Transcript of Are Emily and Greg More Employable Than Lakisha and Jamal ...

Are Emily and Greg More Employable Than Lakisha andJamal A Field Experiment on Labor Market Discrimination
By MARIANNE BERTRAND AND SENDHIL MULLAINATHAN
We study race in the labor market by sending fictitious resumes to help-wanted adsin Boston and Chicago newspapers To manipulate perceived race resumes arerandomly assigned African-American- or White-sounding names White namesreceive 50 percent more callbacks for interviews Callbacks are also more respon-sive to resume quality for White names than for African-American ones The racialgap is uniform across occupation industry and employer size We also find littleevidence that employers are inferring social class from the names Differentialtreatment by race still appears to still be prominent in the US labor market (JELJ71 J64)
Every measure of economic success revealssignificant racial inequality in the US labormarket Compared to Whites African-Ameri-cans are twice as likely to be unemployed andearn nearly 25 percent less when they are em-ployed (Council of Economic Advisers 1998)This inequality has sparked a debate as towhether employers treat members of differentraces differentially When faced with observ-ably similar African-American and White ap-plicants do they favor the White one Someargue yes citing either employer prejudice oremployer perception that race signals lower pro-ductivity Others argue that differential treat-ment by race is a relic of the past eliminated bysome combination of employer enlightenmentaffirmative action programs and the profit-maximization motive In fact many in this lattercamp even feel that stringent enforcement ofaffirmative action programs has produced anenvironment of reverse discrimination Theywould argue that faced with identical candi-
dates employers might favor the African-American one1 Data limitations make itdifficult to empirically test these views Sinceresearchers possess far less data than employersdo White and African-American workers thatappear similar to researchers may look verydifferent to employers So any racial differencein labor market outcomes could just as easily beattributed to differences that are observable toemployers but unobservable to researchers
To circumvent this difficulty we conduct afield experiment that builds on the correspon-dence testing methodology that has been pri-marily used in the past to study minorityoutcomes in the United Kingdom2 We sendresumes in response to help-wanted ads in Chi-cago and Boston newspapers and measure call-back for interview for each sent resume We
Bertrand Graduate School of Business University ofChicago 1101 E 58th Street R0 229D Chicago IL 60637NBER and CEPR (e-mail mariannebertrandgsbuchicagoedu) Mullainathan Department of EconomicsMassachusetts Institute of Technology 50 Memorial DriveE52-380a Cambridge MA 02142 and NBER (e-mailmullainmitedu) David Abrams Victoria Bede SimoneBerkowitz Hong Chung Almudena Fernandez Mary AnneGuediguian Christine Jaw Richa Maheswari BeverleyMartis Alison Tisza Grant Whitehorn and Christine Yeeprovided excellent research assistance We are also gratefulto numerous colleagues and seminar participants for veryhelpful comments
1 This camp often explains the poor performance ofAfrican-Americans in terms of supply factors If African-Americans lack many basic skills entering the labor marketthen they will perform worse even with parity or favoritismin hiring
2 See Roger Jowell and Patricia Prescott-Clarke (1970)Jim Hubbuck and Simon Carter (1980) Colin Brown andPat Gay (1985) and Peter A Riach and Judith Rich (1991)One caveat is that some of these studies fail to fully matchskills between minority and nonminority resumes For ex-ample some impose differential education background byracial origin Doris Weichselbaumer (2003 2004) studiesthe impact of sex-stereotypes and sexual orientation Rich-ard E Nisbett and Dov Cohen (1996) perform a related fieldexperiment to study how employersrsquo response to a criminalpast varies between the North and the South in the UnitedStates
991
experimentally manipulate perception of racevia the name of the fictitious job applicant Werandomly assign very White-sounding names(such as Emily Walsh or Greg Baker) to half theresumes and very African-American-soundingnames (such as Lakisha Washington or JamalJones) to the other half Because we are alsointerested in how credentials affect the racialgap in callback we experimentally vary thequality of the resumes used in response to agiven ad Higher-quality applicants have on av-erage a little more labor market experience andfewer holes in their employment history theyare also more likely to have an e-mail addresshave completed some certification degree pos-sess foreign language skills or have beenawarded some honors3 In practice we typicallysend four resumes in response to each ad twohigher-quality and two lower-quality onesWe randomly assign to one of the higher- andone of the lower-quality resumes an African-American-sounding name In total we respondto over 1300 employment ads in the salesadministrative support clerical and customerservices job categories and send nearly 5000resumes The ads we respond to cover a largespectrum of job quality from cashier work atretail establishments and clerical work in a mailroom to office and sales management positions
We find large racial differences in callbackrates4 Applicants with White names need tosend about 10 resumes to get one callbackwhereas applicants with African-Americannames need to send about 15 resumes This50-percent gap in callback is statistically signif-icant A White name yields as many more call-backs as an additional eight years of experienceon a resume Since applicantsrsquo names are ran-domly assigned this gap can only be attributedto the name manipulation
Race also affects the reward to having a bet-ter resume Whites with higher-quality resumesreceive nearly 30-percent more callbacks than
Whites with lower-quality resumes On theother hand having a higher-quality resume hasa smaller effect for African-Americans In otherwords the gap between Whites and African-Americans widens with resume quality Whileone may have expected improved credentials toalleviate employersrsquo fear that African-Americanapplicants are deficient in some unobservableskills this is not the case in our data5
The experiment also reveals several otheraspects of the differential treatment by raceFirst since we randomly assign applicantsrsquopostal addresses to the resumes we can studythe effect of neighborhood of residence on thelikelihood of callback We find that living in awealthier (or more educated or Whiter) neigh-borhood increases callback rates But interest-ingly African-Americans are not helped morethan Whites by living in a ldquobetterrdquo neighbor-hood Second the racial gap we measure indifferent industries does not appear correlated toCensus-based measures of the racial gap inwages The same is true for the racial gap wemeasure in different occupations In fact wefind that the racial gaps in callback are statisti-cally indistinguishable across all the occupationand industry categories covered in the experi-ment Federal contractors who are thought to bemore severely constrained by affirmative actionlaws do not treat the African-American re-sumes more preferentially neither do larger em-ployers or employers who explicitly state thatthey are ldquoEqual Opportunity Employersrdquo InChicago we find a slightly smaller racial gapwhen employers are located in more African-American neighborhoods
The rest of the paper is organized as followsSection I compares this experiment to earlierwork on racial discrimination and most nota-bly to the labor market audit studies Wedescribe the experimental design in SectionII and present the results in Section III subsec-tion A In Section IV we discuss possible in-terpretations of our results focusing especiallyon two issues First we examine whether the
3 In creating the higher-quality resumes we deliberatelymake small changes in credentials so as to minimize the riskof overqualification
4 For ease of exposition we refer to the effects uncov-ered in this experiment as racial differences Technicallyhowever these effects are about the racial soundingness ofnames We briefly discuss below the potential confoundsbetween name and race A more extensive discussion isoffered in Section IV subsection B
5 These results contrast with the view mostly based onnonexperimental evidence that African-Americans receivehigher returns to skills For example estimating earningsregressions on several decades of Census data JamesJ Heckman et al (2001) show that African-Americansexperience higher returns to a high school degree thanWhites do
992 THE AMERICAN ECONOMIC REVIEW SEPTEMBER 2004
race-specific names we have chosen might alsoproxy for social class above and beyond the raceof the applicant Using birth certificate data onmotherrsquos education for the different first namesused in our sample we find little relationshipbetween social background and the name-specific callback rates6 Second we discuss howour results map back to the different models ofdiscrimination proposed in the economics liter-ature In doing so we focus on two importantresults the lower returns to credentials forAfrican-Americans and the relative homogene-ity of the racial gap across occupations andindustries We conclude that existing models doa poor job of explaining the full set of findingsSection V concludes
I Previous Research
With conventional labor force and householdsurveys it is difficult to study whether differ-ential treatment occurs in the labor market7
Armed only with survey data researchers usu-ally measure differential treatment by compar-ing the labor market performance of Whites andAfrican-Americans (or men and women) forwhich they observe similar sets of skills Butsuch comparisons can be quite misleadingStandard labor force surveys do not contain allthe characteristics that employers observe whenhiring promoting or setting wages So one cannever be sure that the minority and nonminorityworkers being compared are truly similar fromthe employersrsquo perspective As a consequenceany measured differences in outcomes could beattributed to these unobserved (to the re-searcher) factors
This difficulty with conventional data hasled some authors to instead rely on pseudo-experiments8 Claudia Goldin and Cecilia
Rouse (2000) for example examine the effectof blind auditioning on the hiring process oforchestras By observing the treatment of fe-male candidates before and after the introduc-tion of blind auditions they try to measure theamount of sex discrimination When such pseu-do-experiments can be found the resultingstudy can be very informative but finding suchexperiments has proven to be extremelychallenging
A different set of studies known as auditstudies attempts to place comparable minorityand White actors into actual social and eco-nomic settings and measure how each groupfares in these settings9 Labor market auditstudies send comparable minority (African-American or Hispanic) and White auditors infor interviews and measure whether one is morelikely to get the job than the other10 While theresults vary somewhat across studies minorityauditors tend to perform worse on average theyare less likely to get called back for a secondinterview and conditional on getting calledback less likely to get hired
These audit studies provide some of thecleanest nonlaboratory evidence of differentialtreatment by race But they also have weak-nesses most of which have been highlighted inHeckman and Siegelman (1992) and Heckman(1998) First these studies require that bothmembers of the auditor pair are identical in alldimensions that might affect productivity inemployersrsquo eyes except for race To accomplishthis researchers typically match auditors onseveral characteristics (height weight age di-alect dressing style hairdo) and train them forseveral days to coordinate interviewing stylesYet critics note that this is unlikely to erase thenumerous differences that exist between the au-ditors in a pair
Another weakness of the audit studies is thatthey are not double-blind Auditors know thepurpose of the study As Turner et al (1991)6 We also argue that a social class interpretation would
find it hard to explain some of our findings such as whyliving in a better neighborhood does not increase callback ratesmore for African-American names than for White names
7 See Joseph G Altonji and Rebecca M Blank (1999)for a detailed review of the existing literature on racialdiscrimination in the labor market
8 William A Darity Jr and Patrick L Mason (1998)describe an interesting nonexperimental study Prior to theCivil Rights Act of 1964 employment ads would explicitlystate racial biases providing a direct measure of differentialtreatment Of course as Arrow (1998) mentions discrimi-nation was at that time ldquoa fact too evident for detectionrdquo
9 Michael Fix and Marjery A Turner (1998) provide asurvey of many such audit studies
10 Earlier hiring audit studies include Jerry M Newman(1978) and Shelby J McIntyre et al (1980) Three morerecent studies are Harry Cross et al (1990) Franklin Jamesand Steve W DelCastillo (1991) and Turner et al (1991)Heckman and Peter Siegelman (1992) Heckman (1998)and Altonji and Blank (1999) summarize these studies Seealso David Neumark (1996) for a labor market audit studyon gender discrimination
993VOL 94 NO 4 BERTRAND AND MULLAINATHAN RACE IN THE LABOR MARKET
note ldquoThe first day of training also included anintroduction to employment discriminationequal employment opportunity and a review ofproject design and methodologyrdquo This maygenerate conscious or subconscious motivesamong auditors to generate data consistent orinconsistent with their beliefs about race issuesin America As psychologists know very wellthese demand effects can be quite strong It isvery difficult to insure that auditors will notwant to do ldquoa good jobrdquo Since they know thegoal of the experiment they can alter theirbehavior in front of employers to express (indi-rectly) their own views Even a small belief byauditors that employers treat minorities differ-ently can result in measured differences in treat-ment This effect is further magnified by the factthat auditors are not in fact seeking jobs and aretherefore more free to let their beliefs affect theinterview process
Finally audit studies are extremely expen-sive making it difficult to generate largeenough samples to understand nuances and pos-sible mitigating factors Also these budgetaryconstraints worsen the problem of mismatchedauditor pairs Cost considerations force the useof a limited number of pairs of auditors mean-ing that any one mismatched pair can easilydrive the results In fact these studies generallytend to find significant differences in outcomesacross pairs
Our study circumvents these problems Firstbecause we only rely on resumes and not peo-ple we can be sure to generate comparabilityacross race In fact since race is randomly as-signed to each resume the same resume willsometimes be associated with an African-American name and sometimes with a Whitename This guarantees that any differences wefind are caused solely by the race manipulationSecond the use of paper resumes insulates usfrom demand effects While the research assis-tants know the purpose of the study our proto-col allows little room for conscious orsubconscious deviations from the set proce-dures Moreover we can objectively measurewhether the randomization occurred as ex-pected This kind of objective measurement isimpossible in the case of the previous auditstudies Finally because of relatively low mar-ginal cost we can send out a large number ofresumes Besides giving us more precise esti-mates this larger sample size also allows us to
examine the nature of the differential treatmentfrom many more angles
II Experimental Design
A Creating a Bank of Resumes
The first step of the experimental design is togenerate templates for the resumes to be sentThe challenge is to produce a set of realistic andrepresentative resumes without using resumesthat belong to actual job seekers To achievethis goal we start with resumes of actual jobsearchers but alter them sufficiently to createdistinct resumes The alterations maintain thestructure and realism of the initial resumes with-out compromising their owners
We begin with resumes posted on two jobsearch Web sites as the basis for our artificialresumes11 While the resumes posted on theseWeb sites may not be completely representativeof the average job seeker they provide a prac-tical approximation12 We restrict ourselves topeople seeking employment in our experimentalcities (Boston and Chicago) We also restrictourselves to four occupational categories salesadministrative support clerical services andcustomer services Finally we further restrictourselves to resumes posted more than sixmonths prior to the start of the experiment Wepurge the selected resumes of the personrsquos nameand contact information
During this process we classify the resumeswithin each detailed occupational category intotwo groups high and low quality In judgingresume quality we use criteria such as labormarket experience career profile existence ofgaps in employment and skills listed Such aclassification is admittedly subjective but it ismade independently of any race assignment onthe resumes (which occurs later in the experi-mental design) To further reinforce the qualitygap between the two sets of resumes we add toeach high-quality resume a subset of the follow-ing features summer or while-at-school em-ployment experience volunteering experienceextra computer skills certification degrees for-eign language skills honors or some military
11 The sites are wwwcareerbuildercom and wwwamericasjobbankcom
12 In practice we found large variation in skill levelsamong people posting their resumes on these sites
994 THE AMERICAN ECONOMIC REVIEW SEPTEMBER 2004
experience This resume quality manipulationneeds to be somewhat subtle to avoid making ahigher-quality job applicant overqualified for agiven job We try to avoid this problem bymaking sure that the features listed above arenot all added at once to a given resume Thisleaves us with a high-quality and a low-qualitypool of resumes13
To minimize similarity to actual job seekerswe use resumes from Boston job seekers toform templates for the resumes to be sent out inChicago and use resumes from Chicago jobseekers to form templates for the resumes to besent out in Boston To implement this migra-tion we alter the names of the schools andprevious employers on the resumes More spe-cifically for each Boston resume we use theChicago resumes to replace a Boston schoolwith a Chicago school14 We also use the Chi-cago resumes to replace a Boston employer witha Chicago employer in the same industry Weuse a similar procedure to migrate Chicago re-sumes to Boston15 This produces distinct butrealistic looking resumes similar in their edu-cation and career profiles to this subpopulationof job searchers16
B Identities of Fictitious Applicants
The next step is to generate identities for thefictitious job applicants names telephone num-bers postal addresses and (possibly) e-mailaddresses The choice of names is crucial to ourexperiment17 To decide on which names areuniquely African-American and which areuniquely White we use name frequency datacalculated from birth certificates of all babiesborn in Massachusetts between 1974 and 1979We tabulate these data by race to determine
which names are distinctively White and whichare distinctively African-American Distinctivenames are those that have the highest ratio offrequency in one racial group to frequency inthe other racial group
As a check of distinctiveness we conducted asurvey in various public areas in Chicago Eachrespondent was asked to assess features of aperson with a particular name one of which israce For each name 30 respondents were askedto identify the name as either ldquoWhiterdquo ldquoAfrican-Americanrdquo ldquoOtherrdquo or ldquoCannot Tellrdquo In gen-eral the names led respondents to readilyattribute the expected race for the person butthere were a few exceptions and these nameswere disregarded18
The final list of first names used for this studyis shown in Appendix Table A1 The tablereports the relative likelihood of the names forthe Whites and African-Americans in the Mas-sachusetts birth certificates data as well asthe recognition rate in the field survey19 AsAppendix Table A1 indicates the African-American first names used in the experiment arequite common in the population This suggeststhat by using these names as an indicator ofrace we are actually covering a rather largesegment of the African-American population20
Applicants in each racesexcityresume qual-ity cell are allocated the same phone numberThis guarantees that we can precisely track em-ployer callbacks in each of these cells Thephone lines we use are virtual ones with only avoice mailbox attached to them A similar out-going message is recorded on each of the voicemailboxes but each message is recorded bysomeone of the appropriate race and gender
13 In Section III subsection B and Table 3 we providea detailed summary of resume characteristics by qualitylevel
14 We try as much as possible to match high schools andcolleges on quality and demographic characteristics
15 Note that for applicants with schooling or work expe-rience outside of the Boston or Chicago areas we leave theschool or employer name unchanged
16 We also generate a set of different fonts layouts andcover letters to further differentiate the resumes These areapplied at the time the resumes are sent out
17 We chose name over other potential manipulations ofrace such as affiliation with a minority group because wefelt such affiliations may especially convey more than race
18 For example Maurice and Jerome are distinctivelyAfrican-American names in a frequency sense yet are notperceived as such by many people
19 So many of names show a likelihood ratio of be-cause there is censoring of the data at five births If there arefewer than five babies in any racename cell it is censored(and we do not know whether a cell has zero or wascensored) This is primarily a problem for the computationof how many African-American babies have ldquoWhiterdquonames
20 We also tried to use more White-sounding last namesfor White applicants and more African-American-soundinglast names for African-American applicants The last namesused for White applicants are Baker Kelly McCarthyMurphy Murray OrsquoBrien Ryan Sullivan and Walsh Thelast names used for African-American applicants are Jack-son Jones Robinson Washington and Williams
995VOL 94 NO 4 BERTRAND AND MULLAINATHAN RACE IN THE LABOR MARKET
Since we allocate the same phone number forapplicants with different names we cannot usea person name in the outgoing message
While we do not expect positive feedbackfrom an employer to take place via postal mailresumes still need postal addresses We there-fore construct fictitious addresses based on realstreets in Boston and Chicago using the WhitePages We select up to three addresses in each5-digit zip code in Boston and Chicago Withincities we randomly assign addresses across allresumes We also create eight e-mail addressesfour for Chicago and four for Boston21 Thesee-mail addresses are neutral with respect to bothrace and sex Not all applicants are given ane-mail address The e-mail addresses are usedalmost exclusively for the higher-quality re-sumes This procedure leaves us with a bank ofnames phone numbers addresses and e-mailaddresses that we can assign to the templateresumes when responding to the employmentads
C Responding to Ads
The experiment was carried out between July2001 and January 2002 in Boston and betweenJuly 2001 and May 2002 in Chicago22 Overthat period we surveyed all employment ads inthe Sunday editions of The Boston Globe andThe Chicago Tribune in the sales administra-tive support and clerical and customer servicessections We eliminate any ad where applicantswere asked to call or appear in person In factmost of the ads we surveyed in these job cate-gories ask for applicants to fax in or (morerarely) mail in their resume We log the name(when available) and contact information foreach employer along with any information onthe position advertised and specific require-ments (such as education experience or com-puter skills) We also record whether or not thead explicitly states that the employer is an equalopportunity employer
For each ad we use the bank of resumes to
sample four resumes (two high-quality and twolow-quality) that fit the job description and re-quirements as closely as possible23 In somecases we slightly alter the resumes to improvethe quality of the match such as by adding theknowledge of a specific software program
One of the high- and one of the low-qualityresumes selected are then drawn at random toreceive African-American names the otherhigh- and low-quality resumes receive Whitenames24 We use male and female names forsales jobs whereas we use nearly exclusivelyfemale names for administrative and clericaljobs to increase callback rates25 Based on sexrace city and resume quality we assign a re-sume the appropriate phone number We alsoselect at random a postal address Finally e-mail addresses are added to most of the high-quality resumes26 The final resumes areformatted with fonts layout and cover letterstyle chosen at random The resumes are thenfaxed (or in a few cases mailed) to the em-ployer All in all we respond to more than1300 employment ads over the entire sampleperiod and send close to 5000 resumes
D Measuring Responses
We measure whether a given resume elicits acallback or e-mail back for an interview Foreach phone or e-mail response we use the con-tent of the message left by the employer (nameof the applicant company name telephonenumber for contact) to match the response to thecorresponding resume-ad pair27 Any attemptby employers to contact applicants via postalmail cannot be measured in our experimentsince the addresses are fictitious Several hu-man resource managers confirmed to us that
21 The e-mail addresses are registered on YahoocomAngelfirecom or Hotmailcom
22 This period spans tighter and slacker labor markets Inour data this is apparent as callback rates (and number ofnew ads) dropped after September 11 2001 Interestinglyhowever the racial gap we measure is the same across thesetwo periods
23 In some instances our resume bank does not have fourresumes that are appropriate matches for a given ad In suchinstances we send only two resumes
24 Though the same names are repeatedly used in ourexperiment we guarantee that no given ad receives multipleresumes with the same name
25 Male names were used for a few administrative jobs inthe first month of the experiment
26 In the first month of the experiment a few high-quality resumes were sent without e-mail addresses and afew low-quality resumes were given e-mail addresses SeeTable 3 for details
27 Very few employers used e-mail to contact an appli-cant back
996 THE AMERICAN ECONOMIC REVIEW SEPTEMBER 2004
employers rarely if ever contact applicants viapostal mail to set up interviews
E Weaknesses of the Experiment
We have already highlighted the strengths ofthis experiment relative to previous audit stud-ies We now discuss its weaknesses First ouroutcome measure is crude even relative to theprevious audit studies Ultimately one caresabout whether an applicant gets the job andabout the wage offered conditional on gettingthe job Our procedure however simply mea-sures callbacks for interviews To the extent thatthe search process has even moderate frictionsone would expect that reduced interview rateswould translate into reduced job offers How-ever we are not able to translate our results intogaps in hiring rates or gaps in earnings
Another weakness is that the resumes do notdirectly report race but instead suggest racethrough personal names This leads to varioussources of concern First while the names arechosen to make race salient some employersmay simply not notice the names or not recog-nize their racial content On a related notebecause we are not assigning race but onlyrace-specific names our results are not repre-sentative of the average African-American(who may not have such a racially distinct
name)28 We return to this issue in Section IVsubsection B
Finally and this is an issue pervasive in bothour study and the pair-matching audit studiesnewspaper ads represent only one channel forjob search As is well known from previouswork social networks are another commonmeans through which people find jobs and onethat clearly cannot be studied here This omis-sion could qualitatively affect our results ifAfrican-Americans use social networks more orif employers who rely more on networks differ-entiate less by race29
III Results
A Is There a Racial Gap in Callback
Table 1 tabulates average callback rates byracial soundingness of names Included inbrackets under each rate is the number of re-sumes sent in that cell Row 1 presents ourresults for the full data set Resumes with White
28 As Appendix Table A1 indicates the African-American names we use are however quite commonamong African-Americans making this less of a concern
29 In fact there is some evidence that African-Americansmay rely less on social networks for their job search (HarryJ Holzer 1987)
TABLE 1mdashMEAN CALLBACK RATES BY RACIAL SOUNDINGNESS OF NAMES
Percent callbackfor White names
Percent callback forAfrican-American names Ratio
Percent difference(p-value)
SampleAll sent resumes 965 645 150 320
[2435] [2435] (00000)Chicago 806 540 149 266
[1352] [1352] (00057)Boston 1163 776 150 405
[1083] [1083] (00023)Females 989 663 149 326
[1860] [1886] (00003)Females in administrative jobs 1046 655 160 391
[1358] [1359] (00003)Females in sales jobs 837 683 122 154
[502] [527] (03523)Males 887 583 152 304
[575] [549] (00513)
Notes The table reports for the entire sample and different subsamples of sent resumes the callback rates for applicants witha White-sounding name (column 1) an an African-American-sounding name (column 2) as well as the ratio (column 3) anddifference (column 4) of these callback rates In brackets in each cell is the number of resumes sent in that cell Column 4also reports the p-value for a test of proportion testing the null hypothesis that the callback rates are equal across racial groups
997VOL 94 NO 4 BERTRAND AND MULLAINATHAN RACE IN THE LABOR MARKET
names have a 965 percent chance of receivinga callback Equivalent resumes with African-American names have a 645 percent chance ofbeing called back This represents a differencein callback rates of 320 percentage points or 50percent that can solely be attributed to the namemanipulation Column 4 shows that this differ-ence is statistically significant30 Put in otherwords these results imply that a White appli-cant should expect on average one callback forevery 10 ads she or he applies to on the otherhand an African-American applicant wouldneed to apply to about 15 different ads toachieve the same result31
How large are these effects While the cost ofsending additional resumes might not be largeper se this 50-percent gap could be quite sub-stantial when compared to the rate of arrival ofnew job openings In our own study the biggestconstraining factor in sending more resumeswas the limited number of new job openingseach week Another way to benchmark the mea-sured return to a White name is to compare it tothe returns to other resume characteristics Forexample in Table 5 we will show that at theaverage number of years of experience in oursample an extra year of experience increasesthe likelihood of a callback by a 04 percentagepoint Based on this point estimate the return toa White name is equivalent to about eight ad-ditional years of experience
Rows 2 and 3 break down the full sample ofsent resumes into the Boston and Chicago mar-kets About 20 percent more resumes were sentin Chicago than in Boston The average call-back rate (across races) is lower in Chicago thanin Boston This might reflect differences in la-bor market conditions across the two cities overthe experimental period or maybe differences inthe ability of the MIT and Chicago teams ofresearch assistants in selecting resumes thatwere good matches for a given help-wanted adThe percentage difference in callback rates ishowever strikingly similar across both citiesWhite applicants are 49 percent more likely
than African-American applicants to receive acallback in Chicago and 50 percent more likelyin Boston These racial differences are statisti-cally significant in both cities
Finally rows 4 to 7 break down the fullsample into female and male applicants Row 4displays the average results for all female nameswhile rows 5 and 6 break the female sample intoadministrative (row 5) and sales jobs (row 6)row 7 displays the average results for all malenames As noted earlier female names wereused in both sales and administrative job open-ings whereas male names were used close toexclusively for sales openings32 Lookingacross occupations we find a significant racialgap in callbacks for both males (52 percent) andfemales (49 percent) Comparing males to fe-males in sales occupations we find a largerracial gap among males (52 percent versus 22percent) Interestingly females in sales jobs ap-pear to receive more callbacks than males how-ever this (reverse) gender gap is statisticallyinsignificant and economically much smallerthan any of the racial gaps discussed above
Rather than studying the distribution of call-backs at the applicant level one can also tabu-late the distribution of callbacks at theemployment-ad level In Table 2 we computethe fraction of employers that treat White andAfrican-American applicants equally the frac-tion of employers that favor White appli-cants and the fraction of employers that favorAfrican-American applicants Because we sendup to four resumes in response to each sampledad the three categories above can each takethree different forms Equal treatment occurswhen either no applicant gets called back oneWhite and one African-American get calledback or two Whites and two African-Americansget called back Whites are favored when eitheronly one White gets called back two Whitesand no African-American get called back or twoWhites and one African-American get calledback African-Americans are favored in allother cases
As Table 2 indicates equal treatment occursfor about 88 percent of the help-wanted ads Asexpected the major source of equal treatmentcomes from the high fraction of ads for which
30 These statistical tests assume independence of call-backs We have however verified that the results staysignificant when we assume that the callbacks are correlatedeither at the employer or first-name level
31 This obviously assumes that African-American appli-cants cannot assess a priori which firms are more likely totreat them more or less favorably
32 Only about 6 percent of all male resumes were sent inresponse to an administrative job opening
998 THE AMERICAN ECONOMIC REVIEW SEPTEMBER 2004
no callbacks are recorded (83 percent of theads) Whites are favored by nearly 84 percentof the employers with a majority of these em-ployers contacting exactly one White applicantAfrican-Americans on the other hand are fa-vored by only about 35 percent of employersWe formally test whether there is symmetry inthe favoring of Whites over African-Americansand African-Americans over Whites We findthat the difference between the fraction of em-ployers favoring Whites and the fraction ofemployers favoring African-Americans is sta-tistically very significant (p 00000)
B Do African-Americans Receive DifferentReturns to Resume Quality
Our results so far demonstrate a substantialgap in callback based on applicantsrsquo namesNext we would like to learn more about thefactors that may influence this gap More spe-cifically we ask how employers respond to im-provements in African-American applicantsrsquocredentials To answer this question we exam-ine how the racial gap in callback varies byresume quality
As we explained in Section II for most of the
employment ads we respond to we send fourdifferent resumes two higher-quality and twolower-quality ones Table 3 gives a better senseof which factors enter into this subjective clas-sification Table 3 displays means and standarddeviations of the most relevant resume charac-teristics for the full sample (column 1) as wellas broken down by race (columns 2 and 3) andresume quality (columns 4 and 5) Since appli-cantsrsquo names are randomized there is no differ-ence in resume characteristics by race Columns4 and 5 document the objective differences be-tween resumes subjectively classified as highand low quality Higher-quality applicants haveon average close to an extra year of labor mar-ket experience fewer employment holes (wherean employment hole is defined as a period of atleast six months without a reported job) aremore likely to have worked while at schooland to report some military experience Alsohigher-quality applicants are more likely tohave an e-mail address to have received somehonors and to list some computer skills andother special skills (such as a certificationdegree or foreign language skills) on their re-sume Note that the higher- and lower-qualityresumes do not differ on average with regard to
TABLE 2mdashDISTRIBUTION OF CALLBACKS BY EMPLOYMENT AD
Equal Treatment No Callback 1W 1B 2W 2B8813 percent 8337 348 128[1166] [1103] [46] [17]Whites Favored (WF) 1W 0B 2W 0B 2W 1B839 percent 559 144 136[111] [74] [19] [18]African-Americans Favored (BF) 1B 0W 2B 0W 2B 1W348 percent 249 045 053[46] [33] [6] [7]Ho WF BFp 00000
Notes This table documents the distribution of callbacks at the employment-ad level ldquoNo Callbackrdquo is the percent of ads forwhich none of the fictitious applicants received a callback ldquo1W 1Brdquo is the percent of ads for which exactly one White andone African-American applicant received a callback ldquo2W 2Brdquo is the percent of ads for which exactly two White applicantsand two African-American applicants received a callback ldquoEqual Treatmentrdquo is defined as the sum of ldquoNo Callbackrdquo ldquo1W 1Brdquo and ldquo2W 2Brdquo ldquo1W 0Brdquo is the percent of ads for which exactly one White applicant and no African-Americanapplicant received a call back ldquo2W 0Brdquo is the percent of ads for which excatly two White applicants and noAfrican-American applicant received a callback ldquo2W 1Brdquo is the percent of ads for which exactly two White applicants andone African-American applicant received a callback ldquoWhites Favoredrdquo is defined as the sum of ldquo1W 0Brdquo ldquo2W 0Brdquoand ldquo2W 1Brdquo ldquo1B 0Wrdquo is the percent of ads for which exactly one African-American applicant and no White applicantreceived a callback ldquo2B 0Wrdquo is the percent of ads for which exactly two African-American applicants and no Whiteapplicant received a callback ldquo2B 1Wrdquo is the percent of ads for which exactly two African-American applicants and oneWhite applicant received a callback ldquoAfrican-Americans Favoredrdquo is defined as the sum of ldquo1B 0Wrdquo ldquo2B 0Wrdquo andldquo2B 1Wrdquo In brackets in each cell is the number of employment ads in that cell ldquoHo WF WBrdquo reports the p-value fora test of symmetry between the proportion of employers that favor White names and the proportion of employers that favorAfrican-American names
999VOL 94 NO 4 BERTRAND AND MULLAINATHAN RACE IN THE LABOR MARKET
applicantsrsquo education level This reflects the factthat all sent resumes whether high or low qual-ity are chosen to be good matches for a givenjob opening About 70 percent of the sent re-sumes report a college degree33
The last five rows of Table 3 show summarycharacteristics of the applicantsrsquo zip code ad-dress Using 1990 Census data we compute thefraction of high school dropouts fraction ofcollege educated or more fraction of Whitesfraction of African-Americans and log(medianper capital income) for each zip code used in the
experiment Since addresses are randomizedwithin cities these neighborhood quality mea-sures are uncorrelated with race or resumequality
The differences in callback rates betweenhigh- and low-quality resumes are presented inPanel A of Table 4 The first thing to note is thatthe resume quality manipulation works higher-quality resumes receive more callbacks As row1 indicates we record a callback rate of close to11 percent for White applicants with a higher-quality resume compared to 85 percent forWhite applicants with lower-quality resumesThis is a statistically significant difference of229 percentage points or 27 percent (p 00557) Most strikingly African-Americansexperience much less of an increase in callback
33 This varies from about 50 percent for the clerical andadministrative support positions to more than 80 percentfor the executive managerial and sales representativespositions
TABLE 3mdashRESUME CHARACTERISTICS SUMMARY STATISTICS
Sample All resumes White namesAfrican-
American Higher quality Lower quality
CharacteristicCollege degree 072 072 072 072 071(Y 1) (045) (045) (045) (045) (045)Years of experience 784 786 783 829 739
(504) (507) (501) (529) (475)Volunteering experience 041 041 041 079 003(Y 1) (049) (049) (049) (041) (016)Military experience 010 009 010 019 000(Y 1) (030) (029) (030) (039) (006)E-mail address 048 048 048 092 003(Y 1) (050) (050) (050) (027) (017)Employment holes 045 045 045 034 056(Y 1) (050) (050) (050) (047) (050)Work in school 056 056 056 072 040(Y 1) (050) (050) (050) (045) (049)Honors 005 005 005 007 003(Y 1) (022) (023) (022) (025) (018)Computer skills 082 081 083 091 073(Y 1) (038) (039) (037) (029) (044)Special skills 033 033 033 036 030(Y 1) (047) (047) (047) (048) (046)Fraction high school dropouts in
applicantrsquos zip code019 019 019 019 018
(008) (008) (008) (008) (008)Fraction college or more in
applicantrsquos zip code021 021 021 021 022
(017) (017) (017) (017) (017)Fraction Whites in applicantrsquos zip
code054 055 054 053 055
(033) (033) (033) (033) (033)Fraction African-Americans in
applicantrsquos zip code031 031 031 032 031
(033) (033) (033) (033) (033)Log(median per capital income)
in applicantrsquos zip code955 955 955 954 956
(056) (056) (055) (054) (057)
Sample size 4870 2435 2435 2446 2424
Notes The table reports means and standard deviations for the resume characteristics as listed on the left Column 1 refersto all resumes sent column 2 refers to resumes with White names column 3 refers to resumes with African-American namescolumn 4 refers to higher-quality resumes column 5 refers to lower-quality resumes See text for details
1000 THE AMERICAN ECONOMIC REVIEW SEPTEMBER 2004
rate for similar improvements in their creden-tials African-Americans with higher-quality re-sumes receive a callback 67 percent of the timecompared to 62 percent for African-Americanswith lower quality resumes This is only a 051-percentage-point or 8-percent difference andthis difference is not statistically significant(p 06084)
Instead of relying on the subjective qualityclassification Panel B directly uses resumecharacteristics to classify the resumes Morespecifically we use a random subsample ofone-third of the resumes to estimate a probitregression of the callback dummy on the resumecharacteristics listed in Table 3 We further con-trol for a sex dummy a city dummy six occu-pation dummies and a vector of jobrequirements as listed in the employment ads34
We then use the estimated coefficients on theresume characteristics to rank the remainingtwo-thirds of the resumes by predicted callbackIn Panel B we classify as ldquohighrdquo those resumesthat have above-median-predicted callbacksimilarly we classify as ldquolowrdquo those resumes
that have below-median-predicted callback Asone can see from Panel B qualitatively similarresults emerge from this analysis While African-Americans do appear to significantly benefitfrom higher-quality resumes under this alterna-tive classification they benefit less than WhitesThe ratio of callback rates for high- versuslow-quality resumes is 160 for African Amer-icans compared to 189 for Whites
In Table 5 we directly report the results ofrace-specific probit regressions of the callbackdummy on resume characteristics We how-ever start in column 1 with results for the fullsample of sent resumes As one can see manyof the resume characteristics have the expectedeffect on the likelihood of a callback The ad-dition of an e-mail address honors and specialskills all have a positive and significant effecton the likelihood of a callback35 Also moreexperienced applicants are more likely to getcalled back at the average number of years ofexperience in our sample (eight years) each
34 See Section III subsection D for more details on theseoccupation categories and job requirements
35 Note that the e-mail address dummy because it isclose to perfectly correlated with the subjective resume-quality variable may in part capture some other unmeasuredresume characteristics that may have led us to categorize agiven resume as higher quality
TABLE 4mdashAVERAGE CALLBACK RATES BY RACIAL SOUNDINGNESS OF NAMES AND RESUME QUALITY
Panel A Subjective Measure of Quality(Percent Callback)
Low High Ratio Difference (p-value)White names 850 1079 127 229
[1212] [1223] (00557)African-American names 619 670 108 051
[1212] [1223] (06084)
Panel B Predicted Measure of Quality(Percent Callback)
Low High Ratio Difference (p- value)White names 718 1360 189 642
[822] [816] (00000)African-American names 537 860 160 323
[819] [814] (00104)
Notes Panel A reports the mean callback percents for applicant with a White name (row 1) and African-American name (row 2)depending on whether the resume was subjectively qualified as a lower quality or higher quality In brackets is the number ofresumes sent for each racequality group The last column reports the p-value of a test of proportion testing the null hypothesis thatthe callback rates are equal across quality groups within each racial group For Panel B we use a third of the sample to estimatea probit regression of the callback dummy on the set of resume characteristics as displayed in Table 3 We further control for a sexdummy a city dummy six occupation dummies and a vector of dummy variables for job requirements as listed in the employmentad (see Section III subsection D for details) We then use the estimated coefficients on the set of resume characteristics to estimatea predicted callback for the remaining resumes (two-thirds of the sample) We call ldquohigh-qualityrdquo resumes the resumes that rankabove the median predicted callback and ldquolow-qualityrdquo resumes the resumes that rank below the median predicted callback Inbrackets is the number of resumes sent for each racequality group The last column reports the p-value of a test of proportion testingthe null hypothesis that the callback percents are equal across quality groups within each racial group
1001VOL 94 NO 4 BERTRAND AND MULLAINATHAN RACE IN THE LABOR MARKET
extra year of experience increases the likelihoodof a callback by about a 04 percentage pointThe most counterintuitive effects come fromcomputer skills which appear to negatively pre-dict callback and employment holes which ap-pear to positively predict callback
The same qualitative patterns hold in column2 where we focus on White applicants Moreimportantly the estimated returns to an e-mailaddress additional work experience honorsand special skills appear economically strongerfor that racial group For example at the aver-age number of years of experience in our sam-ple each extra year of experience increases thelikelihood of a callback by about a 07 percent-age point
As might have been expected from the two
previous columns we find that the estimatedreturns on these resume characteristics are alleconomically and statistically weaker forAfrican-American applicants (column 3) Infact all the estimated effects for African-Americans are statistically insignificant exceptfor the return to special skills Resume charac-teristics thus appear less predictive of callbackrates for African-Americans than they are forWhites To illustrate this more saliently wepredict callback rates using either regressionestimates in column 2 or regression estimates incolumn 3 The standard deviation of the pre-dicted callback from column 2 is 0062 whereasit is only 0037 from column 3 In summaryemployers simply seem to pay less attention ordiscount more the characteristics listed on the
TABLE 5mdashEFFECT OF RESUME CHARACTERISTICS ON LIKELIHOOD OF CALLBACK
Dependent Variable Callback DummySample All resumes White names African-American names
Years of experience (10) 007 013 002(003) (004) (003)
Years of experience2 (100) 002 004 000(001) (001) (001)
Volunteering (Y 1) 001 001 001(001) (001) (001)
Military experience (Y 1) 000 002 001(001) (003) (002)
E-mail (Y 1) 002 003 000(001) (001) (001)
Employment holes (Y 1) 002 003 001(001) (002) (001)
Work in school (Y 1) 001 002 000(001) (001) (001)
Honors (Y 1) 005 006 003(002) (003) (002)
Computer skills (Y 1) 002 004 000(001) (002) (001)
Special skills (Y 1) 005 006 004(001) (002) (001)
Ho Resume characteristics effects are allzero (p-value)
5450 5759 2385(00000) (00000) (00080)
Standard deviation of predicted callback 0047 0062 0037
Sample size 4870 2435 2435
Notes Each column gives the results of a probit regression where the dependent variable is the callback dummy Reportedin the table are estimated marginal changes in probability for the continuous variables and estimated discrete changes for thedummy variables Also included in each regression are a city dummy a sex dummy six occupation dummies and a vectorof dummy variables for job requirements as listed in the employment ad (see Section III subsection D for details) Samplein column 1 is the entire set of sent resumes sample in column 2 is the set of resumes with White names sample in column3 is the set of resumes with African-American names Standard errors are corrected for clustering of the observations at theemployment-ad level Reported in the second to last row are the p-values for a 2 testing that the effects on the resumecharacteristics are all zero Reported in the second to last row is the standard deviation of the predicted callback rate
1002 THE AMERICAN ECONOMIC REVIEW SEPTEMBER 2004
resumes with African-American-sounding namesTaken at face value these results suggest thatAfrican-Americans may face relatively lowerindividual incentives to invest in higher skills36
C Applicantsrsquo Address
An incidental feature of our experimental de-sign is the random assignment of addresses tothe resumes This allows us to examine whetherand how an applicantrsquos residential address allelse equal affects the likelihood of a callbackIn addition and most importantly for our pur-pose we can also ask whether African-Ameri-can applicants are helped relatively more byresiding in more affluent neighborhoods
We perform this analysis in Table 6 We start(columns 1 3 and 5) by discussing the effect ofneighborhood of residence across all applicantsEach of these columns reports the results of aprobit regression of the callback dummy on aspecific zip code characteristic and a citydummy Standard errors are corrected for clus-tering of the observations at the employment-adlevel We find a positive and significant effectof neighborhood quality on the likelihood of acallback Applicants living in Whiter (column1) more educated (column 3) or higher-income(column 5) neighborhoods have a higher prob-ability of receiving a callback For example a10-percentage-point increase in the fraction ofcollege-educated in zip code of residence in-
creases the likelihood of a callback by a 054percentage point (column 3)
In columns 2 4 and 6 we further interact thezip code characteristic with a dummy variablefor whether the applicant is African-Americanor not Each of the probit regressions in thesecolumns also includes an African-Americandummy a city dummy and an interaction of thecity dummy with the African-Americandummy There is no evidence that African-Americans benefit any more than Whites fromliving in a Whiter more educated zip code Theestimated interactions between fraction Whiteand fraction college educated with the African-American dummy are economically very smalland statistically insignificant We do find aneconomically more meaningful effect of zipcode median income level on the racial gap incallback this effect however is statisticallyinsignificant
In summary while neighborhood quality af-fects callbacks African-Americans do not ben-efit more than Whites from living in betterneighborhoods If ghettos and bad neighbor-hoods are particularly stigmatizing for African-Americans one might have expected African-Americans to be helped more by having aldquobetterrdquo address Our results do not support thishypothesis
D Job and Employer Characteristics
Table 7 studies how various job requirements(as listed in the employment ads) and employercharacteristics correlate with the racial gap incallback Each row of Table 7 focuses on aspecific job or employer characteristic with
36 This of course assumes that the changes in job andwage offers associated with higher skills are the same acrossraces or at least not systematically larger for African-Americans
TABLE 6mdashEFFECT OF APPLICANTrsquoS ADDRESS ON LIKELIHOOD OF CALLBACK
Dependent Variable Callback Dummy
Zip code characteristic Fraction WhitesFraction college or
more Log(per capital income)
Zip code characteristic 0020 0020 0054 0053 0018 0014(0012) (0016) (0022) (0031) (0007) (0010)
Zip code characteristicAfrican-American name
mdash 0000 mdash 0002 mdash 0008(0024) (0048) (0015)
African-American name mdash 0031 mdash 0031 mdash 0112(0015) (0013) (0152)
Notes Each column gives the results of a probit regression where the dependent variable is the callback dummy Reportedin the table is the estimated marginal change in probability Also included in columns 1 3 and 5 is a city dummy alsoincluded in columns 2 4 and 6 is a city dummy and a city dummy interacted with a race dummy Standard errors are correctedfor clustering of the observations at the employment-ad level
1003VOL 94 NO 4 BERTRAND AND MULLAINATHAN RACE IN THE LABOR MARKET
summary statistics in column 2 Column 3shows the results of various probit regressionsEach entry in this column is the marginal effectof the specific characteristic listed in that row onthe racial gap in callback More specificallyeach entry is from a separate probit regressionof a callback dummy on an African-Americandummy the characteristic listed in that row andthe interaction of that characteristic with the
African-American dummy The reported coef-ficient is that on the interaction term
We start with job requirements About 80percent of the ads state some form of require-ment About 44 percent of the ads require someminimum experience of which roughly 50 per-cent simply ask for ldquosome experiencerdquo 24 per-cent less than two years and 26 percent at leastthree years of experience About 44 percent of
TABLE 7mdashEFFECT OF JOB REQUIREMENT AND EMPLOYER CHARACTERISTICS ON RACIAL DIFFERENCES IN CALLBACKS
Job requirementSample mean
(standard deviation)Marginal effect on callbacksfor African-American names
Any requirement (Y 1) 079 0023(041) (0015)
Experience (Y 1) 044 0011(049) (0013)
Computer skills (Y 1) 044 0000(050) (0013)
Communication skills (Y 1) 012 0000(033) (0015)
Organization skills (Y 1) 007 0028(026) (0029)
Education (Y 1) 011 0031(031) (0017)
Total number of requirements 118 0002(093) (0006)
Employer characteristicSample mean
(standard deviation)Marginal effect on callbacksfor African-American names
Equal opportunity employer (Y 1) 029 0013(045) (0012)
Federal contractor (Y 1) 011 0035(N 3102) (032) (0016)Log(employment) 574 0001(N 1690) (174) (0005)Ownership status(N 2878)Privately held 074 0011
(0019)Publicly traded 015 0025
(0015)Not-for-profit 011 0025
(0042)Fraction African-Americans in employerrsquos zip code
(N 1918)008 0117
(015) (0062)
Notes Sample is all sent resumes (N 4870) unless otherwise specified in column 1 Column 2 reports means and standarddeviations (in parentheses) for the job requirement or employer characteristic For ads listing an experience requirement 501percent listed ldquosomerdquo 240 percent listed ldquotwo years or lessrdquo and 259 percent listed ldquothree years or morerdquo For ads listingan education requirement 88 percent listed a high school degree 485 percent listed some college and 427 percent listedat least a four-year college degree Column 3 reports the marginal effect of the job requirement or employer characteristiclisted in that row on differential treatment Specifically each cell in column 3 corresponds to a different probit regression ofthe callback dummy on an African-American name dummy a dummy for the requirement or characteristic listed in that rowand the interaction of the requirement or characteristic dummy with the African-American name dummy Reported in eachcell is the estimated change in probability for the interaction term Standard errors are corrected for clustering of theobservations at the employment-ad level
1004 THE AMERICAN ECONOMIC REVIEW SEPTEMBER 2004
ads mention some computer knowledge require-ment which can range from Excel or Word tomore esoteric software programs Good com-munication skills are explicitly required inabout 12 percent of the ads Organization skillsare mentioned 7 percent of the time Finallyonly about 11 percent of the ads list an expliciteducation requirement Of these 88 percentrequire a high school degree 485 percent somecollege (such as an associate degree) and therest at least a four-year college degree37
Despite this variability we find little system-atic relationship between any of the require-ments and the racial gap in callback The pointestimates in column 3 show no consistent eco-nomic pattern and are all statistically weakMeasures of job quality such as experience orcomputer skills requirements do not predict theextent of the racial gap Communication orother interpersonal skill requirements have noeffect on the racial gap either38
We also study employer characteristics Col-lecting such information is a more difficult tasksince it is not readily available from the em-ployment ads we respond to The only piece ofemployer information we can directly collectfrom the employment ad is whether or not theemployer explicitly states being an ldquoEqual Op-portunity Employerrdquo In several cases the nameof the employer is not even mentioned in the adand the only piece of information we can rely onis the fax number which applications must besubmitted to We therefore have to turn to sup-plemental data sources For employment adsthat do not list a specific employer we first usethe fax number to try to identify the companyname via Web reverse-lookup services Basedon company names we use three different datasources (Onesource Business Browser ThomasRegister and Dun and Bradstreet Million Dol-lar Directory 2001) to track company informa-tion such as total employment industry andownership status Using this same set of data
sources we also try to identify the specific zipcode of the company (or company branch) thatresumes are to be sent to Finally we use theFederal Procurement and Data Center Web siteto find a list of companies that have federalcontracts39 The racial difference in callbackrates for the subsamples where employer char-acteristics could be determined is very similar inmagnitude to that in the full sample
Employer characteristics differ significantlyacross ads Twenty-nine percent of all employ-ers explicitly state that they are ldquoEqual Oppor-tunity Employersrdquo Eleven percent are federalcontractors and therefore might face greaterscrutiny under affirmative action laws The av-erage company size is around 2000 employeesbut there is a lot of variation across firms Fi-nally 74 percent of the firms are privately held15 percent are publicly traded and 11 percentare not-for-profit organizations
Neither ldquoEqual Opportunity Employersrdquo norfederal contractors appear to treat African-Americans more favorably In fact each ofthese employer characteristics is associatedwith a larger racial gap in callback (and thiseffect is marginally significant for federal con-tractors) Differential treatment does not varywith employer size40 Point estimates indicateless differential treatment in the not-for-profitsector however this effect is very noisilyestimated41
In an unpublished Appendix (available fromthe authors upon request) we also study howthe racial gap in callback varies by occupationand industry Based on the employment ad list-ings we classify the job openings into six oc-cupation categories executives and managersadministrative supervisors sales representa-tives sales workers secretaries and legal assis-tants clerical workers We also when possible
37 Other requirements sometimes mentioned include typ-ing skills for secretaries (with specific words-per-minuteminimum thresholds) and more rarely foreign languageskills
38 Other ways of estimating these effects produce a sim-ilar nonresult Among other things we considered includinga city dummy or estimating the effects separately by citywe also estimated one single probit regression including allrequirements at once
39 This Web site (wwwfpdcgov) is accurate up to andincluding March 21 2000
40 Similar results hold when we measure employer sizeusing a total sales measure rather than an employmentmeasure
41 Our measurement of the racial gap by firm or em-ployer type may not be a good indicator of the fraction ofAfrican-Americans actually employed in these firms Forexample ldquoEqual Opportunity Employersrdquo may receive ahigher fraction of African-American resumes Their actualhiring may therefore look different from that of non ldquoEqualOpportunity Employersrdquo when one considers the full set ofresumes they receive
1005VOL 94 NO 4 BERTRAND AND MULLAINATHAN RACE IN THE LABOR MARKET
classify employers into six industry categoriesmanufacturing transportation and communica-tion wholesale and retail trade finance insur-ance and real estate business and personalservices health educational and social servicesWe then compute occupation and industry-specific racial gaps in callback and relate thesegaps to 1990 Census-based measures of oc-cupation and industry earnings as well as Census-based measures of the WhiteAfrican-Americanwage gap in these occupations and industries
We find a positive WhiteAfrican-Americangap in callbacks in all occupation and industrycategories (except for transportation and com-munication) While average earnings vary a lotacross the occupations covered in the experi-ment we find no systematic relationship be-tween occupation earnings and the racial gap incallback Similarly the industry-specific gaps incallback do not relate well to a measure ofinter-industry wage differentials In fact whilethe racial gap in callback rates varies somewhatacross occupations and industries we cannotreject the null hypothesis that the gap is thesame across all these categories
The last row of Table 7 focuses on the mar-ginal effect of employer location on the racialgap in callback42 We use as a measure ofemployer location the zip code of the company(or company branch) resumes were to be sentto More specifically we ask whether differen-tial treatment by race varies with the fraction ofAfrican-Americans in the employerrsquos zip codeWe find a marginally significant positive effectof employer location on African-American call-backs but this effect is extremely small In re-gressions not reported here (but available fromthe authors upon request) we reestimate thiseffect separately by city While the point esti-mates are positive for both cities the effect isonly statistically significant for Chicago
IV Interpretation
Three main sets of questions arise when in-terpreting the results above First does a highercallback rate for White applicants imply thatemployers are discriminating against African-
Americans Second does our design only iso-late the effect of race or is the namemanipulation conveying some other factors thanrace Third how do our results relate to differ-ent models of racial discrimination
A Interpreting Callback Rates
Our results indicate that for two identicalindividuals engaging in an identical job searchthe one with an African-American name wouldreceive fewer interviews Does differentialtreatment within our experiment imply that em-ployers are discriminating against African-Americans (whether it is rational prejudice-based or other form of discrimination) In otherwords could the lower callback rate we recordfor African-American resumes within our ex-periment be consistent with a racially neutralreview of the entire pool of resumes the sur-veyed employers receive
In a racially neutral review process employ-ers would rank order resumes based on theirquality and call back all applicants that areabove a certain threshold Because names arerandomized the White and African-Americanresumes we send should rank similarly on av-erage So irrespective of the skill and racialcomposition of the applicant pool a race-blindselection rule would generate equal treatment ofWhites and African-Americans So our resultsmust imply that employers use race as a factorwhen reviewing resumes which matches thelegal definition of discrimination
But even rules where employers are not try-ing to interview as few African-American ap-plicants as possible may generate observeddifferential treatment in our experiment Onesuch hiring rule would be employers trying tointerview a target level of African-Americancandidates For example perhaps the averagefirm in our experiment aims to produce an in-terview pool that matches the population baserate This rule could produce the observed dif-ferential treatment if the average firm receives ahigher proportion of African-American resumesthan the population base rate because African-Americans disproportionately apply to the jobsand industries in our sample43
42 For previous work on the effect of employer locationon labor market discrimination see for example StevenRaphael et al (2000)
43 Another variant of this argument is that the (up to) twoAfrican-American resumes we sent are enough to signifi-
1006 THE AMERICAN ECONOMIC REVIEW SEPTEMBER 2004
Some of our other findings may be consistentwith such a rule For example the fact thatldquoEqual Opportunity Employersrdquo or federal con-tractors do not appear to discriminate any lessmay reflect the fact that such employers receivemore applications from African-Americans Onthe other hand other key findings run counter tothis rule As we discuss above we find nosystematic difference in the racial gap in call-back across occupational or industry categoriesdespite the large variation in the fraction ofAfrican-Americans looking for work in thosecategories African-Americans are underrepre-sented in managerial occupations for exampleIf employers matched base rates in the popula-tion the few African-Americans who apply tothese jobs should receive a higher callback ratethan Whites Yet we find that the racial gap inmanagerial occupations is the same as in all theother job categories This rule also runs counterto our findings on returns to skill Suppose firmsare struggling to find White applicants but over-whelmed with African-American ones Thenthey should be less sensitive to the quality ofWhite applicants (as they are trying to fill intheir hiring quota for Whites) and much moresensitive to the quality of Black applicants(when they have so many to pick from) Thus it
is unlikely that the differential treatment weobserve is generated by hiring rules such as these
B Potential Confounds
While the names we have used in this exper-iment strongly signal racial origin they mayalso signal some other personal trait More spe-cifically one might be concerned that employ-ers are inferring social background from thepersonal name When employers read a namelike ldquoTyronerdquo or ldquoLatoyardquo they may assumethat the person comes from a disadvantagedbackground44 In the extreme form of this socialbackground interpretation employers do notcare at all about race but are discriminating onlyagainst the social background conveyed by thenames we have chosen45
While plausible we feel that some of ourearlier results are hard to reconcile with thisinterpretation For example in Table 6 wefound that while employers value ldquobetterrdquo ad-dresses African-Americans are not helped morethan Whites by living in Whiter or more edu-cated neighborhoods If the African-Americannames we have chosen mainly signal negativesocial background one might have expected theestimated name gap to be lower for better ad-dresses Also if the names mainly signal socialbackground one might have expected the namegap to be higher for jobs that rely more on softskills or require more interpersonal interactionsWe found no such evidence in Table 7
We however directly address this alternativeinterpretation by examining the average socialbackground of babies born with the names usedin the experiment We were able to obtain birthcertificate data on motherrsquos education (less thanhigh school high school or more) for babiesborn in Massachusetts between 1970 and
cantly distort the racial composition of the entire applicantpool This is unlikely for two reasons First anecdotalevidence and the empirically low callback rates we recordsuggest that firms typically receive many hundreds of re-sumes in response to each ad they post Hence the (up to)four resumes we send out are unlikely to influence the racialcomposition of the pool Second the similar racial gap incallback we observe across the two cities goes counter tothis interpretation since the racial composition base ratesdiffer quite a lot across these two cities Another variant ofthis argument is that for some reason the average firm inour sample receives a lot of high-quality resumes fromAfrican-American applicants and much fewer high-qualityresumes from White applicants Hypothetically this mightoccur if high-quality African-Americans are much morelikely to use help-wanted ads rather than other job searchchannels If employers perform within-race comparisonsand again want to target a certain racial mix in their inter-viewing and hiring our African-American resumes maynaturally receive lower callbacks as they are competing withmany more high-quality applicants This specific argumentwould be especially relevant in a case where the averagesampled employer is ldquoknownrdquo to be good to African-Americans But our selection procedure for the employmentads did not allow for such screening we simply respondedto as many ads as possible in the targeted occupationalcategories
44 Roland Fryer and Steven Levitt (2003) provide a re-cent analysis of social background and naming conventionsamongst African-Americans
45 African-Americans as a whole come from more dis-advantaged backgrounds than Whites For this social classeffect to be something of independent interest one mustassert that African-Americans with the African-Americannames we have selected are from a lower social backgroundthan the average African-American andor that Whites withthe White names we have selected are from a higher socialbackground than the average White We come back to thispoint below
1007VOL 94 NO 4 BERTRAND AND MULLAINATHAN RACE IN THE LABOR MARKET
198646 For each first name in our experimentwe compute the fraction of babies with that
name and in that gender-race cell whose moth-ers have at least completed a high schooldegree
In Table 8 we display the average callbackrate for each first name along with this proxy forsocial background Within each race-gendergroup the names are ranked by increasing call-back rate Interestingly there is significant
46 This longer time span (compared to that used to assessname frequencies) was imposed on us for confidentialityreasons When fewer than 10 births with education dataavailable are recorded in a particular education-name cellthe exact number of births in that cell is not reported and weimpute five births Our results are not sensitive to thisimputation One African-American female name (Latonya)and two male names (Rasheed and Hakim) were imputed inthis way One African-American male name (Tremayne)had too few births with available education data and wastherefore dropped from this analysis Our results are quali-
tatively similar when we use a larger data set of Californiabirths for the years 1989 to 2000 (kindly provided to us bySteven Levitt)
TABLE 8mdashCALLBACK RATE AND MOTHERrsquoS EDUCATION BY FIRST NAME
White female African-American female
Name Percent callback Mother education Name Percent callback Mother education
Emily 79 966 Aisha 22 772Anne 83 931 Keisha 38 688Jill 84 923 Tamika 55 615Allison 95 957 Lakisha 55 556Laurie 97 934 Tanisha 58 640Sarah 98 979 Latoya 84 555Meredith 102 818 Kenya 87 702Carrie 131 807 Latonya 91 313Kristen 131 934 Ebony 96 656
Average 917 Average 610Overall 839 Overall 702
Correlation 0318 (p 0404) Correlation 0383 (p 0309)
White male African-American male
Name Percent callback Mother education Name Percent callback Mother education
Todd 59 877 Rasheed 30 773Neil 66 857 Tremayne 43 mdashGeoffrey 68 960 Kareem 47 674Brett 68 939 Darnell 48 661Brendan 77 967 Tyrone 53 640Greg 78 883 Hakim 55 737Matthew 90 931 Jamal 66 739Jay 134 854 Leroy 94 533Brad 159 905 Jermaine 96 575
Average 917 Average 667Overall 835 Overall 689
Correlation 00251 (p 0949) Correlation 0595 (p 0120)
Notes This table reports for each first name used in the experiment callback rate and average mother education Mothereducation for a given first name is defined as the percent of babies born with that name in Massachusetts between 1970 and1986 whose mother had at least completed a high school degree (see text for details) Within each sexrace group first namesare ranked by increasing callback rate ldquoAveragerdquo reports within each race-gender group the average mother education forall the babies born with one of the names used in the experiment ldquoOverallrdquo reports within each race-gender group averagemother education for all babies born in Massachusetts between 1970 and 1986 in that race-gender group ldquoCorrelationrdquo reportsthe Spearman rank order correlation between callback rate and mother education within each race-gender group as well as thep-value for the test of independence
1008 THE AMERICAN ECONOMIC REVIEW SEPTEMBER 2004
variation in callback rates by name Of coursechance alone could produce such variation be-cause of the rather small number of observa-tions in each cell (about 200 for the femalenames and 70 for the male names)47
The row labeled ldquoAveragerdquo reports the aver-age fraction of mothers that have at least com-pleted high school for the set of names listed inthat gender-race group The row labeled ldquoOver-allrdquo reports the average fraction of mothers thathave at least completed high school for the fullsample of births in that gender-race group Forexample 839 percent of White female babiesborn between 1970 and 1986 have mothers withat least a high school degree 917 percent of theWhite female babies with one of the names usedin the experiment have mothers with at least ahigh school degree
Consistent with a social background interpre-tation the African-American names we havechosen fall below the African-American aver-age For African-American male names how-ever the gap between the experimental namesand the population average is negligible ForWhite names both the male and female namesare above the population average
But more interestingly to us there is substan-tial between-name heterogeneity in social back-ground African-American babies named Kenyaor Jamal are affiliated with much higher moth-ersrsquo education than African-American babiesnamed Latonya or Leroy Conversely Whitebabies named Carrie or Neil have lower socialbackground than those named Emily orGeoffrey This allows for a direct test of thesocial background hypothesis within our sam-ple are names associated with a worse socialbackground discriminated against more In thelast row in each gender-race group we reportthe rank-order correlation between callbackrates and motherrsquos education The social back-ground hypothesis predicts a positive correla-tion Yet for all four categories we find the
exact opposite The p-values indicate that wecannot reject independence at standard signifi-cance levels except in the case of African-American males where we can almost reject it atthe 10-percent level (p 0120) In summarythis test suggests little evidence that social back-ground drives the measured race gap
Names might also influence our resultsthrough familiarity One could argue that theAfrican-American names used in the experi-ment simply appear odd to human resourcemanagers and that any odd name is discrimi-nated against But as noted earlier the nameswe have selected are not particularly uncommonamong African-Americans (see Appendix TableA1) We have also performed a similar exerciseto that of Table 8 and measured the rank-ordercorrelation between name-specific callbackrates and name frequency within each gender-race group We found no systematic positivecorrelation
There is one final potential confound to ourresults Perhaps what appears as a bias againstAfrican-Americans is actually the result of re-verse discrimination If qualified African-Americans are thought to be in high demandthen employers with average quality jobs mightfeel that an equally talented African-Americanwould never accept an offer from them andthereby never call her or him in for an inter-view Such an argument might also explain whyAfrican-Americans do not receive as strong areturn as Whites to better resumes since higherqualification only strengthens this argumentBut this interpretation would suggest thatamong the better jobs we ought to see evidenceof reverse discrimination or at least a smallerracial gap However as we discussed in SectionIII subsection D we do not find any suchevidence The racial gap does not vary acrossjobs with different skill requirements nor doesit vary across occupation categories Evenamong the better jobs in our sample we findthat employers significantly favor applicantswith White names48
47 We formally tested whether this variation was signif-icant by estimating a probit regression of the callbackdummy on all the personal first names allowing for clus-tering of the observations at the employment-ad level Forall but African-American females we cannot reject the nullhypothesis that all the first name effects in the same race-gender group are the same Of course a lack of a rejectiondoes not mean there is no underlying pattern in the between-name variation in callbacks that might have been detectablewith larger sample sizes
48 One might argue that employers who reverse-discrim-inate hire through less formal channels than help-wantedads But this would imply that African-Americans are lesslikely to find jobs through formal channels The evidence onexit out of unemployment does not paint a clear picture inthis direction (Holzer 1987)
1009VOL 94 NO 4 BERTRAND AND MULLAINATHAN RACE IN THE LABOR MARKET
C Relation to Existing Theories
What do these results imply for existing mod-els of discrimination Economic theories of dis-crimination can be classified into two maincategories taste-based and statistical discrimi-nation models49 Both sets of models can obvi-ously ldquoexplainrdquo our average racial gap incallbacks But can these models explain ourother findings More specifically we discussthe relevance of these models with a focus ontwo of the facts that have been uncovered in thispaper (i) the lower returns to credentials forAfrican-Americans (ii) the relative uniformityof the race gap across occupations job require-ments and to a lesser extent employer charac-teristics and industries
Taste-based models (Gary S Becker 1961)differ in whose prejudiced ldquotastesrdquo they empha-size customers coworkers or employers Cus-tomer and co-worker discrimination modelsseem at odds with the lack of significant varia-tion of the racial gap by occupation and industrycategories as the amount of customer contactand the fraction of White employees vary quitea lot across these categories We do not find alarger racial gap among jobs that explicitly re-quire ldquocommunication skillsrdquo and jobs forwhich we expect either customer or coworkercontacts to be higher (retail sales for example)
Because we do not know what drives employertastes employer discrimination models could beconsistent with the lack of occupation and indus-try variation Employer discrimination alsomatches the finding that employers located inmore African-American neighborhoods appear todiscriminate somewhat less However employerdiscrimination models would struggle to explainwhy African-Americans get relatively lower re-turns to their credentials Indeed the cost of in-dulging the discrimination taste should increase asthe minority applicantsrsquo credentials increase50
Statistical discrimination models are theprominent alternative to the taste-based models
in the economics literature In one class of sta-tistical discrimination models employers use(observable) race to proxy for unobservableskills (eg Edmund S Phelps 1972 Kenneth JArrow 1973) This class of models struggle toexplain the credentials effect as well Indeedthe added credentials should lead to a largerupdate for African-Americans and hence greaterreturns to skills for that group
A second class of statistical discriminationmodels ldquoemphasize the precision of the infor-mation that employers have about individualproductivityrdquo (Altonji and Blank 1999) Spe-cifically in these models employers believethat the same observable signal is more precisefor Whites than for African-Americans (DennisJ Aigner and Glenn G Cain 1977 Shelly JLundberg and Richard Startz 1983 BradfordCornell and Ivo Welch 1996) Under such mod-els African-Americans receive lower returns toobservable skills because employers place lessweight on these skills However how reason-able is this interpretation for our experimentFirst it is important to note that we are using thesame set of resume characteristics for both ra-cial groups So the lower precision of informa-tion for African-Americans cannot be that forexample an employer does not know what ahigh school degree from a very African-Americanneighborhood means (as in Aigner and Cain1977) Second many of the credentials on theresumes are in fact externally and easily verifiablesuch as a certification for a specific software
An alternative version of these models wouldrely on bias in the observable signal rather thandifferential variance or noise of these signals byrace Perhaps the skills of African-Americansare discounted because affirmative actionmakes it easier for African-Americans to getthese skills While this is plausible for creden-tials such as an employee-of-the-month honorit is unclear why this would apply to moreverifiable and harder skills It is equally unclearwhy work experience would be less rewardedsince our study suggests that getting a job ismore not less difficult for African-Americans
The uniformity of the racial gap across occu-pations is also troubling for a statistical discrim-ination interpretation Numerous factors thatshould affect the level of statistical discrimina-tion such as the importance of unobservableskills the observability of qualifications theprecision of observable skills and the ease of
49 Darity and Mason (1998) provide a more thoroughreview of a variety of economic theories of discrimination
50 One could however assume that employer tastes dif-fer not just by race but also by race and skill so thatemployers have greater prejudice against minority workerswith better credentials But the opposite preferences em-ployers having a particular distaste for low-skilled African-Americans also seem reasonable
1010 THE AMERICAN ECONOMIC REVIEW SEPTEMBER 2004
performance measurement may vary quite a lotacross occupations
This discussion suggests that perhaps othermodels may do a better job at explaining ourfindings One simple alternative model is lexi-cographic search by employers Employers re-ceive so many resumes that they may use quickheuristics in reading these resumes One suchheuristic could be to simply read no furtherwhen they see an African-American name Thusthey may never see the skills of African-American candidates and this could explainwhy these skills are not rewarded This mightalso to some extent explain the uniformity of therace gap since the screening process (ie look-ing through a large set of resumes) may be quitesimilar across the variety of jobs we study51
V Conclusion
This paper suggests that African-Americansface differential treatment when searching forjobs and this may still be a factor in why they dopoorly in the labor market Job applicants withAfrican-American names get far fewer call-backs for each resume they send out Equallyimportantly applicants with African-Americannames find it hard to overcome this hurdle incallbacks by improving their observable skillsor credentials
Taken at face value our results on differen-tial returns to skill have possibly important pol-icy implications They suggest that trainingprograms alone may not be enough to alleviatethe racial gap in labor market outcomes Fortraining to work some general-equilibriumforce outside the context of our experimentwould have to be at play In fact if African-Americans recognize how employers rewardtheir skills they may rationally be less willingthan Whites to even participate in theseprograms
51 Another explanation could be based on employer ste-reotyping or categorizing If employers have coarser stereo-types for African-Americans many of our results wouldfollow See Melinda Jones (2002) for the relevant psychol-ogy and Mullainathan (2003) for a formalization of thecategorization concept
1011VOL 94 NO 4 BERTRAND AND MULLAINATHAN RACE IN THE LABOR MARKET
REFERENCES
Aigner Dennis J and Cain Glenn G ldquoStatisticalTheories of Discrimination in Labor Mar-ketsrdquo Industrial and Labor Relations Re-view January 1977 30(1) pp 175ndash87
Altonji Joseph G and Blank Rebecca M ldquoRaceand Gender in the Labor Markeyrdquo in OrleyAshenfelter and David Card eds Handbookof labor economics Vol 30 AmsterdamNorth-Holland 1999 pp 3143ndash259
Arrow Kenneth J ldquoThe Theory of Discrimina-tionrdquo in Orley Ashenfelter and Albert Reeseds Discrimination in labor marketsPrinceton NJ Princeton University Press1973 pp 3ndash33
ldquoWhat Has Economics to Say aboutRacial Discriminationrdquo Journal of EconomicPerspectives Spring 1998 12(2) pp 91ndash100
Becker Gary S The economics of discrimina-tion 2nd Ed Chicago University of ChicagoPress 1961
Brown Colin and Gay Pat Racial discrimina-tion 17 years after the act London PolicyStudies Institute 1985
Cornell Bradford and Welch Ivo ldquoCulture In-formation and Screening DiscriminationrdquoJournal of Political Economy June 1996104(3) pp 542ndash71
Council of Economic Advisers Changing AmericaIndicators of social and economic well-beingby race and Hispanic origin September 1998httpw3accessgpogoveopcapdfscapdf
Cross Harry Kenney Genevieve Mell Jane andZimmerman Wendy Employer hiring prac-tices Differential treatment of Hispanic andAnglo job applicants Washington DC Ur-ban Institute Press 1990
TABLE A1mdashFIRST NAMES USED IN EXPERIMENT
White femalePerception White
African-American femalePerception BlackName L(W)L(B) Name L(B)L(W)
Allison 0926 Aisha 209 097Anne 0962 Ebony 09Carrie 0923 Keisha 116 093Emily 0925 Kenya 0967Jill 0889 Lakisha 0967Laurie 0963 Latonya 1Kristen 0963 Latoya 1Meredith 0926 Tamika 284 1Sarah 0852 Tanisha 1
Fraction of all births Fraction of all births
38 percent 71 percent
White malePerception White
African-American malePerception BlackName L(W)L(B) Name L(B)L(W)
Brad 1 Darnell 0967Brendan 0667 Hakim 0933Geoffrey 0731 Jamal 257 0967Greg 1 Jermaine 905 1Brett 0923 Kareem 0967Jay 0926 Leroy 445 0933Matthew 0888 Rasheed 0931Neil 0654 Tremayne 0897Todd 0926 Tyrone 625 0900
Fraction of all births Fraction of all births
17 percent 31 percent
Notes This table tabulates the different first names used in the experiment and their identifiability The first column reportsthe likelihood that a baby born with that name (in Massachusetts between 1974 and 1979) is White (or African-American)relative to the likelihood that it is African-American (White) The second column reports the probability that the name waspicked as White (or African-American) in an independent field survey of people The last row for each group of names showsthe proportion of all births in that race group that these names account for
1012 THE AMERICAN ECONOMIC REVIEW SEPTEMBER 2004
Darity William A Jr and Mason Patrick LldquoEvidence on Discrimination in Employ-ment Codes of Color Codes of GenderrdquoJournal of Economic Perspectives Spring1998 12(2) pp 63ndash90
Fix Michael and Turner Margery A eds Anational report card on discrimination inAmerica The role of testing WashingtonDC Urban Institute Press 1998
Fryer Roland and Levitt Steven ldquoThe Causesand Consequences of Distinctively BlackNamesrdquo Mimeo University of Chicago2003
Goldin Claudia and Rouse Cecilia ldquoOrchestrat-ing Impartiality The Impact of Blind Audi-tions on Female Musiciansrdquo AmericanEconomic Review September 2000 90(4)pp 715ndash41
Heckman James J ldquoDetecting DiscriminationrdquoJournal of Economic Perspectives Spring1998 12(2) pp 101ndash16
Heckman James J Lochner Lance J and ToddPetra E ldquoFifty Years of Mincer Earnings Re-gressionsrdquo Mimeo University of Chicago2001
Heckman James J and Siegelman Peter ldquoTheUrban Institute Audit Studies Their Methodsand Findingsrdquo in Michael Fix and RaymondJ Struyk eds Clear and convincing evi-dence Measurement of discrimination inAmerica Lanham MD Urban InstitutePress 1992 pp 187ndash258
Holzer Harry J ldquoInformal Job Search and BlackYouth Unemploymentrdquo American EconomicReview June 1987 77(3) pp 446ndash52
Hubbuck Jim and Carter Simon Half achance A report on job discriminationagainst young blacks in Nottingham LondonCommission for Racial Equality 1980
James Franklin and DelCastillo Steve W ldquoMea-suring Job Discrimination by Private Em-ployers Against Young Black and HispanicSeeking Entry Level Work in the DenverMetropolitan Areardquo Mimeo University ofColorado-Denver 1991
Jones Melinda Social psychology of prejudiceSaddle River NJ Pearson Education 2002
Jowell Roger and Prescott-Clark Patricia ldquoRa-cial Discrimination and White-Collar Work-
ers in Britainrdquo Race November 1970 11(4)pp 397ndash417
Lundberg Shelly J and Starz Richard ldquoPrivateDiscrimination and Social Intervention inCompetitive Labor Marketrdquo American Eco-nomic Review June 1983 73(3) pp 340ndash47
McIntyre Shelby J Moberg Dennis J and Pos-ner Barry Z ldquoDiscrimination in RecruitmentAn Empirical Analysis Commentrdquo Indus-trial and Labor Relations Review July 198033(4) pp 543ndash47
Mullainathan Sendhil ldquoThinking Through Cat-egoriesrdquo Mimeo Massachusetts Institute ofTechnology 2003
Neumark David ldquoSex Discrimination in Res-taurant Hiring An Audit Studyrdquo QuarterlyJournal of Economics August 1996 111(3)pp 915ndash42
Newman Jerry M ldquoDiscrimination in Recruit-ment An Empirical Analysisrdquo Industrial andLabor Relations Review October 197832(1) pp 15ndash23
Nisbett Richard E and Cohen Dov The cultureof honor The psychology of violence in theSouth Boulder CO Westview Press 1996
Phelps Edmund S ldquoThe Statistical Theory ofRacism and Sexismrdquo American EconomicReview September 1972 62(4) pp 659ndash61
Raphael Steven Stoll Michael A and HolzerHarry J ldquoAre Suburban Firms More Likelyto Discriminate against African AmericansrdquoJournal of Urban Economics November2000 48(3) pp 485ndash508
Riach Peter A and Rich Judity ldquoTesting forRacial Discrimination in the Labour MarketrdquoCambridge Journal of Economics September1991 15(3) pp 239ndash56
Turner Margery A Fix Michael and StruykRaymond J Opportunities denied opportuni-ties diminished Racial discrimination in hir-ing Washington DC Urban Institute Press1991
Weichselbaumer Doris ldquoSexual OrientationDiscrimination in Hiringrdquo Labour Econom-ics December 2003 10(6) pp 629ndash42
ldquoIs it Sex or Personality The Impactof Sex-Stereotypes on Discrimination in Ap-plicant Selectionrdquo Eastern Economic Jour-nal Spring 2004 30(2) pp 159ndash86
1013VOL 94 NO 4 BERTRAND AND MULLAINATHAN RACE IN THE LABOR MARKET
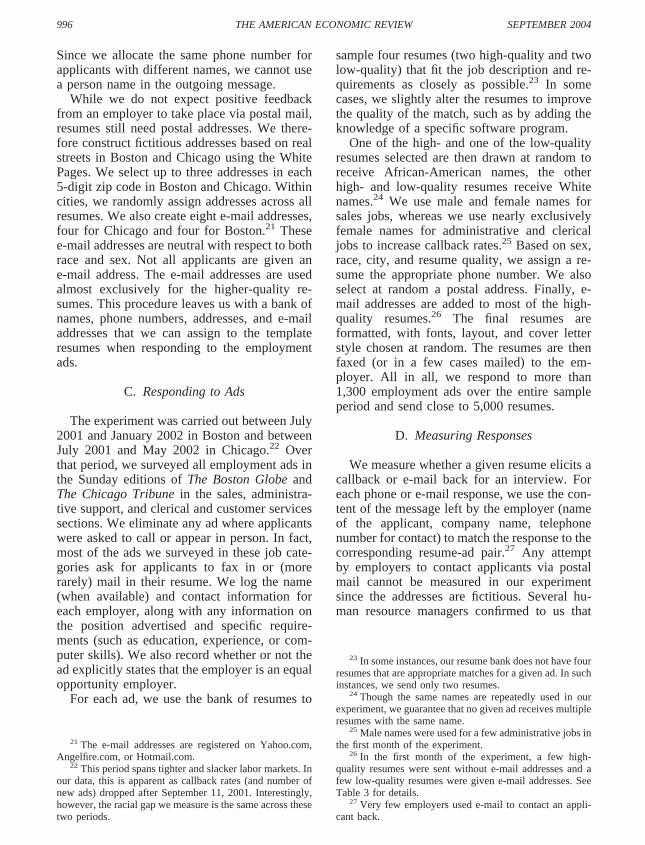
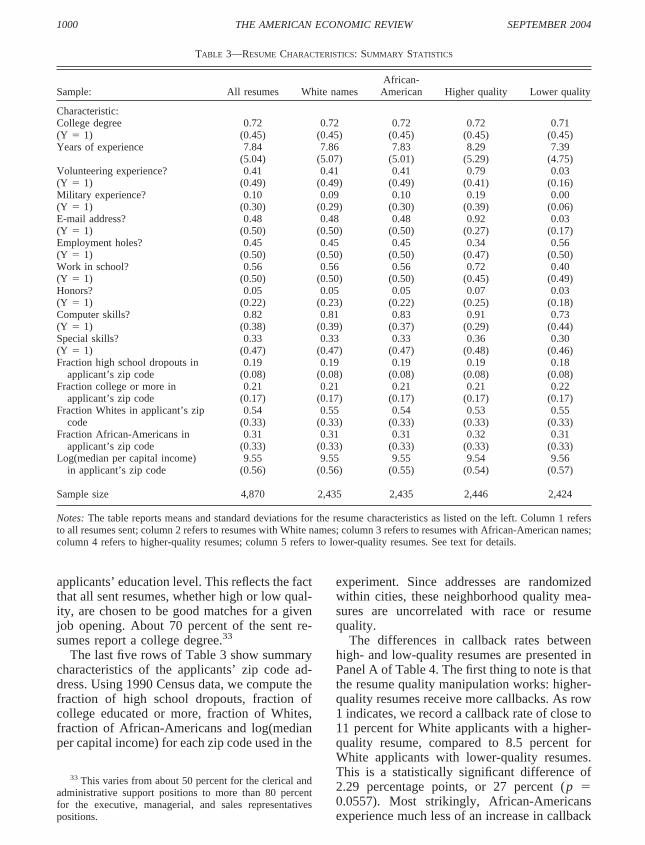