14.662 S15 Discrimination: Empirics Lecture Slides · Audit resume studies can overcome many of...
50
Discrimination: Empirics Heidi L. Williams MIT 14.662 Spring 2015 Williams (MIT 14.662) Discrimination: Empirics Spring 2015 1 / 49
Transcript of 14.662 S15 Discrimination: Empirics Lecture Slides · Audit resume studies can overcome many of...

Discrimination: Empirics
Heidi L. Williams
MIT 14.662
Spring 2015
Williams (MIT 14.662) Discrimination: Empirics Spring 2015 1 / 49

Testing for evidence of discrimination
Version 1.0: “unexplained” or residual male/female wage gap � Difficult to control for all relevant characteristics � Very indirect test of discrimination � Some covariates are potentially endogenous (education)
Version 2.0: alternative methods � Audit studies � Quasi-experiments � Tests of equilibrium predictions
Williams (MIT 14.662) Discrimination: Empirics Spring 2015 2 / 49

�
�
�
�
�
�
�
�
Roadmap for today
Regression analysis Goldberger (1984) Neal and Johnson (1996)
Audit studies Overview by Riach and Rich (2002) Bertrand and Mullainathan (2004)
Quasi-experiments Goldin and Rouse (2000) Anwar, Bayer, and Hjalmarsson (2012)
Testing models Charles and Guryan (2008) Chandra and Staiger (2010)
Williams (MIT 14.662) Discrimination: Empirics Spring 2015 3 / 49
I
I
I
I
I
I
I
I

1
2
3
4
Regression analysis Goldberger (1984) Neal and Johnson (1996)
Audit studies Bertrand and Mullainathan (2004)
Quasi-experiments Goldin and Rouse (2000) Anwar, Bayer, and Hjalmarsson (2012)
Testing models Charles and Guryan (2008) Chandra and Staiger (2010)
Looking ahead 5
Williams (MIT 14.662) Discrimination: Empirics Spring 2015 4 / 49

�
Direct regression
Are men paid more than equally productive women?
Suppose that the conditional expectation of earnings given qualifications and gender is given by:
E (y |x , z) = b'x + az
y : earnings
x = (x1, x2, ..., xk )': vector of productivity qualifications
z : gender indicator z = 1 for men, z = 0 for women
coefficient a: discriminatory premium paid to men
Williams (MIT 14.662) Discrimination: Empirics Spring 2015 5 / 49
I

�
�
�
Direct regression
Commonly estimated in both the academic literature (e.g. Oaxaca (1973)) and in discrimination-related law suits Usual finding: a > 0
Often interpreted as evidence of salary discrimination Among men and women with equal x, men are paid more
Usual concern: omitted productivity-relevant characteristics If cov(z , f|x) > 0 then expect upward bias
Williams (MIT 14.662) Discrimination: Empirics Spring 2015 6 / 49
I
I
I

�
�
Reverse regression
Are men less qualified than equally paid women? ∗ E (q|y , z) = c y + d ∗ z
q = b ' x: scalar index of qualifications coefficient d∗: excess qualifications of men for same salary
d∗ < 0: evidence of salary discrimination in favor of men Among men and women with equal y , men less qualified
Williams (MIT 14.662) Discrimination: Empirics Spring 2015 7 / 49
I
I
�
�
�
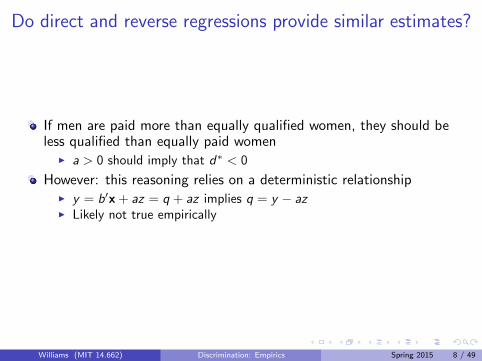
Do direct and reverse regressions provide similar estimates?
If men are paid more than equally qualified women, they should be less qualified than equally paid women
a > 0 should imply that d∗ < 0
However: this reasoning relies on a deterministic relationship y = b'x + az = q + az implies q = y − az Likely not true empirically
Williams (MIT 14.662) Discrimination: Empirics Spring 2015 8 / 49
I
I
I

�
�
�
�
Direct and reverse regression: Conflicting estimates
In practice, often give conflicting results Example: 1976 U-Illinois study of male/female faculty salaries
Males paid $2,000 more than females with same # publications Females publish 2 fewer articles than males with same salary Implies both a and d∗ are positive
In general, reverse regression suggests lower estimate of salary discrimination (in favor of men) than direct regression
Reverse regression often suggests reverse discrimination
Williams (MIT 14.662) Discrimination: Empirics Spring 2015 9 / 49
I
I
I
I

1
2
Direct and reverse regression: Goldberger (1984)
Goldberger paper very clearly written, but short on intuition
Common notion at the time: direct biased, reverse unbiased Two alternative models for single qualification case:
Model #1: errors in variables * Direct regression estimate upward-biased * Reverse regression estimate downward-biased * Direct and reverse regression bound true parameter value
Model #2: proxy variable * Direct regression estimate unbiased * Reverse regression estimate downward-biased
(may be of the wrong sign)
Williams (MIT 14.662) Discrimination: Empirics Spring 2015 10 / 49
1
2
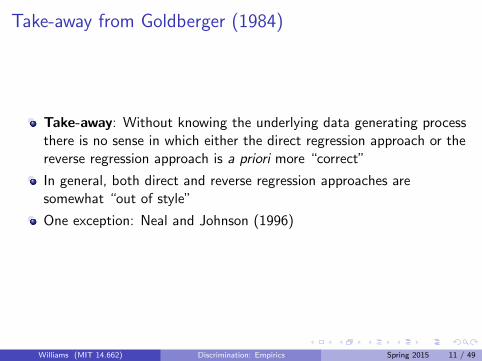
Take-away from Goldberger (1984)
Take-away: Without knowing the underlying data generating process there is no sense in which either the direct regression approach or the reverse regression approach is a priori more “correct”
In general, both direct and reverse regression approaches are somewhat “out of style”
One exception: Neal and Johnson (1996)
Williams (MIT 14.662) Discrimination: Empirics Spring 2015 11 / 49

1
2
3
4
Regression analysis Goldberger (1984) Neal and Johnson (1996)
Audit studies Bertrand and Mullainathan (2004)
Quasi-experiments Goldin and Rouse (2000) Anwar, Bayer, and Hjalmarsson (2012)
Testing models Charles and Guryan (2008) Chandra and Staiger (2010)
Looking ahead 5
Williams (MIT 14.662) Discrimination: Empirics Spring 2015 12 / 49

Neal and Johnson (1996)
How much of the black-white earnings gap is explained by differences inskills acquired prior to labor market entry?
National Longitudinal Survey of Youth (NLSY) data
Examine black-white wage gaps among workers in their late twentiesas a function of AFQT score at age 18 or younger
Williams (MIT 14.662) Discrimination: Empirics Spring 2015 13 / 49

Neal and Johnson (1996): Table 1Column (3): Adds linear and quadratic variables for AFQTExplains ∼ 3
4 of racial wage gap for young men
Williams (MIT 14.662) Discrimination: Empirics Spring 2015 14 / 49
© The University of Chicago Press. All rights reserved. This content isexcluded from our Creative Commons license. For more information,see http://ocw.mit.edu/help/faq-fair-use/.

Is the AFQT racially biased?
1991 National Academy of Sciences (NAS) report
Exhaustive study with the Department of Defense
Focused on validity of the AFQT
Special emphasis on racial fairness of the test
No evidence AFQT under-predicts performance of blacks
Williams (MIT 14.662) Discrimination: Empirics Spring 2015 15 / 49
Do blacks underinvest in skill because the return is lower?
Models of statistical discrimination (Lundberg-Startz 1983)
Payoff to skill lower for blacks ⇒ skill differences could reflectanticipation that returns from acquiring skills will be low
Intuitive, but difficult to test
Imperfect test: do returns to AFQT differ by race?
Williams (MIT 14.662) Discrimination: Empirics Spring 2015 16 / 49

Neal and Johnson (1996): Table 2Can’t reject that returns to skill are equal for blacks and whitesBut, problematic test: AFQT score an endogenous investmentIdeally would have an instrument here
Williams (MIT 14.662) Discrimination: Empirics Spring 2015 17 / 49
© The University of Chicago Press. All rights reserved. This content isexcluded from our Creative Commons license. For more information,see http://ocw.mit.edu/help/faq-fair-use/.

What about labor market dropouts?
Neal and Johnson present estimates from two approaches:
Median regressions
Smith-Welch (1986) method
Doesn’t hugely change conclusions
Williams (MIT 14.662) Discrimination: Empirics Spring 2015 18 / 49

Determinants of AFQT scores
Tables 5, 6: Large raw gap, significantly reduced by covariates
Although sizable gaps remain, these results suggest “pre-market”factors may explain much of AFQT gap
Results cast doubt on (very controversial) Herrnstein-Murray (1994)argument that AFQT measures inherent ability
I Estimated racial gaps in scores are larger for older cohortsI Schooling increases AFQT scores (QOB instruments)
Williams (MIT 14.662) Discrimination: Empirics Spring 2015 19 / 49

Take-aways from Neal and Johnson (1996)
Very influential
Focus solely on market discrimination is likely misplaced
Suggests that some attention should be focused on understandingsources of large observed skill gaps between blacks and whites
Williams (MIT 14.662) Discrimination: Empirics Spring 2015 20 / 49

1 Regression analysisGoldberger (1984)Neal and Johnson (1996)
2 Audit studiesBertrand and Mullainathan (2004)
3 Quasi-experimentsGoldin and Rouse (2000)Anwar, Bayer, and Hjalmarsson (2012)
4 Testing modelsCharles and Guryan (2008)Chandra and Staiger (2010)
5 Looking ahead
Williams (MIT 14.662) Discrimination: Empirics Spring 2015 21 / 49

Audit studies: Overview
Long literature (> four decades old) has tested for evidence ofdiscrimination in labor, housing, and product markets by conducting‘audit’ field experiments
Useful overview: Riach and Rich (2002)
Two types of audit experiments:1 Audit tester studies2 Audit resume studies
Conclusion of Riach and Rich: “...demonstrated pervasive andenduring discrimination against non-whites and women”
Williams (MIT 14.662) Discrimination: Empirics Spring 2015 22 / 49
1
2

Audit studies: Criticisms
Famously criticized by Heckman-Siegelman (1992)I Effectiveness of matched processI Unconscious biasI Small samples
Despite these problems: results often quite compelling
Audit resume studies can overcome many of these limitations
Williams (MIT 14.662) Discrimination: Empirics Spring 2015 23 / 49

Bertrand and Mullainathan (2004)
Well-known audit resume study
Sent 5,000 resumes to help-wanted ads in Boston and Chicago
Randomized otherwise equivalent resumes to have African-Americanor White sounding names: Emily Walsh or Greg Baker relative toLakisha Washington or Jamal Jones
Also experimentally vary credentials
Williams (MIT 14.662) Discrimination: Empirics Spring 2015 24 / 49

Williams (MIT 14.662) Discrimination: Empirics Spring 2015 25 / 49
Bertrand and Mullainathan (2004): Table 1Measured interview callbacks from each resume: 50% gap
Courtesy of Marianne Bertrand, Sendhil Mullainathan, and the American Economic Review. Used with permission.

Bertrand and Mullainathan (2004): Table 4Returns to higher-quality resume appear lower for African-Americans
Williams (MIT 14.662) Discrimination: Empirics
Courtesy of Marianne Bertrand, Sendhil Mullainathan, and the American Economic Review. Used with permission.
Spring 2015 26 / 49

Bertrand and Mullainathan (2004): Discussion
Manipulating perceptions of social class, not just race?I Birth certificate data on mother’s education for first namesI Little relationship between SES and name-specific callback rates
Taste-based or statistical discrimination?I Argue neither model fits data especially well
Randomization essentially assumes random search
Williams (MIT 14.662) Discrimination: Empirics Spring 2015 27 / 49

Related paper: Fryer and Levitt (2004)
Investigate relationship between Black names and life outcomes,controlling for background characteristics
No compelling evidence of a relationship
Reconciling this result with Bertrand-Mullainathan:1 Black names used as signals of race by discriminatory employers at
resume stage, but unimportant later2 Black names provide useful signal to employers about labor market
productivity conditional on resume information3 Black names have causal impact on job callbacks that Fryer and Levitt
are unable to detect
Williams (MIT 14.662) Discrimination: Empirics Spring 2015 28 / 49
1
2
3

1 Regression analysisGoldberger (1984)Neal and Johnson (1996)
2 Audit studiesBertrand and Mullainathan (2004)
3 Quasi-experimentsGoldin and Rouse (2000)Anwar, Bayer, and Hjalmarsson (2012)
4 Testing modelsCharles and Guryan (2008)Chandra and Staiger (2010)
5 Looking ahead
Williams (MIT 14.662) Discrimination: Empirics Spring 2015 29 / 49

Goldin and Rouse (2000)
US symphony orchestras long conducted non-blind auditions
Over time, some began using screens to hide performers
Over time, notable increase in share female
Historically, many viewed women as unsuitable for orchestrasI “I just don’t think women should be in an orchestra”I “women are more temperamental and more likely to demand special
attention or treatment”I “the more women [in an orchestra], the poorer the sound”I Some European orchestras continue (as of 2000) to have stated
policies not to hire women
Can blind auditions eliminate discrimination?
Williams (MIT 14.662) Discrimination: Empirics Spring 2015 30 / 49

Data and empirical framework
Collect audition records from major symphony orchestras
Examine blind auditions in differences-in-differences framework
Compare individuals in blind and non-blind auditions (FE)
Williams (MIT 14.662) Discrimination: Empirics Spring 2015 31 / 49
Williams (MIT 14.662) Discrimination: Empirics Spring 2015 32 / 49
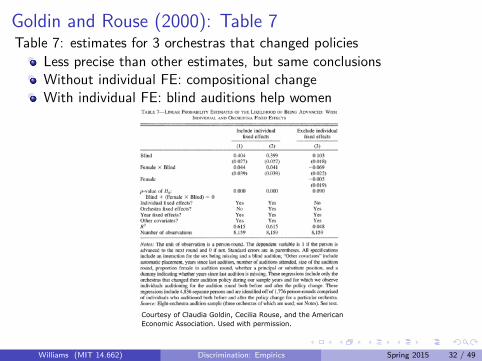
Goldin and Rouse (2000): Table 7Table 7: estimates for 3 orchestras that changed policies
Less precise than other estimates, but same conclusionsWithout individual FE: compositional changeWith individual FE: blind auditions help women
Courtesy of Claudia Goldin, Cecilia Rouse, and the AmericanEconomic Association. Used with permission.

Goldin and Rouse (2000): Discussion
Headline estimate: blind additions increase relative probability thatwomen advance from preliminary round by 50%
I In general, results are quite noisyI One puzzling result for semi-final rounds
Suggests blind auditions reduced discrimination against women andcan explain a large share of the time-series increase in the sharefemale of orchestras since 1970
Can’t distinguish between taste-based, statistical
Can’t examine whether performance affected by screen
Writing this now, would include event study graphs
Williams (MIT 14.662) Discrimination: Empirics Spring 2015 33 / 49

1 Regression analysisGoldberger (1984)Neal and Johnson (1996)
2 Audit studiesBertrand and Mullainathan (2004)
3 Quasi-experimentsGoldin and Rouse (2000)Anwar, Bayer, and Hjalmarsson (2012)
4 Testing modelsCharles and Guryan (2008)Chandra and Staiger (2010)
5 Looking ahead
Williams (MIT 14.662) Discrimination: Empirics Spring 2015 34 / 49

Anwar, Bayer, and Hjalmarsson (2012)
Examine the impact of jury racial composition on trial outcomes usingdata on felony trials in FL from 2000-2010
Exploit day-to-day variation in the composition of the jury pool toisolate quasi-random variation in the composition of the seated jury
Williams (MIT 14.662) Discrimination: Empirics Spring 2015 35 / 49

Williams (MIT 14.662) Discrimination: Empirics Spring 2015 36 / 49
Anwar, Bayer, and Hjalmarsson (2012): Table 2Composition of jury pool appears uncorrelated with characteristics ofthe defendant and case
© Oxford University Press. All rights reserved. This content is excluded from our CreativeCommons license. For more information, see http://ocw.mit.edu/help/faq-fair-use/.

Anwar, Bayer, and Hjalmarsson (2012): Table 4Large racial gap (16pp) in conviction rates when no blacks in jury pool≥ 1 black member in jury pool eliminates this gapWhite conviction rates sharply higher with ≥ 1 black member
Williams (MIT 14.662) Discrimination: Empirics Spring 2015 37 / 49
© Oxford University Press. All rights reserved. This content is excluded from our CreativeCommons license. For more information, see http://ocw.mit.edu/help/faq-fair-use/.

Anwar, Bayer, and Hjalmarsson (2012): Discussion
Headline estimate: racial gap in conviction rates is entirely eliminatedwhen the jury pool includes at least one black member
Don’t estimate IV (argue exclusion restriction isn’t plausible)I First stage is 0.40
Note: broader law/economics literature + data
Williams (MIT 14.662) Discrimination: Empirics Spring 2015 38 / 49

1 Regression analysisGoldberger (1984)Neal and Johnson (1996)
2 Audit studiesBertrand and Mullainathan (2004)
3 Quasi-experimentsGoldin and Rouse (2000)Anwar, Bayer, and Hjalmarsson (2012)
4 Testing modelsCharles and Guryan (2008)Chandra and Staiger (2010)
5 Looking ahead
Williams (MIT 14.662) Discrimination: Empirics Spring 2015 39 / 49

Testing models
Most papers documenting evidence of discrimination can’t distinguishbetween taste-based and statistical models of discrimination
Recent papers speaking more closely to theory:I Testing taste-based: Charles-Guryan (2008)I Testing statistical: Altonji-Pierret (2001)I Testing between models: List (2004), Chandra-Staiger (2010)
Williams (MIT 14.662) Discrimination: Empirics Spring 2015 40 / 49

1 Regression analysisGoldberger (1984)Neal and Johnson (1996)
2 Audit studiesBertrand and Mullainathan (2004)
3 Quasi-experimentsGoldin and Rouse (2000)Anwar, Bayer, and Hjalmarsson (2012)
4 Testing modelsCharles and Guryan (2008)Chandra and Staiger (2010)
5 Looking ahead
Williams (MIT 14.662) Discrimination: Empirics Spring 2015 41 / 49

Charles and Guryan (2008)
Tests key predictions of Becker taste-based discrimination model
Combine ‘standard’ measures of CPS residual wage gap with ‘direct’measures of prejudice from General Social Survey
Although not definitive, results are supportive of Becker model
Williams (MIT 14.662) Discrimination: Empirics Spring 2015 42 / 49

Williams (MIT 14.662) Discrimination: Empirics Spring 2015 43 / 49
Charles and Guryan (2008): Table 3Prejudice of the ‘marginal’ white more strongly predictive of racialwage gaps than is the average prejudice
© The University of Chicago Press. All rights reserved. This contentis excluded from our Creative Commons license. For moreinformation, see http://ocw.mit.edu/help/faq-fair-use/.

1 Regression analysisGoldberger (1984)Neal and Johnson (1996)
2 Audit studiesBertrand and Mullainathan (2004)
3 Quasi-experimentsGoldin and Rouse (2000)Anwar, Bayer, and Hjalmarsson (2012)
4 Testing modelsCharles and Guryan (2008)Chandra and Staiger (2010)
5 Looking ahead
Williams (MIT 14.662) Discrimination: Empirics Spring 2015 44 / 49

Health care: Chandra and Staiger (2010)
Gigantic literature documenting evidence of disparities in health caretreatment and health outcomes
Taste-based: providers use higher benefit threshold for providing careto minority patients
I Implies that returns to the marginal minority patient receivingtreatment will be higher than the returns to the marginal non-minoritypatient receiving treatment
Statistical: minorities may have lower benefit from treatment
In both models, minorities receive less treatment, but statisticalimplies “under-treatment” may be optimal
Williams (MIT 14.662) Discrimination: Empirics Spring 2015 45 / 49

Chandra and Staiger (2010): Key test
With prejudice, treatment-on-the-treated effect should be larger forminorities (conditional on propensity to be treated)
Similar in spirit to Knowles, Persico, and Todd (2001), who analyzeracial bias in motor vehicle searches
Williams (MIT 14.662) Discrimination: Empirics Spring 2015 46 / 49
Chandra and Staiger (2010): Discussion
Do not find evidence of taste-based discriminationI If anything, women and minorities appear to have slightly smaller
benefits from treatment relative to men and whites
Section VI discusses several potential explanations
Argue results most consistent with statistical discrimination
Unclear why minorities, women are less appropriate for treatment:key to interpreting findings, public policy relevance
Williams (MIT 14.662) Discrimination: Empirics Spring 2015 47 / 49

1 Regression analysisGoldberger (1984)Neal and Johnson (1996)
2 Audit studiesBertrand and Mullainathan (2004)
3 Quasi-experimentsGoldin and Rouse (2000)Anwar, Bayer, and Hjalmarsson (2012)
4 Testing modelsCharles and Guryan (2008)Chandra and Staiger (2010)
5 Looking ahead
Williams (MIT 14.662) Discrimination: Empirics Spring 2015 48 / 49

Looking ahead
Discrimination and learning
Williams (MIT 14.662) Discrimination: Empirics Spring 2015 49 / 49

MIT OpenCourseWarehttp://ocw.mit.edu
14.662 Labor Economics IISpring 2015
For information about citing these materials or our Terms of Use, visit: http://ocw.mit.edu/terms.