Are Crude Oil, Gas and Coal Prices Cointegrated
20
˺ Are crude oil, gas and coal prices cointegrated? Davood Manzur Sajjad Seiflou Abstract This study examines the existence of long run relation between crude oil, natural gas and coal prices. Energy data for us is used and Based on the result of The Augmented Dickey-Fuller (ADF) tests, autoregressive distributed lag (ARDL) approach is adopted. Underlying ARDL model is specified in logarithmic form, so that the coefficients indicate the elasticities. Long run relationship and error correction model (ECM) are estimated for selected ARDL. Moreover, to confirm the stability of the model, CUSUM and CUSUMSQ tests are also conducted with the results that the estimated model is completely stable. The results confirm the existence of long run relation between coal, gas and oil prices. However, in short run gas prices have no effects on the oil prices as its coefficient is insignificant. Key words: energy (Oil, Gas, Coal) prices; unit root; cointegration; autoregressive distributed lag (ARDL; ECM model. JEL codes: C2, E3, Q4. 1- Introduction One characteristic of commodity prices is the presence of a unit root in their univariate time series representation, implying that price movements are better characterized as being the sum of permanent and transitory components where the permanent component is a random walk. However, this study is to examine the long-run relation between crude oil, gas and coal prices. In doing so, tests for unit roots in the univariate time series representation of monthly prices are performed to determine their integration degrees — a prerequisite for the analysis of cointegration. Cointegration is designed to deal explicitly with the analysis of the relationship between non-stationary time series. In particular, it allows individual time series to be non-stationary but requires a linear combination of the series to be stationary. Therefore, the basic idea behind cointegration is to search for linear combinations of individually non-stationary time series that are themselves stationary. The methodology used to study common trends in these series is based on the autoregressive distributed lag (ARDL) approach proposed by Pesaran and Shin (Pesaran and Shin, (1995, 1998); Pesaran et al., (1996); Pesaran et al. (2001)). This paper is developed in six sections. Section two is a short literature review. Section three reports the results of unit root and stationarity tests using Augmented Dickey-Fuller (ADF) approach. Section four describes the methodology of autoregressive distributed lag (ARDL) approach. Section five presents empirical results and the last section reports the main conclusions. 2- Literature Review What price linkages exist between oil, coal, and natural gas? The main theory here is based on economic substitution. As Bachmeier & Griffin (2006) assert clearly, in the
-
Upload
anoop-prajapati -
Category
Documents
-
view
17 -
download
0
description
Are crude oil, gas and coal prices cointegrated
Transcript of Are Crude Oil, Gas and Coal Prices Cointegrated

Are crude oil, gas and coal prices cointegrated?
Davood ManzurSajjad Seiflou
Abstract
This study examines the existence of long run relation between crude oil,natural gas and coal prices. Energy data for us is used and Based on theresult of The Augmented Dickey-Fuller (ADF) tests, autoregressivedistributed lag (ARDL) approach is adopted. Underlying ARDL model isspecified in logarithmic form, so that the coefficients indicate theelasticities. Long run relationship and error correction model (ECM) areestimated for selected ARDL. Moreover, to confirm the stability of themodel, CUSUM and CUSUMSQ tests are also conducted with the resultsthat the estimated model is completely stable.
The results confirm the existence of long run relation between coal, gasand oil prices. However, in short run gas prices have no effects on the oilprices as its coefficient is insignificant.Key words: energy (Oil, Gas, Coal) prices; unit root; cointegration;autoregressive distributed lag (ARDL; ECM model.JEL codes: C2, E3, Q4.
1- IntroductionOne characteristic of commodity prices is the presence of a unit root in theirunivariate time series representation, implying that price movements are bettercharacterized as being the sum of permanent and transitory components where thepermanent component is a random walk.However, this study is to examine the long-run relation between crude oil, gas andcoal prices. In doing so, tests for unit roots in the univariate time series representationof monthly prices are performed to determine their integration degrees — aprerequisite for the analysis of cointegration. Cointegration is designed to dealexplicitly with the analysis of the relationship between non-stationary time series. Inparticular, it allows individual time series to be non-stationary but requires a linearcombination of the series to be stationary. Therefore, the basic idea behindcointegration is to search for linear combinations of individually non-stationary timeseries that are themselves stationary. The methodology used to study common trendsin these series is based on the autoregressive distributed lag (ARDL) approachproposed by Pesaran and Shin (Pesaran and Shin, (1995, 1998); Pesaran et al., (1996);Pesaran et al. (2001)).This paper is developed in six sections. Section two is a short literature review.Section three reports the results of unit root and stationarity tests using AugmentedDickey-Fuller (ADF) approach. Section four describes the methodology ofautoregressive distributed lag (ARDL) approach. Section five presents empiricalresults and the last section reports the main conclusions.
2- Literature ReviewWhat price linkages exist between oil, coal, and natural gas? The main theory here isbased on economic substitution. As Bachmeier & Griffin (2006) assert clearly, in the
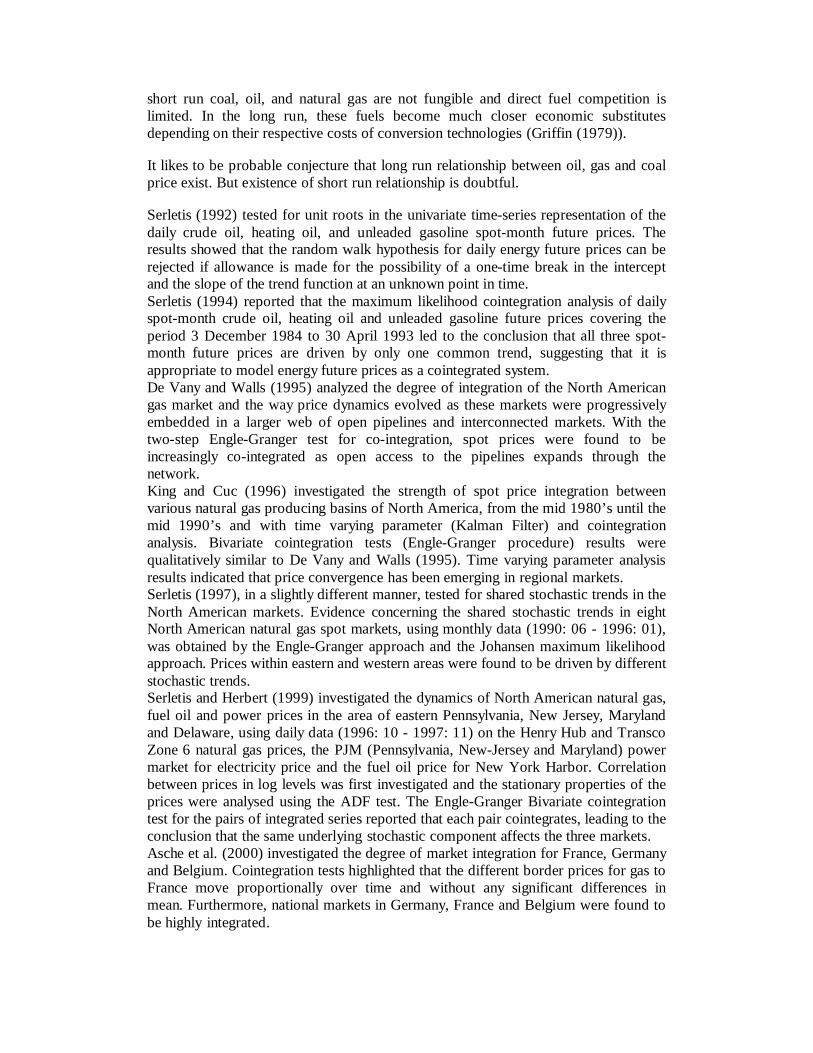
short run coal, oil, and natural gas are not fungible and direct fuel competition islimited. In the long run, these fuels become much closer economic substitutesdepending on their respective costs of conversion technologies (Griffin (1979)).
It likes to be probable conjecture that long run relationship between oil, gas and coalprice exist. But existence of short run relationship is doubtful.
Serletis (1992) tested for unit roots in the univariate time-series representation of thedaily crude oil, heating oil, and unleaded gasoline spot-month future prices. Theresults showed that the random walk hypothesis for daily energy future prices can berejected if allowance is made for the possibility of a one-time break in the interceptand the slope of the trend function at an unknown point in time.Serletis (1994) reported that the maximum likelihood cointegration analysis of dailyspot-month crude oil, heating oil and unleaded gasoline future prices covering theperiod 3 December 1984 to 30 April 1993 led to the conclusion that all three spot-month future prices are driven by only one common trend, suggesting that it isappropriate to model energy future prices as a cointegrated system.De Vany and Walls (1995) analyzed the degree of integration of the North Americangas market and the way price dynamics evolved as these markets were progressivelyembedded in a larger web of open pipelines and interconnected markets. With thetwo-step Engle-Granger test for co-integration, spot prices were found to beincreasingly co-integrated as open access to the pipelines expands through thenetwork.King and Cuc (1996) investigated the strength of spot price integration betweenvarious natural gas producing basins of North America, from the mid 1980’s until themid 1990’s and with time varying parameter (Kalman Filter) and cointegrationanalysis. Bivariate cointegration tests (Engle-Granger procedure) results werequalitatively similar to De Vany and Walls (1995). Time varying parameter analysisresults indicated that price convergence has been emerging in regional markets.Serletis (1997), in a slightly different manner, tested for shared stochastic trends in theNorth American markets. Evidence concerning the shared stochastic trends in eightNorth American natural gas spot markets, using monthly data (1990: 06 - 1996: 01),was obtained by the Engle-Granger approach and the Johansen maximum likelihoodapproach. Prices within eastern and western areas were found to be driven by differentstochastic trends.Serletis and Herbert (1999) investigated the dynamics of North American natural gas,fuel oil and power prices in the area of eastern Pennsylvania, New Jersey, Marylandand Delaware, using daily data (1996: 10 - 1997: 11) on the Henry Hub and TranscoZone 6 natural gas prices, the PJM (Pennsylvania, New-Jersey and Maryland) powermarket for electricity price and the fuel oil price for New York Harbor. Correlationbetween prices in log levels was first investigated and the stationary properties of theprices were analysed using the ADF test. The Engle-Granger Bivariate cointegrationtest for the pairs of integrated series reported that each pair cointegrates, leading to theconclusion that the same underlying stochastic component affects the three markets.Asche et al. (2000) investigated the degree of market integration for France, Germanyand Belgium. Cointegration tests highlighted that the different border prices for gas toFrance move proportionally over time and without any significant differences inmean. Furthermore, national markets in Germany, France and Belgium were found tobe highly integrated.
Asche et al. (2002) examined whether the German market was integrated byinvestigating time series of Norwegian, Dutch and Russian Gas monthly export pricesto Germany from January 1990 to December 1997. The Johansen multivariateprocedure results showed that gas from the three suppliers compete closely in thesame markets since the prices move proportionally over time, but at different pricelevels.Hirschhausen et al. (2004) examined the degree of natural gas market integration inEurope, North America and Japan, between the mid 1990’s and 2002. Correspondinghypothesis was that there was a certain split of prices between Europe and NorthAmerica. The relationship between the international gas marker prices and theirrelation to the oil price, are investigated through principal component analysis andJohansen likelihood-based procedures. Both of them showed a high level ofintegration within the European/Japanese and North American markets and that theEuropean/Japanese and the North American markets are connected to a much lesserextent.Warell (2006) tested the hypothesis of the existence of a single economic market forthe international coal industry, separated for coking and steam coal, and hasinvestigated market integration over time. This were conducted by applyingcointegration and error-correction models on quarterly price series data in Europe andJapan over the time period 1980-2000. Both the coking and the steam coal marketsshowed evidence of global market integration, as demonstrated by the stable long-runcointegrating relationship between the respective price series in different worldregions.Bachmeier and Griffin (2006) evaluated the degree of market integration both withinand between crude oil, coal, and natural gas markets. Their approach yieldsparameters that can be readily tested against a priori conjectures. Using daily pricedata for five very different crude oils, they concluded that the world oil market is asingle, highly integrated economic market. On the other hand, coal prices at fivetrading locations across the United States are cointegrated, but the degree of marketintegration is much weaker, particularly between Western and Eastern coals. Finally,they showed that crude oil, coal, and natural gas markets are only very weaklyintegrated.Theodore and Emilie (2007) examined the relationship between UK wholesale gasprices and the Brent oil price over the period 1996–2003 in order to investigatewhether oil and gas prices ‘decoupled’ during this period as orthodox gas marketliberalisation theory had suggested. Tests for unit roots and cointegration were carriedout and it was discovered that a long-run equilibrium relationship between UK gasand oil prices exists. it was found that the cointegrating relationship is presentthroughout the sample period. However, the long-run solutions seem to be morevolatile. Evidence was provided that the short-run relationship is linear and impulseresponse functions are used to examine the effects that a shock in oil would have ongas. These findings do not support the assumption that gas prices and oil prices‘decouple’.
Hammoudeh et al. (2008) examined the dynamic relationship between pairs of fouroil benchmark prices (i.e., West Texas Intermediate, Brent, Dubai, and Maya). Theresults indicated that there is a long-run equilibrium relationship between differentbenchmarks, regardless of their properties and locations.

3- The Data and Unit RootsWe used data for US energy markets. The Crude Oil Domestic First Purchase Price,the natural gas Wellhead Price and the Cost of Coal Receipts at Electric GeneratingPlants for coal price were employed. The time period of the analysis extends fromOctober 1983 to October 2008, involving 301 observations1.
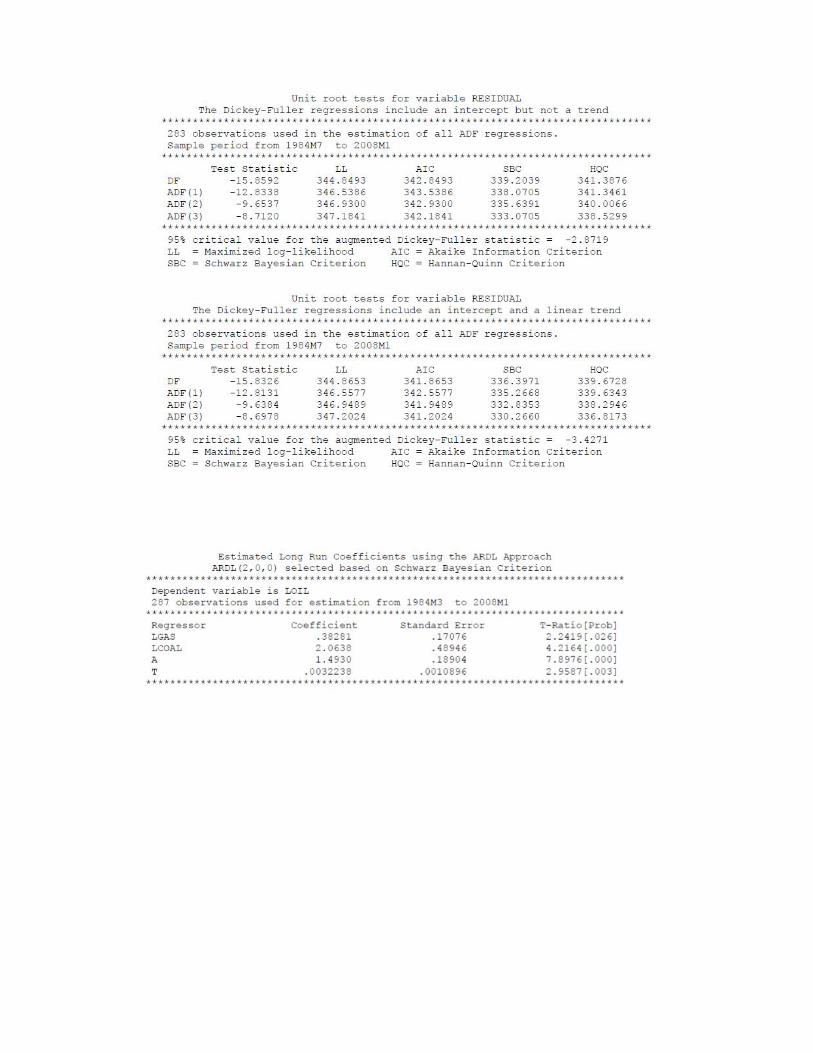
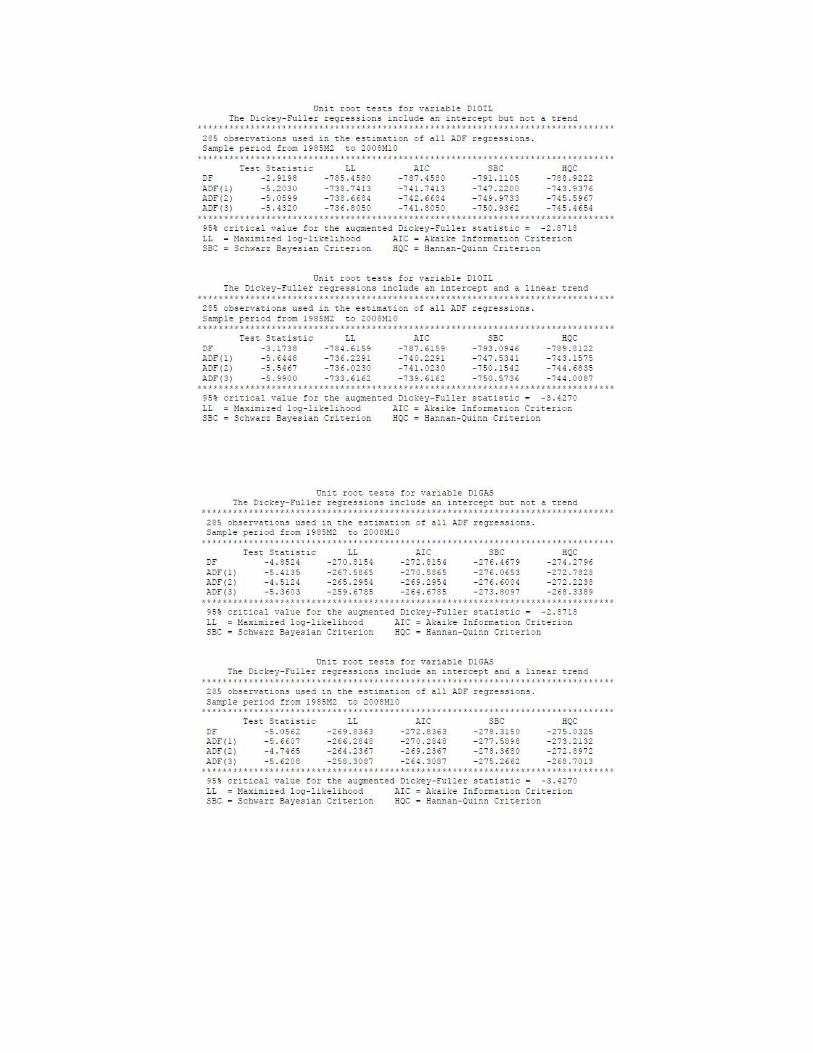
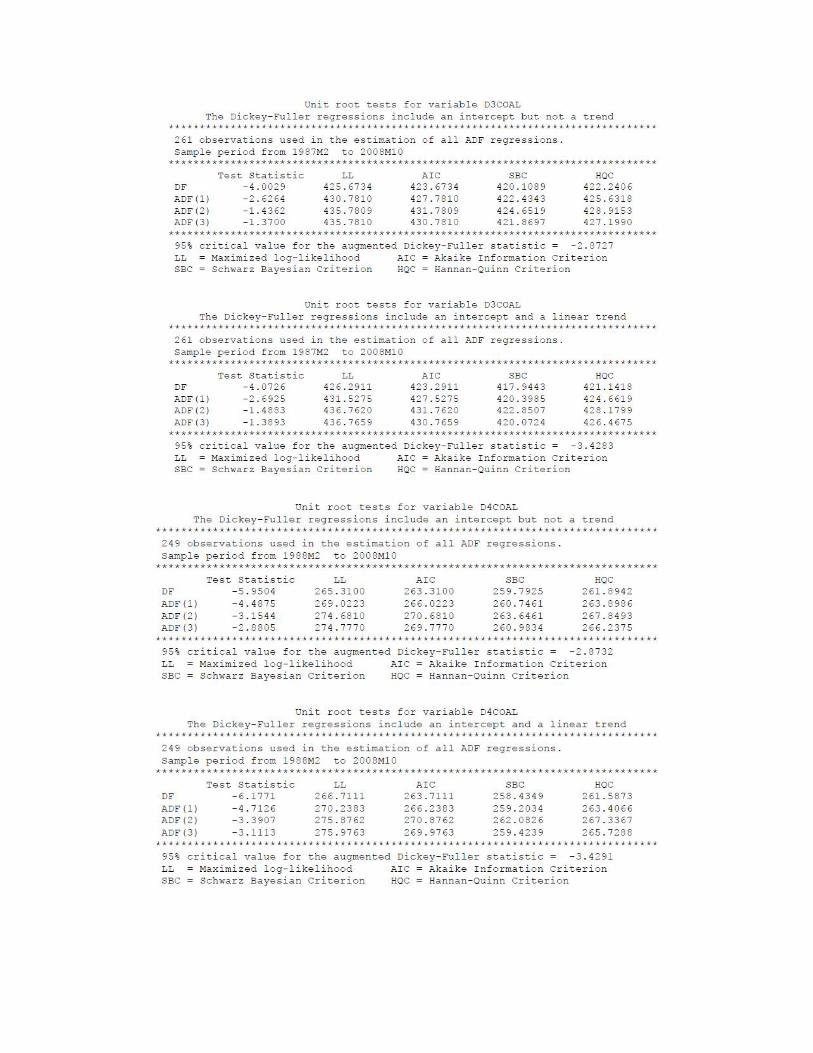
The results of unit roots tests reported by Microfit based on Schwarz BayesianCriterion (SBC) are as follow:
Table (1): Augmented Dickey-Fuller (ADF) testvariables an intercept but not a trend an intercept and a linear trend
Critical values Statistic Critical values StatisticOil -2.8714 -2.8683 -3.4264 -3.7656Gas -2.8714 -1.5382 -3.4264 -3.6957Coal -2.8714 3.0999 -3.4264 3.2806
D1Oil -2.8718 -5.2030 -3.4270 -5.6448D1Gas -2.8718 -5.3603 -3.4270 -5.6208D1Coal -2.8718 1.1232 -3.4270 -.72409D2Coal -2.8722 -1.2675 -3.4276 -1.5834D3Coal -2.8727 -1.4362 -3.4283 -1.4883D4Coal -2.8732 -3.1544 -3.4291 -3.3907D5Coal -2.8738 -7.9277 -3.4300 -8.0053
Based on the results of ADF test, oil, gas and coal are integrated processes of degreeone, one and five or I (1), I (1) and I (5), respectively.
4- MethodologyThere are various techniques for conducting the cointegration analysis. Econometricliterature has abundant econometric techniques to investigate cointegrationrelationships among economic variables. The popular approaches are the well-knownresidual based approach proposed by Engle and Granger (1987) and the maximumlikelihood-based approach proposed by Johansen and Julius (1990) and Johansen(1992).In applying the cointegration technique, we need to determine the order of integrationfor each variable. When there are more than two I (1) variables in the system, themaximum likelihood approach of Johansen and Julius has the advantage overresidual-based approach of Engle and Granger; however, both of the approachesrequire that the variables have the same order of integration. This requirement oftencauses difficulty to the researchers when the system contains the variables withdifferent orders of integration- such as in this study. To overcome this problem,Pesaran et al. (1996, 2001) proposed a new approach known as AutoregressiveDistributed Lag (ARDL) for cointegration test that does not require the classificationof variables into I(0) or I(1). More recent studies have indicated that the ARDLapproach to cointegration is preferable to other conventional cointegrationapproaches. The ARDL is applicable irrespective of whether the underlyingregressors are purely I(0), purely I(1) or mutually cointegrated. The statisticunderlying the procedure is the Wald or F-statistic in a generalized Dickey–Fullertype regression, which is used to test the significance of lagged levels of the variablesunder consideration in a conditional unrestricted equilibrium correction model (ECM)
1 www.eia.doe.gov
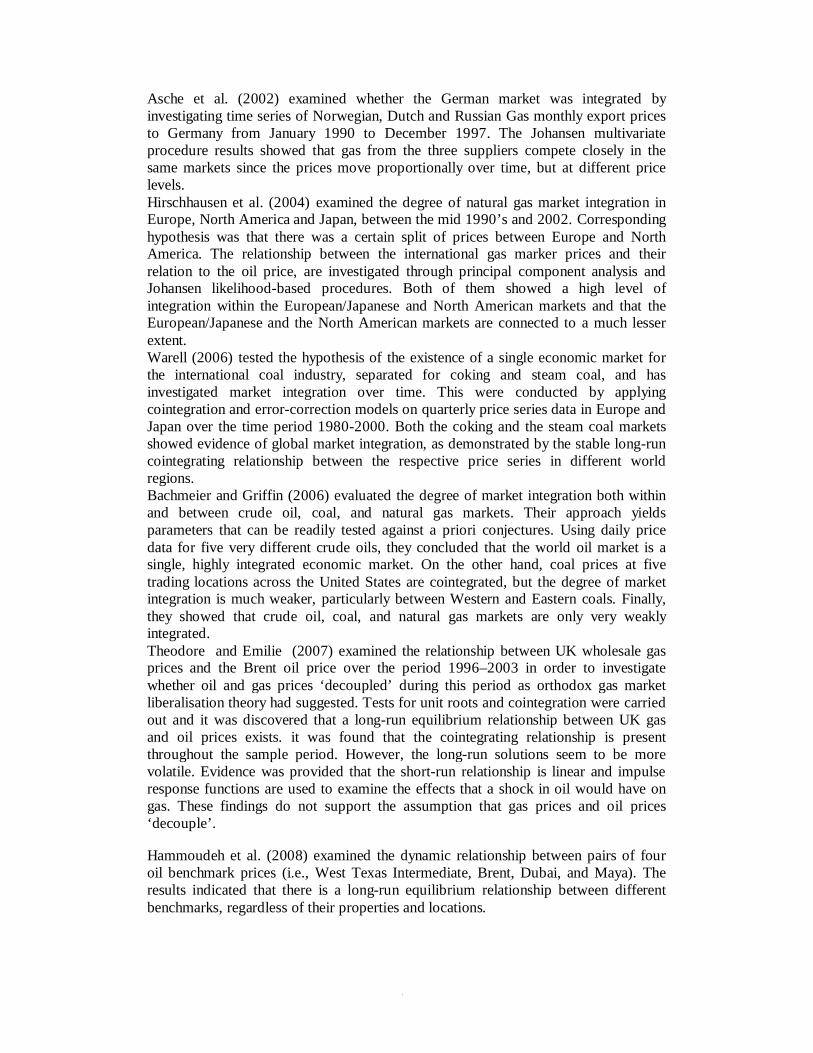
(Pesaran et al, 2001). Besides, ARDL approach is more robust and performs better forsmall sample sizes than other cointegration techniques.The ARDL approach involves estimating the conditional error correction version ofthe ARDL model. The augmented ARDL (p, q1,q2,…,qk) is given by the followingequation (Pesaran and Pesaran, 1997; Pesaran and Shin, 2001):
01
, ,k
t i i it t ti
L p y L q x w t 1,2, , n (3)
Wherep
pLLLpL ...1, 221
i
i
qiqiiiii LLLqL ..., 2
210 i 1,2, ,k
ty is the dependent variable, 0 is the constant term, L is the lag operator, tw is1 s vector of deterministic variables such as intercept term, time trends, or exogenousvariables with fixed lags. xt is the k-dimensional forcing variables which are notcointegrated among themselves. t is a vector of stochastic error terms, with zeromeans and constant variance-covariance.
The long-run coefficients are estimated by:
1 2
ˆ1 2
ˆ ˆ ˆ ˆ ˆ, , ,...,ˆ ˆ ˆ1 ...
k
p
p q q q (4)
where kqqqp ˆ,...,ˆ,ˆ,ˆˆ21 denotes the OLS estimates of in equation (1) for the
selected ARDL model.The error correction model (ECM) related to the )q̂,…,q̂,q̂,p̂ARDL( k21 can beobtained by writing equation (3) in terms of lagged levels and the first difference of
1 2, , ,...,t t t kty x x x and tw :
tti
p
j
k
i
q
jijttit
k
iitt xyjwxECMpy
i
1,
1ˆ
1 1
1ˆ
11
*
1010 ˆ,1 (5)
where ECM is the error correction model and it is defined as follows:
tititt wxyECM 0ˆˆ (6)
The ARDL approach involves two steps for estimating the long-run relationship(Pesaran et al., 2001). The first step is to examine the existence of long–runrelationship among all variables in the equations under estimation. The second step isto estimate the long-run and the short-run coefficients of the same equation. We runthe second step only if we find a long-run relationship in the first step (Narayan, et al.2004).
5- Autoregressive Distributed Lag (ARDL) Model and Empirical Results
Because underlying variables (Oil, Gas and Coal) have different integration degrees,ARDL approach is adopted for cointegration analysis.Our ARDL model to estimate long-run relationship among underlying variables, inlogarithmic form, is specified as follows:

1 1 1
0 1 1 21 0 0
p q q
t i t i j t j j t j ti j j
LOil LOil LGas LCoalt (7)
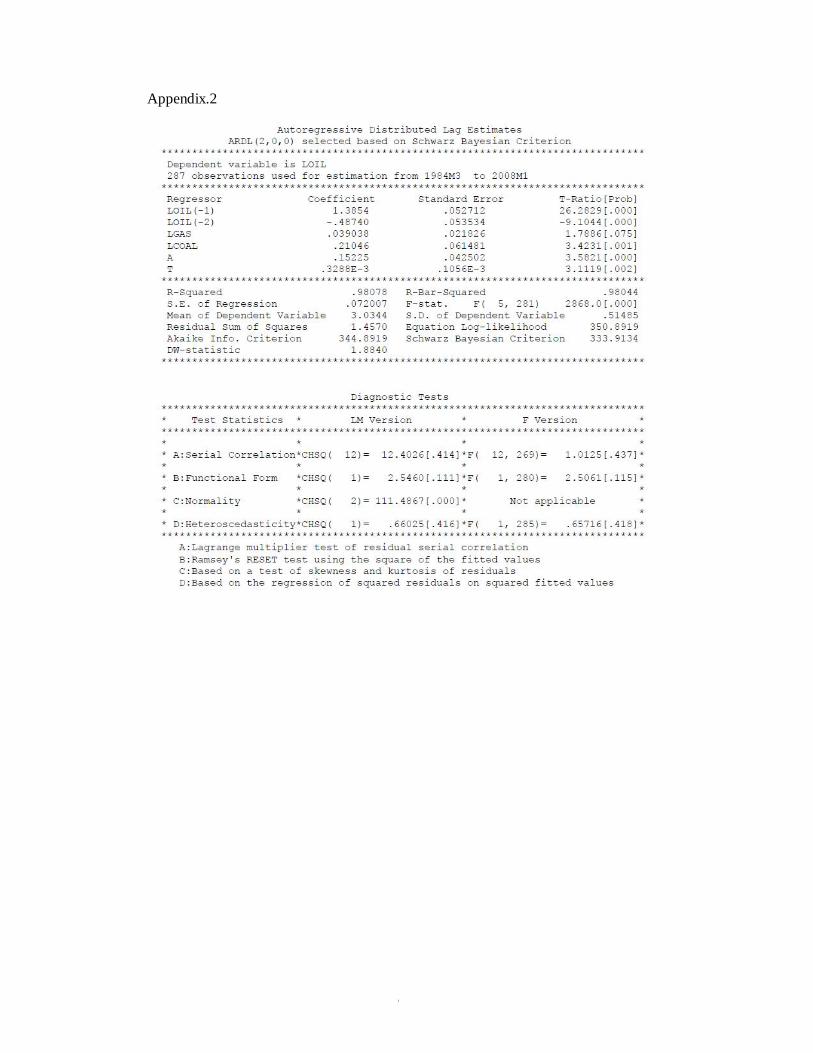
Where 0 is the constant term, and t is time trend.Using Microfit for estimation, ARDL (2, 0, 0) is selected based on Schwarz BayesianCriterion (SBC). Table (2) shows the results for the selected ARDL model.
Table (2): Autoregressive Distributed Lag EstimatesARDL (2,0,0) selected based on Schwarz Bayesian Criterion
Regressor Coefficient T-Ratio Standard ErrorLOil(-1) 1.3854 26.2829 .052712LOil(-2) -.48740 -9.1044 .053534
LGas .039038 1.7886 .021826LCoal .021046 3.4231 .061481
Constant .15225 3.5821 2.3791Time trend .32883 3.1119 .10563
R-Squared = .98078 R-Bar-Squared = .98044F-statistic F( 5, 281) = 2868 Schwarz Bayesian Criterion = 333.9134
As the table indicates all the statistics of the estimated model, except for gas pricecoefficient, are satisfactory.To confirm the stability of the estimated model, the tests of Cumulative Sum ofRecursive Residuals (CUSUM) and Cumulative Sum of Squares of RecursiveResiduals (CUSUMSQ) are employed in this paper. Figures (1) and (2) provide thegraphs of CUSUM and CUSUMSQ tests, respectively. These figures indicate that theplots of CUSUM and CUSUMQ are completely stable within 5% of critical bands.
Figure (1): Cumulative Sum of Recursive Residuals (CUSUM)

Figure (2): Cumulative Sum of Squares of Recursive Residuals (CUSUMSQ)
The results of estimated long run regression and the corresponding ECM model arereported in tables (3) and (4).
Table (3): Estimated Long Run Coefficients using the ARDL ApproachARDL (2, 0, 0) selected based on Schwarz Bayesian Criterion
Regressor Coefficient T-Ratio Standard ErrorLGas .38281 2.2419 .17076LCoal 2.0638 4.2164 .48946
Constant 1.4930 7.8976 .18904Time trend .0032238 2.9587 .0010896
Table (4): Error Correction Representation for the Selected ARDL ModelARDL (2,0,0) selected based on Schwarz Bayesian Criterion
As table (3) indicates, the coefficients (Gas prices and Coal prices) are statisticallysignificant.From table (4), it is clear that the error correction term (ECM (-1)) has the right sign(negative) and is statistically significant. Specifically, the estimated value of EC 1 is -.10198.The absolute value of the coefficient of EC 1, indicating the speed of adjustment toequilibrium, denotes that 10% of any shocks dumps out in each period, convergingback to the long run equilibrium. Bannerjee, Dolado and Mestre (1998), hold that ahighly significant error correction term is further proof of the existence of a stablelong-term relationship, which is the case here.
Regressor Coefficient T-Ratio Standard ErrorD2LOil .48740 9.1044 .053534D1LGas .039038 1.7886 .021826D1LCoal .21046 3.4231 .061481
DConstant .15225 3.5821 .042502DTime trend .32883 3.1119 .10563
ECM(-1) -.10198 -4.4794 .022765R-Squared = .25578 R-Bar-Squared = .24254
F-statistic F( 5, 281) 19.3156 Schwarz Bayesian Criterion = 333.9134
Except coefficient of D1LGas (first difference of LGas), all other short runcoefficients are significant with positive signs as it is expected.
6- ConclusionThis paper investigates the existence of long-run relation between crude oil, gas andcoal prices. The data for us energy market is used in this study. The time period of theanalysis extends from October 1983 to October 2008, involving 301 observations.Augmented Dickey-Fuller (ADF) approach employed for existence of unit root. Inbrief, Augmented Dickey-Fuller (ADF) tests indicate that Oil and Gas prices areintegrated processes of degree one or I (1) and Coal prices is integrated processes ofdegree five or I (5). As integration degree of variables are not same theAutoregressive Distributed Lag (ARDL) approach to cointegration adapted tocointegration analysis on Oil, Gas and coal prices. The ARDL model was specified inlogarithmic form which coefficients mean as elasticities. The model selection fulfilledby Schwarz Bayesian Criterion (SBC) and so ARDL (2, 0, 0) was selected. Moreover,to confirm the stability of the model, CUSUM and CUSUMSQ tests are alsoconducted with the results that the estimated model is completely stable.At short run coefficient of D1LGas (first difference of LGas), are statisticallyinsignificant but in long run LGas (logarithm of gas prices) have a significantcoefficient. LCoal (logarithm of coal prices) at long run and D1LCoal (first differenceof LCoal) at short run have significant coefficients. The results provide that seconddifference of LOil (D2LOil), indicating short run own price elasticity of oil prices,have a significant coefficient.The estimated value of EC 1 is -.10198 indicating about 10% speed of adjustmenttoward equilibrium. It is clear from estimated value of EC 1 that the error correctionterm (ECM (-1)) has the right sign (negative) and is statistically significant.Based on the result of cointegration analysis, we can found the long run relationshipbetween oil, gas and coal prices.

References
1. Asche, F., Osmundsen, P., Tveteras, R., (2000), “Market Integration for Natural Gas in Europe”,Stavanger University College, September.
2. Asche, F., Osmundsen, P., Tveteras, R., (2002), “European Market Integration for Gas? VolumeFlexibility and Political Risk”, Energy Economics, Vol. 24, pp. 49–265.
3. Asteriou, Dimitrios & Hall, S. G. (2007), “Applied econometrics: a modern approach usingEViews and Microfit”, Palgrave Macmillan, New York.
4. Bachmeier, L. J., and Griffin, J. M. (2006), “Testing for Market Integration Crude Oil, Coal, andNatural Gas”, Energy Journal, Vol. 27, pp. 55-71.
5. Baillie, R.T. and Bollerslev, T. (1989), “Common Stochastic Trends in a System of ExchangeRates”, Journal of Finance, Vol.44, pp. 167-181.
6. Christiano, L.J. and Eichenbaum, M. (1989), “Unit Roots in GNP: Do We Know and Do WeCare”, NBER Working Paper, No. 3130.
7. Cochrane, J.H. (1991), “A Critique of Unit Root Tests”, Journal of Economic Dynamics andControl, Vol. 15, pp.275-284.
8. De Vany, A. and Walls, W.D. (1993), “Pipeline Access and Market Integration in the Natural GasIndustry: Evidence from Cointegration Tests”, the Energy Journal, Vol. 14, pp. 1-19.
9. De Vany, A. S., Walls, W. D., (1995), “The Emerging New Order in Natural Gas - Market versusRegulation”, Quorum Books, Westport.
10. Engle, R.F. and Granger C.W.J. (1987), ‘‘Cointegration and Error Correction: RepresentationEstimation, and Testing’’, Econometrica, Vol. 55, pp. 251–76.
11. Griffin, James M. (1979), “Energy Conservation in the OECD: 1980 to 2000”, Cambridge,Ballinger.
12. Hammoudeh, S. M., Ewing, B. T. and Thompson, M. A. (2008), “Threshold CointegrationAnalysis of Crude Oil Benchmarks”, the Energy Journal, Vol.29, pp. 79-96.
13. Hirschhausen, C. V., L’H´egaret, G. and Siliverstovs, B. (2004), “International Market Integrationfor Natural Gas? A Cointegration Analysis of Prices in Europe, North America and Japan”,Globalization of Natural Gas Markets Working Papers, WP-GG-06.
14. King, M. and Cuc, M. (1996), “Price Convergence in North American Natural Gas Spot Markets”,The Energy Journal, Vol. 17, pp.17-42.
15. King, M., Cuc, M., (1996), “Prices Convergence in North American Natural Gas Spots Markets”,the Energy Journal, Vol.17, pp. 47-62.
16. Narayan, P, Smyth, R and Nandha, M. (2004), “Interdependence and dynamic linkages betweenthe emerging stock markets of South Asia”, Accounting and Finance, Vol. 44, pp. 419-439.
17. Nelson, C.R. and Plosser, C.I. (1982), “Trends and Random Walks in Macroeconomic TimeSeries: Some Evidence and Implications”, Journal of Monetary Economics, Vol.10, pp.139-162.
18. Nelson, C.R. and Plosser, C.I. (1982), “Trends and Random Walks in Macroeconomic TimeSeries: Some Evidence and Implications.” Journal of Monetary Economics, Vol.10, pp. 139-162.
19. Perron, P. (1989), “The Great Crash, the Oil Price Shock, and the Unit Root Hypothesis”,Econometrica, Vol. 57, pp.1361-1401.
20. Pesaran, H. M. and Y. Shin. (1998) “An Autoregressive distributed lag modeling approach tocointegration analysis”, in: S. Storm, ed., Econometrics and Economic Theory in the 20th Century:the Ragnar Frisch Centennial Symposium, Cambridge University Press.
21. Pesaran, M. H., Shin, Y. and Smith, R. (1996), “Testing for the existence of a long-runrelationship”, DAE Working Papers 9622, Department of Applied Economics, university ofCambridge.
22. Pesaran, M. H., Shin, Y. and Smith, R. (2001), “Bounds testing approaches to the analysis of levelrelationships”, Journal of Applied Econometrics, Vol. 16, pp. 289-326.
23. Pesaran, M.H. and Shin, Y. (1995), “An autoregressive distributed lag modeling approach tocointegration analysis”, DAE Working papers, No.9514, Department of Economics, University ofCambridge.
24. Serletis, A. (1992), “Unit Root Behavior in Energy Futures Prices”, The Energy Journal, Vol. 13,pp119-128.
25. Serletis, A. (1994), “A Cointegration Analysis of Petroleum Futures Prices”, Energy Economics,Vol. 16, pp. 93-97.
26. Serletis, A. (1997), “Is There an East-West Split in North American Natural Gas Markets?”, theEnergy Journal, Vol.18, pp. 47-62.
27. Serletis, A. (2007), “Quantitative and Empirical Analysis of Energy Markets”, World Scientific,Vol. 1, pp.46-54.
28. Serletis, A., Herbert, J., (1999), “The Message in North American Energy Prices”. EnergyEconomics, Vol. 21, pp. 471-483.
29. Theodore, P., Emilie, R., (2007), “Oil and gas markets in the UK: Evidence from a cointegratingapproach”, Energy economics, Vol. 29, pp. 329-347.
30. Warell, L. (2006), “Market Integration in the International Coal Industry: A CointegrationApproach”, the Energy Journal, Vol.27, pp. 99-119.

Appendix.1


Appendix.2