Arctic sea ice surviving the summer melt: … sea ice surviving the summer melt: interannual...
18
Arctic sea ice surviving the summer melt: interannual variability and decreasing trend H. Jay ZWALLY, Per GLOERSEN Cryospheric Sciences Branch, Code 614.1, NASA Goddard Space Flight Center, Greenbelt, Maryland 20771, USA E-mail: [email protected] ABSTRACT. Sea ice surviving the summer melt season to become multi-year ice in the Arctic Ocean is of interest because multi-year ice significantly affects the ice-thickness distribution and the dynamics and thermodynamics of the ice pack in subsequent seasons. However, the amount of ice surviving summer melting has not been well determined because the time of the minimum ice area varies from region to region. A concept of local temporal minimum (LTM) accounts for non-simultaneity of the melt–freeze transition by determining the minima ice concentrations (C LTM ) on local spatial scales. C LTM are calculated for 25 km gridcells using 24 years (1979–2002) of satellite passive-microwave data. The total area of ice surviving the summer melt (A LTM ) is given by spatial integration of C LTM . Over 24 years, the average A LTM is 2.6 10 6 km 2 (excluding 0.7 10 5 km 2 above 848 N). In contrast, the average area (3.8 10 6 km 2 ) of all ice types (A SM ), measured when the total (simultaneous) ice cover is a minimum in daily maps in mid-September, is an often-used estimate of ice surviving the summer melting that is 45% too large. Over 24 years, the A LTM decreased by 9.5 2.2% (10 a) –1 (0.27 0.06 10 6 km 2 (10 a) –1 ), which is similar to the rate of decline of A SM and about three times the rate of the annual average. The time-of-occurrence of the LTM averaged over the perennial ice pack increased by 8days from around 11 to 19 August, indicating a later ending of the melt season by about 3 days (10 a) –1 as the summer pack declines. Estimates of multi-year ice in midwinter from passive microwave observations are 17% smaller than A LTM , suggesting that the microwave algorithm does not measure all the multi-year ice. INTRODUCTION The mass of the perennial ice pack in the Arctic Ocean is determined mainly by the annual melt/growth cycle and the export of ice through the Fram Strait to the East Greenland Sea. Multi-year sea ice, which is defined as sea ice that survives the summer melting, is generally thicker and more deformed than first-year ice. Therefore, the amount of multi- year ice significantly affects both the ice pack dynamics and the heat balance of the Arctic Ocean. Variations in the heat balance and ice transport can, in turn, cause changes in the amount of ice surviving the summer melt to become or remain as multi-year ice. Consequently, the ice surviving the summer melt is a significant indicator of the state of the ice pack and of changes that may be occurring, but the amount of ice that survives the summer melting has not been well determined. Widely used indicators of ice surviving the summer melt have been the summer minimum (SM) ‘ice extent’ area and the minimum ‘actual area’ of sea ice, taking into account the open water in leads and polynyas within the pack. The ice extent is the area of the sea-ice pack with concentrations (C T ) greater than some threshold (typically C T ¼ 10–15%), and the actual area of sea ice is the spatial integral of C T over the extent of the ice pack. C T , which is the total concen- tration of all ice types (i.e. first-year and multi-year), has been derived from satellite passive-microwave observations using various algorithms (Andersen and others, 2006). Of these two parameters, the actual area of sea ice (A SM ) at the SM is more relevant for determining the amount of multi- year ice that will be present in the subsequent fall and winter seasons. However, the area of surviving ice has not been well determined, because the time of the summer minimum varies significantly from region to region over the Arctic Ocean. Although comprehensive sea-ice thickness estimates are becoming available from satellite altimetric measure- ments (Laxon and others, 2003; Kwok and others, 2004; Zwally and others, 2008), this paper focuses on the widely used measurement of sea-ice area. The SM ice area, A SM , as well as the SM ice extent, are commonly obtained from near-simultaneous (i.e. same day) satellite observations over the entire Arctic Ocean. How- ever, meteorological conditions that drive the melt–freeze cycle vary widely from region to region, as well as interannually, which means that the transitions from melting to freezing, and therefore the local minima, do not occur simultaneously over the entire ice pack. Even in late September, the ice pack is usually melting in some places while ice is growing elsewhere. Consequently, the SM method overestimates the amount of ice surviving the summer melting for two reasons: (1) where the local melt– freeze transition occurs before the SM, new first-year ice is included in the SM area, as well as the ice that actually survives the summer melt to become multi-year sea ice; (2) where the melt–freeze transition occurs after the SM, some ice that does not survive summer is included in the SM area. Consequently, the commonly used SM method over- estimates the area of ice surviving the summer melting due to melt–freeze transitions that occur either earlier or later than the summer minimum. While the annual average sea-ice cover has been declining in recent decades (from 1979 to 2002 the decline was 0.36 0.05 10 6 km 2 (10 a) –1 (3.0 0.4% (10 a) –1 ), (Cava- lieri and others, 2003)), the SM ice areas have been declining significantly faster (7.7 3% (10 a) –1 for 1979–2004 accord- ing to Stroeve and others (2005), or 9.8 1.5% (10 a) –1 for Journal of Glaciology, Vol. 54, No. 185, 2008 279
Transcript of Arctic sea ice surviving the summer melt: … sea ice surviving the summer melt: interannual...
Arctic sea ice surviving the summer melt:interannual variability and decreasing trend
H. Jay ZWALLY, Per GLOERSENCryospheric Sciences Branch, Code 614.1, NASA Goddard Space Flight Center, Greenbelt, Maryland 20771, USA
E-mail: [email protected]
ABSTRACT. Sea ice surviving the summer melt season to become multi-year ice in the Arctic Ocean isof interest because multi-year ice significantly affects the ice-thickness distribution and the dynamicsand thermodynamics of the ice pack in subsequent seasons. However, the amount of ice survivingsummer melting has not been well determined because the time of the minimum ice area varies fromregion to region. A concept of local temporal minimum (LTM) accounts for non-simultaneity of themelt–freeze transition by determining the minima ice concentrations (CLTM) on local spatial scales.CLTM are calculated for 25 km gridcells using 24 years (1979–2002) of satellite passive-microwave data.The total area of ice surviving the summer melt (ALTM) is given by spatial integration of CLTM. Over24 years, the average ALTM is 2.6�� 106 km2 (excluding �0.7� 105 km2 above 848N). In contrast,the average area (3.8� 106 km2) of all ice types (ASM), measured when the total (simultaneous) icecover is a minimum in daily maps in mid-September, is an often-used estimate of ice surviving thesummer melting that is �45% too large. Over 24 years, the ALTM decreased by 9.5� 2.2% (10 a)–1
(0.27�0.06� 106 km2 (10 a)–1), which is similar to the rate of decline of ASM and about three timesthe rate of the annual average. The time-of-occurrence of the LTM averaged over the perennial icepack increased by 8days from around 11 to 19 August, indicating a later ending of the melt season byabout 3 days (10 a)–1 as the summer pack declines. Estimates of multi-year ice in midwinter frompassive microwave observations are �17% smaller than ALTM, suggesting that the microwavealgorithm does not measure all the multi-year ice.
INTRODUCTION
The mass of the perennial ice pack in the Arctic Ocean isdetermined mainly by the annual melt/growth cycle and theexport of ice through the Fram Strait to the East GreenlandSea. Multi-year sea ice, which is defined as sea ice thatsurvives the summer melting, is generally thicker and moredeformed than first-year ice. Therefore, the amount of multi-year ice significantly affects both the ice pack dynamics andthe heat balance of the Arctic Ocean. Variations in the heatbalance and ice transport can, in turn, cause changes in theamount of ice surviving the summer melt to become orremain as multi-year ice. Consequently, the ice survivingthe summer melt is a significant indicator of the state of theice pack and of changes that may be occurring, but theamount of ice that survives the summer melting has notbeen well determined.
Widely used indicators of ice surviving the summer melthave been the summer minimum (SM) ‘ice extent’ area andthe minimum ‘actual area’ of sea ice, taking into account theopen water in leads and polynyas within the pack. The iceextent is the area of the sea-ice pack with concentrations(CT) greater than some threshold (typically CT ¼ 10–15%),and the actual area of sea ice is the spatial integral of CT overthe extent of the ice pack. CT, which is the total concen-tration of all ice types (i.e. first-year and multi-year), hasbeen derived from satellite passive-microwave observationsusing various algorithms (Andersen and others, 2006). Ofthese two parameters, the actual area of sea ice (ASM) at theSM is more relevant for determining the amount of multi-year ice that will be present in the subsequent fall and winterseasons. However, the area of surviving ice has not beenwell determined, because the time of the summer minimum
varies significantly from region to region over the ArcticOcean. Although comprehensive sea-ice thickness estimatesare becoming available from satellite altimetric measure-ments (Laxon and others, 2003; Kwok and others, 2004;Zwally and others, 2008), this paper focuses on the widelyused measurement of sea-ice area.
The SM ice area, ASM, as well as the SM ice extent, arecommonly obtained from near-simultaneous (i.e. same day)satellite observations over the entire Arctic Ocean. How-ever, meteorological conditions that drive the melt–freezecycle vary widely from region to region, as well asinterannually, which means that the transitions from meltingto freezing, and therefore the local minima, do not occursimultaneously over the entire ice pack. Even in lateSeptember, the ice pack is usually melting in some placeswhile ice is growing elsewhere. Consequently, the SMmethod overestimates the amount of ice surviving thesummer melting for two reasons: (1) where the local melt–freeze transition occurs before the SM, new first-year ice isincluded in the SM area, as well as the ice that actuallysurvives the summer melt to become multi-year sea ice;(2) where the melt–freeze transition occurs after the SM,some ice that does not survive summer is included in the SMarea. Consequently, the commonly used SM method over-estimates the area of ice surviving the summer melting dueto melt–freeze transitions that occur either earlier or laterthan the summer minimum.
While the annual average sea-ice cover has been decliningin recent decades (from 1979 to 2002 the decline was�0.36�0.05� 106 km2 (10 a)–1 (3.0�0.4% (10 a)–1), (Cava-lieri and others, 2003)), the SM ice areas have been decliningsignificantly faster (7.7�3% (10 a)–1 for 1979–2004 accord-ing to Stroeve and others (2005), or 9.8�1.5% (10 a)–1 for
Journal of Glaciology, Vol. 54, No. 185, 2008 279

1979–2005 according to Comiso (2006)). Such analyses oflong-term sea-ice trends have been based on both ice extentand actual ice area, for which the long-term trends have beenvery similar even though significant interannual variations orshort-term variations occur in their ratio, i.e. average sea-iceconcentration and area of open water within the ice pack(Parkinson and others, 1999; Zwally and others, 2002).Estimates of multi-year ice concentration (CpMY) duringwinter (e.g. Cavalieri and others, 1984; Gloersen andCavalieri, 1986; Gloersen and others, 1992; Johannessenand others, 1999) have also been derived from passive-microwave measurements. Johannessen and others (1999)showed the area of multi-year ice also decreased by�7% (10 a)–1 from 1978 to 1998, which is generally consist-ent with the larger rate of decline in the SM ice area comparedwith the annual average.
An improved estimate of the area of ice surviving thesummer melt to become multi-year ice is of interest forseveral reasons: (1) to compare trends in the amount ofsurviving ice with trends in conventional SM ice cover; (2) tocharacterize the spatial patterns of the minimum iceconcentration and the timing of the minimum; (3) to providea baseline for evaluation of various methods of observingmulti-year ice during the winter; and (4) to provide data forcomparison with sea-ice models of distributions of multi-year and other ice types. Therefore, the subjects of this paperare: (1) calculation of estimates of the actual area of icesurviving the summer melt to become multi-year ice using anew method; (2) an analysis of the interannual variability ofmulti-year ice (old and newly formed) and the variability ofthe average time of occurrence of the melt–freeze transition;and (3) analysis of the relationship of estimates from ourmethod to the commonly used SM method and estimates ofmulti-year ice the following winter.
To estimate the area of ice that survives the summer melt,we use the concept of local temporal minimum (LTM) iceconcentration to account for spatial variations in the timingof the melt–freeze transition (Gloersen and others, 1992).We use smoothed time series of CLTM on 25 km grids tocapture the time of transition from predominately melting tofreezing on local spatial scales and estimate the area of icesurviving at the transition in each gridcell. The total area ofice surviving the summer melt (ALTM) is given by spatialintegration of CLTM. We discuss various physical factors thatmay affect our estimates such as ice convergence/diver-gence, advection and summer melt ponds.
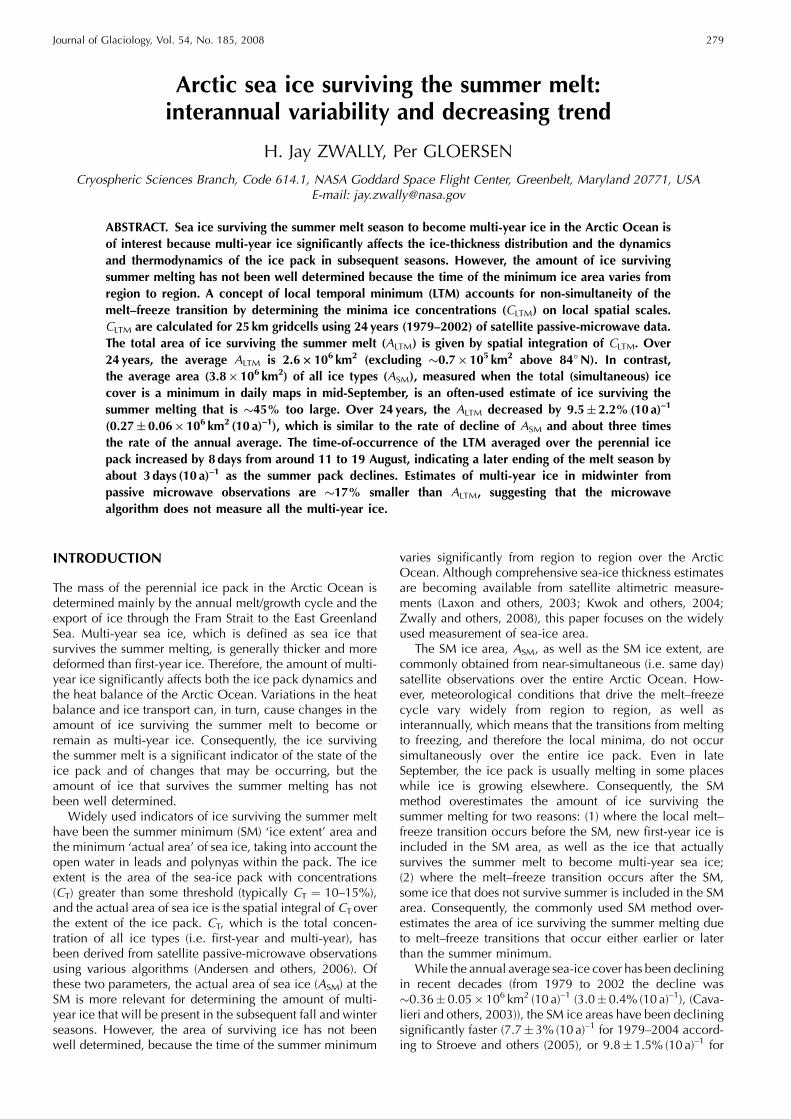
SEA-ICE CONCENTRATION MAPPINGFigure 1 shows the mapped distributions of CT for 24 years(1979–2002) for the day near the end of the melt seasonwhen the total integrated area of ice is at the SM, whichvaries from 5 September in 1987 to 1 October in 1995. Thedata are from the Nimbus 7 scanning multichannel micro-wave radiometer (SMMR) and Special Sensor Microwave/Imager (SSM/I) (communication from User Services NSIDC(US National Snow and Ice Data Center)/CIRES (CooperativeInstitute for Research in Environmental Sciences), [email protected]). The NASA Team algorithm (Cavalieri and others,1984, 1991, 1995; Gloersen and Cavalieri, 1986) is used toderive CT and CpMY. Although a variety of different algo-rithms have been used to derive CT, all are essentially basedon large differences in the microwave-emission properties ofsea ice and open water. Although there are quantitative
differences (Andersen and others, 2006) among algorithms,the essential characteristic of our results should bereproducible using other CT algorithms. Daily sequences ofsuch maps show that the ice edge continues to retreat afterthe SM in some regions, while the edge is advancing in otherareas. Within the pack, the areas of high concentration (i.e.>90%) shown in Figure 1 vary with time as new ice isformed in various regions.
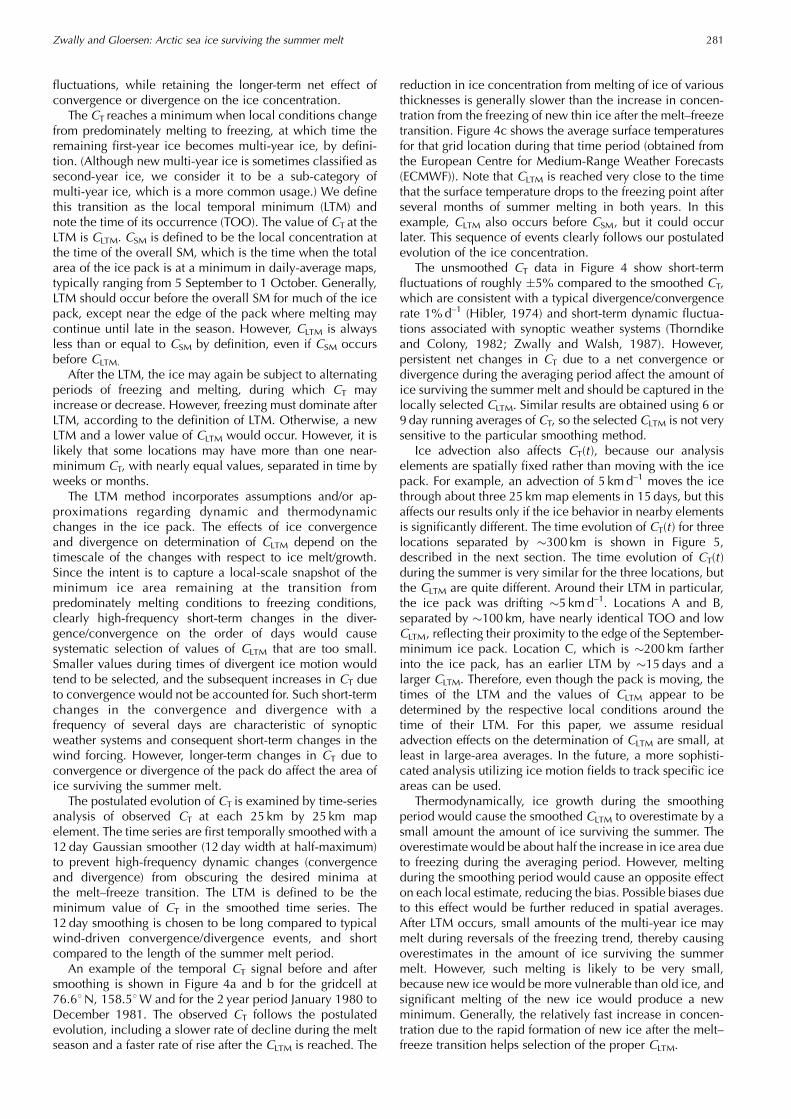
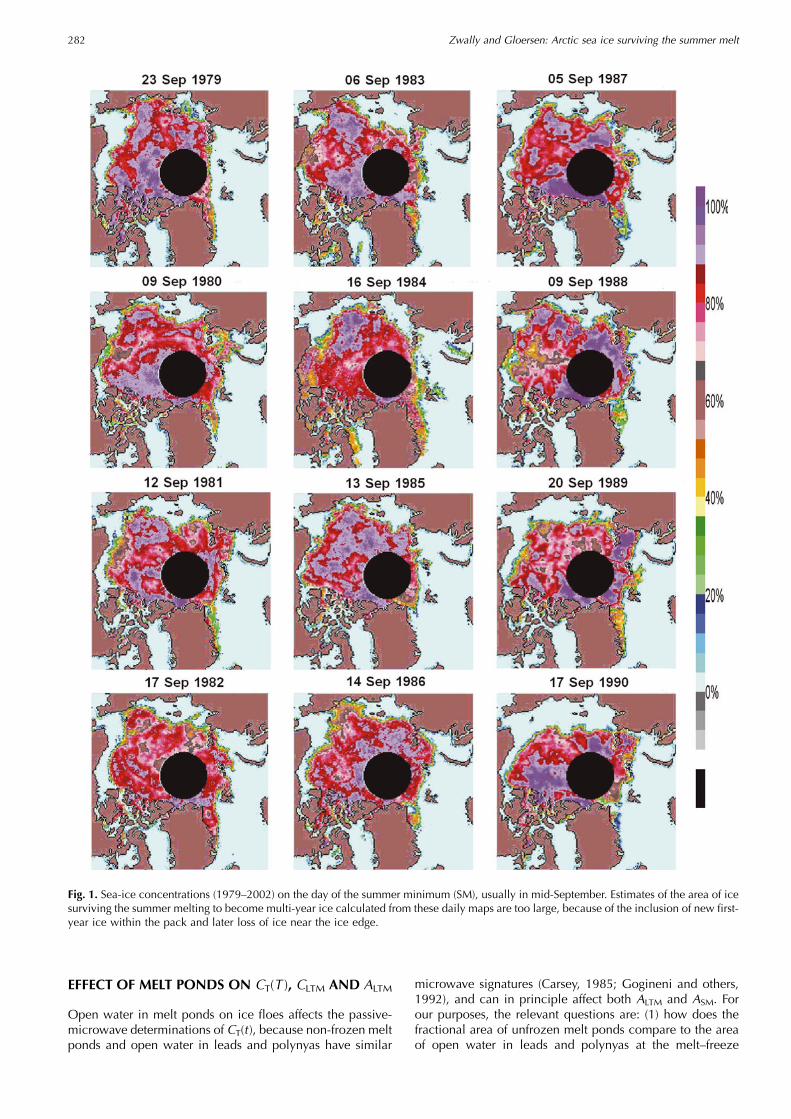
Figure 2 shows the corresponding monthly averagedmaps of multi-year ice, CpMY, in the following Februaries,also derived using the NASA Team algorithm. During thewinters of this period, the measured total ice area (first-yearand multi-year) in the Arctic Ocean is �6.9�106 km2, andthe estimated multi-year ice area (ApMY, the integral of CpMY)is �3.0� 106 km2 within the multi-year ice pack designatedby CpMY � 20%. Based on these estimates, the first-year iceconcentration is �32%, the open water is <2% and theaverage CpMY within the multi-year ice pack in winter wouldbe �66%. However, a peculiarity of the estimates of ApMY isthe tendency to increase during winter (e.g. Gloersen andothers, 1992; Johannessen and others, 1999), which iscontrary to the definition of multi-year ice, suggesting thatthe microwave signature of multi-year ice continues todevelop during fall and early winter and may not provide ameasure of all the multi-year ice. Therefore, a residualdiscrepancy between the ice surviving the summer melt tobecome multi-year ice and the wintertime estimates ofmulti-year ice from passive-microwave algorithms should beexpected. Although we provide a measure of this residualdiscrepancy, examination of deficiencies in passive-micro-wave algorithms for multi-year ice is beyond the scope ofthis paper.
CONCEPT OF LOCAL TEMPORAL MINIMUM (LTM)ICE CONCENTRATIONSFigure 3 illustrates our postulated evolution of ice typesduring the summer melt season and the subsequent freezingperiod. We consider local values of CT(t ) and CMY(t ) in area-elements of 25 km by 25 km. CMY(t ) indicates the true areaof multi-year ice to distinguish it from the passive-micro-wave estimate CpMY(t ). The 25 km scale is appropriate forthis analysis, because it is larger than the size of ice floes andwidths of leads, and sufficiently large to contain a locallyrepresentative set of ice types and open-water areas. Also,the environmental conditions (air temperature, radiation andwind fields) that force the ice melt/growth and the icedynamics should be spatially coherent over areas of this sizeor larger.
After melting commences in spring, the area of openwater increases as ice melts. The area of first-year ice shoulddecrease faster than the area of the generally thicker multi-year ice. During the melt period, the rate of decrease in CT
varies with time as the forcing of the melting varies. Asfreezing and melting conditions alternate, the area of first-year ice may either increase or decrease, but the effect on thearea of multi-year ice should be a decrease until thetransition from predominately melting to freezing occursfor the season. Net convergence or divergence of the icepack also causes both CT and CMY to increase or decreasewith time. Short-term CT fluctuations, caused by ice con-vergence and divergence from short-term changes in thewind forcing, are not depicted in the figure. Our methoduses data smoothing to average over such higher-frequency
Zwally and Gloersen: Arctic sea ice surviving the summer melt280
fluctuations, while retaining the longer-term net effect ofconvergence or divergence on the ice concentration.
The CT reaches a minimum when local conditions changefrom predominately melting to freezing, at which time theremaining first-year ice becomes multi-year ice, by defini-tion. (Although new multi-year ice is sometimes classified assecond-year ice, we consider it to be a sub-category ofmulti-year ice, which is a more common usage.) We definethis transition as the local temporal minimum (LTM) andnote the time of its occurrence (TOO). The value of CT at theLTM is CLTM. CSM is defined to be the local concentration atthe time of the overall SM, which is the time when the totalarea of the ice pack is at a minimum in daily-average maps,typically ranging from 5 September to 1 October. Generally,LTM should occur before the overall SM for much of the icepack, except near the edge of the pack where melting maycontinue until late in the season. However, CLTM is alwaysless than or equal to CSM by definition, even if CSM occursbefore CLTM.
After the LTM, the ice may again be subject to alternatingperiods of freezing and melting, during which CT mayincrease or decrease. However, freezing must dominate afterLTM, according to the definition of LTM. Otherwise, a newLTM and a lower value of CLTM would occur. However, it islikely that some locations may have more than one near-minimum CT, with nearly equal values, separated in time byweeks or months.
The LTM method incorporates assumptions and/or ap-proximations regarding dynamic and thermodynamicchanges in the ice pack. The effects of ice convergenceand divergence on determination of CLTM depend on thetimescale of the changes with respect to ice melt/growth.Since the intent is to capture a local-scale snapshot of theminimum ice area remaining at the transition frompredominately melting conditions to freezing conditions,clearly high-frequency short-term changes in the diver-gence/convergence on the order of days would causesystematic selection of values of CLTM that are too small.Smaller values during times of divergent ice motion wouldtend to be selected, and the subsequent increases in CT dueto convergence would not be accounted for. Such short-termchanges in the convergence and divergence with afrequency of several days are characteristic of synopticweather systems and consequent short-term changes in thewind forcing. However, longer-term changes in CT due toconvergence or divergence of the pack do affect the area ofice surviving the summer melt.
The postulated evolution of CT is examined by time-seriesanalysis of observed CT at each 25 km by 25 km mapelement. The time series are first temporally smoothed with a12 day Gaussian smoother (12 day width at half-maximum)to prevent high-frequency dynamic changes (convergenceand divergence) from obscuring the desired minima atthe melt–freeze transition. The LTM is defined to be theminimum value of CT in the smoothed time series. The12 day smoothing is chosen to be long compared to typicalwind-driven convergence/divergence events, and shortcompared to the length of the summer melt period.
An example of the temporal CT signal before and aftersmoothing is shown in Figure 4a and b for the gridcell at76.68N, 158.58W and for the 2 year period January 1980 toDecember 1981. The observed CT follows the postulatedevolution, including a slower rate of decline during the meltseason and a faster rate of rise after the CLTM is reached. The
reduction in ice concentration from melting of ice of variousthicknesses is generally slower than the increase in concen-tration from the freezing of new thin ice after the melt–freezetransition. Figure 4c shows the average surface temperaturesfor that grid location during that time period (obtained fromthe European Centre for Medium-Range Weather Forecasts(ECMWF)). Note that CLTM is reached very close to the timethat the surface temperature drops to the freezing point afterseveral months of summer melting in both years. In thisexample, CLTM also occurs before CSM, but it could occurlater. This sequence of events clearly follows our postulatedevolution of the ice concentration.
The unsmoothed CT data in Figure 4 show short-termfluctuations of roughly �5% compared to the smoothed CT,which are consistent with a typical divergence/convergencerate 1%d–1 (Hibler, 1974) and short-term dynamic fluctua-tions associated with synoptic weather systems (Thorndikeand Colony, 1982; Zwally and Walsh, 1987). However,persistent net changes in CT due to a net convergence ordivergence during the averaging period affect the amount ofice surviving the summer melt and should be captured in thelocally selected CLTM. Similar results are obtained using 6 or9 day running averages of CT, so the selected CLTM is not verysensitive to the particular smoothing method.
Ice advection also affects CT(t ), because our analysiselements are spatially fixed rather than moving with the icepack. For example, an advection of 5 kmd–1 moves the icethrough about three 25 km map elements in 15 days, but thisaffects our results only if the ice behavior in nearby elementsis significantly different. The time evolution of CT(t ) for threelocations separated by �300 km is shown in Figure 5,described in the next section. The time evolution of CT(t )during the summer is very similar for the three locations, butthe CLTM are quite different. Around their LTM in particular,the ice pack was drifting �5 kmd–1. Locations A and B,separated by �100 km, have nearly identical TOO and lowCLTM, reflecting their proximity to the edge of the September-minimum ice pack. Location C, which is �200 km fartherinto the ice pack, has an earlier LTM by �15 days and alarger CLTM. Therefore, even though the pack is moving, thetimes of the LTM and the values of CLTM appear to bedetermined by the respective local conditions around thetime of their LTM. For this paper, we assume residualadvection effects on the determination of CLTM are small, atleast in large-area averages. In the future, a more sophisti-cated analysis utilizing ice motion fields to track specific iceareas can be used.
Thermodynamically, ice growth during the smoothingperiod would cause the smoothed CLTM to overestimate by asmall amount the amount of ice surviving the summer. Theoverestimate would be about half the increase in ice area dueto freezing during the averaging period. However, meltingduring the smoothing period would cause an opposite effecton each local estimate, reducing the bias. Possible biases dueto this effect would be further reduced in spatial averages.After LTM occurs, small amounts of the multi-year ice maymelt during reversals of the freezing trend, thereby causingoverestimates in the amount of ice surviving the summermelt. However, such melting is likely to be very small,because new ice would be more vulnerable than old ice, andsignificant melting of the new ice would produce a newminimum. Generally, the relatively fast increase in concen-tration due to the rapid formation of new ice after the melt–freeze transition helps selection of the proper CLTM.
Zwally and Gloersen: Arctic sea ice surviving the summer melt 281
EFFECT OF MELT PONDS ON CT(T ), CLTM AND ALTM
Open water in melt ponds on ice floes affects the passive-microwave determinations of CT(t ), because non-frozen meltponds and open water in leads and polynyas have similar
microwave signatures (Carsey, 1985; Gogineni and others,1992), and can in principle affect both ALTM and ASM. Forour purposes, the relevant questions are: (1) how does thefractional area of unfrozen melt ponds compare to the areaof open water in leads and polynyas at the melt–freeze
Fig. 1. Sea-ice concentrations (1979–2002) on the day of the summer minimum (SM), usually in mid-September. Estimates of the area of icesurviving the summer melting to become multi-year ice calculated from these daily maps are too large, because of the inclusion of new first-year ice within the pack and later loss of ice near the ice edge.
Zwally and Gloersen: Arctic sea ice surviving the summer melt282

transition in late summer when CLTM is selected? and (2) isthe area of melt ponds plus the area of leads and polynyasover the 25 km cells at some time prior to the melt–freezetransition greater than the area of open water in leads andpolynyas at the melt–freeze transition?
Firstly, the areal coverage of unfrozen melt ponds tends topeak in early to mid-summer and decline by the TOO of the
melt–freeze transition when CLTM is selected. As shownbelow (Figs 8 and 9), the average TOO over the ice packranges from about 6 to 28 August. In the Beaufort Sea, meltponds typically cover 20–50% of the floes in early July, anddecrease to �12% coverage by 3 August (fig. 12 in Fettererand Untersteiner, 1998). Also, as the pond coverage on thickice decreases with time, the coverage on thin ice increases
Fig. 1. (continued)
Zwally and Gloersen: Arctic sea ice surviving the summer melt 283

with time, leading to the disappearance of thin ice at the endof the summer (Fetterer and Untersteiner, 1998). Perovichand others (2002) show similar results in the vicinity of theSHEBA (Surface Heat Budget of the Arctic Ocean) site in theBeaufort Sea, with melt ponds covering �20% of the areafrom 18 June until 7 August 1998, after which the pond area
dropped sharply to 2% by 22 August. Secondly, while thearea of melt ponds is decreasing, the open water in leadsand polynyas is generally increasing as more sea ice meltsand the ice pack thins during the summer melting (e.g.Thorndike and others, 1975; Perovich and others, 2002).Perovich and others (2002) show a lead area of 5% on
Fig. 2.Monthly averaged multi-year sea-ice concentrations (CpMY) in February 1979–2002, from a passive-microwave algorithm that appearsto underestimate the true area of multi-year ice.
Zwally and Gloersen: Arctic sea ice surviving the summer melt284
25 July rising to 18% on 7 and 22 August. Thirdly, meltponds have lower salinity than ocean water and thereforefreeze before the open ocean water in leads and polynyas, asshown for example in figure 3e of Perovich and others(2002), where the ponds are mostly covered with ice whilethe leads and polynyas remain as open water. As melt ponds
freeze, their emissivity quickly becomes similar to that ofcompletely frozen ponds (Gogineni and others, 1992).
The evolution of CT(t ) in the vicinity of the measurementsof melt ponds by Perovich and others (2002) is shown inFigure 5. At location A (77824.2’N, 166831.2’W) on 15 June,the melt-pond fraction was 4.4% measured along a box of
Fig. 2. (continued)
Zwally and Gloersen: Arctic sea ice surviving the summer melt 285

50 km flight-lines and it increased to 19.4% in a nearbyvicinity on 18 June. The corresponding lead fraction was3.1% for both periods, giving combined water fractions of7.5% and 22.5% on the respective dates from the fieldmeasurements. However, CT(t ) on 18 June around location Awas 93%, indicating a microwave sensing of only 7% openwater over an area of 25 km by 25 km. This differencebetween the field and the satellite water fractions on 18 Junecould be due to sensing of somewhat different locations;CT(t ) did drop to 85% during the following 25 days.However, after 12 July, CT(t ) dropped much below the77% that could be explained by the �23% pond and leadfraction indicated by the field measurements. During thisperiod, the location of the field measurements was driftingnorthward, reaching location B (78815.9’N, 165856.3’W)by 22 August when the pond fraction had dropped to 2.0%and the lead fraction had risen to 18.2%. However, the CT(t )at location B on 22 August had dropped to 50%, indicating50% total water fraction compared to the 20.2% suggestedby the field measurements. Therefore, the satellite CT(t )indicates a significantly lower sea-ice concentration andmore open ocean water at this location near the end of thesummer than could possibly be explained by the effect ofmelt ponds on the satellite-based CT(t ).
Furthermore, and even more importantly, the CLTM forthese locations, A and B, are not reached until �30 days aftermost of the melt ponds have frozen. Locations A and B arealso relatively close to the edge of the summer ice pack,which explains their relatively low CLTM values of 11% and40%, respectively. By 4 October the site of the field
measurements had drifted farther north to location C(8088.0’N, 166816.0’W) where CT(t ) had increased to 83%from its CLTM minimum of 63% on 6 September. This CLTM
occurred before the SM on 17 September when CSM was
Fig. 3. Schematic of the evolution of first-year and multi-year iceconcentrations during the summer melt season for a typical singlemap element. The local transition from predominately melting tofreezing conditions is defined as the local temporal minimum(LTM), at which time the remaining first-year ice becomes newmulti-year ice along with the multi-year ice from the previous year.The concentration (CLTM) at the LTM represents the ice surviving thesummer melt season. Most LTM, but not all, occur before the timeof the overall summer minimum of all ice types over the total icepack. In this case, CSM is greater than CLTM because it includessome new first-year ice. High-frequency concentration variationscaused by short-term fluctuations in convergence and divergence ofthe ice pack are not depicted.
Fig. 4. Evolution of the sea-ice concentration over a 2 year period ina 25 km map element at 76.68N, 158.58W. (a) Observed iceconcentrations, CT(t ). (b) Observed ice concentrations smoothedwith a 12 day Gaussian. (c) Surface air temperatures at that elementfrom ECMWF. The times of the CLTM and SM concentration (CSM) atthis location are, respectively, 5 and 9 September in 1980 and28 August and 12 September in 1981. Note that the LTM occursnear the end of the melting period, when the open water in leadsand polynyas begins to refreeze, as indicated by the air tempera-tures, and the SM occurs after the LTM.
Zwally and Gloersen: Arctic sea ice surviving the summer melt286
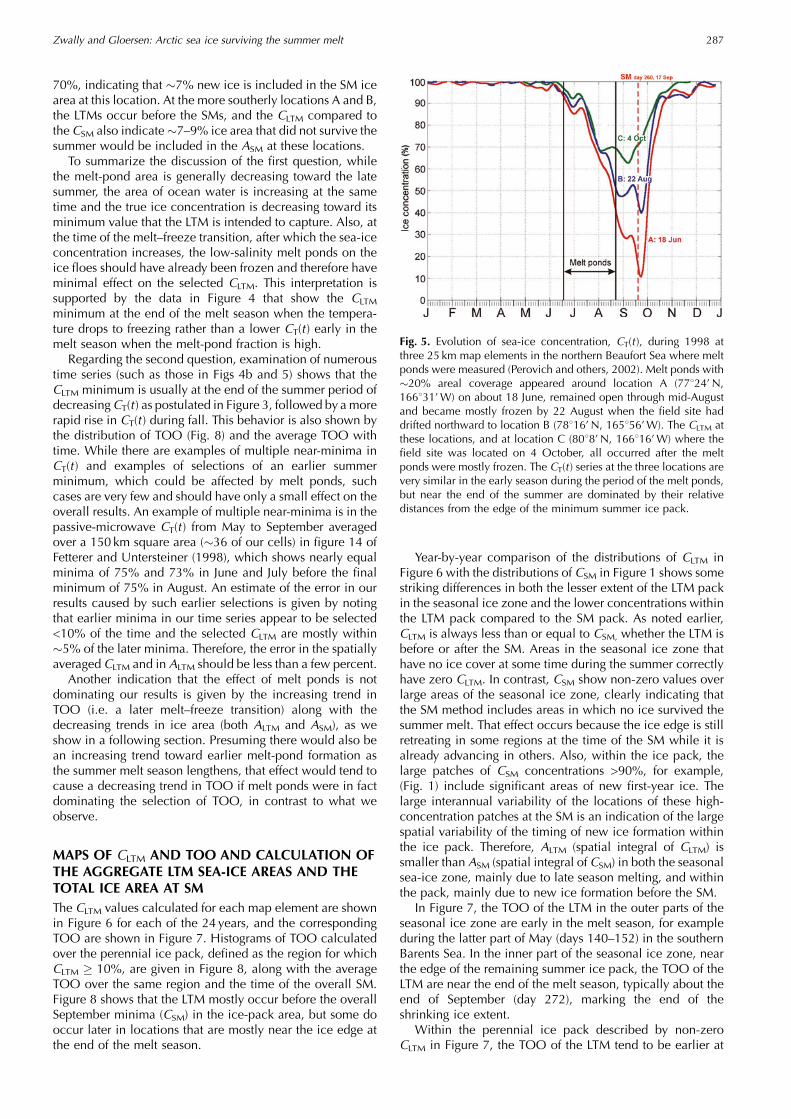
70%, indicating that �7% new ice is included in the SM icearea at this location. At the more southerly locations A and B,the LTMs occur before the SMs, and the CLTM compared tothe CSM also indicate�7–9% ice area that did not survive thesummer would be included in the ASM at these locations.
To summarize the discussion of the first question, whilethe melt-pond area is generally decreasing toward the latesummer, the area of ocean water is increasing at the sametime and the true ice concentration is decreasing toward itsminimum value that the LTM is intended to capture. Also, atthe time of the melt–freeze transition, after which the sea-iceconcentration increases, the low-salinity melt ponds on theice floes should have already been frozen and therefore haveminimal effect on the selected CLTM. This interpretation issupported by the data in Figure 4 that show the CLTM
minimum at the end of the melt season when the tempera-ture drops to freezing rather than a lower CT(t ) early in themelt season when the melt-pond fraction is high.
Regarding the second question, examination of numeroustime series (such as those in Figs 4b and 5) shows that theCLTM minimum is usually at the end of the summer period ofdecreasingCT(t ) as postulated in Figure 3, followed by amorerapid rise in CT(t ) during fall. This behavior is also shown bythe distribution of TOO (Fig. 8) and the average TOO withtime. While there are examples of multiple near-minima inCT(t ) and examples of selections of an earlier summerminimum, which could be affected by melt ponds, suchcases are very few and should have only a small effect on theoverall results. An example of multiple near-minima is in thepassive-microwave CT(t ) from May to September averagedover a 150 km square area (�36 of our cells) in figure 14 ofFetterer and Untersteiner (1998), which shows nearly equalminima of 75% and 73% in June and July before the finalminimum of 75% in August. An estimate of the error in ourresults caused by such earlier selections is given by notingthat earlier minima in our time series appear to be selected<10% of the time and the selected CLTM are mostly within�5% of the later minima. Therefore, the error in the spatiallyaveraged CLTM and in ALTM should be less than a few percent.
Another indication that the effect of melt ponds is notdominating our results is given by the increasing trend inTOO (i.e. a later melt–freeze transition) along with thedecreasing trends in ice area (both ALTM and ASM), as weshow in a following section. Presuming there would also bean increasing trend toward earlier melt-pond formation asthe summer melt season lengthens, that effect would tend tocause a decreasing trend in TOO if melt ponds were in factdominating the selection of TOO, in contrast to what weobserve.
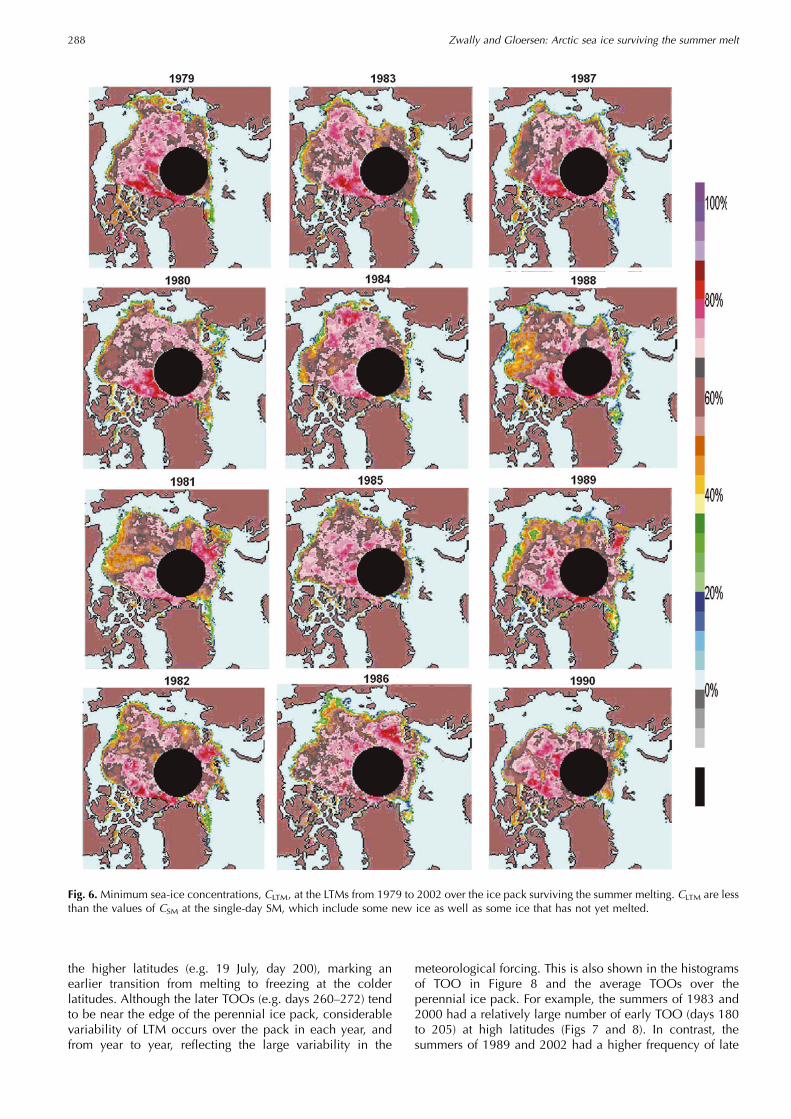
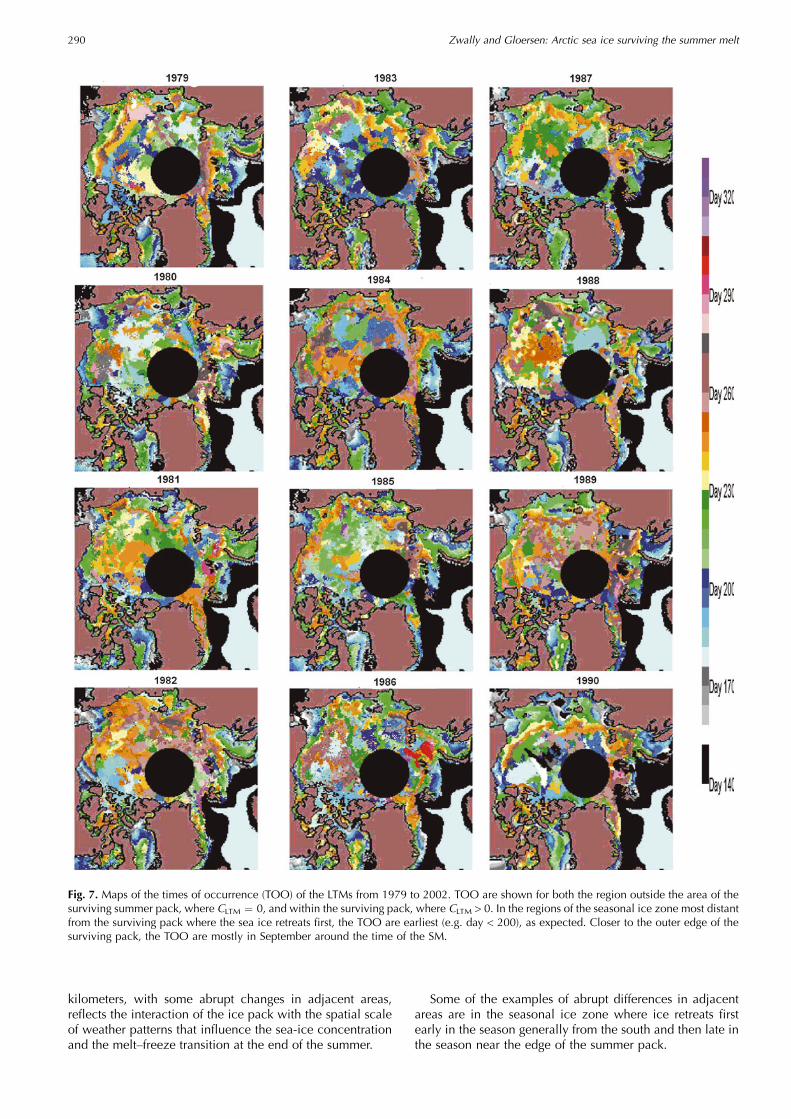
MAPS OF CLTM AND TOO AND CALCULATION OFTHE AGGREGATE LTM SEA-ICE AREAS AND THETOTAL ICE AREA AT SMThe CLTM values calculated for each map element are shownin Figure 6 for each of the 24 years, and the correspondingTOO are shown in Figure 7. Histograms of TOO calculatedover the perennial ice pack, defined as the region for whichCLTM � 10%, are given in Figure 8, along with the averageTOO over the same region and the time of the overall SM.Figure 8 shows that the LTM mostly occur before the overallSeptember minima (CSM) in the ice-pack area, but some dooccur later in locations that are mostly near the ice edge atthe end of the melt season.
Year-by-year comparison of the distributions of CLTM inFigure 6 with the distributions of CSM in Figure 1 shows somestriking differences in both the lesser extent of the LTM packin the seasonal ice zone and the lower concentrations withinthe LTM pack compared to the SM pack. As noted earlier,CLTM is always less than or equal to CSM, whether the LTM isbefore or after the SM. Areas in the seasonal ice zone thathave no ice cover at some time during the summer correctlyhave zero CLTM. In contrast, CSM show non-zero values overlarge areas of the seasonal ice zone, clearly indicating thatthe SM method includes areas in which no ice survived thesummer melt. That effect occurs because the ice edge is stillretreating in some regions at the time of the SM while it isalready advancing in others. Also, within the ice pack, thelarge patches of CSM concentrations >90%, for example,(Fig. 1) include significant areas of new first-year ice. Thelarge interannual variability of the locations of these high-concentration patches at the SM is an indication of the largespatial variability of the timing of new ice formation withinthe ice pack. Therefore, ALTM (spatial integral of CLTM) issmaller than ASM (spatial integral of CSM) in both the seasonalsea-ice zone, mainly due to late season melting, and withinthe pack, mainly due to new ice formation before the SM.
In Figure 7, the TOO of the LTM in the outer parts of theseasonal ice zone are early in the melt season, for exampleduring the latter part of May (days 140–152) in the southernBarents Sea. In the inner part of the seasonal ice zone, nearthe edge of the remaining summer ice pack, the TOO of theLTM are near the end of the melt season, typically about theend of September (day 272), marking the end of theshrinking ice extent.
Within the perennial ice pack described by non-zeroCLTM in Figure 7, the TOO of the LTM tend to be earlier at
Fig. 5. Evolution of sea-ice concentration, CT(t ), during 1998 atthree 25 km map elements in the northern Beaufort Sea where meltponds were measured (Perovich and others, 2002). Melt ponds with�20% areal coverage appeared around location A (77824’N,166831’W) on about 18 June, remained open through mid-Augustand became mostly frozen by 22 August when the field site haddrifted northward to location B (78816’N, 165856’W). The CLTM atthese locations, and at location C (8088’N, 166816’W) where thefield site was located on 4 October, all occurred after the meltponds were mostly frozen. The CT(t ) series at the three locations arevery similar in the early season during the period of the melt ponds,but near the end of the summer are dominated by their relativedistances from the edge of the minimum summer ice pack.
Zwally and Gloersen: Arctic sea ice surviving the summer melt 287
the higher latitudes (e.g. 19 July, day 200), marking anearlier transition from melting to freezing at the colderlatitudes. Although the later TOOs (e.g. days 260–272) tendto be near the edge of the perennial ice pack, considerablevariability of LTM occurs over the pack in each year, andfrom year to year, reflecting the large variability in the
meteorological forcing. This is also shown in the histogramsof TOO in Figure 8 and the average TOOs over theperennial ice pack. For example, the summers of 1983 and2000 had a relatively large number of early TOO (days 180to 205) at high latitudes (Figs 7 and 8). In contrast, thesummers of 1989 and 2002 had a higher frequency of late
Fig. 6. Minimum sea-ice concentrations, CLTM, at the LTMs from 1979 to 2002 over the ice pack surviving the summer melting. CLTM are lessthan the values of CSM at the single-day SM, which include some new ice as well as some ice that has not yet melted.
Zwally and Gloersen: Arctic sea ice surviving the summer melt288

TOO (around day 260) and the latest average TOO of28 August (day 240).
Contiguous map elements with the same color have TOOof LTM values within 6 days. These areas with similar TOOare typically several hundred kilometers across, which isabout ten times the size of the map elements for which the
CLTM are calculated, indicating spatial coherence of the TOOpatterns. In some cases, adjoining areas have TOO valuesthat are similar and others are abruptly different. Althoughone might expect the pattern of TOO to be more smoothlyvarying over the ice pack, we believe the observed spatialcoherence of the TOO, on the scale of several hundred
Fig. 6. (continued)
Zwally and Gloersen: Arctic sea ice surviving the summer melt 289
kilometers, with some abrupt changes in adjacent areas,reflects the interaction of the ice pack with the spatial scaleof weather patterns that influence the sea-ice concentrationand the melt–freeze transition at the end of the summer.
Some of the examples of abrupt differences in adjacentareas are in the seasonal ice zone where ice retreats firstearly in the season generally from the south and then late inthe season near the edge of the summer pack.
Fig. 7. Maps of the times of occurrence (TOO) of the LTMs from 1979 to 2002. TOO are shown for both the region outside the area of thesurviving summer pack, where CLTM ¼ 0, and within the surviving pack, where CLTM > 0. In the regions of the seasonal ice zone most distantfrom the surviving pack where the sea ice retreats first, the TOO are earliest (e.g. day < 200), as expected. Closer to the outer edge of thesurviving pack, the TOO are mostly in September around the time of the SM.
Zwally and Gloersen: Arctic sea ice surviving the summer melt290
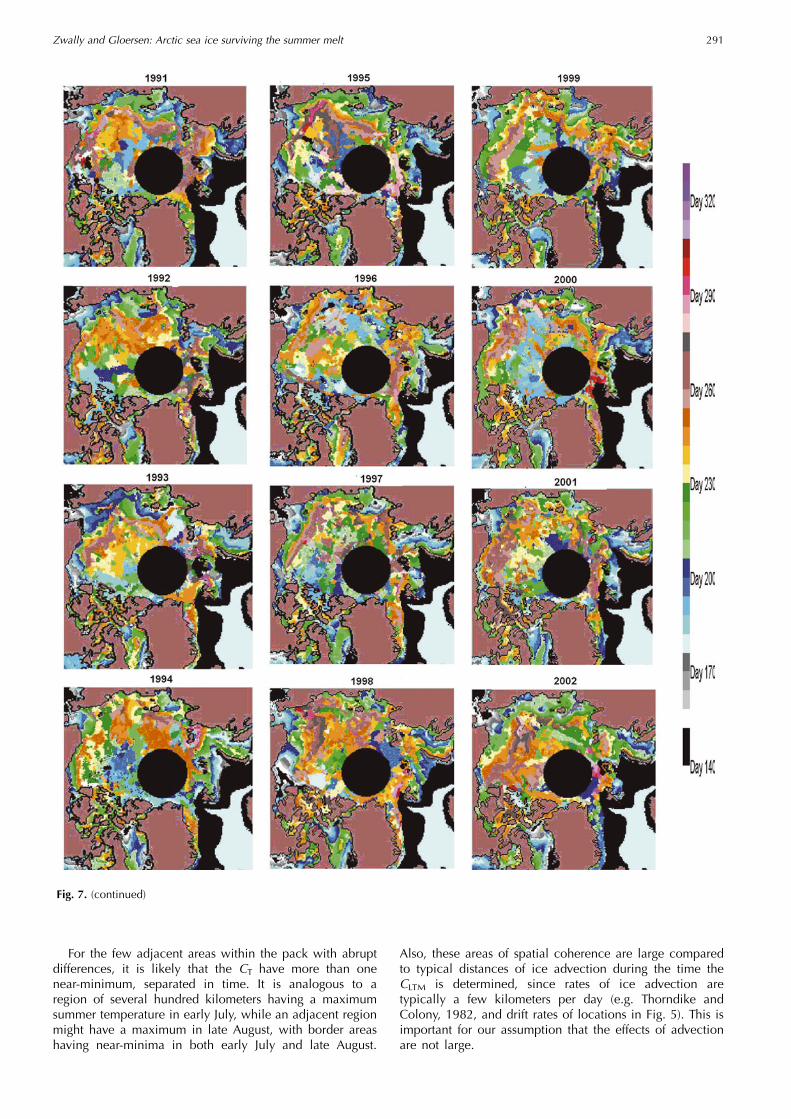
For the few adjacent areas within the pack with abruptdifferences, it is likely that the CT have more than onenear-minimum, separated in time. It is analogous to aregion of several hundred kilometers having a maximumsummer temperature in early July, while an adjacent regionmight have a maximum in late August, with border areashaving near-minima in both early July and late August.
Also, these areas of spatial coherence are large comparedto typical distances of ice advection during the time theCLTM is determined, since rates of ice advection aretypically a few kilometers per day (e.g. Thorndike andColony, 1982, and drift rates of locations in Fig. 5). This isimportant for our assumption that the effects of advectionare not large.
Fig. 7. (continued)
Zwally and Gloersen: Arctic sea ice surviving the summer melt 291

DISCUSSION OF 24YEAR RECORD OF AVERAGETOO, TOTAL AGGREGATE LTM SEA-ICE AREA ANDSM SEA-ICE AREA
Over the 24 year span, the average TOO (Fig. 9) varied by32 days from 6 August (day 218) in 1990 to 28 August
(day 240) in 1989 and 2002, whereas the time of the overallminimum (Fig. 1) varied slightly less, by 26 days, from5 September (day 248) in 1987 to 1 October (day 274) in1995. The average TOO always preceded the time of theoverall minimum (Fig. 8).
The 24 year record of CLTM varies markedly from year to
Fig. 8. Histograms of the times of occurrence (TOO) of the LTMs from 1979 to 2002 and the average TOO for the region within the ice packsurviving the summer melt (i.e. where CLTM � 10%). The average TOO generally precedes the time of the overall summer minimum,because the melt–freeze transition tends to occur earlier at locations within the pack than it does at the edges of the pack.
Zwally and Gloersen: Arctic sea ice surviving the summer melt292
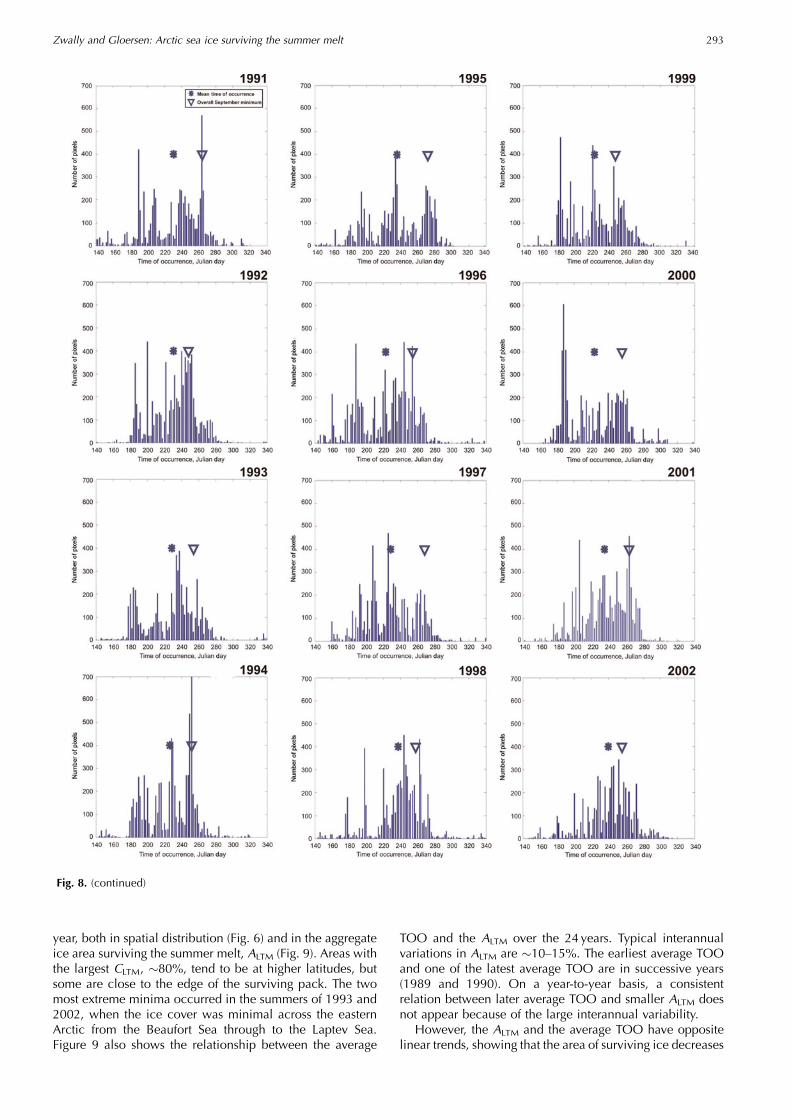
year, both in spatial distribution (Fig. 6) and in the aggregateice area surviving the summer melt, ALTM (Fig. 9). Areas withthe largest CLTM, �80%, tend to be at higher latitudes, butsome are close to the edge of the surviving pack. The twomost extreme minima occurred in the summers of 1993 and2002, when the ice cover was minimal across the easternArctic from the Beaufort Sea through to the Laptev Sea.Figure 9 also shows the relationship between the average
TOO and the ALTM over the 24 years. Typical interannualvariations in ALTM are �10–15%. The earliest average TOOand one of the latest average TOO are in successive years(1989 and 1990). On a year-to-year basis, a consistentrelation between later average TOO and smaller ALTM doesnot appear because of the large interannual variability.
However, the ALTM and the average TOO have oppositelinear trends, showing that the area of surviving ice decreases
Fig. 8. (continued)
Zwally and Gloersen: Arctic sea ice surviving the summer melt 293

as the TOO becomes later in the season. The ALTM declinedby 0.27� 106 km2 (10 a)–1 (9.5�2.2% (10 a)–1) which issimilar to the 8.9�2.0% (10 a)–1 in the overall summerminimum (Fig. 10) and previous values (7.7�3% (10 a)–1:Stroeve and others, 2005; 9.8�1.5% (10 a)–1: Comiso,2006). The average TOO over the perennial ice packincreased by 8 days from around 11 to 19 August, indicatinga later ending of the melt season by �3 days (10 a)–1, onaverage, as the ALTM declined.
Figure 10 shows the ALTM from Figure 9, along with asimilar calculation for those areas for which CLTM � 20%.The two ALTM differ by <2%, indicating a sharp boundary inthe LTM ice pack at the end of summer. Also shown are theareas at the overall summer minimum (ASM) and the totalmulti-year ice areas (ApMY) for the following February ofeach year calculated for all CpMY and for CpMY � 20%. The20% limit is used to depict the extremity of the Arctic multi-year ice pack (e.g. Gloersen and others, 1992), because itgives a sharper edge in the map. The two estimates of multi-year areas in winter differ by 0.45�106 km2, on average. Incontrast, the small difference in the corresponding two ALTM
is consistent with a spreading of the multi-year ice near theedge of the multi-year ice pack between the end of the meltseason and midwinter, as can be seen by the comparison ofgradients of C, CpMYand CLTM and in Figures 1, 2 and 6. Theresidual difference between ALTM and ApMY is 0.45�106 km2, indicating that the ApMY from passive microwavemeasures �83% of the multi-year ice area, which is asubstantially smaller difference than previously suggested bycomparison with ASM (e.g. Comiso, 1990). Other algorithmsfor the passive microwave might improve the measurementof the multi-year ice; for instance, Johannessen and others(1999) suggested a smaller difference between the overallSeptember minimum and the ApMY the following winterfrom the NORSEX sea-ice algorithm.
Over 24 years, the average ALTM is 2.6�106 km2 (ex-cluding �0.7�105 km2 above 848N), which is substantiallyless than the average ASM of 3.8�106 km2. Although ASM
has often been used as the best estimate of the area of icethat survives the summer, it is �45% too large. However,the slopes of the trend lines over 24 years are very similar
for the three parameters ALTM, ASM and ApMY. On a year-to-year basis, the ALTM and ASM are highly correlated(R ¼ 0.99), but neither are as well correlated with ApMY
(R ¼ 0.92 for both).
CONCLUSIONSThe ALTM aggregate sea-ice area calculated at the LTMprovides an improved estimate of the area of ice survivingthe summer melt season to become multi-year ice (i.e. AMY).The LTM method attempts to capture the local minima iceareas in 25 km cells at the local melt–freeze transitions thatoccur at different times in different locations over the ArcticOcean. In contrast, the widely used ASM observed at the SMoverestimates the surviving ice by �45%, because it doesnot account for the non-simultaneity of the melt–freezetransition at all locations. At locations mostly near the outeredge of the pack, the ASM includes some ice that does notsurvive the summer melting. At locations farther within thepack, the ASM typically includes some new ice that formedafter the local melt–freeze transition.
There are essentially two types of errors in estimating thearea of multi-year ice at the end of the melt season: (1) errorsin the passive-microwave determination of sea-ice concen-tration, which tend to be common to both the LTM and theSM method, and (2) errors in the method of selection of theice that survives the summer melt. We describe ourassumptions of the LTM method and attempt to estimateerrors including the effects of thermodynamics and icedynamics on the selected minimum ice concentration,which we believe are significantly lower for the LTMmethod. Spatial variation of the timing of the selection ofthe minima relative to new ice formation and the end ofmelting of old ice are critical factors in the LTM method. Infuture research, residual effects of ice advection on theselection of CLTM can be reduced by using ice velocity fieldsfor Lagrangian tracking of the CT(t ).
The ALTM declined by 0.27�106 km2 (10 a)–1 (9.5�2.2% (10 a)–1) which is similar to the declines in both ASM
and ApMY, even though the magnitudes of these threeparameters differ significantly. Also, the interannual vari-ations in ALTM and ASM are highly correlated as well ashaving the same long-term trends, showing that bothparameters are valid indicators of climatic variation in thelate-summer ice pack. Over the 24 years, the average TOOover the perennial ice pack increased by 8 days from around11 to 19 August, indicating a later ending of the melt seasonby 3days (10 a)–1 as the ALTM declined. This is consistent, forexample, with a shortening of the ice season in the seasonalsea-ice zone of the Arctic Ocean by 5 days (10 a)–1 from1979 to 1996 (Parkinson, 2000). In the last 5–10 years, therate of summer sea-ice decline of the summer sea-ice areaappears to have been accelerating, and various authors havepredicted the disappearance of most of the summer pack ina few decades, as discussed, for example, by Meier andothers (2007).
The residual difference between the ALTM and the ApMY
passive-microwave estimates of winter multi-year ice is�0.45�106 km2, indicating the passive-microwave algo-rithm we used is detecting �83% of the multi-year ice inwinter. Although the multi-year trends in ApMY and ALTM areessentially the same, their interannual variations are not aswell correlated as ALTM and ASM, suggesting that the passive-microwave signature used for CpMY might also have some
Fig. 9. Comparison of LTM sea-ice areas and average times ofoccurrence of the LTM from 1979 to 2002 showing opposite trendswith time.
Zwally and Gloersen: Arctic sea ice surviving the summer melt294

interannual variability. Our values of ALTM should provide anew improved baseline for evaluating various methods ofdetermining the area of multi-year ice within the pack, usingeither passive- or active-microwave techniques.
REFERENCESAndersen, S., R. Tonboe, S. Kern and H. Schyberg. 2006. Improved
retrieval of sea ice total concentration from spaceborne passivemicrowave observations using numerical weather predictionmodel fields: an intercomparison of nine algorithms. RemoteSens. Environ., 104(4), 374–392.
Carsey, F.D. 1985. Summer Arctic sea ice character from satellitemicrowave data. J. Geophys. Res., 90(C3), 5015–5034.
Cavalieri, D.J., P. Gloersen and W.J. Campbell. 1984. Determin-ation of sea ice parameters with the NIMBUS 7 SMMR.J. Geophys. Res., 89(D4), 5355–5369.
Cavalieri, D.J. and 6 others. 1991. Aircraft active and passivemicrowave validation of sea ice concentration from the DefenseMeteorological Satellite program special sensor microwaveimager. J. Geophys. Res., 96(C12), 21,989–22,008.
Cavalieri, D.J., K.M.S. Germain and C.T. Swift. 1995. Reduction ofweather effects in the calculation of sea-ice concentration withthe DMSP SSM/I. J. Glaciol., 41(139), 455–464.
Cavalieri, D.J., C.L. Parkinson and K.Y. Vinnikov. 2003. 30-yearsatellite record reveals contrasting Arctic and Antarctic decadalsea ice variability. Geophys. Res. Lett., 30(18), 1970. (10.1029/2003GL018031.)
Comiso, J.C. 1990. Arctic multiyear ice classification and summerice cover using passive microwave satellite data. J. Geophys.Res., 95(C8), 13,411–13,422.
Comiso, J.C. 2006. Arctic warming signals from satellite obser-vations. Weather, 61(3), 70–76.
Fetterer, F. and N. Untersteiner. 1998. Observations of melt pondson Arctic sea ice. J. Geophys. Res., 103(C11), 24,821–24,835.
Gloersen, P. and D.J. Cavalieri. 1986. Reduction of weather effectsin the calculation of sea ice concentration from microwaveradiances. J. Geophys. Res., 91(C3), 3913–3919.
Gloersen, P., W.J. Campbell, D.J. Cavalieri, J.C. Comiso, C.L. Parkin-son and H.J. Zwally. 1992. Arctic and Antarctic sea ice, 1978–1987: satellite passive-microwave observations and analysis.Washington, DC, National Aeronautics and Space Administra-tion. (NASA SP-511.)
Gogineni, S.P., R.K. Moore, T.C. Grenfell, D.G. Barber, S.A. Digbyand M. Drinkwater. 1992. The effects of freeze-up and meltprocesses on microwave signatures. In Carsey, F.D. and 7 others,eds. Microwave remote sensing of sea ice. Washington, DC,American Geophysical Union, 329–341.
Hibler, W.D., III. 1974. Differential sea-ice drift. II. Comparison ofmesoscale strain measurements to linear drift theory predictions.J. Glaciol., 13(69), 457–471.
Johannessen, O.M., E.V. Shalina and M.W. Miles. 1999. Satelliteevidence for an Arctic sea ice cover in transformation. Science,286(5446), 1937–1939.
Kwok, R., H.J. Zwally and D. Yi. 2004. ICESat observations of Arcticsea ice: a first look. Geophys. Res. Lett., 31(16), L16401.(10.1029/2004GL020309.)
Laxon, S., N. Peacock and D. Smith. 2003. High interannualvariability in sea ice thickness in the Arctic region. Nature,425(6961), 947–950.
Meier, W.N., J. Stroeve and F. Fetterer. 2007. Whither Arctic sea ice?A clear signal of decline regionally, seasonally and extendingbeyond the satellite record. Ann. Glaciol., 46, 428–434.
Parkinson, C.L. 2000. Variability of Arctic sea ice: the view fromspace, an 18-year record. Arctic, 53(4), 341–358.
Parkinson, C.L., D.J. Cavalieri, P. Gloersen, H.J. Zwally andJ.C. Comiso. 1999. Arctic sea ice extents, areas, and trends,1978–1996. J. Geophys. Res., 104(C9), 20,837–20,856.
Fig. 10. Comparison of the SM ice area (ASM), the aggregate area of ice at the local temporal minima (ALTM) and a passive-microwaveestimate of the February multi-year sea-ice area (ApMY) from 1979 to 2002 showing similar linear trends in the three parameters.
Zwally and Gloersen: Arctic sea ice surviving the summer melt 295

Perovich, D.K., W.B. Tucker, III and K.A. Ligett. 2002. Aerial obser-vations of the evolution of ice surface conditions during summer.J. Geophys. Res., 107(C10), 8048. (10.1029/2000JC000449.)
Stroeve, J.C. and 6 others. 2005. Tracking the Arctic’s shrinking icecover: another extreme September minimum in 2004. Geophys.Res. Lett., 32(4), (L04501). (10.1029/2004GL021810.)
Thorndike, A.S. and R. Colony. 1982. Sea ice motion in response togeostrophic winds. J. Geophys. Res., 87(C8), 5845–5852.
Thorndike, A.S., D.A. Rothrock, G.A. Maykut and R. Colony. 1975.The thickness distribution of sea ice. J. Geophys. Res., 80(33),4501–4513.
Zwally, H.J. and J.E. Walsh. 1987. Comparison of observedand modeled ice motion in the Arctic Ocean. Ann. Glaciol., 9,136–144.
Zwally, H.J., J.C. Comiso, C.L. Parkinson, D.J. Cavalieri andP. Gloersen. 2002. Variability of Antarctic sea ice 1979–1998.J. Geophys. Res., 107(C5), 3041. (10.1029/2000JC000733.)
Zwally, H.J., R. Yi, R. Kwok and Y. Zhao. 2008. ICESat measure-ments of sea-ice freeboard and estimates of sea-ice thickness inthe Weddell Sea. J. Geophys. Res., 113(C2), C02515. (10.1029/2007JC004284.)
MS received 30 June 2006 and accepted in revised form 25 November 2007
Zwally and Gloersen: Arctic sea ice surviving the summer melt296