April 2013 Trends - Alaska Dept of Laborlabor.alaska.gov/trends/apr13.pdfAPRIL 2013 ALASKA ECONOMIC...
19
-
Upload
nguyenliem -
Category
Documents
-
view
216 -
download
0
Transcript of April 2013 Trends - Alaska Dept of Laborlabor.alaska.gov/trends/apr13.pdfAPRIL 2013 ALASKA ECONOMIC...
2 ALASKA ECONOMIC TRENDS APRIL 2013
April 2013Volume 33Number 4
ISSN 0160-3345
To contact Trends authors or request a free electronic or print subscription, e-mail trends@
alaska.gov or call (907) 465-4500. Trends is on the Web at labor.alaska.gov/trends.
Alaska Economic Trends is funded by the Employment Security Division of the
Alaska Department of Labor and Workforce Development. It’s published by the Research
and Analysis Section.
Alaska Economic Trends is printed and distributed by Assets, Inc., a vocational
training and employment program, at a cost of $1.11 per copy.
Material in this publication is public information, and with appropriate credit may
be reproduced without permission.
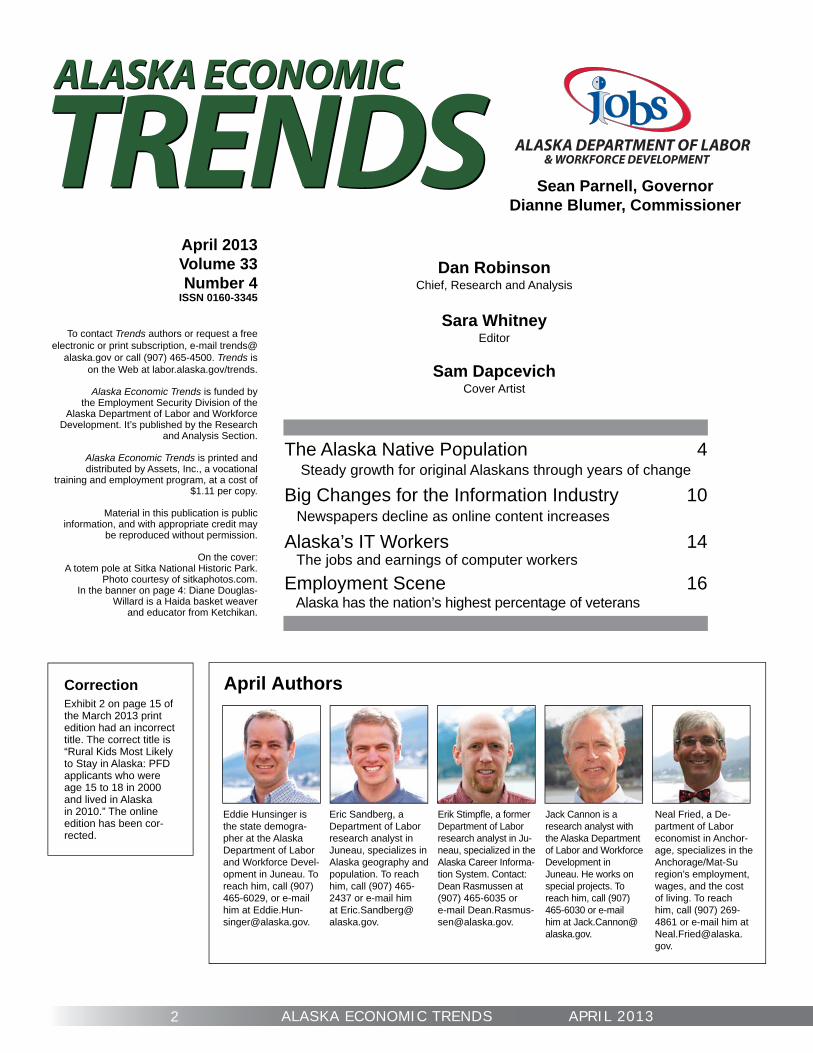
On the cover:A totem pole at Sitka National Historic Park.
Photo courtesy of sitkaphotos.com. In the banner on page 4: Diane Douglas-
Willard is a Haida basket weaver and educator from Ketchikan.
Sean Parnell, GovernorDianne Blumer, Commissioner
Sam DapcevichCover Artist
Sara WhitneyEditor
Dan RobinsonChief, Research and Analysis
The Alaska Native Population 4 Steady growth for original Alaskans through years of change
Big Changes for the Information Industry 10 Newspapers decline as online content increases
Alaska’s IT Workers 14 The jobs and earnings of computer workers
Employment Scene 16 Alaska has the nation’s highest percentage of veterans
CorrectionExhibit 2 on page 15 of the March 2013 print edition had an incorrect title. The correct title is “Rural Kids Most Likely to Stay in Alaska: PFD applicants who were age 15 to 18 in 2000 and lived in Alaska in 2010.” The online edition has been cor-rected.
April Authors
Eddie Hunsinger is the state demogra-pher at the Alaska Department of Labor and Workforce Devel-opment in Juneau. To reach him, call (907) 465-6029, or e-mail him at [email protected].
Erik Stimpfl e, a former Department of Labor research analyst in Ju-neau, specialized in the Alaska Career Informa-tion System. Contact: Dean Rasmussen at (907) 465-6035 or e-mail [email protected].
Jack Cannon is a research analyst with the Alaska Department of Labor and Workforce Development in Juneau. He works on special projects. To reach him, call (907) 465-6030 or e-mail him at [email protected].
Neal Fried, a De-partment of Labor economist in Anchor-age, specializes in the Anchorage/Mat-Su region’s employment, wages, and the cost of living. To reach him, call (907) 269-4861 or e-mail him at [email protected].
Eric Sandberg, a Department of Labor research analyst in Juneau, specializes in Alaska geography and population. To reach him, call (907) 465-2437 or e-mail him at [email protected].
3APRIL 2013 ALASKA ECONOMIC TRENDS
Alaska Natives a young and growing part of state’s workforce
This month’s Trends focuses on Alaska’s indigenous population of roughly 120,000 people, which at 17 percent is the largest proportion of any state. The Alaska Native population is increasing in small and often remote villages and hubs as well as in ur-ban centers. Alaska Natives also represent a young and growing part of our workforce. While all Alaskans benefi t from a wide range of edu-cation and training programs, the Alaska Department of Labor and Workforce Development also helps support unique programs such as the partnership between AVTEC and Cook Inlet Tribal Council that is producing two-year registered nurses. The University of Alaska Anchorage’s Alaska Native Science and Engineering Program is training young Alaskans for future high-paying careers as much-needed engineers, especially in our energy and construction industries. Alaska’s Technical and Vocational Educa-tion Program, known as TVEP, was cre-ated by the Alaska Legislature in 2000 to provide fi nancial assistance to facilities throughout the state that provide technical and vocational education. Funding from a 0.15 percent tax on wages subject to unemployment insurance — and paid by employees — is allocated by stat-ute, with $10.7 million in state fi scal year 2014 going to the University of Alaska, University of Alaska Southeast, Galena Interior Learning Academy, Alaska Techni-cal Center in Kotzebue, AVTEC, North-western Alaska Career and Technical Edu-cation Center in Nome, Southwest Alaska Vocational and Education Center in King Salmon, Yuut Elitnaurviat People’s Learn-ing Center in Bethel, Partners for Progress Delta in Delta Junction, and New Frontier Vocational Technical Center in Soldotna. The Information Industry As it has worldwide, technology has vastly
changed Alaska’s communications land-scape. For traditional media, this change has created major fi nancial challenges, which have ultimately meant fewer work-ers in print publishing. Alaska newspa-pers employ 45 percent fewer workers than they did just a decade ago, refl ecting the downsizing of that industry as ad-vertising and circulation revenue move online. Television and radio have also de-clined, but the loss has been smaller.
Also refl ecting the national trend, the growth in online media has been steady, and online publishers continue to search for successful revenue models.
The technology shift has created new opportunities in information technology. More than 4,000 Alaskans work in IT, primarily on computer design, hardware, software, and management. This doesn’t include the thousands of workers who use computers every day in other industries.
Alaska’s Military
At nearly 15 percent, Alaska’s population of veterans is the largest of any state. The same work ethic, experience and loyalty that made them successful in active duty service often make Alaska’s veterans su-perb workers in the civilian workplace.
The Alaska Department of Labor works statewide to help veterans transition into civilian jobs, from our 21 job centers to other events like the Employment Symposium for Military and Veterans on Wednesday, May 1 at the Egan Center in Anchorage. The symposium will include workshops dedicated to helping turn the job fair into job offers. The state’s largest single job fair, Hiring Our Heroes: Vet-erans and Military Spouses Job Fair, will be Friday, Nov. 8 at the University Center in Anchorage. For more information on either event, contact the Anchorage Busi-ness Connection at (907) 269-4774 or [email protected].
By Dianne Blumer, Commissioner
4 ALASKA ECONOMIC TRENDS APRIL 2013
By EDDIE HUNSINGER and ERIC SANDBERG
Alaska’s Native Population1880 to 20101
I n
u p i a t
Tlingit-Haida
Yupik
n
uu p
Atha b ascan
U n a n g a n / A l e u t
Yuuppiikp
u ttAlutiiq/S
ugpia
q
18801890
19001910
19201929
19391950
19601970
19801990
20002010
0
20,000
40,000
60,000
80,000
100,000
120,000
140,000
Source: Alaska Department of Labor and Workforce Development, Research and Analysis Section
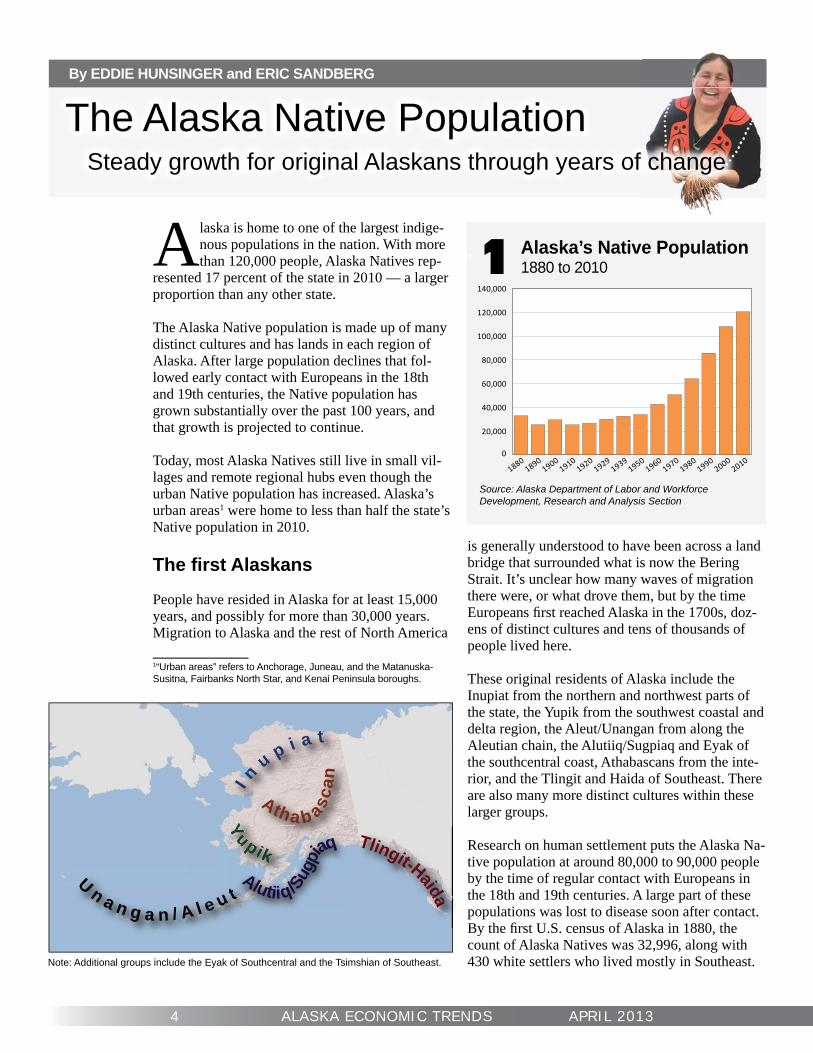
Alaska is home to one of the largest indige-nous populations in the nation. With more than 120,000 people, Alaska Natives rep-
resented 17 percent of the state in 2010 — a larger proportion than any other state.
The Alaska Native population is made up of many distinct cultures and has lands in each region of Alaska. After large population declines that fol-lowed early contact with Europeans in the 18th and 19th centuries, the Native population has grown substantially over the past 100 years, and that growth is projected to continue.
Today, most Alaska Natives still live in small vil-lages and remote regional hubs even though the urban Native population has increased. Alaska’s urban areas1 were home to less than half the state’s Native population in 2010.
The fi rst Alaskans
People have resided in Alaska for at least 15,000 years, and possibly for more than 30,000 years. Migration to Alaska and the rest of North America
1“Urban areas” refers to Anchorage, Juneau, and the Matanuska-Susitna, Fairbanks North Star, and Kenai Peninsula boroughs.
is generally understood to have been across a land bridge that surrounded what is now the Bering Strait. It’s unclear how many waves of migration there were, or what drove them, but by the time Europeans fi rst reached Alaska in the 1700s, doz-ens of distinct cultures and tens of thousands of people lived here.
These original residents of Alaska include the Inupiat from the northern and northwest parts of the state, the Yupik from the southwest coastal and delta region, the Aleut/Unangan from along the Aleutian chain, the Alutiiq/Sugpiaq and Eyak of the southcentral coast, Athabascans from the inte-rior, and the Tlingit and Haida of Southeast. There are also many more distinct cultures within these larger groups.
Research on human settlement puts the Alaska Na-tive population at around 80,000 to 90,000 people by the time of regular contact with Europeans in the 18th and 19th centuries. A large part of these populations was lost to disease soon after contact. By the fi rst U.S. census of Alaska in 1880, the count of Alaska Natives was 32,996, along with 430 white settlers who lived mostly in Southeast. Note: Additional groups include the Eyak of Southcentral and the Tsimshian of Southeast.
The Alaska Native Population Steady growth for original Alaskans through years of change
5APRIL 2013 ALASKA ECONOMIC TRENDS
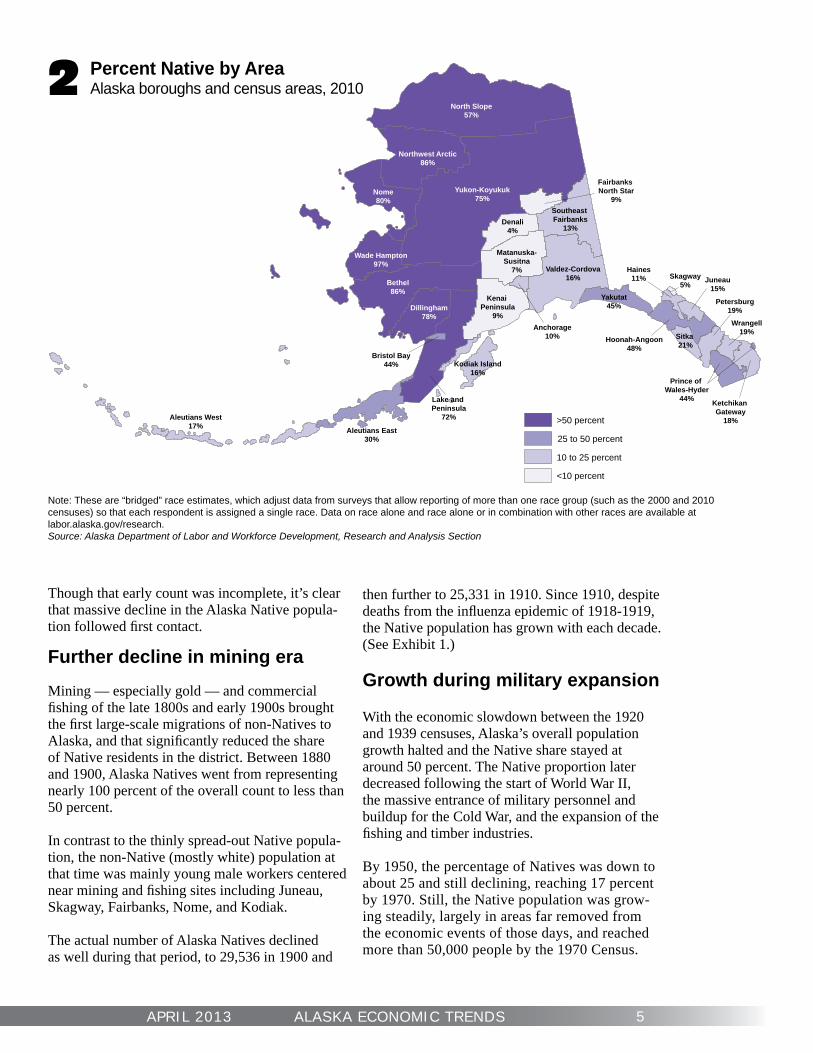
Percent Native by AreaAlaska boroughs and census areas, 20102
Notes: Bridged race estimates.“Bridged” race estimates are race estimates that adjust data from surveys which allow reporting of more thanone race group (such as the 2000 and 2010 Censuses) such that each respondent is assigned a single race
>50 percent
25 to 50 percent
10 to 25 percent
<10 percent
Yukon-Koyukuk75%
North Slope57%
Bethel86%
Nome80%
Valdez-Cordova16%
Northwest Arctic86%
Denali4%
Dillingham78%
Kenai Peninsula
9%
Yakutat45%
Wade Hampton97%
Lake and Peninsula
72%
Matanuska-Susitna
7%
Southeast Fairbanks
13%
Sitka 21%
Aleutians East30%
Hoonah-Angoon48%
Kodiak Island16%
Petersburg19%
Juneau15%
Wrangell19%
Haines11%
Fairbanks North Star
9%
Ketchikan Gateway
18%
Prince of Wales-Hyder
44%
Aleutians West17%
Anchorage10%
Bristol Bay44%
Skagway5%
Note: These are “bridged” race estimates, which adjust data from surveys that allow reporting of more than one race group (such as the 2000 and 2010 censuses) so that each respondent is assigned a single race. Data on race alone and race alone or in combination with other races are available atlabor.alaska.gov/research.Source: Alaska Department of Labor and Workforce Development, Research and Analysis Section
Though that early count was incomplete, it’s clear that massive decline in the Alaska Native popula-tion followed fi rst contact.
Further decline in mining era
Mining — especially gold — and commercial fi shing of the late 1800s and early 1900s brought the fi rst large-scale migrations of non-Natives to Alaska, and that signifi cantly reduced the share of Native residents in the district. Between 1880 and 1900, Alaska Natives went from representing nearly 100 percent of the overall count to less than 50 percent.
In contrast to the thinly spread-out Native popula-tion, the non-Native (mostly white) population at that time was mainly young male workers centered near mining and fi shing sites including Juneau, Skagway, Fairbanks, Nome, and Kodiak.
The actual number of Alaska Natives declined as well during that period, to 29,536 in 1900 and
then further to 25,331 in 1910. Since 1910, despite deaths from the infl uenza epidemic of 1918-1919, the Native population has grown with each decade. (See Exhibit 1.)
Growth during military expansion
With the economic slowdown between the 1920 and 1939 censuses, Alaska’s overall population growth halted and the Native share stayed at around 50 percent. The Native proportion later decreased following the start of World War II, the massive entrance of military personnel and bu ildup for the Cold War, and the expansion of the fi shing and timber industries.
By 1950, the percentage of Natives was down to about 25 and still declining, reaching 17 percent by 1970. Still, the Native population was grow-ing steadily, largely in areas far removed from the economic events of those days, and reached more than 50,000 people by the 1970 Census.
6 ALASKA ECONOMIC TRENDS APRIL 2013
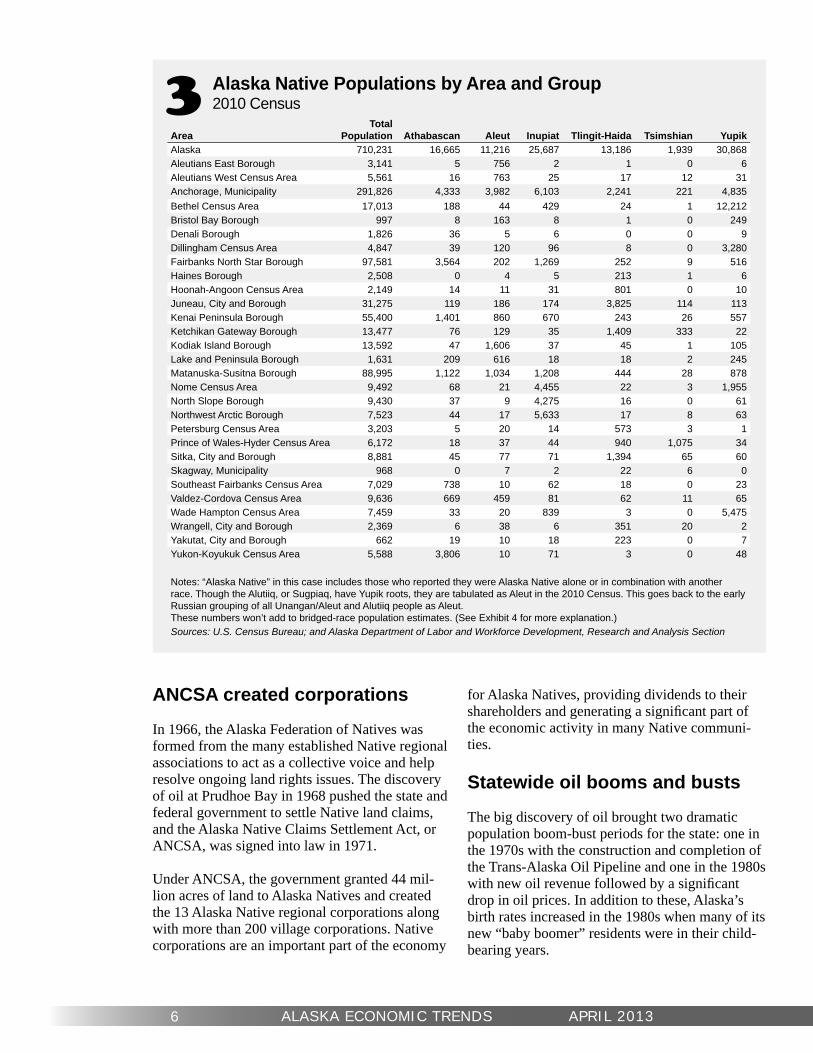
Alaska Native Populations by Area and Group2010 Census3
AreaTotal
Population Athabascan Aleut Inupiat Tlingit-Haida Tsimshian YupikAlaska 710,231 16,665 11,216 25,687 13,186 1,939 30,868Aleutians East Borough 3,141 5 756 2 1 0 6Aleutians West Census Area 5,561 16 763 25 17 12 31Anchorage, Municipality 291,826 4,333 3,982 6,103 2,241 221 4,835Bethel Census Area 17,013 188 44 429 24 1 12,212Bristol Bay Borough 997 8 163 8 1 0 249Denali Borough 1,826 36 5 6 0 0 9Dillingham Census Area 4,847 39 120 96 8 0 3,280Fairbanks North Star Borough 97,581 3,564 202 1,269 252 9 516Haines Borough 2,508 0 4 5 213 1 6Hoonah-Angoon Census Area 2,149 14 11 31 801 0 10Juneau, City and Borough 31,275 119 186 174 3,825 114 113Kenai Peninsula Borough 55,400 1,401 860 670 243 26 557Ketchikan Gateway Borough 13,477 76 129 35 1,409 333 22Kodiak Island Borough 13,592 47 1,606 37 45 1 105Lake and Peninsula Borough 1,631 209 616 18 18 2 245Matanuska-Susitna Borough 88,995 1,122 1,034 1,208 444 28 878Nome Census Area 9,492 68 21 4,455 22 3 1,955North Slope Borough 9,430 37 9 4,275 16 0 61Northwest Arctic Borough 7,523 44 17 5,633 17 8 63Petersburg Census Area 3,203 5 20 14 573 3 1Prince of Wales-Hyder Census Area 6,172 18 37 44 940 1,075 34Sitka, City and Borough 8,881 45 77 71 1,394 65 60Skagway, Municipality 968 0 7 2 22 6 0Southeast Fairbanks Census Area 7,029 738 10 62 18 0 23Valdez-Cordova Census Area 9,636 669 459 81 62 11 65Wade Hampton Census Area 7,459 33 20 839 3 0 5,475Wrangell, City and Borough 2,369 6 38 6 351 20 2Yakutat, City and Borough 662 19 10 18 223 0 7Yukon-Koyukuk Census Area 5,588 3,806 10 71 3 0 48
Notes: “Alaska Native” in this case includes those who reported they were Alaska Native alone or in combination with another race. Though the Alutiiq, or Sugpiaq, have Yupik roots, they are tabulated as Aleut in the 2010 Census. This goes back to the early Russian grouping of all Unangan/Aleut and Alutiiq people as Aleut. These numbers won’t add to bridged-race population estimates. (See Exhibit 4 for more explanation.)Sources: U.S. Census Bureau; and Alaska Department of Labor and Workforce Development, Research and Analysis Section
ANCSA created corporations
In 1966, the Alaska Federation of Natives was formed from the many established Native regional associations to act as a collective voice and help resolve ongoing land rights issues. The discovery of oil at Prudhoe Bay in 1968 pushed the state and federal government to settle Native land claims, and the Alaska Native Claims Settlement Act, or ANCSA, was signed into law in 1971.
Under ANCSA, the government granted 44 mil-lion acres of land to Alaska Natives and created the 13 Alaska Native regional corporations along with more than 200 village corporations. Native corporations are an important part of the economy
for Alaska Natives, providing dividends to their shareholders and generating a signifi cant part of the economic activity in many Native communi-ties.
Statewide oil booms and busts
The big discovery of oil brought two dramatic population boom-bust periods for the state: one in the 1970s with the construction and completion of the Trans-Alaska Oil Pipeline and one in the 1980s with new oil revenue followed by a signifi cant drop in oil prices. In addition to these, Alaska’s birth rates increased in the 1980s when many of its new “baby boomer” residents were in their child-bearing years.
7APRIL 2013 ALASKA ECONOMIC TRENDS
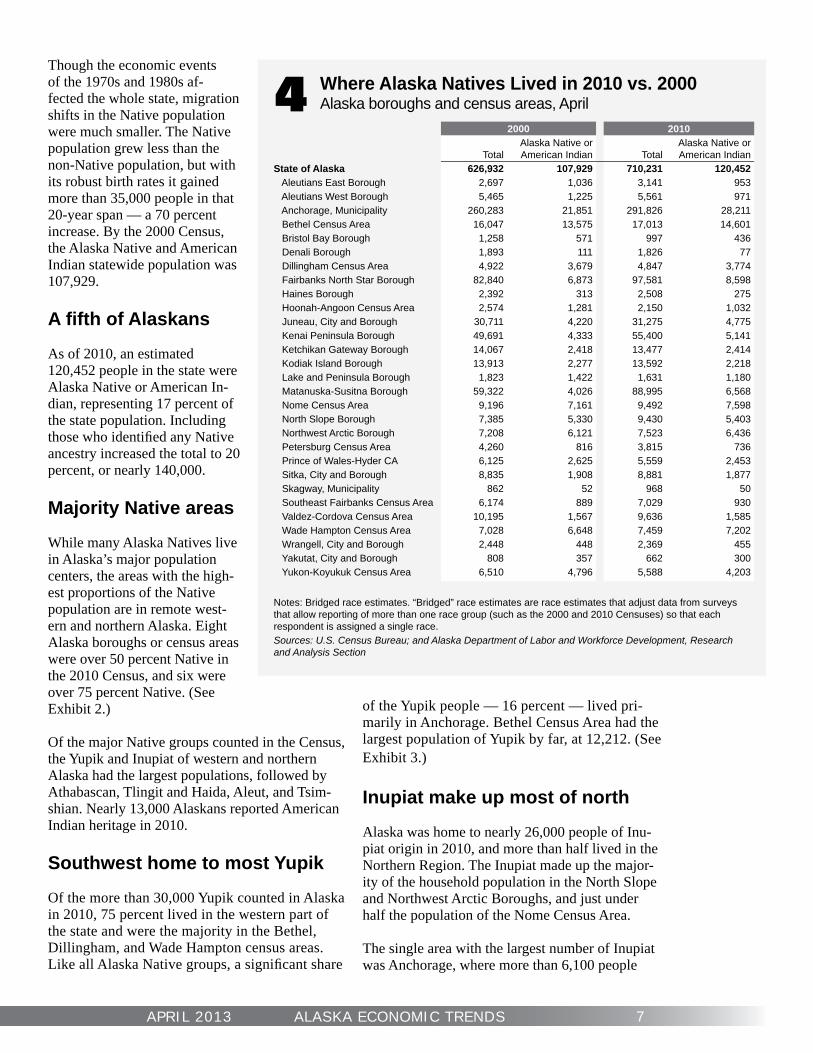
Where Alaska Natives Lived in 2010 vs. 2000Alaska boroughs and census areas, April 4
2000 2010
TotalAlaska Native or American Indian Total
Alaska Native or American Indian
State of Alaska 626,932 107,929 710,231 120,452 Aleutians East Borough 2,697 1,036 3,141 953 Aleutians West Borough 5,465 1,225 5,561 971 Anchorage, Municipality 260,283 21,851 291,826 28,211 Bethel Census Area 16,047 13,575 17,013 14,601 Bristol Bay Borough 1,258 571 997 436 Denali Borough 1,893 111 1,826 77 Dillingham Census Area 4,922 3,679 4,847 3,774 Fairbanks North Star Borough 82,840 6,873 97,581 8,598 Haines Borough 2,392 313 2,508 275 Hoonah-Angoon Census Area 2,574 1,281 2,150 1,032 Juneau, City and Borough 30,711 4,220 31,275 4,775 Kenai Peninsula Borough 49,691 4,333 55,400 5,141 Ketchikan Gateway Borough 14,067 2,418 13,477 2,414 Kodiak Island Borough 13,913 2,277 13,592 2,218 Lake and Peninsula Borough 1,823 1,422 1,631 1,180 Matanuska-Susitna Borough 59,322 4,026 88,995 6,568 Nome Census Area 9,196 7,161 9,492 7,598 North Slope Borough 7,385 5,330 9,430 5,403 Northwest Arctic Borough 7,208 6,121 7,523 6,436 Petersburg Census Area 4,260 816 3,815 736 Prince of Wales-Hyder CA 6,125 2,625 5,559 2,453 Sitka, City and Borough 8,835 1,908 8,881 1,877 Skagway, Municipality 862 52 968 50 Southeast Fairbanks Census Area 6,174 889 7,029 930 Valdez-Cordova Census Area 10,195 1,567 9,636 1,585 Wade Hampton Census Area 7,028 6,648 7,459 7,202 Wrangell, City and Borough 2,448 448 2,369 455 Yakutat, City and Borough 808 357 662 300 Yukon-Koyukuk Census Area 6,510 4,796 5,588 4,203
Notes: Bridged race estimates. “Bridged” race estimates are race estimates that adjust data from surveys that allow reporting of more than one race group (such as the 2000 and 2010 Censuses) so that each respondent is assigned a single race.Sources: U.S. Census Bureau; and Alaska Department of Labor and Workforce Development, Research and Analysis Section
Though the economic events of the 1970s and 1980s af-fected the whole state, migration shifts in the Native population were much smaller. The Native population grew less than the non-Native population, but with its robust birth rates it gained more than 35,000 people in that 20-year span — a 70 percent increase. By the 2000 Census, the Alaska Native and American Indian statewide population was 107,929.
A fi fth of Alaskans
As of 2010, an estimated 120,452 people in the state were Alaska Native or American In-dian, representing 17 percent of the state population. Including those who identifi ed any Native ancestry increased the total to 20 percent, or nearly 140,000.
Majority Native areas
While many Alaska Natives live in Alaska’s major population centers, the areas with the high-est proportions of the Native population are in remote west-ern and northern Alaska. Eight Alaska boroughs or census areas were over 50 percent Native in the 2010 Census, and six were over 75 percent Native. (See Exhibit 2.)
Of the major Native groups counted in the Census, the Yupik and Inupiat of western and northern Alaska had the largest populations, followed by Athabascan, Tlingit and Haida, Aleut, and Tsim-shian. Nearly 13,000 Alaskans reported American Indian heritage in 2010.
Southwest home to most Yupik
Of the more than 30,000 Yupik counted in Alaska in 2010, 75 percent lived in the western part of the state and were the majority in the Bethel, Dillingham, and Wade Hampton census areas. Like all Alaska Native groups, a signifi cant share
of the Yupik people — 16 percent — lived pri-marily in Anchorage. Bethel Census Area had the largest population of Yupik by far, at 12,212. (See Exhibit 3.)
Inupiat make up most of north
Alaska was home to nearly 26,000 people of Inu-piat origin in 2010, and more than half lived in the Northern Region. The Inupiat made up the major-ity of the household population in the North Slope and Northwest Arctic Boroughs, and just under half the population of the Nome Census Area.
The single area with the largest number of Inupiat was Anchorage, where more than 6,100 people
8 ALASKA ECONOMIC TRENDS APRIL 2013
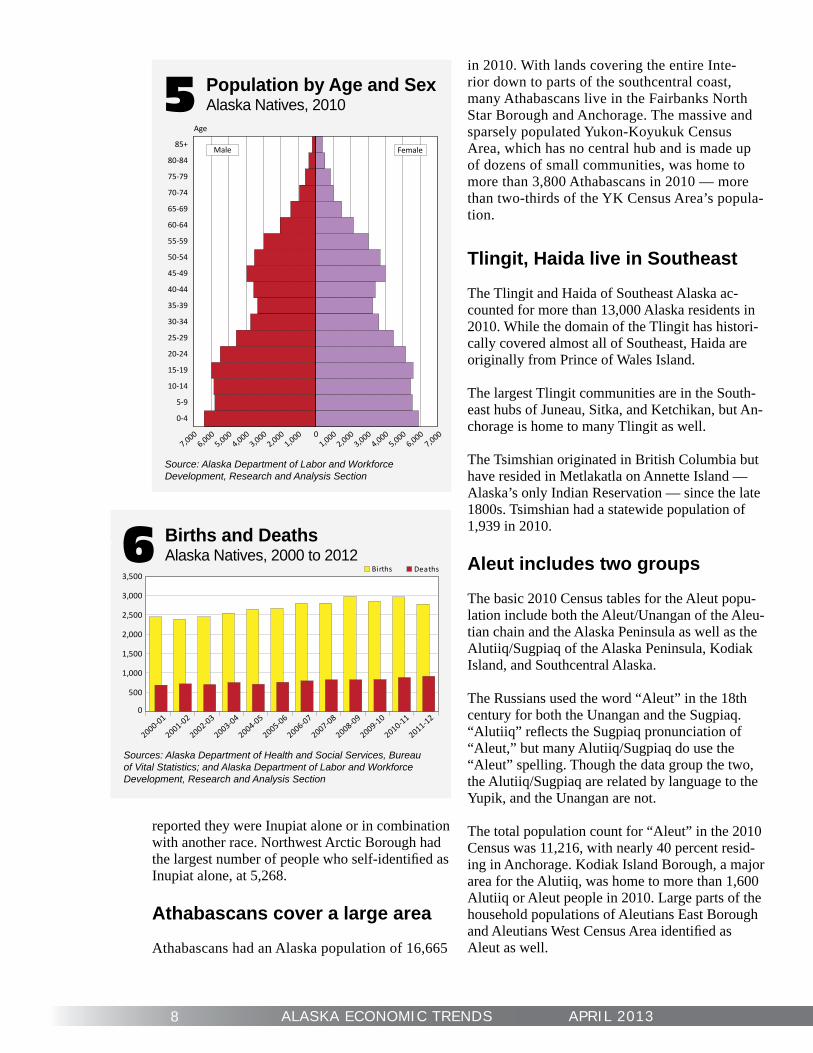
Population by Age and SexAlaska Natives, 20105
Source: Alaska Department of Labor and Workforce Development, Research and Analysis Section
85+
80-84
75-79
70-74
65-69
60-64
55-59
50-54
45-49
40-44
35-39
30-34
25-29
20-24
15-19
10-14
5-9
0-4
Age
1,0002,000
3,0004,000
5,0006,000
7,0001,000
2,0003,000
4,0005,000
6,0007,000
FemaleMale
0
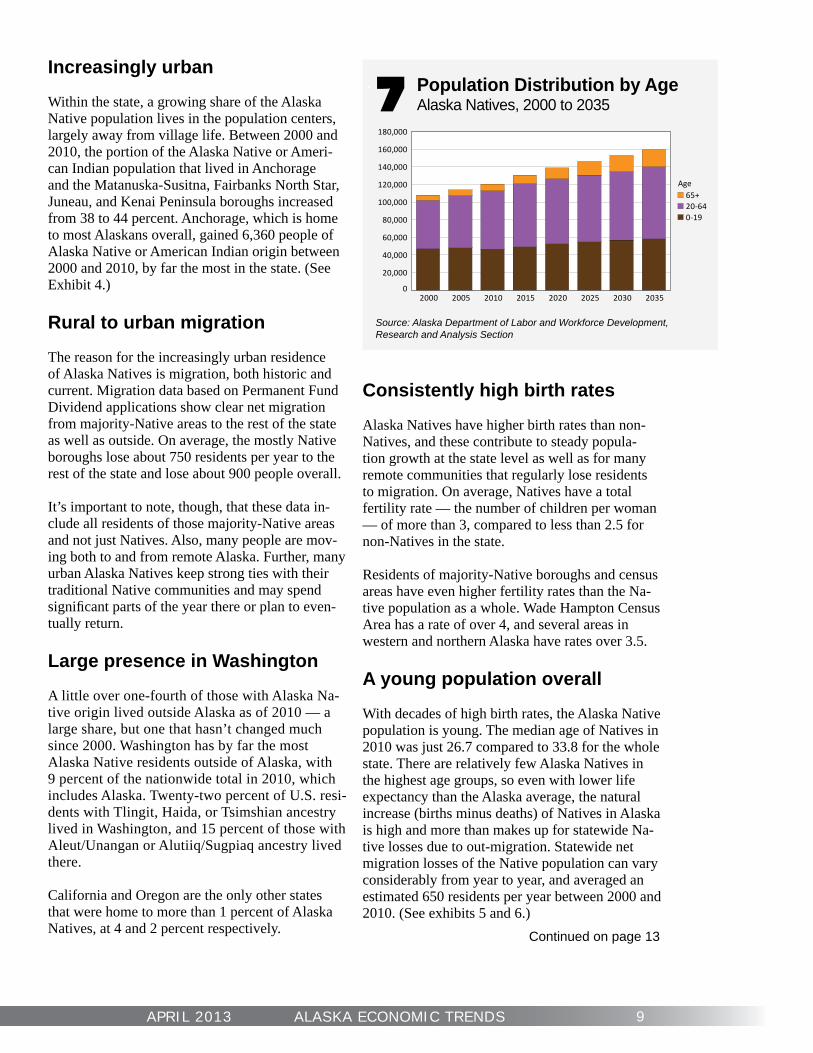
Births and DeathsAlaska Natives, 2000 to 20126
Sources: Alaska Department of Health and Social Services, Bureau of Vital Statistics; and Alaska Department of Labor and Workforce Development, Research and Analysis Section
2000-01
2001-02
2002-03
2003-04
2004-05
2005-06
2006-07
2007-08
2008-09
2009-10
2010-11
2011-120
500
1,000
1,500
2,000
2,500
3,000
3,500Births Deaths
reported they were Inupiat alone or in combination with another race. Northwest Arctic Borough had the largest number of people who self-identifi ed as Inupiat alone, at 5,268.
Athabascans cover a large area
Athabascans had an Alaska population of 16,665
in 2010. With lands covering the entire Inte-rior down to parts of the southcentral coast, many Athabascans live in the Fairbanks North Star Borough and Anchorage. The massive and sparsely populated Yukon-Koyukuk Census Area, which has no central hub and is made up of dozens of small communities, was home to more than 3,800 Athabascans in 2010 — more than two-thirds of the YK Census Area’s popula-tion.
Tlingit, Haida live in Southeast
The Tlingit and Haida of Southeast Alaska ac-counted for more than 13,000 Alaska residents in 2010. While the domain of the Tlingit has histori-cally covered almost all of Southeast, Haida are originally from Prince of Wales Island.
The largest Tlingit communities are in the South-east hubs of Juneau, Sitka, and Ketchikan, but An-chorage is home to many Tlingit as well.
The Tsimshian originated in British Columbia but have resided in Metlakatla on Annette Island — Alaska’s only Indian Reservation — since the late 1800s. Tsimshian had a statewide population of 1,939 in 2010.
Aleut includes two groups
The basic 2010 Census tables for the Aleut popu-lation include both the Aleut/Unangan of the Aleu-tian chain and the Alaska Peninsula as well as the Alutiiq/Sugpiaq of the Alaska Peninsula, Kodiak Island, and Southcentral Alaska.
The Russians used the word “Aleut” in the 18th century for both the Unangan and the Sugpiaq. “Alutiiq” refl ects the Sugpiaq pronunciation of “Aleut,” but many Alutiiq/Sugpiaq do use the “Aleut” spelling. Though the data group the two, the Alutiiq/Sugpiaq are related by language to the Yupik, and the Unangan are not.
The total population count for “Aleut” in the 2010 Census was 11,216, with nearly 40 percent resid-ing in Anchorage. Kodiak Island Borough, a major area for the Alutiiq, was home to more than 1,600 Alutiiq or Aleut people in 2010. Large parts of the household populations of Aleutians East Borough and Aleutians West Census Area identifi ed as Aleut as well.
9APRIL 2013 ALASKA ECONOMIC TRENDS
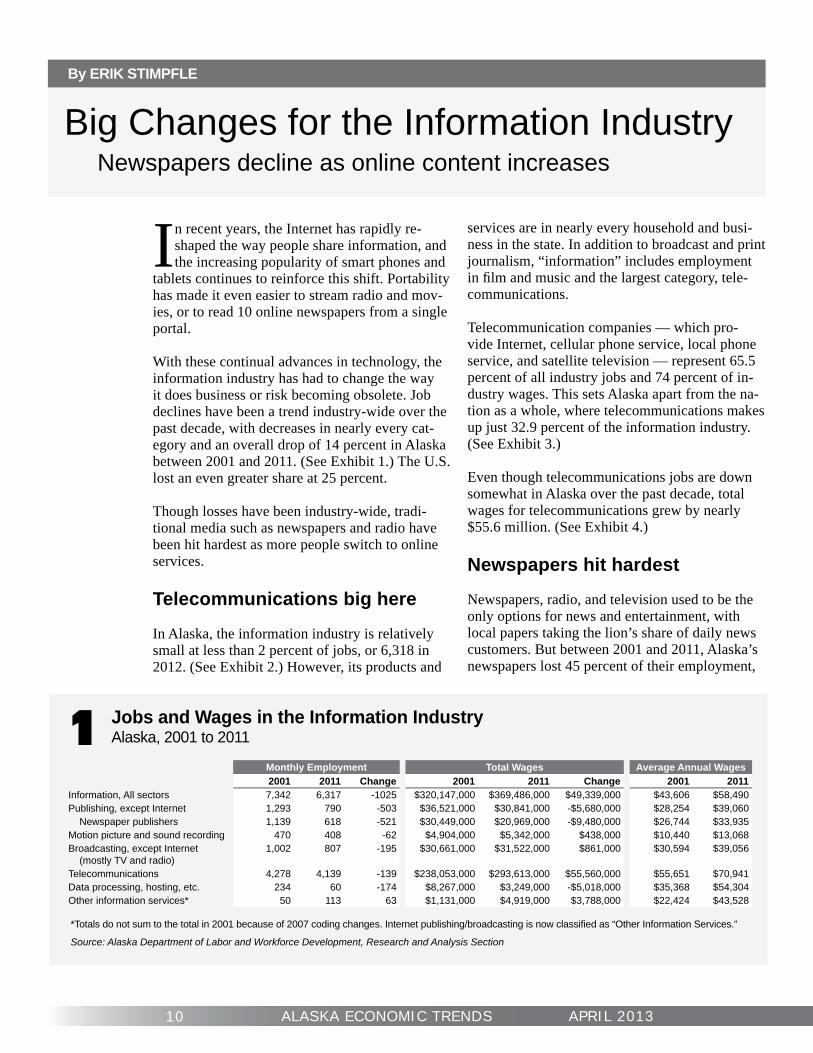
Population Distribution by AgeAlaska Natives, 2000 to 20357
Source: Alaska Department of Labor and Workforce Development, Research and Analysis Section
2000 2005 2010 2015 2020 2025 2030 20350
20,000
40,000
60,000
80,000
100,000
120,000
140,000
160,000
180,000
65+20-640-19
Age
Increasingly urban
Within the state, a growing share of the Alaska Native population lives in the population centers, largely away from village life. Between 2000 and 2010, the portion of the Alaska Native or Ameri-can Indian population that lived in Anchorage and the Matanuska-Susitna, Fairbanks North Star, Juneau, and Kenai Peninsula boroughs increased from 38 to 44 percent. Anchorage, which is home to most Alaskans overall, gained 6,360 people of Alaska Native or American Indian origin between 2000 and 2010, by far the most in the state. (See Exhibit 4.)
Rural to urban migration
The reason for the increasingly urban residence of Alaska Natives is migration, both historic and current. Migration data based on Permanent Fund Dividend applications show clear net migration from majority-Native areas to the rest of the state as well as outside. On average, the mostly Native boroughs lose about 750 residents per year to the rest of the state and lose about 900 people overall.
It’s important to note, though, that these data in-clude all residents of those majority-Native areas and not just Natives. Also, many people are mov-ing both to and from remote Alaska. Further, many urban Alaska Natives keep strong ties with their traditional Native communities and may spend signifi cant parts of the year there or plan to even-tually return.
Large presence in Washington
A little over one-fourth of those with Alaska Na-tive origin lived outside Alaska as of 2010 — a large share, but one that hasn’t changed much since 2000. Washington has by far the most Alaska Native residents outside of Alaska, with 9 percent of the nationwide total in 2010, which includes Alaska. Twenty-two percent of U.S. resi-dents with Tlingit, Haida, or Tsimshian ancestry lived in Washington, and 15 percent of those with Aleut/Unangan or Alutiiq/Sugpiaq ancestry lived there.
California and Oregon are the only other states that were home to more than 1 percent of Alaska Natives, at 4 and 2 percent respectively.
Consistently high birth rates
Alaska Natives have higher birth rates than non-Natives, and these contribute to steady popula-tion growth at the state level as well as for many remote communities that regularly lose residents to migration. On average, Natives have a total fertility rate — the number of children per woman — of more than 3, compared to less than 2.5 for non-Natives in the state.
Residents of majority-Native boroughs and census areas have even higher fertility rates than the Na-tive population as a whole. Wade Hampton Census Area has a rate of over 4, and several areas in western and northern Alaska have rates over 3.5.
A young population overall
With decades of high birth rates, the Alaska Native population is young. The median age of Natives in 2010 was just 26.7 compared to 33.8 for the whole state. There are relatively few Alaska Natives in the highest age groups, so even with lower life expectancy than the Alaska average, the natural increase (births minus deaths) of Natives in Alaska is high and more than makes up for statewide Na-tive losses due to out-migration. Statewide net migration losses of the Native population can vary considerably from year to year, and averaged an estimated 650 residents per year between 2000 and 2010. (See exhibits 5 and 6.)
Continued on page 13
10 ALASKA ECONOMIC TRENDS APRIL 2013
By ERIK STIMPFLE
Big Changes for the Information Industry Newspapers decline as online content increases
In recent years, the Internet has rapidly re-shaped the way people share information, and the increasing popularity of smart phones and
tablets continues to reinforce this shift. Portability has made it even easier to stream radio and mov-ies, or to read 10 online newspapers from a single portal.
With these continual advances in technology, the information industry has had to change the way it does business or risk becoming obsolete. Job declines have been a trend industry-wide over the past decade, with decreases in nearly every cat-egory and an overall drop of 14 percent in Alaska between 2001 and 2011. (See Exhibit 1.) The U.S. lost an even greater share at 25 percent.
Though losses have been industry-wide, tradi-tional media such as newspapers and radio have been hit hardest as more people switch to online services.
Telecommunications big here
In Alaska, the information industry is relatively small at less than 2 percent of jobs, or 6,318 in 2012. (See Exhibit 2.) However, its products and
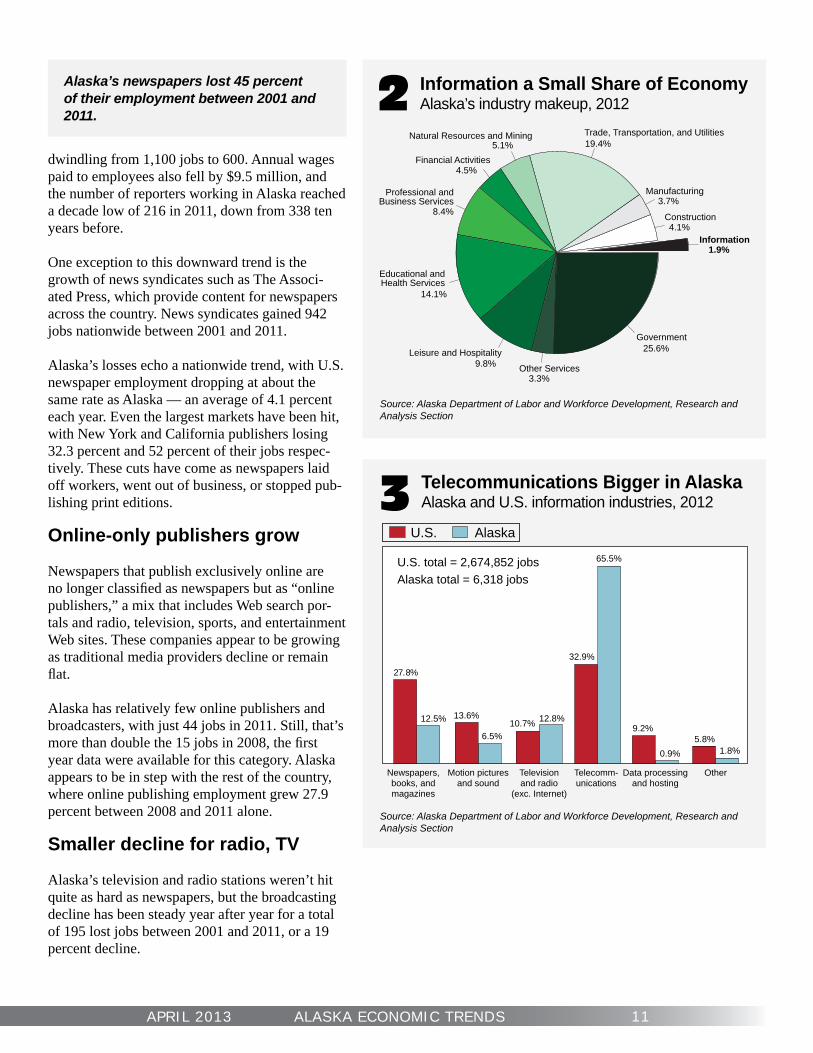
Jobs and Wages in the Information IndustryAlaska, 2001 to 20111
Monthly Employment Total Wages Average Annual Wages2001 2011 Change 2001 2011 Change 2001 2011
Information, All sectors 7,342 6,317 -1025 $320,147,000 $369,486,000 $49,339,000 $43,606 $58,490 Publishing, except Internet 1,293 790 -503 $36,521,000 $30,841,000 -$5,680,000 $28,254 $39,060 Newspaper publishers 1,139 618 -521 $30,449,000 $20,969,000 -$9,480,000 $26,744 $33,935Motion picture and sound recording 470 408 -62 $4,904,000 $5,342,000 $438,000 $10,440 $13,068 Broadcasting, except Internet (mostly TV and radio)
1,002 807 -195 $30,661,000 $31,522,000 $861,000 $30,594 $39,056
Telecommunications 4,278 4,139 -139 $238,053,000 $293,613,000 $55,560,000 $55,651 $70,941 Data processing, hosting, etc. 234 60 -174 $8,267,000 $3,249,000 -$5,018,000 $35,368 $54,304 Other information services* 50 113 63 $1,131,000 $4,919,000 $3,788,000 $22,424 $43,528
*Totals do not sum to the total in 2001 because of 2007 coding changes. Internet publishing/broadcasting is now classifi ed as “Other Information Services.”
Source: Alaska Department of Labor and Workforce Development, Research and Analysis Section
services are in nearly every household and busi-ness in the state. In addition to broadcast and print journalism, “information” includes employment in fi lm and music and the largest category, tele-communications.
Telecommunication companies — which pro-vide Internet, cellular phone service, local phone service, and satellite television — represent 65.5 percent of all industry jobs and 74 percent of in-dustry wages. This sets Alaska apart from the na-tion as a whole, where telecommunications makes up just 32.9 percent of the information industry. (See Exhibit 3.)
Even though telecommunications jobs are down somewhat in Alaska over the past decade, total wages for telecommunications grew by nearly $55.6 million. (See Exhibit 4.)
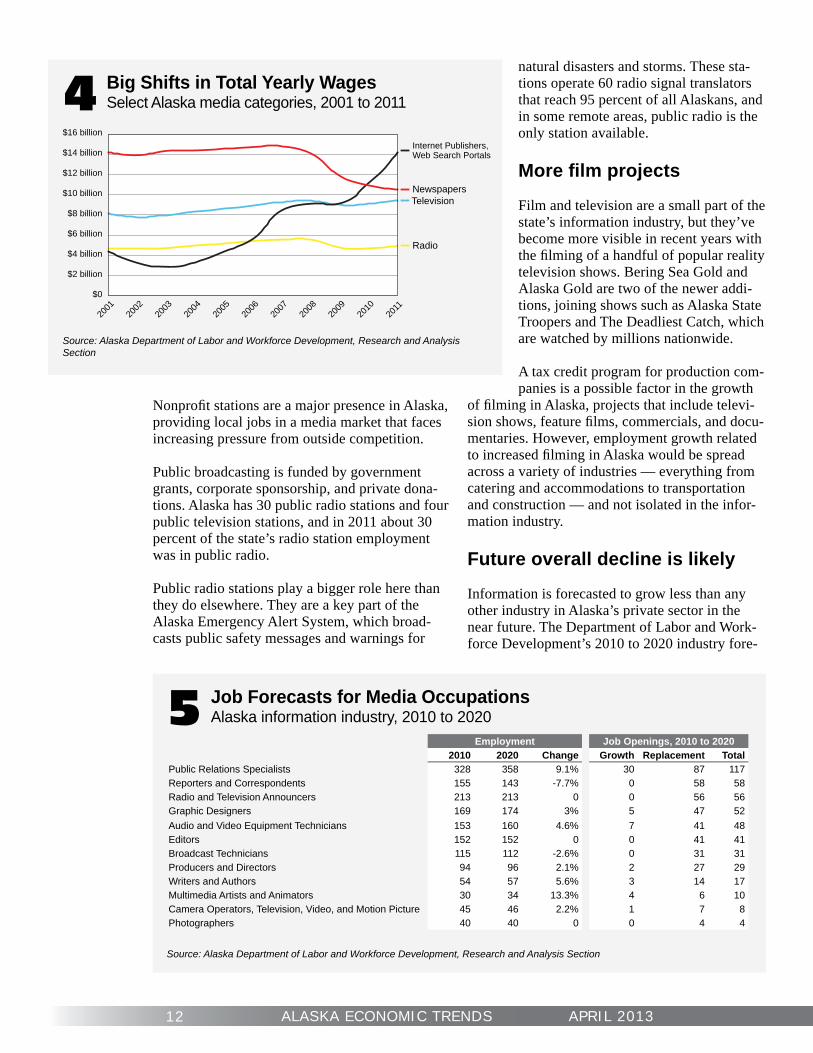
Newspapers hit hardest
Newspapers, radio, and television used to be the only options for news and entertainment, with local papers taking the lion’s share of daily news customers. But between 2001 and 2011, Alaska’s newspapers lost 45 percent of their employment,
11APRIL 2013 ALASKA ECONOMIC TRENDS
Telecommunications Bigger in AlaskaAlaska and U.S. information industries, 20123
27.8%
12.5% 13.6%
6.5%10.7% 12.8%
32.9%
65.5%
9.2%
0.9%5.8%
1.8%
U.S. Alaska
U.S. total = 2,674,852 jobsAlaska total = 6,318 jobs
Newspapers,books, andmagazines
Motion picturesand sound
Televisionand radio
(exc. Internet)
Telecomm-unications
Data processingand hosting
Other
Information a Small Share of EconomyAlaska’s industry makeup, 20122
Source: Alaska Department of Labor and Workforce Development, Research and Analysis Section
Information1.9%
Construction4.1%
Manufacturing3.7%
Trade, Transportation, and Utilities19.4%
Natural Resources and Mining 5.1%
Financial Activities4.5%
Professional andBusiness Services
8.4%
Educational andHealth Services
14.1%
Leisure and Hospitality9.8% Other Services
3.3%
Government25.6%
Source: Alaska Department of Labor and Workforce Development, Research and Analysis Section
dwindling from 1,100 jobs to 600. Annual wages paid to employees also fell by $9.5 million, and the number of reporters working in Alaska reached a decade low of 216 in 2011, down from 338 ten years before.
One exception to this downward trend is the growth of news syndicates such as The Associ-ated Press, which provide content for newspapers across the country. News syndicates gained 942 jobs nationwide between 2001 and 2011.
Alaska’s losses echo a nationwide trend, with U.S. newspaper employment dropping at about the same rate as Alaska — an average of 4.1 percent each year. Even the largest markets have been hit, with New York and California publishers losing 32.3 percent and 52 percent of their jobs respec-tively. These cuts have come as newspapers laid off workers, went out of business, or stopped pub-lishing print editions.
Online-only publishers grow
Newspapers that publish exclusively online are no longer classifi ed as newspapers but as “online publishers,” a mix that includes Web search por-tals and radio, television, sports, and entertainment Web sites. These companies appear to be growing as traditional media providers decline or remain fl at.
Alaska has relatively few online publishers and broadcasters, with just 44 jobs in 2011. Still, that’s more than double the 15 jobs in 2008, the fi rst year data were available for this category. Alaska appears to be in step with the rest of the country, where online publishing employment grew 27.9 percent between 2008 and 2011 alone.
Smaller decline for radio, TV
Alaska’s television and radio stations weren’t hit quite as hard as newspapers, but the broadcasting decline has been steady year after year for a total of 195 lost jobs between 2001 and 2011, or a 19 percent decline.
Alaska’s newspapers lost 45 percent of their employment between 2001 and 2011.
12 ALASKA ECONOMIC TRENDS APRIL 2013
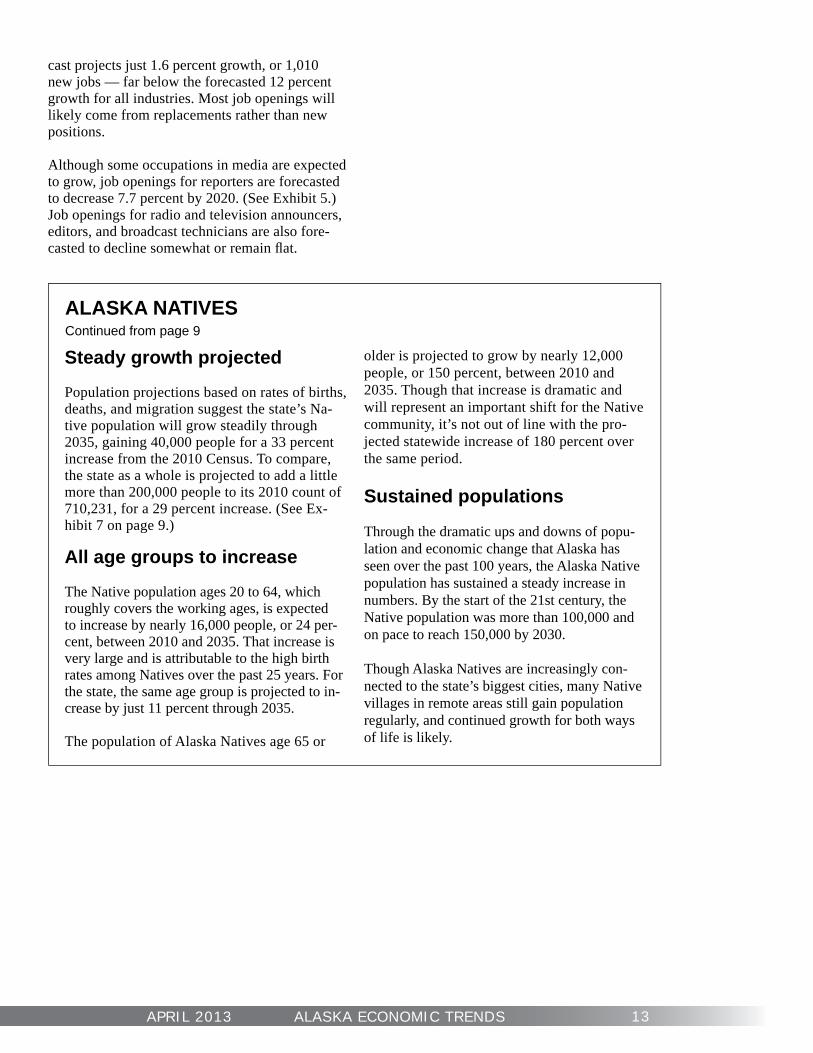
Job Forecasts for Media OccupationsAlaska information industry, 2010 to 20205
Source: Alaska Department of Labor and Workforce Development, Research and Analysis Section
Big Shifts in Total Yearly WagesSelect Alaska media categories, 2001 to 20114
Source: Alaska Department of Labor and Workforce Development, Research and Analysis Section
2001
2002
2003
2004
2005
2006
2007
2008
2009
2010
2011
$0
$2 billion
$4 billion
$6 billion
$8 billion
$10 billion
$12 billion
$14 billion
$16 billion
Newspapers
Internet Publishers,Web Search Portals
Television
Radio
Employment Job Openings, 2010 to 20202010 2020 Change Growth Replacement Total
Public Relations Specialists 328 358 9.1% 30 87 117Reporters and Correspondents 155 143 -7.7% 0 58 58Radio and Television Announcers 213 213 0 0 56 56Graphic Designers 169 174 3% 5 47 52Audio and Video Equipment Technicians 153 160 4.6% 7 41 48Editors 152 152 0 0 41 41Broadcast Technicians 115 112 -2.6% 0 31 31Producers and Directors 94 96 2.1% 2 27 29Writers and Authors 54 57 5.6% 3 14 17Multimedia Artists and Animators 30 34 13.3% 4 6 10Camera Operators, Television, Video, and Motion Picture 45 46 2.2% 1 7 8Photographers 40 40 0 0 4 4
Nonprofi t stations are a major presence in Alaska, providing local jobs in a media market that faces increasing pressure from outside competition.
Public broadcasting is funded by government grants, corporate sponsorship, and private dona-tions. Alaska has 30 public radio stations and four public television stations, and in 2011 about 30 percent of the state’s radio station employment was in public radio.
Public radio stations play a bigger role here than they do elsewhere. They are a key part of the Alaska Emergency Alert System, which broad-casts public safety messages and warnings for
natural disasters and storms. These sta-tions operate 60 radio signal translators that reach 95 percent of all Alaskans, and in some remote areas, public radio is the only station available. More fi lm projects
Film and television are a small part of the state’s information industry, but they’ve become more visible in recent years with the fi lming of a handful of popular reality television shows. Bering Sea Gold and Alaska Gold are two of the newer addi-tions, joining shows such as Alaska State Troopers and The Deadliest Catch, which are watched by millions nationwide.
A tax credit program for production com-panies is a possible factor in the growth
of fi lming in Alaska, projects that include televi-sion shows, feature fi lms, commercials, and docu-mentaries. However, employment growth related to increased fi lming in Alaska would be spread across a variety of industries — everything from catering and accommodations to transportation and construction — and not isolated in the infor-mation industry.
Future overall decline is likely
Information is forecasted to grow less than any other industry in Alaska’s private sector in the near future. The Department of Labor and Work-force Development’s 2010 to 2020 industry fore-
13APRIL 2013 ALASKA ECONOMIC TRENDS
cast projects just 1.6 percent growth, or 1,010 new jobs — far below the forecasted 12 percent growth for all industries. Most job openings will likely come from replacements rather than new positions.
Although some occupations in media are expected to grow, job openings for reporters are forecasted to decrease 7.7 percent by 2020. (See Exhibit 5.) Job openings for radio and television announcers, editors, and broadcast technicians are also fore-casted to decline somewhat or remain fl at.
ALASKA NATIVESContinued from page 9
Steady growth projected
Population projections based on rates of births, deaths, and migration suggest the state’s Na-tive population will grow steadily through 2035, gaining 40,000 people for a 33 percent increase from the 2010 Census. To compare, the state as a whole is projected to add a little more than 200,000 people to its 2010 count of 710,231, for a 29 percent increase. (See Ex-hibit 7 on page 9.)
All age groups to increase
The Native population ages 20 to 64, which roughly covers the working ages, is expected to increase by nearly 16,000 people, or 24 per-cent, between 2010 and 2035. That increase is very large and is attributable to the high birth rates among Natives over the past 25 years. For the state, the same age group is projected to in-crease by just 11 percent through 2035.
The population of Alaska Natives age 65 or
older is projected to grow by nearly 12,000 people, or 150 percent, between 2010 and 2035. Though that increase is dramatic and will represent an important shift for the Native community, it’s not out of line with the pro-jected statewide increase of 180 percent over the same period.
Sustained populations
Through the dramatic ups and downs of popu-lation and economic change that Alaska has seen over the past 100 years, the Alaska Native population has sustained a steady increase in numbers. By the start of the 21st century, the Native population was more than 100,000 and on pace to reach 150,000 by 2030.
Though Alaska Natives are increasingly con-nected to the state’s biggest cities, many Native villages in remote areas still gain population regularly, and continued growth for both ways of life is likely.
14 ALASKA ECONOMIC TRENDS APRIL 2013
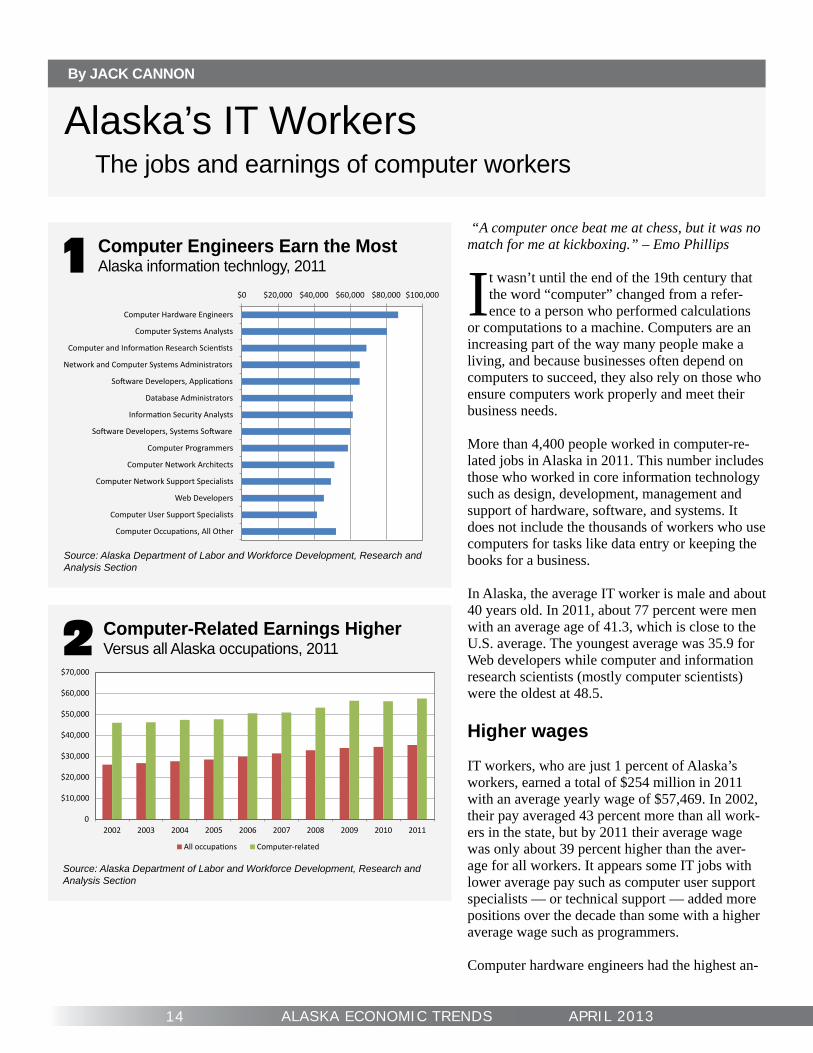
Computer Engineers Earn the MostAlaska information technlogy, 20111
Source: Alaska Department of Labor and Workforce Development, Research and Analysis Section
By JACK CANNON
Alaska’s IT Workers The jobs and earnings of computer workers
$0 $20,000 $40,000 $60,000 $80,000 $100,000
Computer Hardware Engineers
Computer Systems Analysts
Network and Computer Systems Administrators
Computer Programmers
Computer-Related Earnings HigherVersus all Alaska occupations, 20112
Source: Alaska Department of Labor and Workforce Development, Research and Analysis Section
0
$10,000
$20,000
$30,000
$40,000
$50,000
$60,000
$70,000
2002 2003 2004 2005 2006 2007 2008 2009 2010 2011
Computer-related
“A computer once beat me at chess, but it was no match for me at kickboxing.” – Emo Phillips
It wasn’t until the end of the 19th century that the word “computer” changed from a refer-ence to a person who performed calculations
or computations to a machine. Computers are an increasing part of the way many people make a living, and because businesses often depend on computers to succeed, they also rely on those who ensure computers work properly and meet their business needs.
More than 4,400 people worked in computer-re-lated jobs in Alaska in 2011. This number includes those who worked in core information technology such as design, development, management and support of hardware, software, and systems. It does not include the thousands of workers who use computers for tasks like data entry or keeping the books for a business.
In Alaska, the average IT worker is male and about 40 years old. In 2011, about 77 percent were men with an average age of 41.3, which is close to the U.S. average. The youngest average was 35.9 for Web developers while computer and information research scientists (mostly computer scientists) were the oldest at 48.5.
Higher wages
IT workers, who are just 1 percent of Alaska’s workers, earned a total of $254 million in 2011 with an average yearly wage of $57,469. In 2002, their pay averaged 43 percent more than all work-ers in the state, but by 2011 their average wage was only about 39 percent higher than the aver-age for all workers. It appears some IT jobs with lower average pay such as computer user support specialists — or technical support — added more positions over the decade than some with a higher average wage such as programmers.
Computer hardware engineers had the highest an-
15APRIL 2013 ALASKA ECONOMIC TRENDS
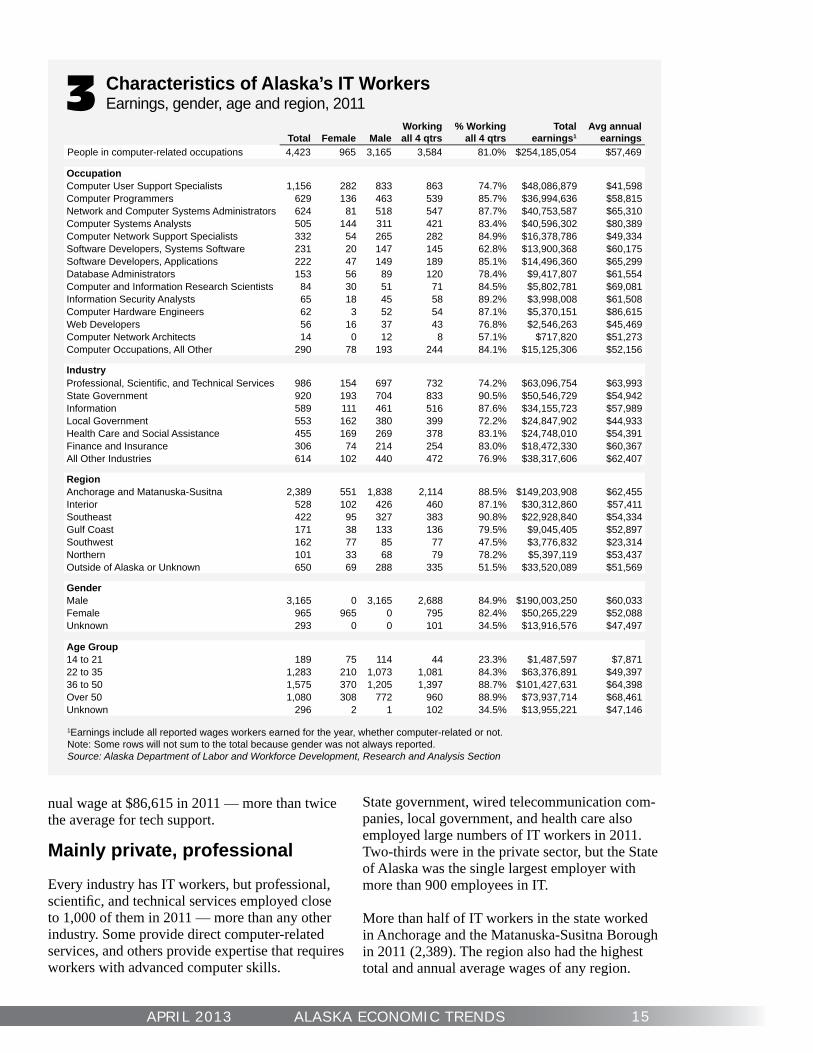
Characteristics of Alaska’s IT WorkersEarnings, gender, age and region, 20113
Total Female MaleWorkingall 4 qtrs
% Working all 4 qtrs
Totalearnings1
Avg annualearnings
People in computer-related occupations 4,423 965 3,165 3,584 81.0% $254,185,054 $57,469
OccupationComputer User Support Specialists 1,156 282 833 863 74.7% $48,086,879 $41,598Computer Programmers 629 136 463 539 85.7% $36,994,636 $58,815Network and Computer Systems Administrators 624 81 518 547 87.7% $40,753,587 $65,310Computer Systems Analysts 505 144 311 421 83.4% $40,596,302 $80,389Computer Network Support Specialists 332 54 265 282 84.9% $16,378,786 $49,334Software Developers, Systems Software 231 20 147 145 62.8% $13,900,368 $60,175Software Developers, Applications 222 47 149 189 85.1% $14,496,360 $65,299Database Administrators 153 56 89 120 78.4% $9,417,807 $61,554Computer and Information Research Scientists 84 30 51 71 84.5% $5,802,781 $69,081Information Security Analysts 65 18 45 58 89.2% $3,998,008 $61,508Computer Hardware Engineers 62 3 52 54 87.1% $5,370,151 $86,615Web Developers 56 16 37 43 76.8% $2,546,263 $45,469Computer Network Architects 14 0 12 8 57.1% $717,820 $51,273Computer Occupations, All Other 290 78 193 244 84.1% $15,125,306 $52,156
IndustryProfessional, Scientifi c, and Technical Services 986 154 697 732 74.2% $63,096,754 $63,993State Government 920 193 704 833 90.5% $50,546,729 $54,942Information 589 111 461 516 87.6% $34,155,723 $57,989Local Government 553 162 380 399 72.2% $24,847,902 $44,933Health Care and Social Assistance 455 169 269 378 83.1% $24,748,010 $54,391Finance and Insurance 306 74 214 254 83.0% $18,472,330 $60,367All Other Industries 614 102 440 472 76.9% $38,317,606 $62,407
RegionAnchorage and Matanuska-Susitna 2,389 551 1,838 2,114 88.5% $149,203,908 $62,455Interior 528 102 426 460 87.1% $30,312,860 $57,411Southeast 422 95 327 383 90.8% $22,928,840 $54,334Gulf Coast 171 38 133 136 79.5% $9,045,405 $52,897Southwest 162 77 85 77 47.5% $3,776,832 $23,314Northern 101 33 68 79 78.2% $5,397,119 $53,437Outside of Alaska or Unknown 650 69 288 335 51.5% $33,520,089 $51,569
GenderMale 3,165 0 3,165 2,688 84.9% $190,003,250 $60,033Female 965 965 0 795 82.4% $50,265,229 $52,088Unknown 293 0 0 101 34.5% $13,916,576 $47,497
Age Group14 to 21 189 75 114 44 23.3% $1,487,597 $7,87122 to 35 1,283 210 1,073 1,081 84.3% $63,376,891 $49,39736 to 50 1,575 370 1,205 1,397 88.7% $101,427,631 $64,398Over 50 1,080 308 772 960 88.9% $73,937,714 $68,461Unknown 296 2 1 102 34.5% $13,955,221 $47,146
1Earnings include all reported wages workers earned for the year, whether computer-related or not.Note: Some rows will not sum to the total because gender was not always reported.Source: Alaska Department of Labor and Workforce Development, Research and Analysis Section
nual wage at $86,615 in 2011 — more than twice the average for tech support.
Mainly private, professional
Every industry has IT workers, but professional, scientifi c, and technical services employed close to 1,000 of them in 2011 — more than any other industry. Some provide direct computer-related services, and others provide expertise that requires workers with advanced computer skills.
State government, wired telecommunication com-panies, local government, and health care also employed large numbers of IT workers in 2011. Two-thirds were in the private sector, but the State of Alaska was the single largest employer with more than 900 employees in IT.
More than half of IT workers in the state worked in Anchorage and the Matanuska-Susitna Borough in 2011 (2,389). The region also had the highest total and annual average wages of any region.
16 ALASKA ECONOMIC TRENDS APRIL 2013
By NEAL FRIED
Employment Scene Alaska has the nation’s highest percentage of veteransesttttttttttt ppppppppppppppperrrrrrrrrrrrrrrrceeeeeeeeeeeennnnnnnnnttttaaaaaageeeeeee oooooooooofffff veeeeeeeeeetttteeeeeeeeeeeeeeeraaaaaaaaaaaaannnnnnnnnnnnnnns
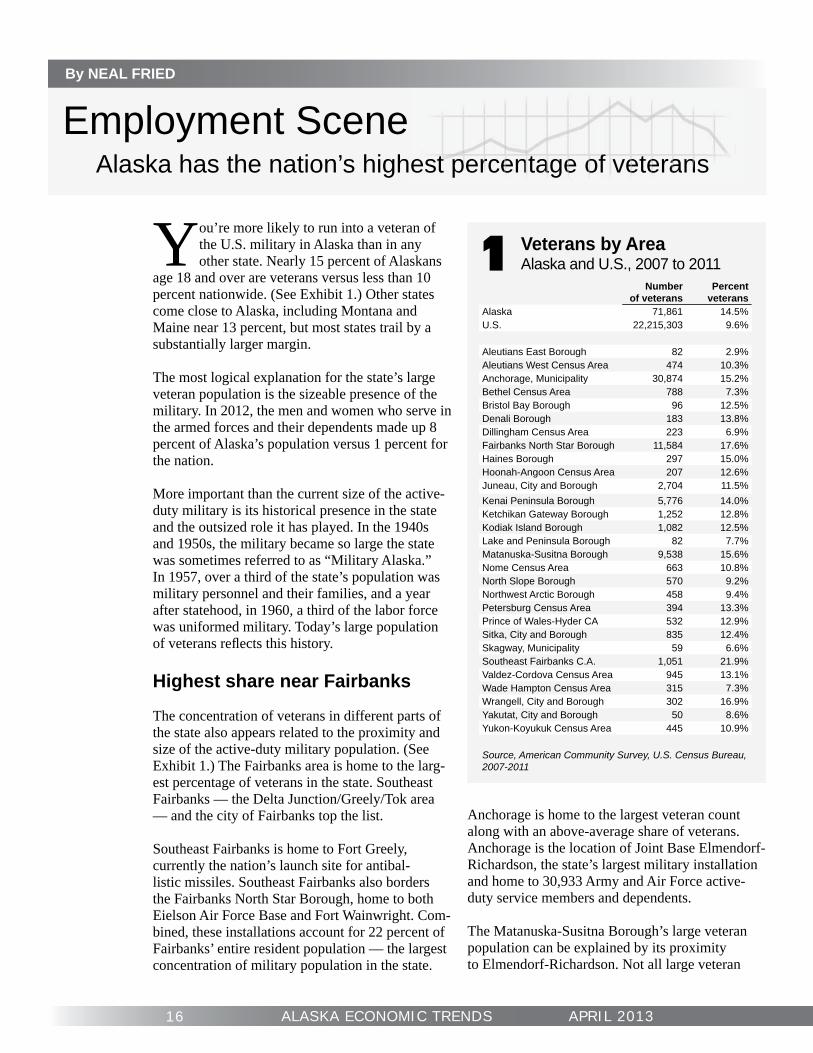
Veterans by AreaAlaska and U.S., 2007 to 20111You’re more likely to run into a veteran of
the U.S. military in Alaska than in any other state. Nearly 15 percent of Alaskans
age 18 and over are veterans versus less than 10 percent nationwide. (See Exhibit 1.) Other states come close to Alaska, including Montana and Maine near 13 percent, but most states trail by a substantially larger margin.
The most logical explanation for the state’s large veteran population is the sizeable presence of the military. In 2012, the men and women who serve in the armed forces and their dependents made up 8 percent of Alaska’s population versus 1 percent for the nation.
More important than the current size of the active-duty military is its historical presence in the state and the outsized role it has played. In the 1940s and 1950s, the military became so large the state was sometimes referred to as “Military Alaska.” In 1957, over a third of the state’s population was military personnel and their families, and a year after statehood, in 1960, a third of the labor force was uniformed military. Today’s large population of veterans refl ects this history.
Highest share near Fairbanks
The concentration of veterans in different parts of the state also appears related to the proximity and size of the active-duty military population. (See Exhibit 1.) The Fairbanks area is home to the larg-est percentage of veterans in the state. Southeast Fairbanks — the Delta Junction/Greely/Tok area — and the city of Fairbanks top the list.
Southeast Fairbanks is home to Fort Greely, currently the nation’s launch site for antibal-listic missiles. Southeast Fairbanks also borders the Fairbanks North Star Borough, home to both Eielson Air Force Base and Fort Wainwright. Com-bined, these installations account for 22 percent of Fairbanks’ entire resident population — the largest concentration of military population in the state.
Numberof veterans
Percent veterans
Alaska 71,861 14.5%U.S. 22,215,303 9.6%
Aleutians East Borough 82 2.9%Aleutians West Census Area 474 10.3%Anchorage, Municipality 30,874 15.2%Bethel Census Area 788 7.3%Bristol Bay Borough 96 12.5%Denali Borough 183 13.8%Dillingham Census Area 223 6.9%Fairbanks North Star Borough 11,584 17.6%Haines Borough 297 15.0%Hoonah-Angoon Census Area 207 12.6%Juneau, City and Borough 2,704 11.5%Kenai Peninsula Borough 5,776 14.0%Ketchikan Gateway Borough 1,252 12.8%Kodiak Island Borough 1,082 12.5%Lake and Peninsula Borough 82 7.7%Matanuska-Susitna Borough 9,538 15.6%Nome Census Area 663 10.8%North Slope Borough 570 9.2%Northwest Arctic Borough 458 9.4%Petersburg Census Area 394 13.3%Prince of Wales-Hyder CA 532 12.9%Sitka, City and Borough 835 12.4%Skagway, Municipality 59 6.6%Southeast Fairbanks C.A. 1,051 21.9%Valdez-Cordova Census Area 945 13.1%Wade Hampton Census Area 315 7.3%Wrangell, City and Borough 302 16.9%Yakutat, City and Borough 50 8.6%Yukon-Koyukuk Census Area 445 10.9%
Source, American Community Survey, U.S. Census Bureau, 2007-2011
Anchorage is home to the largest veteran count along with an above-average share of veterans. Anchorage is the location of Joint Base Elmendorf-Richardson, the state’s largest military installation and home to 30,933 Army and Air Force active-duty service members and dependents.
The Matanuska-Susitna Borough’s large veteran population can be explained by its proximity to Elmendorf-Richardson. Not all large veteran
17APRIL 2013 ALASKA ECONOMIC TRENDS
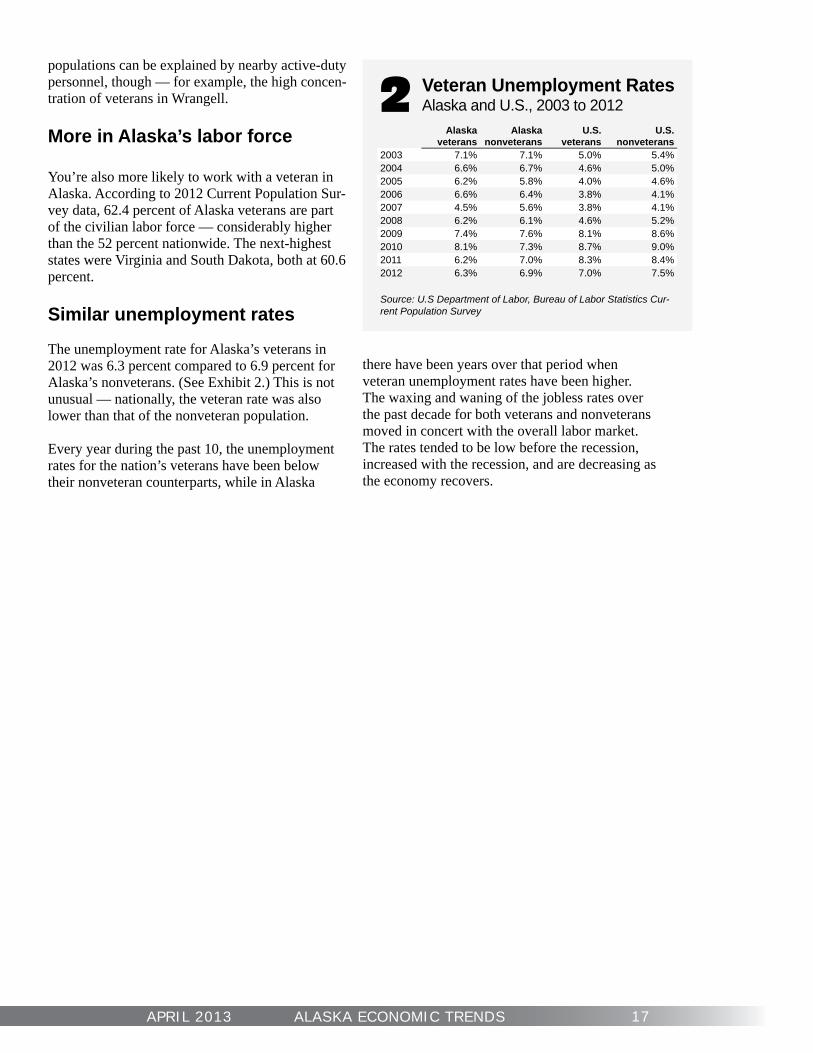
Veteran Unemployment RatesAlaska and U.S., 2003 to 20122
Alaskaveterans
Alaskanonveterans
U.S.veterans
U.S.nonveterans
2003 7.1% 7.1% 5.0% 5.4%2004 6.6% 6.7% 4.6% 5.0%2005 6.2% 5.8% 4.0% 4.6%2006 6.6% 6.4% 3.8% 4.1%2007 4.5% 5.6% 3.8% 4.1%2008 6.2% 6.1% 4.6% 5.2%2009 7.4% 7.6% 8.1% 8.6%2010 8.1% 7.3% 8.7% 9.0%2011 6.2% 7.0% 8.3% 8.4%2012 6.3% 6.9% 7.0% 7.5%
Source: U.S Department of Labor, Bureau of Labor Statistics Cur-rent Population Survey
populations can be explained by nearby active-duty personnel, though — for example, the high concen-tration of veterans in Wrangell.
More in Alaska’s labor force
You’re also more likely to work with a veteran in Alaska. According to 2012 Current Population Sur-vey data, 62.4 percent of Alaska veterans are part of the civilian labor force — considerably higher than the 52 percent nationwide. The next-highest states were Virginia and South Dakota, both at 60.6 percent.
Similar unemployment rates
The unemployment rate for Alaska’s veterans in 2012 was 6.3 percent compared to 6.9 percent for Alaska’s nonveterans. (See Exhibit 2.) This is not unusual — nationally, the veteran rate was also lower than that of the nonveteran population.
Every year during the past 10, the unemployment rates for the nation’s veterans have been below their nonveteran counterparts, while in Alaska
there have been years over that period when veteran unemployment rates have been higher. The waxing and waning of the jobless rates over the past decade for both veterans and nonveterans moved in concert with the overall labor market. The rates tended to be low before the recession, increased with the recession, and are decreasing as the economy recovers.
18 ALASKA ECONOMIC TRENDS APRIL 2013
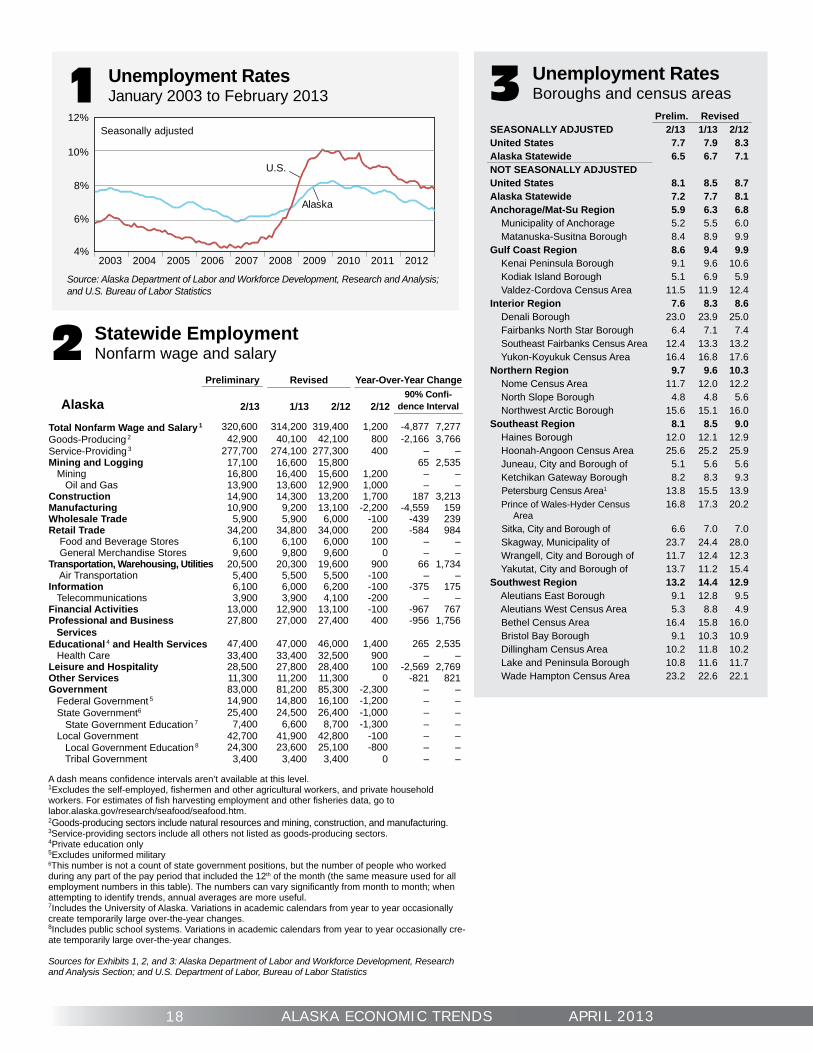
Prelim. RevisedSEASONALLY ADJUSTED 2/13 1/13 2/12United States 7.7 7.9 8.3Alaska Statewide 6.5 6.7 7.1NOT SEASONALLY ADJUSTEDUnited States 8.1 8.5 8.7Alaska Statewide 7.2 7.7 8.1Anchorage/Mat-Su Region 5.9 6.3 6.8 Municipality of Anchorage 5.2 5.5 6.0 Matanuska-Susitna Borough 8.4 8.9 9.9Gulf Coast Region 8.6 9.4 9.9 Kenai Peninsula Borough 9.1 9.6 10.6 Kodiak Island Borough 5.1 6.9 5.9 Valdez-Cordova Census Area 11.5 11.9 12.4Interior Region 7.6 8.3 8.6 Denali Borough 23.0 23.9 25.0 Fairbanks North Star Borough 6.4 7.1 7.4 Southeast Fairbanks Census Area 12.4 13.3 13.2 Yukon-Koyukuk Census Area 16.4 16.8 17.6Northern Region 9.7 9.6 10.3 Nome Census Area 11.7 12.0 12.2 North Slope Borough 4.8 4.8 5.6 Northwest Arctic Borough 15.6 15.1 16.0Southeast Region 8.1 8.5 9.0 Haines Borough 12.0 12.1 12.9 Hoonah-Angoon Census Area 25.6 25.2 25.9 Juneau, City and Borough of 5.1 5.6 5.6 Ketchikan Gateway Borough 8.2 8.3 9.3 Petersburg Census Area1 13.8 15.5 13.9 Prince of Wales-Hyder Census Area
16.8 17.3 20.2
Sitka, City and Borough of 6.6 7.0 7.0 Skagway, Municipality of 23.7 24.4 28.0 Wrangell, City and Borough of 11.7 12.4 12.3 Yakutat, City and Borough of 13.7 11.2 15.4Southwest Region 13.2 14.4 12.9 Aleutians East Borough 9.1 12.8 9.5 Aleutians West Census Area 5.3 8.8 4.9 Bethel Census Area 16.4 15.8 16.0 Bristol Bay Borough 9.1 10.3 10.9 Dillingham Census Area 10.2 11.8 10.2 Lake and Peninsula Borough 10.8 11.6 11.7 Wade Hampton Census Area 23.2 22.6 22.1
3 Unemployment RatesBoroughs and census areas
2 Statewide EmploymentNonfarm wage and salary
Preliminary Revised Year-Over-Year Change
Alaska 2/13 1/13 2/12 2/1290% Confi -
dence Interval
Total Nonfarm Wage and Salary 1 320,600 314,200 319,400 1,200 -4,877 7,277Goods-Producing 2 42,900 40,100 42,100 800 -2,166 3,766Service-Providing 3 277,700 274,100 277,300 400 – –Mining and Logging 17,100 16,600 15,800 65 2,535 Mining 16,800 16,400 15,600 1,200 – – Oil and Gas 13,900 13,600 12,900 1,000 – –Construction 14,900 14,300 13,200 1,700 187 3,213Manufacturing 10,900 9,200 13,100 -2,200 -4,559 159Wholesale Trade 5,900 5,900 6,000 -100 -439 239Retail Trade 34,200 34,800 34,000 200 -584 984 Food and Beverage Stores 6,100 6,100 6,000 100 – – General Merchandise Stores 9,600 9,800 9,600 0 – –Transportation, Warehousing, Utilities 20,500 20,300 19,600 900 66 1,734 Air Transportation 5,400 5,500 5,500 -100 – –Information 6,100 6,000 6,200 -100 -375 175 Telecommunications 3,900 3,900 4,100 -200 – –Financial Activities 13,000 12,900 13,100 -100 -967 767Professional and Business Services
27,800 27,000 27,400 400 -956 1,756
Educational 4 and Health Services 47,400 47,000 46,000 1,400 265 2,535 Health Care 33,400 33,400 32,500 900 – –Leisure and Hospitality 28,500 27,800 28,400 100 -2,569 2,769Other Services 11,300 11,200 11,300 0 -821 821Government 83,000 81,200 85,300 -2,300 – – Federal Government 5 14,900 14,800 16,100 -1,200 – – State Government6 25,400 24,500 26,400 -1,000 – – State Government Education 7 7,400 6,600 8,700 -1,300 – – Local Government 42,700 41,900 42,800 -100 – – Local Government Education 8 24,300 23,600 25,100 -800 – – Tribal Government 3,400 3,400 3,400 0 – –
Unemployment RatesJanuary 2003 to February 20131
Source: Alaska Department of Labor and Workforce Development, Research and Analysis; and U.S. Bureau of Labor Statistics
A dash means confi dence intervals aren’t available at this level.1Excludes the self-employed, fi shermen and other agricultural workers, and private household workers. For estimates of fi sh harvesting employment and other fi sheries data, go to labor.alaska.gov/research/seafood/seafood.htm.2Goods-producing sectors include natural resources and mining, construction, and manufacturing.3Service-providing sectors include all others not listed as goods-producing sectors.4Private education only5Excludes uniformed military6This number is not a count of state government positions, but the number of people who worked during any part of the pay period that included the 12th of the month (the same measure used for all employment numbers in this table). The numbers can vary signifi cantly from month to month; when attempting to identify trends, annual averages are more useful.7Includes the University of Alaska. Variations in academic calendars from year to year occasionally create temporarily large over-the-year changes.8Includes public school systems. Variations in academic calendars from year to year occasionally cre-ate temporarily large over-the-year changes.
Sources for Exhibits 1, 2, and 3: Alaska Department of Labor and Workforce Development, Research and Analysis Section; and U.S. Department of Labor, Bureau of Labor Statistics
2003 2004 2005 2006 2007 2008 2009 2010 2011 20124%
6%
8%
10%
12%
Alaska
Seasonally adjusted
U.S.

19APRIL 2013 ALASKA ECONOMIC TRENDS
Employer Resources
Fidelity bonding is a form of insurance that allows em-ployers to hire from a larger pool of qualifi ed applicants without putting themselves at fi nancial risk. Obtaining this free bond allows the employer to focus on a worker’s skills and productivity while being protected from poten-tial worker dishonesty on the job.
There is no paperwork for the employer or the prospec-tive employee to complete. The bonds are issued in in-crements of $5,000 and provide six months of insurance coverage, with larger bonds issued on a case-by-case basis. Employers may also use bonding to promote a current employee to a more responsible position without exposing the company to risk.
Bonding is a reemployment tool that removes a signifi -cant barrier for applicants who may otherwise have a diffi cult time getting a job. Eligible individuals include
ex-offenders, former addicts, those with poor credit or a history of bankruptcy, those with dishonorable discharg-es from the military, and economically disadvantaged people who lack a work history.
The Fidelity Bonding Program is administered by the Employment Security Division of the Alaska Department of Labor and Workforce Development. It began as a federal program in 1966, and states began administering their own programs in 1998. The program coordinator issues fi delity bonds from Travelers Property Casualty at no cost to the employer or the job seeker.
Employers seeking bonding insurance can call their clos-est Alaska Job Center. To fi nd the nearest job center, go to jobs.alaska.gov/offi ces/ or call (877) 724-2539. For more information about the program, visit the Fidelity Bonding Web site at labor.alaska.gov/bonding.
Safety Minute
Spending the better part of your day behind a desk work-ing at a computer can be painful if not done properly. Re-viewing your work station setup takes just a few minutes but can alleviate hours of agony. Ensure that:
• Hands, wrists, and forearms are straight, in line, and roughly parallel to the fl oor.
• Head is level or bent slightly forward, forward facing, and balanced. Generally it should be in line with the torso.
• Shoulders are relaxed and upper arms hang nor-mally at the side of the body.
• Elbows stay close to the body and are bent between 90 and 120 degrees.
• Feet are fully supported by the fl oor or a footrest, if the desk height is not adjustable.
• Back is fully supported with appropriate lumbar sup-port when sitting vertical or leaning back slightly.
• Thighs and hips are supported by a well-padded
seat and generally parallel to the fl oor.• Knees are at about the same height as the hips with
the feet slightly forward.
Once you have correct working posture, it’s also impor-tant to change positions and move around frequently during the day.
• Make small adjustments to your chair or back rest.• Stretch your fi ngers, hands, arms, and torso.• Stand up and walk around for a few minutes periodi-
cally.
Alaska Occupational Safety and Health Consultation and Training can provide additional help identifying work-place hazards and implementing solutions. Contact us at (907) 269-4955.
Source: Federal OSHA Computer Workstations eTool
A few adjustments to work posture can make a big difference
Fidelity bonding helps job seekers as well as employers