Approximation of Unbalanced Load Flows Using IPSA - Dissertation Done by Madhusudhan Srinivasan
93
APPROXIMATION OF UNBALANCED LOAD FLOWS USING IPSA A dissertation submitted to The University of Manchester for the degree of Master of Science In the Faculty of Engineering and Physical Sciences 2011 Madhusudhan Srinivasan School of Electrical and Electronic Engineering
-
Upload
madhusudhan-srinivasan -
Category
Documents
-
view
25 -
download
1
description
dww
Transcript of Approximation of Unbalanced Load Flows Using IPSA - Dissertation Done by Madhusudhan Srinivasan
APPROXIMATION OF UNBALANCED LOAD FLOWS USING IPSA
A dissertation submitted to
The University of Manchester for the degree
of Master of Science In the Faculty of Engineering and
Physical Sciences
2011
Madhusudhan Srinivasan
School of Electrical and Electronic Engineering

Approximation of Unbalanced load flows using IPSA
Page 1 of 92
Contents
LIST OF FIGURES:............................................................................................................................... 4
LIST OF TABLES ................................................................................................................................. 5
ABSTRACT ............................................................................................................................................ 7
DECLARATION .................................................................................................................................... 7
COPYRIGHT ......................................................................................................................................... 8
ACKNOWLEDGEMENT ...................................................................................................................... 9
CHAPTER 1: INTRODUCTION ...................................................................................................... 10
1.1) Motivation ............................................................................................................................................... 10
1.2) Overview ................................................................................................................................................. 10
1.3) Aim and objectives ................................................................................................................................... 12
CHAPTER 2: LITERATURE REVIEW ........................................................................................... 13
2.1) DINIS ........................................................................................................................................................ 13 2.1.1) Conversion of single phase model to equivalent three phase model .................................. 13
2.1.2) Conversion of two phase model to equivalent three phase model ..................................... 14
2.2) Penetration of Voltage unbalance throughout the network..................................................................... 15
CHAPTER 3: METHODOLOGY TO PERFORM UNBALANCED LOAD FLOW IN IPSA: .... 16
3.1) Unbalanced network design ..................................................................................................................... 16 3.1.1) Two phase two wire system ................................................................................................. 16
3.1.2) Single phase two wire system at 230V ................................................................................. 16
3.1.3) Two phase to single phase transformer ............................................................................... 17
3.1.4) Three phase line ................................................................................................................... 17
3.2) Necessary result conversions ................................................................................................................... 17
3.3) Discussion on accuracy of results obtained by approximated method ..................................................... 18

Approximation of Unbalanced load flows using IPSA
Page 2 of 92
3.4) Three phase fault level information ......................................................................................................... 19
3.5) Method to use voltage unbalance (%) formula to find voltage unbalance (%) at all three phase bus ....... 20
3.6) Determining phase voltage at all bus ....................................................................................................... 24
CHAPTER 4: DESIGNING SIMPLE UNBALANCED DISTRIBUTION NETWORK AND PERFORMING UNBALANCED LOAD FLOW IN IPSA. ............................................................. 28
4.1) Designing network in IPSA ....................................................................................................................... 28 4.1.1) A small distribution network model ..................................................................................... 28
4.1.2) Data entry in IPSA for loads, wind farm and grid: ................................................................ 29
4.1.3) Selection of line conductors ................................................................................................. 29
4.1.4) Data entry in IPSA for conductors ........................................................................................ 29
4.1.5) Data entry in IPSA for two phase to single phase transformer ............................................ 32
4.1.6) Data entry of zero sequence parameters in IPSA for transformers, lines and wind farm ... 32
4.1.7) Data entry in IPSA for three phase transformer ................................................................... 32
4.2) Unbalanced load flow results obtained performing balanced load flow in IPSA ....................................... 33 4.2.1) Unbalanced nodes - busbar voltage and its angle ................................................................ 33
4.2.2) Voltage drop in unbalanced lines ......................................................................................... 34
4.2.3) Approximate results of Current drawn by unbalanced loads and current flowing in unbalanced lines ............................................................................................................................. 35
4.2.4) Results of power loss in unbalance nodes ............................................................................ 40
4.2.5) Results of positive sequence voltage ................................................................................... 41
4.2.6) Voltage drop and current in two phase line depends on two network design .................... 42
4.3) Applying three phase fault at all bus and using methodology in finding voltage unbalance using fault level information ..................................................................................................................................................... 44
4.3.1) Determining upstream and downstream bus ...................................................................... 44
4.3.2) Voltage unbalance calculation .............................................................................................. 46
4.3.3) Final results of voltage unbalance in the network ............................................................... 49
4.4) Negative sequence voltage magnitude calculation .................................................................................. 50
4.5) Key points on results obtained ................................................................................................................. 50
CHAPTER 5: INFLUENCE OF TERRACE FIXED SOLAR PANELS ON THE VOLTAGE UNBALANCE AT DISTRIBUTION TRANSFORMER: ................................................................ 51
5.1) Distribution transformer and its load ....................................................................................................... 51
5.2) Effect on distribution transformer with and without solar panel ............................................................. 52 5.2.1) Result of this analysis............................................................................................................ 55

Approximation of Unbalanced load flows using IPSA
Page 3 of 92
5.3) Output of the solar panel, influence on voltage unbalance ...................................................................... 55 5.3.1) Result of this analysis............................................................................................................ 57
5.4) Roof mounted solar panel influence on phase voltage ............................................................................. 57 5.4.1) Result of this analysis............................................................................................................ 57
CHAPTER 6: CONCLUSION ............................................................................................................ 58
REFERENCES ..................................................................................................................................... 59
APPENDIX 1: INFLUENCE OF POSITIVE AND NEGATIVE SEQUENCE VOLTAGE ANGLE ............................................................................................................................................................... 60
A1.1) Understanding how Negative sequence voltage angle is strongly linked with Positive sequence voltage angle and three phase voltage magnitudes ..................................................................................................... 60
A1.1.1) Case 1 ................................................................................................................................. 61
A1.1.1) Case 2 ................................................................................................................................. 63
A1.2) Analysis results ...................................................................................................................................... 64
APPENDIX 2: DATA ENTRY IN IPSA ........................................................................................... 68
A2.1) Data entry in IPSA for load ..................................................................................................................... 68
A2.2) Data entry in IPSA for wind farm ........................................................................................................... 68
A2.3) Selection of line conductors ................................................................................................................... 69
A2.4) Data entry in IPSA for grid ..................................................................................................................... 70
A2.5) Data entry in IPSA for three phase transformer ..................................................................................... 70
A2.6) Data entry in IPSA for three phase lines at 33kV .................................................................................... 70
A2.7) Data entry of zero sequence parameters in IPSA for transformers, lines and wind farm ....................... 71
APPENDIX 3: DATA ENTRY OF A SINGLE PHASE LINE AT 0.230KV FEEDING URBAN HOUSES IN IPSA: .............................................................................................................................. 72
A3.1) Data entry in IPSA for single phase conductor needs the following steps .............................................. 72 A3.1.1) Designing of neutral impedance ........................................................................................ 72
A3.1.2) Conversion of single phase line to equivalent three phase line......................................... 77
APPENDIX 4: FEASIBILITY REPORT .......................................................................................... 78
Total word count = 18,220
Approximation of Unbalanced load flows using IPSA
Page 4 of 92
List of figures:
FIGURE 1: SHOWING CONNECTION OF TRACTION LOADS ..................................................................................................... 12 FIGURE 2: SHOWING PENETRATION OF VOLTAGE UNBALANCE THROUGHOUT THE NETWORK
(5). .................................................. 15
FIGURE 3: SHOWS CLEAR EXPLANATION OF TABLE GIVEN IN THE FIGURE 2............................................................................... 15 FIGURE 4: SHOWING A SIMPLE 10 BUS SYSTEM. ................................................................................................................ 20 FIGURE 5: SHOWING NETWORK WITH UNBALANCED LOAD ................................................................................................... 26 FIGURE 6: SHOWING ONE LINE DIAGRAM OF NETWORK DESIGNED IN IPSA ............................................................................. 28 FIGURE 7: SHOWING DISTANCE OF BOTH PHASE CONDUCTOR AND NEUTRAL CONDUCTOR .......................................................... 30 FIGURE 8: SHOWING CURRENT FLOW IN PHASE AND NEUTRAL CONDUCTOR ............................................................................ 31 FIGURE 9: SHOWING MODIFIED PHASE CONDUCTOR DISTANCE AND BUSBAR NUMBER ............................................................... 31 FIGURE 10: SHOWING NETWORK DESIGN 1 ...................................................................................................................... 42 FIGURE 11: SHOWING NETWORK DESIGN 2 ...................................................................................................................... 42 FIGURE 12: GRAPH SHOWING VOLTAGE UNBALANCE IN THE NETWORK .................................................................................. 49 FIGURE 13: SHOWING A DISTRIBUTION TRANSFORMER AND ITS LOAD .................................................................................... 51 FIGURE 14: SHOWING THREE CASES TO BE ANALYZED TO UNDERSTAND THE EFFECT OF SOLAR PANEL EFFECT ON VOLTAGE UNBALANCE 53 FIGURE 15: GRAPH SHOWING HOW SOLAR PANEL OUTPUT INFLUENCE VOLTAGE UNBALANCE ..................................................... 56 FIGURE 16: GRAPH SHOWING VARIATION OF PHASE VOLTAGE MAGNITUDE WITH RESPECT TO VARIATION OF NEGATIVE SEQUENCE
VOLTAGE ANGLE (HERE POSITIVE SEQUENCE ANGLE IS 0). ........................................................................................... 62 FIGURE 17: VARIATION OF PHASE VOLTAGE MAGNITUDE WITH RESPECT TO VARIATION OF NEGATIVE SEQUENCE VOLTAGE ANGLE (HERE
POSITIVE SEQUENCE ANGLE IS 27.39) ..................................................................................................................... 64 FIGURE 18: SHOWING SHIFT IN POSITIVE SEQUENCE ANGLE INFLUENCE SAME SHIFT IN NEGATIVE SEQUENCE ANGLE, R PHASE, Y PHASE
AND B PHASE ANGLE. .......................................................................................................................................... 65 FIGURE 19: SHOWING PHASE VOLTAGE MAGNITUDES VARIES WHEN NEGATIVE SEQUENCE VOLTAGE ANGLE VARIES FROM 0
0 TO 360
0 66
FIGURE 20: SHOWING PHASE VOLTAGE MAGNITUDES VARIES WHEN NEGATIVE SEQUENCE VOLTAGE ANGLE VARIES FROM 00 TO -360
0
....................................................................................................................................................................... 66 FIGURE 21: SHOWING URBAN HOUSES CONNECTED TO THREE DIFFERENT PHASE AND DIFFERENT NODES OF EACH PHASE ................. 72 FIGURE 22: SHOWING DISTANCE BETWEEN HOUSES ........................................................................................................... 73 FIGURE 23: SHOWING DISTANCE BETWEEN HOUSES IN R, Y AND B PHASE .............................................................................. 73 FIGURE 24: SHOWING CURRENT FLOW FROM EACH PHASE CONDUCTOR THROUGH NEUTRAL CONDUCTOR. ................................... 74 FIGURE 25: SHOWING MODIFIED PHASE CONDUCTORS DISTANCE AND BUSBAR NUMBER ........................................................... 76

Approximation of Unbalanced load flows using IPSA
Page 5 of 92
List of tables:
TABLE 1: FINDING UPSTREAM AND DOWNSTREAM BUS IN ITERATION 1 .................................................................................. 21 TABLE 2: FINDING UPSTREAM AND DOWNSTREAM BUS IN ITERATION 2 .................................................................................. 22 TABLE 3: CALCULATING VOLTAGE UNBALANCE FOR UPSTREAM BUS IN ITERATION 1 .................................................................. 23 TABLE 4: CALCULATING VOLTAGE UNBALANCE FOR DOWNSTREAM BUS IN ITERATION 1 ............................................................. 23 TABLE 5: CALCULATING VOLTAGE UNBALANCE FOR UPSTREAM BUS IN ITERATION 2 .................................................................. 23 TABLE 6: CALCULATING VOLTAGE UNBALANCE FOR DOWNSTREAM BUS IN ITERATION 2 ............................................................. 24 TABLE 7: CALCULATING FINAL RESULTS OF VOLTAGE UNBALANCE AT ALL BUS ........................................................................... 24 TABLE 8: SHOWING VOLTAGE LEVEL OF THE NETWORK REPRESENTED BY DIFFERENT COLOUR ...................................................... 29 TABLE 9: R, X AND B IN P.U CALCULATED FOR TWO PHASE LINES AT 33KV ............................................................................ 29 TABLE 10: CALCULATED VALUE OF R IN P.U AND X IN P.U FOR SINGLE PHASE LINE FEEDING FARM AT 0.230V.............................. 32 TABLE 11: CONVERSION OF TWO PHASE TO SINGLE PHASE TRANSFORMER IMPEDANCE INTO EQUIVALENT THREE PHASE TRANSFORMER
IMPEDANCE ....................................................................................................................................................... 32 TABLE 12: BUSBAR VOLTAGE AT UNBALANCE NODES WHICH IS USED TO FIND VOLTAGE DROP IN THE UNBALANCED LINES ................. 33 TABLE 13: VOLTAGE DROP IN UNBALANCED LINES CALCULATED FROM TABLE 12 ..................................................................... 34 TABLE 14: VOLTAGE DROP IN UNBALANCED LINES CALCULATED FROM TABLE 12. ..................................................................... 35 TABLE 15: CALCULATED UNBALANCED LOAD CURRENT RESULT ............................................................................................. 35 TABLE 16: CALCULATED UNBALANCED LOAD CURRENT RESULT ............................................................................................. 36 TABLE 17: OBTAINED UNBALANCED LOAD CURRENT RESULTS .............................................................................................. 36 TABLE 18: OBTAINED UNBALANCED LOAD CURRENT RESULTS .............................................................................................. 36 TABLE 19: CALCULATED CURRENT IN TWO PHASE LINES ...................................................................................................... 36 TABLE 20: OBTAINED RESULTS OF CURRENT IN TWO PHASE LINES......................................................................................... 37 TABLE 21: CALCULATED CURRENT IN SINGLE PHASE LINES .................................................................................................... 37 TABLE 22: CALCULATED CURRENT IN SINGLE PHASE LINES .................................................................................................... 38 TABLE 23: CALCULATED CURRENT IN SINGLE PHASE LINES .................................................................................................... 38 TABLE 24: CALCULATED CURRENT IN SINGLE PHASE LINES .................................................................................................... 39 TABLE 25: OBTAINED RESULTS OF CURRENT IN SINGLE PHASE LINES ....................................................................................... 39 TABLE 26: RESULTS OF POWER LOSS IN UNBALANCED LINE .................................................................................................. 40 TABLE 27: RESULTS OF POWER LOSS IN UNBALANCED LINE .................................................................................................. 41 TABLE 28: RESULTS OF POSITIVE SEQUENCE VOLTAGE AT ALL THREE PHASE BUS ....................................................................... 41 TABLE 29: NETWORK DESIGN 1 LOADING IN MVA AT BUS 11 ............................................................................................. 42 TABLE 30: NETWORK DESIGN 2 LOADING IN MVA AT BUS 11 ............................................................................................. 43 TABLE 31: DETERMINING UPSTREAM AND DOWNSTREAM BUS FOR ITERATION 1 ...................................................................... 44 TABLE 32: DETERMINING UPSTREAM AND DOWNSTREAM BUS FOR ITERATION 2 ...................................................................... 45 TABLE 33: DETERMINING UPSTREAM AND DOWNSTREAM BUS FOR ITERATION 3, 4 AND 5 ......................................................... 45 TABLE 34: VOLTAGE UNBALANCE CALCULATION FOR UPSTREAM BUS IN ITERATION 1 ................................................................ 46 TABLE 35: VOLTAGE UNBALANCE CALCULATION FOR DOWNSTREAM BUS IN ITERATION 1 ........................................................... 46 TABLE 36: VOLTAGE UNBALANCE CALCULATION FOR UPSTREAM BUS IN ITERATION 2 ................................................................ 46 TABLE 37: VOLTAGE UNBALANCE CALCULATION FOR DOWNSTREAM BUS IN ITERATION 2 ........................................................... 47 TABLE 38: VOLTAGE UNBALANCE CALCULATION FOR UPSTREAM BUS IN ITERATION (345) ......................................................... 47 TABLE 39: VOLTAGE UNBALANCE CALCULATION FOR DOWNSTREAM BUS IN ITERATION (345) .................................................... 47 TABLE 40: VOLTAGE UNBALANCE CALCULATION FOR DOWNSTREAM BUS IN ITERATION (345) .................................................... 48 TABLE 41: RESULTS OF VOLTAGE UNBALANCE IN EACH ITERATION ......................................................................................... 48 TABLE 42: FINAL RESULTS OF VOLTAGE UNBALANCE AT ALL THE BUS IN THE NETWORK .............................................................. 49 TABLE 43: CALCULATION OF NEGATIVE SEQUENCE VOLTAGE MAGNITUDE AT ALL THREE PHASE BUS ............................................. 50 TABLE 44: ASSUMED PHASE VOLTAGES AT BUS 1 IN P.U. ................................................................................................... 51 TABLE 45: SHOWING PER HOUSE CONSUMPTION IN ON AND OFF PEAK PERIOD ........................................................................ 52 TABLE 46: SHOWING TOTAL LOAD CONSUMPTION IN P.U IN EACH PHASE AT ON AND OFF PEAK PERIOD ....................................... 52 TABLE 47: SHOWING THREE CASES TO BE ANALYZED UNDERSTAND THE EFFECT OF SOLAR PANEL EFFECT ON VOLTAGE UNBALANCE .... 52 TABLE 48: CALCULATED SR , SY AND SB IN P.U. FOR THREE CASES ........................................................................................ 53 TABLE 49: CALCULATED IR, IY AND IB IN P.U. FOR THREE CASES ........................................................................................... 54

Approximation of Unbalanced load flows using IPSA
Page 6 of 92
TABLE 50: CALCULATED VBUS 3 (R) , VBUS 3 (Y) AND VBUS 3 (B) IN P.U. AT BUS 3 FOR THREE CASES ................................................. 54 TABLE 51: CALCULATED VALUE OF VBUS 3 (R), VBUS 3 (Y) AND VBUS 3 (B) IN VOLTS AT BUS 3: .......................................................... 54 TABLE 52: CALCULATED RESULTS OF VOLTAGE UNBALANCE IN % FOR THREE CASES................................................................... 55 TABLE 53: CALCULATED VOLTAGE UNBALANCE RESULTS FOR CASE 2 AND ITS TWO CONDITIONS .................................................. 56 TABLE 54: POSITIVE SEQUENCE VOLTAGE, NEGATIVE SEQUENCE VOLTAGE AND VOLTAGE UNBALANCE AT BUS 13 ........................... 60 TABLE 55: TWO CASES AT BUS 13 .................................................................................................................................. 60 TABLE 56: SHOWING R PHASE, Y PHASE AND B PHASE VOLTAGE MAGNITUDE VARYING FOR DIFFERENT NEGATIVE SEQUENCE VOLTAGE
ANGLE .............................................................................................................................................................. 61 TABLE 57: SHOWING R PHASE, Y PHASE AND B PHASE VOLTAGE VARYING FOR DIFFERENT NEGATIVE SEQUENCE VOLTAGE ANGLE ...... 62 TABLE 58: SHOWING R PHASE, Y PHASE AND B PHASE VOLTAGE VARYING FOR DIFFERENT NEGATIVE SEQUENCE VOLTAGE ANGLE ..... 63 TABLE 59: ASSUMED LOAD VALUES ................................................................................................................................ 68 TABLE 60: ASSUMED GENERATION OF WIND FARM ............................................................................................................ 68 TABLE 61: SELECTION OF LINE CONDUCTORS .................................................................................................................... 69 TABLE 62: BEAR CONDUCTOR PARAMETERS CALCULATED FOR THE SYSTEM VOLTAGE LEVEL AT 33 KV .......................................... 69 TABLE 63: THREE PHASE TRANSFORMER PARAMETER ASSUMED FOR DATA ENTRY IN IPSA ......................................................... 70 TABLE 64: R, X AND B IN P.U. CALCULATED FOR THREE PHASE LINES AT 33KV ........................................................................ 70 TABLE 65: VALUES OF R AND X.IN P.U. CALCULATED FOR SINGLE PHASE LINE AT 0.230 KV FEEDING URBAN HOUSE ....................... 77

Approximation of Unbalanced load flows using IPSA
Page 7 of 92
Abstract
Steady state voltage unbalance is one of the common problems faced in distribution
networks. Typical power system analysis software such as IPSA is used to perform load flows
based on a three phase balanced system. However it is not possible to perform an
unbalanced load flow using IPSA. This report explains the methodology used to perform
approximate unbalanced load flows using IPSA.
The following steps are performed to get unbalanced load flows using IPSA:
Designing of unbalanced network
Performing load flow
Performing three phase fault at all busses
Using load flow and fault level information
The methodology is implemented in designing of unbalanced network which includes
conversion of unbalanced line impedance into equivalent three phase impedance and design
of single phase line impedance to include neutral impedance in it. Balanced load flow and
fault level information are used in the methodology to obtain unbalanced load flow results.
This report also investigates practical applications of unbalanced load flow analysis
such as the influence of roof mounted solar panel on voltage unbalance and influence of
negative sequence voltage angle on phase voltage magnitudes.
Declaration:
No portion of the work referred to in the dissertation has been submitted in
support of an application for another degree or qualification of this or any other university or
other institute of learning.

Approximation of Unbalanced load flows using IPSA
Page 8 of 92
Copyright
i. The author of this dissertation (including any appendices and/or schedules to this
dissertation) owns certain copyright or related rights in it (the “Copyright”) and s/he has
given The University of Manchester certain rights to use such Copyright, including for
administrative purposes.
ii. Copies of this dissertation, either in full or in extracts and whether in hard or electronic
copy, may be made only in accordance with the Copyright, Designs and Patents Act 1988 (as
amended) and regulations issued under it or, where appropriate, in accordance with
licensing agreements which University has from time to time. This page must form part of
any such copies made.
iii. The ownership of certain Copyright, patents, designs, trademarks and other intellectual
property (the “Intellectual Property”) and any reproductions of copyright works in the
dissertation, for example graphs and tables (“Reproductions”), which may be described in
this dissertation, may not be owned by the author and may be owned by third parties. Such
Intellectual Property and Reproductions cannot and must not be made available for use
without the prior written permission of the owner(s) of the relevant Intellectual Property
and/or Reproductions.
iv. Further information on the conditions under which disclosure, publication and
commercialization of this dissertation, the Copyright and any Intellectual Property and/or
Reproductions described in it may take place is available in the University IP Policy (see
http://documents.manchester.ac.uk/display.aspx?DocID=487), in any relevant Dissertation
restriction declarations deposited in the University Library, The University Library’s
regulations (see http://www.manchester.ac.uk/library/aboutus/regulations) and in The
University’s Guidance for the Presentation of Dissertations.

Approximation of Unbalanced load flows using IPSA
Page 9 of 92
Acknowledgement
I would like to express my sincere gratitude to the following people without whom I
would not have completed my dissertation successfully on time.
My sincere thanks to:
1) Dr. Graeme Bathurst, my industrial supervisor at TNEI who helped and guided me
appropriately with the various technical aspects of my project in spite of his busy
schedule.
2) Dr. P. Mancarella, my academic supervisor whose knowledge and experience
helped me to write a good report. He has helped me with keen interest at all times.
3) My parents, family and friends who have given me moral support and courage
during the course of my dissertation.

Approximation of Unbalanced load flows using IPSA
Page 10 of 92
Chapter 1: Introduction
1.1) Motivation: For a distribution network operator in United Kingdom, the requirement is only to
ensure that the network voltages remain within the limits specified in P29(3). This is typically
ensured by performing occasional measurement checks on voltage unbalance. If a
distribution network operator is using typical power system software like IPSA, then as this is
a balanced load flow program, there is a desire to be able to make simple checks on the
effects of loads on voltage imbalance. Hence there is a significant need to develop a
methodology for using the same software to develop a methodology for using the same
software to estimate the levels of voltage unbalance on a network.
1.2) Overview: Voltage unbalance of a three phase system is defined as “any differences in the three
phase voltage magnitudes and/or shift in the phase separation of the phases from 1200.(1)
Formulas used to determine voltage unbalance:-
1) Voltage unbalance in % = (Additional MVA / Three phase fault level) * 100
2) Approximate definition of voltage unbalance (2)
Voltage unbalance in %= (Maximum voltage deviation from average phase
voltage/average phase voltage) * 100
3) True definition of voltage unbalance(2)
Voltage unbalance in %= (Negative sequence voltage magnitude/ Positive sequence
voltage magnitude) * 100
The limits of voltage unbalance in United Kingdom are as follows (3)
1) Voltage unbalance should not increase beyond 2% for more than one minute time
period.

Approximation of Unbalanced load flows using IPSA
Page 11 of 92
2) In particular, voltage unbalance should not exceed
a) 1.3% for the system with nominal voltage below 33kV.
b) 1 % for the systems with nominal voltage greater than 132kV.
When a power engineer plans and designs a network, the above criteria should be
followed. So to check whether the network is within permissible voltage unbalance level,
unbalanced load flow has to be performed in a designed network. Suitable measures will be
taken if voltage unbalance is not within permissible level.
Methods to reduce voltage unbalance in planning stage are as follows(1)
1) Connection to different supply point.
2) Rearrangement of phase connection.
3) Connection to a higher voltage level.
4) Provision of phase balancing or filtering equipment.
Voltage unbalance generally occurs in a network due to connection of single phase
load, two phase load and unbalanced three phase loads to that network. A common example
of unbalanced loads is traction load and rural loads fed by two phase conductors.
Traction loads are single phase loads at 25kV. From 132kV system, two feeders supply
traction loads through two phase to single phase transformer. Existence of high level of
voltage unbalance in a network is due to traction loads as compared to other loads. This has
been proved from many researches that it is possible to limit voltage unbalance to less than
1% for all unbalanced loads other than traction loads. Traction loads are designed in a way
that it is supplied at various points from different phase pairs in order to reduce the voltage
unbalance caused by it (5).

Approximation of Unbalanced load flows using IPSA
Page 12 of 92
Figure 1: Showing connection of traction loads
In the above figure traction load is supplied by different phase pairs at different supply points
A, B and C.
1.3) Aim and objectives: The aim of this project is to find a methodology to perform approximate unbalanced
load flow using IPSA and prepare a clear guide for that suitable for planning engineers
to use.
Objectives of this project are as follows:
1) To find a methodology for designing of unbalance network in IPSA
2) To find a methodology for using load flow and fault level information to
obtain unbalanced load flow result.
Supplement objective of this project are as follows:
1) To find the influence of negative sequence voltage angle on phase
magnitudes.
2) To find the influence of terrace fixed solar panel on voltage unbalance.

Approximation of Unbalanced load flows using IPSA
Page 13 of 92
Chapter 2: Literature review
2.1) DINIS: Distribution network information system (DINIS)(4) is a software used to perform
unbalanced load flows. The algorithm used in this software uses phase conversion
techniques to perform unbalanced load flow.
DINIS assumes that central spine of the network remains balanced even though
various unbalanced loads are connected to it. This assumption is achieved by converting
unbalanced loads into equivalent three phase model.
2.1.1) Conversion of single phase model to equivalent three phase model: These single phase to three phase conversion equations used in DINIS are derived as follows:
Single phase load power = VPhase * I1Φ = (Vline/√3) * I1Φ ....(1)
Three phase load power = √3 * Vline * I3Φ …. (2)
Equating (1) and (2)
I1Φ = 3 * I3Φ …. (3)
Single phase line voltage drop = √3 * (Z1 + ZN) * I1Φ …. (4)
Three phase line voltage drop = √3 * Z3 * I3Φ …. (5)
Equating (4) and (5) and substituting (3)
3 * (Z1 + ZN) = Z3 …. (6)
Single phase line power loss = I1Φ * I1Φ * (Z1 + ZN) …. (7)
Substituting (3) and (6)
Single phase line power loss = 3 * I3Φ * I3Φ * Z3 = Three phase line power loss …. (8)
The following conversion done by algorithm yields correct results of current, voltage drop
and power loss in a single phase lines. This conversion technique is followed in this project
which is explained in section 3.1 and 3.2
Approximation of Unbalanced load flows using IPSA
Page 14 of 92
1) Equation (6) is used in DINIS algorithm before load flow for conversion of single
phase line and neutral impedance into equivalent three phase line impedance.
2) Equation (3) is used in DINIS algorithm after load flow for conversion of equivalent
three phase current to single phase current.
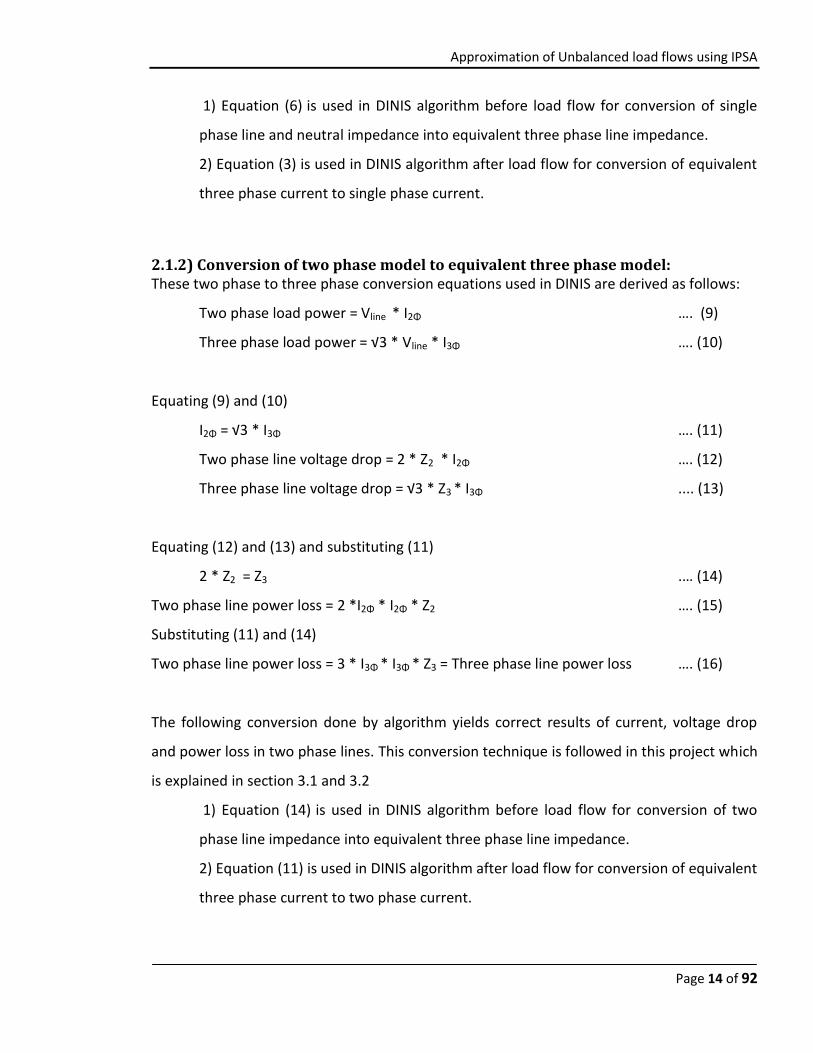
2.1.2) Conversion of two phase model to equivalent three phase model: These two phase to three phase conversion equations used in DINIS are derived as follows:
Two phase load power = Vline * I2Φ …. (9)
Three phase load power = √3 * Vline * I3Φ …. (10)
Equating (9) and (10)
I2Φ = √3 * I3Φ …. (11)
Two phase line voltage drop = 2 * Z2 * I2Φ …. (12)
Three phase line voltage drop = √3 * Z3 * I3Φ .... (13)
Equating (12) and (13) and substituting (11)
2 * Z2 = Z3 .… (14)
Two phase line power loss = 2 *I2Φ * I2Φ * Z2 …. (15)
Substituting (11) and (14)
Two phase line power loss = 3 * I3Φ * I3Φ * Z3 = Three phase line power loss …. (16)
The following conversion done by algorithm yields correct results of current, voltage drop
and power loss in two phase lines. This conversion technique is followed in this project which
is explained in section 3.1 and 3.2
1) Equation (14) is used in DINIS algorithm before load flow for conversion of two
phase line impedance into equivalent three phase line impedance.
2) Equation (11) is used in DINIS algorithm after load flow for conversion of equivalent
three phase current to two phase current.

Approximation of Unbalanced load flows using IPSA
Page 15 of 92
Vline = Line voltage; Vphase = Phase voltage.
I1Φ = Single phase line current; Z1 = Single phase line impedance
I2Φ = Two phase line current; Z2 = Two phase line impedance
I3Φ = Three phase line current; Z3 = Three phase line impedance
These above conversion techniques are followed in this project.
2.2) Penetration of Voltage unbalance throughout the network: This figure 2 shows the method to calculate voltage unbalance for upstream bus and
approximate method to calculate voltage unbalance for downstream bus (5). This
methodology to calculate voltage unbalance is followed in this project. Explanation about
upstream and downstream bus is given in section 3.6.
Figure 2: Showing penetration of voltage unbalance throughout the network (5)
.
Figure 3: Shows clear explanation of table given in the figure 2

Approximation of Unbalanced load flows using IPSA
Page 16 of 92
Chapter 3: Methodology to perform unbalanced load flow in
IPSA:
3.1) Unbalanced network design: IPSA can perform load flow only for three phase balanced system. So if unbalanced
circuit impedance is entered in IPSA it considers it as balanced three phase circuit
impedance. In this condition load flow results obtained will be incorrect. So before doing
load flow it is necessary to convert all unbalanced circuit impedance into equivalent three
phase impedance to get correct load flow results for unbalanced circuits. The following
section describes the conversion that is required depending on the type of unbalanced
circuit.
3.1.1) Two phase two wire system: a) Positive sequence impedance of two phase line * 2 = Equivalent three phase line
impedance for two phase line.
b) Positive sequence susceptance of two phase line * 2 = Equivalent three phase line
susceptance for two phase line.
3.1.2) Single phase two wire system at 230V: a) Susceptance negligible.
b) Since in IPSA there is no option to enter neutral impedance, the following actions
are done:
1) When current flowing through neutral conductor = current flowing through phase
conductor. (Neutral conductor impedance + single phase conductor impedance
=single PhaseN impedance)
Positive sequence impedance of single phaseN line * 3 = Equivalent three
phase line impedance for single phaseN line.

Approximation of Unbalanced load flows using IPSA
Page 17 of 92
2) When Current flowing through neutral conductor ≠ current flowing through single
phase conductor
Positive sequence impedance of single phase line * 3 = Equivalent
three phase line impedance for single phase line.
3.1.3) Two phase to single phase transformer: a) Susceptance negligible.
b) Positive sequence impedance of two phase to single phase transformer * 2
= Equivalent three phase transformer impedance.
3.1.4) Three phase line: a) Three phase positive line impedance and susceptance are directly entered.
Note: Since all the above conversion formulas are obtained by equating unbalanced power
as three phase balanced power (explained in section 2.1.2 and 2.1.2), unbalanced load
power is directly entered in IPSA without any conversion.
3.2) Necessary result conversions: Since the unbalanced circuits impedance are converted to equivalent three phase circuit
impedance, results of current obtained for unbalanced circuit will be in equivalent three
phase current. So the following conversion techniques are used to obtain results of
unbalanced circuit current. This current results obtained are approximate. This is
explained in this chapter in 3.3
a) Results of current obtained for unbalanced lines/loads are multiplied with a factor to
get actual current of unbalanced line/load
1) Equivalent three phase current for two phase line * √2 = Actual Current in two
phase line.
2) Equivalent three phase current for single phase line/load * 3 = Actual Current in
single phase line/load.

Approximation of Unbalanced load flows using IPSA
Page 18 of 92
3.3) Discussion on accuracy of results obtained by approximated method: By converting unbalanced line impedance into equivalent three phase line impedance the
following results obtained from balanced load flow are correct:
a) Voltage drop results at unbalanced circuits obtained are direct results.
1) For single phase line:
Equivalent three phase line voltage drop = Single phase line voltage drop.
Explanation:
Voltage drop obtained for single phase line from IPSA will be equivalent three phase
line voltage drop = √3 * Z3 * I3Φ
Substitute equation (3) and (6) is substituted in above equation then it is proved:
Equivalent three phase line voltage drop = √3 * (Z1 + ZN) * I1Φ = Single phase line
voltage drop.
2) For two phase line:
Equivalent three phase line voltage drop = Two phase line voltage drop.
Explanation:
Voltage drop obtained for two phase line from IPSA will be equivalent three phase
line voltage drop = √3 * Z3 * I3Φ
Substitute equation (11) and (14) is substituted in above equation then it is proved:
Equivalent three phase line voltage drop = 2 * Z2 * I2Φ = Two phase line voltage
drop.
b) Unbalanced line/load current results are obtained as equivalent three phase current
which by using certain conversion will yield actual unbalanced line/load current. This is
explained in this chapter in section 3.2.

Approximation of Unbalanced load flows using IPSA
Page 19 of 92
c) Power loss results at unbalanced circuit obtained are direct results.
1) For single phase line:
Equivalent three phase line power loss = Single phase line power loss.
Explanation:
Power loss in single phase line from IPSA will be equivalent three phase line power
loss = 3 * I3Φ * I3Φ * Z3
Substitute equation (3) and (6) is substituted in above equation then it is proved:
Equivalent three phase line power loss = = I1Φ * I1Φ * (Z1 + ZN) = Single phase line
power loss.
2) For two phase line:
Equivalent three phase line power loss = Two phase line power loss.
Explanation:
Power loss in two phase line from IPSA will be equivalent three phase line power loss
= 3 * I3Φ * I3Φ * Z3
Substitute equation (11) and (14) is substituted in above equation then it is proved:
Equivalent three phase line power loss = 2 *I2Φ * I2Φ * Z2 = Two phase line power
loss.
d) Voltage obtained at all three phase bus are positive sequence voltage.
Note: Results of current, voltage drop and power loss in unbalanced lines obtained are
approximated results because the current results calculated by IPSA will be based on
positive sequence voltage and not phase voltage.
3.4) Three phase fault level information: Three phase fault level at all bus is obtained by applying three phase fault at all bus. Before
applying three phase at all bus, zero sequence impedance for lines and transformers are
entered in IPSA.

Approximation of Unbalanced load flows using IPSA
Page 20 of 92
Significance of fault level information: Fault level information is used to obtain voltage
unbalance by using the following formula
Formula to find Voltage unbalance (%) = (Additional MVA/Fault level) * 100.
3.5) Method to use voltage unbalance (%) formula to find voltage unbalance (%) at all three phase bus:
Figure 4: Showing a simple 10 bus system.
In the figure 4
a) 11kV bus: Bus 3, 6, 8 and 10.
b) 33k V bus: Bus 1, 2, 4, 5, 7 and 9.
c) Unbalance load in bus: 6 and 10.
Unbalance load in bus 6 and 10 will influence voltage unbalance throughout the network.
Steps to find voltage unbalance for any network using above 10 bus network as example:
1) Determine source bus of entire network. In this network ,source bus is bus 1.
2) Determine bus at which unbalance load is connected and that bus is called unbalance
source bus. Unbalance load at bus 6 is called unbalance load black. Unbalance load at bus 10
is called unbalance load brown. Bus 6 is called unbalance load black source bus. Bus 10 is
called unbalance load brown source bus.

Approximation of Unbalanced load flows using IPSA
Page 21 of 92
3) Determine bus at which balance load is connected. In this network bus 3 and 8 has
balanced load.
4) No of unbalance load determines the number of iterations. Two unbalance load in the
network so two iterations.
5) Here in this network one iteration dealing with unbalance load black and other one dealing
with unbalance load brown.
6) From unbalance source bus to source bus, connection path is to be found and tabulated in
same order as the path moves. This has a set of bus and that is called upstream list of bus.
7) Any unbalance load can be taken as first iteration, second iteration and so forth. But each
iteration is carried out separately and results are tabulated separately. In this network,
unbalance load black can be taken as iteration 1 and unbalance load brown can be taken as
iteration 2 (or) unbalance load brown can be taken as iteration 1 and unbalance load black
can be taken as iteration 2.
8) Then for each upstream bus, connection path to balance load is determined as
downstream for that bus and tabulated in the same way as the path moves. This balanced
load must be supplied by that upstream bus.
9) Iteration 1: Unbalanced load black
Table 1: Finding upstream and downstream bus in iteration 1
Upstream bus (Following step 6) Downstream bus (Following step 9)
6 ------
5 ------
4 7
8
2 3
1 9
10

Approximation of Unbalanced load flows using IPSA
Page 22 of 92
10) Iteration 2: Unbalanced load Brown
Table 2: Finding upstream and downstream bus in iteration 2
Upstream bus (Following step 6) Downstream bus (Following step 9)
10 -----
9 -----
1 2
3
4
5
6
7
8
11) Calculating Voltage unbalance:
a) Use Voltage unbalance (%) formula for upstream bus to find voltage unbalance.
b) Additional MVA is the Unbalanced load MVA.
c) For each iteration there will be only one additional MVA.
d) For all upstream bus in an individual iteration additional MVA is same but fault level varies.
e) Assumed voltage unbalance found for each upstream bus will directly come down to their
respective downstream bus .But in reality it is not true. It depends on two following
condition:
1) Condition 1: There will be minor increase in voltage unbalance in downstream bus
compared to upstream bus, if current flowing from upstream bus to downstream bus is
small and impedance between upstream and downstream bus is small.
2) Condition 2: Large increase in voltage unbalance in downstream bus compared to
upstream bus if current flowing from upstream bus to downstream bus is large or
impedance between upstream and downstream bus is large or both.
From the above it is found voltage unbalance in upstream bus will at least increase a little bit
when it comes down to downstream bus.
12) Each iteration results give voltage unbalance at all bus and this voltage unbalance results
due to each iteration is added with the other at every bus. Here in this network there are two

Approximation of Unbalanced load flows using IPSA
Page 23 of 92
iterations so there will be two voltage unbalance result for all three phase bus. So both these
voltage unbalance results are added at each bus.
a) Iteration 1: Unbalance load black - Additional MVA - A
1) Upstream bus voltage unbalance calculation:
Table 3: Calculating voltage unbalance for upstream bus in iteration 1
Upstream bus Fault level Additional MVA Voltage unbalance (%)
6 F6 A V6BLACK =(A/F6)*100
5 F5 A V5BLACK =(A/F5)*100
4 F4 A V4BLACK =(A/F4)*100
2 F2 A V2BALCK =(A/F2)*100
1 F1 A V1BLACK = (A/F1)*100
2) Downstream bus voltage unbalance calculation:
Table 4: Calculating voltage unbalance for downstream bus in iteration 1
Upstream bus Downstream bus Voltage unbalance (%)
6 ----- ------
5 ----- -------
4 7 V4BLACK
8 V4BLACK
2 3 V2BALCK
1 9 V1BLACK
10 V1BLACK
b) Iteration 2: Unbalance load brown – Additional MVA – B
1) Upstream bus voltage unbalance calculation:
Table 5: Calculating voltage unbalance for upstream bus in iteration 2
Upstream bus Fault level Additional MVA Voltage unbalance (%)
10 F10 B V10BROWN =(B/F10) *100
9 F9 B V9BROWN = (B/F9) *100
1 F1 B V1BROWN = (B/F1) *100

Approximation of Unbalanced load flows using IPSA
Page 24 of 92
2) Downstream bus voltage unbalance calculation:
Table 6: Calculating voltage unbalance for downstream bus in iteration 2
Upstream bus Downstream bus Voltage unbalance (%)
10 ---- -----
9 ---- -----
1 2 V1BROWN
3 V1BROWN
4 V1BROWN
5 V1BROWN
6 V1BROWN
7 V1BROWN
8 V1BROWN
Table 4 and 6 shows that voltage unbalance directly comes down from upstream bus to
downstream bus.
c) Final result of voltage unbalance for the network:
Table 7: Calculating final results of voltage unbalance at all bus
Bus Iteration 1 voltage unbalance (%) result
Iteration 2 Voltage unbalance (%) result
Final voltage unbalance (%) result
1 V1BLACK V1BROWN V1BLACK + V1BROWN
2 V2BLACK V1BROWN V2BLACK + V1BROWN
3 V2BLACK V1BROWN V2BLACK + V1BROWN
4 V4BLACK V1BROWN V4BLACK + V1BROWN
5 V5BLACK V1BROWN V5BLACK + V1BROWN
6 V6BLACK V1BROWN V6BLACK + V1BROWN
7 V4BLACK V1BROWN V4BLACK + V1BROWN
8 V4BLACK V1BROWN V4BLACK + V1BROWN
9 V1BLACK V9BROWN V1BLACK + V9BROWN
10 V1BLACK V10BROWN V1BLACK + V10BROWN
3.6) Determining phase voltage at all bus: The following methodology shows how phase voltages can be calculated:
Formulas to find phase voltages:
VR = V0 + V1 + V2 …. (17)
VY = V0 + a2 V1 + a V2 …. (18)
VB = V0 + a V1 + a2 V2 …. (19)

Approximation of Unbalanced load flows using IPSA
Page 25 of 92
For a distribution network zero sequence voltage is generally zero(6).
So the above equation (17), (18) and (19) becomes
Formulas to find phase voltages:
VR = V1 + V2 …. (20)
VY = a2 V1 +a V2 …. (21)
VB = a V1 +a2 V2 …. (22)
In the above equations
a = 1∠120 ; a2 = 1∠240
V1 = Positive sequence voltage = |V1|∠Φ1
V2 = Negative sequence voltage = |V2|∠Φ2
Calculation of phase voltage requires following information:
1) Positive sequence voltage magnitude and its angle
2) Negative sequence voltage magnitude and its angle
1) Significance of balanced load flow in finding phase voltages: It provides information
about positive sequence voltage magnitude and its angle at all bus.
2) Significance of fault level at all bus in finding phase voltages: This information helps in
calculating voltage unbalance. Voltage unbalance and positive sequence voltage magnitude
provides information about negative sequence voltage magnitude.
3) Data required for calculating phase voltages missing: Negative sequence voltage angle is
the data missing. It can’t be obtained by load flow and fault level information.
4) Circuit solving technique used to calculate negative sequence voltage angle

Approximation of Unbalanced load flows using IPSA
Page 26 of 92
Figure 5: Showing network with unbalanced load
Calculation of Negative sequence voltage angle for a bus by circuit solving technique is
explained for the above network as following steps:
1) Calculation of unbalanced currents:
a) For network 1 in the figure 5:
Calculate Ir, Iy1, Iy2 and Ib
b) For network 2 in the figure 5:
Calculate Ir, Iy and Ib
2) Calculation of phase currents:
a) For network 1in the figure 5:
IR = Ir ; IY = Iy1 + Iy2 ; IB = Ib
b) For network 2 in the figure 5:
IR = Ir ; IY = Iy ; IB = Ib
3) Calculate negative sequence current I2∠Φ2 = (IR +a IY +a2 IB)/3

Approximation of Unbalanced load flows using IPSA
Page 27 of 92
4) Negative sequence voltage at bus 1 = V2 ∠Φ2 = I2∠Φ2 * negative sequence impedance
before bus 1
Thus negative sequence voltage angle is found in step 4.
Thus calculation of phase voltage calculated from the following parameters
1) Positive sequence voltage and angle obtained from load flow.
2) Negative sequence voltage magnitude obtained from positive sequence voltage
magnitude and voltage unbalance. Voltage unbalance found from fault level information.
3) Circuit solving technique helps in finding out negative sequence voltage magnitude and
angle. Negative sequence voltage angle is only used from this circuit solving technique.

Approximation of Unbalanced load flows using IPSA
Page 28 of 92
Chapter 4: Designing simple unbalanced distribution network and
performing unbalanced load flow in IPSA.
4.1) Designing network in IPSA:
4.1.1) A small distribution network model: This distribution network model has rural
area and urban area. Rural area includes wind farm, heavy industry, small industry, farms,
and traction load. Urban area includes heavy industry and houses. Unbalance in the network
is caused due to loads like traction load, farms and houses in urban area. This network has its
132 kV side connected to grid which always maintains voltage at 1 P.U.
Figure 6: Showing one line diagram of network designed in IPSA
In this above figure:
1) The numbers specify the busbar number.

Approximation of Unbalanced load flows using IPSA
Page 29 of 92
2) The table below show different colours used to represent the network voltage level.
Table 8: Showing voltage level of the network represented by different colour
Colour representing voltage level Voltage of the network in KV
Black 132
Yellow 43.3
Green 33
Red 11
Brown 0.400
4.1.2) Data entry in IPSA for loads, wind farm and grid: Refer Section A2.1, A2.2 and A2.4 respectively.
4.1.3) Selection of line conductors: Refer section A2.3
4.1.4) Data entry in IPSA for conductors:
a) Three phase lines at 33kV: Refer section A2.6
b) Two phase lines at 33kV:
Conversion of two phase line to equivalent three phase line:
Z in p.u = Z in p.u/km * distance* 2;
B in p.u. = B in p.u/km * distance* 2;
Above formula convert two phase 33kV line as equivalent three phase 33kV line.
Table 9: R, X and B in P.U calculated for two phase lines at 33kV
c) Single phase lines feeding farms at 0.230kV:
Data entry in IPSA for single phase conductor needs the following steps:
1) Designing of neutral impedance.
2) Conversion of single phase line to equivalent three phase line.

Approximation of Unbalanced load flows using IPSA
Page 30 of 92
1) Designing of neutral impedance for farms: Single phase loads have a phase conductor
and neutral conductor. For a three phase balanced condition, current through the neutral
conductor is zero thus in IPSA there is no provision to enter neutral condcutor. For an
unbalanced analysis which is having single phase load there will be current flow through
neutral conductor. So it is a must to enter neutral conductor parameters. Since IPSA does not
support this, a methodology is followed.
Methodology to include neutral conductor parameters in IPSA :
1) Assumed neutral conductor impedance = Phase conductor impedance
Figure 7: Showing distance of both phase conductor and neutral conductor
2) Since neutral conductor impedance and phase conductor impedance are equal, distance of
neutral conductor is added to phase conductor considering the current flow in both these
conductors.
If Current flow in neutral impedance = Current flow in Phase impedance then modification is
done to phase impedance.
Phase impedance = phase impedance + neutral impedance.

Approximation of Unbalanced load flows using IPSA
Page 31 of 92
Figure 8: Showing Current flow in phase and neutral conductor
3) Current flow in phase and neutral conductor
a) current flow in ab(phase conductor) = current flow in jk(neutral condutor) ;
b) current flow in bc(phase conductor) = current flow in ij(neutral condutor);
c) current flow in cd(phase conductor) = current flow in hi(neutral condutor)
From 3):
1) Neutral conductor jk distance is added with phase conductor ab.
2) Neutral conductor ij distance is added with phase conductor bc.
3) Neutral conductor hi distance is added with phase conductor cd.
In this methodology of adding neutral conductor with phase conductor in IPSA considering
distance, current flow and impedance will give the exact voltage drop .
Figure 9: Showing modified phase conductor distance and busbar number

Approximation of Unbalanced load flows using IPSA
Page 32 of 92
2) Conversion of single phase line feeding the farm to equivalent three phase line:
Z in p.u = Z in p.u/km * distance* 3;
This will convert this 230V single line to equivalent three phase 400 v line.
Table 10: Calculated value of R in P.U and X in P.U for single phase line feeding farm at 0.230V.
d) Single phase lines feeding urban houses at 0.230kV:
Conversion of single phase line feeding the urban house into
equivalent three phase line follows the same procedure as the one used for single phase line
feeding the farms. This is explained in section A3.1.
4.1.5) Data entry in IPSA for two phase to single phase transformer: Two phase to single phase transformer is converted into equivalent three phase
transformer by using this formula Z in p.u = Z in P.U. * 2;
Table 11: Conversion of two phase to single phase transformer impedance into equivalent three phase
transformer impedance
All the above calculated R in P.U, X in P.U. and B in P.U. in table are Positive sequence values.
4.1.6) Data entry of zero sequence parameters in IPSA for transformers, lines and
wind farm: Refer section A2.7.
4.1.7) Data entry in IPSA for three phase transformer: Refer section A2.5.

Approximation of Unbalanced load flows using IPSA
Page 33 of 92
4.2) Unbalanced load flow results obtained performing balanced load flow in IPSA: Since the unbalanced circuits are converted into equivalent three phase circuit, by doing
balanced load flow following approximate unbalanced load flow results are obtained.
4.2.1) Unbalanced nodes - busbar voltage and its angle:
Table 12: Busbar voltage at unbalance nodes which is used to find voltage drop in the unbalanced lines
Busbar Voltage in P.U. Angle
13 0.989397 27.393
14 0.989117 27.3558
15 0.988818 57.315-30 = 27.315
16 0.96654 55.5154-30 =25.5154
17 0.964797 55.3617-30 =25.3617
18 0.951956 54.2693-30 =24.2693
19 0.950186 54.1109-30 =24.1109
20 0.94475 53.6319-30 =23.6319
21 0.942967 53.471-30 =23.471
11 0.989519 27.4118
12a 0.989248 27.383
26 1.02501 57.1566
27 1.02333 57.1284
28 1.02319 57.1261
29 1.01997 57.0719
30 1.01983 57.0695
31 1.01829 57.0434
32 1.01815 57.0411
33 1.02108 57.0907
34 1.02092 57.088
35 1.01715 57.0244
36 1.01698 57.0216
37 1.01518 56.991
38 1.01501 56.9882
39 1.01825 57.0434
40 1.01806 57.0403
41 1.01374 56.9672
42 1.01355 56.964
43 1.01148 56.9288
44 1.01129 56.9256
This table 12 is useful in calculating voltage drop in unbalanced lines. In the above table 12
a) Bus 11, 13 and 26 are three phase bus

Approximation of Unbalanced load flows using IPSA
Page 34 of 92
b) Bus 14 and 12a are two phase bus.
c) Bus 12b, 15, 16, 17, 18, 19, 20, 21, 27, 28, 29, 30, 31, 32, 33, 34, 35, 36, 37, 38, 39, 40, 41,
42, 43 and 44 are single phase bus.
Phase shift of two phase to single phase transformer:-
A two phase to single phase transformer is connected between busbar 14-15 and
12a-12b in reality. Two phases to single phase transformer will not give any phase shift. Here
in IPSA two phases to single phase transformer can’t be designed so it is converted into an
equivalent three phase Dy11 (300 phase shift). This conversion is done in terms of impedance
and not in terms of phase shift. So this transformer phase shift should be eliminated. Thus
the voltage angle at bus 15, 16, 17, 18, 19, 20, 21 and 12b is reduced by 300.
4.2.2) Voltage drop in unbalanced lines: Table 13: Voltage drop in unbalanced lines calculated from table 12
Line between busbars Voltage drop ΔV in P.U
13-14 (Two phase line) 0.0007∠93.8 a) Correct result for network design 2. b) Wrong result for network design 1.
14-15 0.000765∠94.33
15-16 0.0379∠80.45
16-17 0.00312∠81.50
16-18 0.0254∠79.93
18-19 0.003165∠80.23
18-20 0.0127∠79.61
20-21 0.00319∠79.62
11-12a (Two phase line) 0.000566∠88.81 a) Correct result for network design 2. b) Wrong result for network design 1.
12a-12b 0.00122∠90.57
26-27 0.00175∠73.84
26-33 0.0041∠73.79
26-39 0.00705∠73.72
27-28 0.000145∠73.47
27-29 0.0035∠73.79
29-30 0.000146∠74.04
29-31 0.00175∠73.84
31-32 0.000146∠73.31
33-34 0.000167∠73.82
33-35 0.0041∠73.76
35-36 0.000177∠73.32

Approximation of Unbalanced load flows using IPSA
Page 35 of 92
Table 14: Voltage drop in unbalanced lines calculated from table 12.
Line between busbars Voltage drop ΔV in P.U
35-37 0.00205∠73.74
37-38 0.000177∠73.25
39-40 0.000197∠73.21
39-41 0.0047∠73.68
41-42 0.000198∠73.55
41-43 0.00235∠73.66
43-44 0.000198∠73.48
Example showing how voltage drop is calculated:
Voltage drop in line between bus 13 and 14: Voltage at bus 13 – voltage at bus 14
= 0.989397∠27.393 – 0.989117∠27.3558 = 0.0007∠93.8.
Note: In table 13 voltage drop result found for two phase lines are correct for network
design 2 and wrong for network design 2. This is explained in detail in section 4.2.6.
4.2.3) Approximate results of Current drawn by unbalanced loads and current flowing in unbalanced lines: Results of current in unbalanced nodes are approximated values because current is
calculated by the software using positive sequence voltage. The current results obtained for
unbalanced lines from balanced load flow in IPSA are the equivalent three phase current for
that unbalanced lines. So this equivalent three phase current are converted to actual
unbalanced current by using conversion formulas which are already explained in section 3.2.
Table 15: Calculated unbalanced load current result
Load type Load in MVA
Phase Voltage in kV= Flat phase voltage in KV * load flow voltage in P.U.
Calculated current in kA =(Load in MVA/phase voltage in kV)
Traction load
1 25 * 0.988695= 24.717 0.04
Farm 1 0.2 0.230 * .964797= 0.222 0.9009
Farm 2 0.2 0.230 * 0.950186 = 0.219 0.913
Farm 3 0.2 0.230 *0.942967= 0.217 0.922
House 1 R 0.006 0.230 *1.02319= 0.235 0.02553
House 2 R 0.006 0.230 *1.01983= 0.235 0.02553

Approximation of Unbalanced load flows using IPSA
Page 36 of 92
Table 16: Calculated unbalanced load current result
Load type Load in MVA
Phase Voltage in kV= Flat phase voltage in KV * load flow voltage in P.U.
Calculated current in kA =(Load in MVA/phase voltage in kV)
House 3 R 0.006 0.230 *1.01815= 0.234 0.02564
House 1 Y 0.007 0.230 *1.02092= 0.235 0.02978
House 2 Y 0.007 0.230 *1.01698= 0.234 0.02991
House 3 Y 0.007 0.230 *1.01501= 0.233 0.03004
House 1 B 0.008 0.230 *1.01806= 0.234 0.03418
House 2 B 0.008 0.230 *1.01355= 0.233 0.03433
House 3 B 0.008 0.230 *1.01129= 0.232 0.03448
Table 17: Obtained Unbalanced load current results
Load type Load current(kA) results obtained from IPSA
Multiplication factor
Actual Load current = Load current(kA) results obtained from IPSA * multiplication factor
Traction load 0.013485 3 0.0404
Farm 1 0.299208 3 0.8976
Farm 2 0.303809 3 0.9114
Farm 3 0.306135 3 0.9184
House 1 R 0.008464 3 0.0254
House 2 R 0.008492 3 0.0255
House 3 R 0.008506 3 0.0255
House 1 Y 0.009896 3 0.0297
House 2 Y 0.009935 3 0.0298
House 3 Y 0.009954 3 0.0299
Table 18: Obtained Unbalanced load current results
Load type Load current(kA) results obtained from IPSA
Multiplication factor
Actual Load current = Load current(kA) results obtained from IPSA * multiplication factor
House 1 B 0.011342 3 0.0340
House 2 B 0.011393 3 0.0342
House 3 B 0.011418 3 0.0343
Table 19: Calculated current in two phase lines
Two phase line connected between busbars
Two phase line supplying load in MVA
Line voltage in KV=flat line voltage in kV * voltage obtained in load flow in P.U.
Calculated current in k A=(Two phase line supplying load in MVA/ Line voltage in kV)
11-12a 1 33 * 0.989519 =32.654 0.030624
13-14 0.600 33 * 0.989397 = 32.650 0.018377

Approximation of Unbalanced load flows using IPSA
Page 37 of 92
Table 20: Obtained Results of Current in two phase lines
Two phase line connected between busbars
Two phase line current (KA) results obtained from IPSA
Multiplication factor
Actual two phase line in kA= Two phase line current (KA) results obtained from IPSA * Multiplication factor
11-12a 0.017574 √2 0.024853 a) Correct result for network design2. b) Wrong result for network design 1.
13-14 0.010849 √2 0.015342 a) Correct result for network design2. b) Wrong result for network design 1.
Table 21: Calculated current in single phase lines
Single phase line connected between busbars
Single phase line supplying load in MVA
Phase voltage in KV=flat phase voltage in kV * voltage obtained in load flow in P.U.
Calculated current in kA=(Single phase line supplying load in MVA/ Phase voltage in kV)
15-16 0.6 0.230 *0.96654 =0.222
2.702
16-17 0.2 0.230 * 0.96480=0.222
0.9009
16-18 0.4 0.230 * 0.95196=0.219
1.826
18-19 0.2 0.230 * 0.95019=0.219
0.9132
18-20 0.2 0.230 * 0.94475=0.217
0.9217
20-21 0.2 0.230 * 0.94296=0.217
0.9217
26-27 0.018 0.230 *1.02333 =0.235
0.0766

Approximation of Unbalanced load flows using IPSA
Page 38 of 92
Table 22: Calculated current in single phase lines
Single phase line connected between busbars
Single phase line supplying load in MVA
Phase voltage in KV=flat phase voltage in kV * voltage obtained in load flow in P.U.
Calculated current in kA=(Single phase line supplying load in MVA/ Phase voltage in kV)
26-33 0.021 0.230 * 1.02108=0.235
0.0894
26-39 0.024 0.230 * 1.01825=0.234
0.1026
27-29 0.012 0.230 * 1.01997=0.235
0.0511
33-35 0.014 0.230 * 1.01715=0.234
0.0598
39-41 0.016 0.230 * 1.01374=0.233
0.0687
27-28 0.006 0.230 * 1.02319=0.235
0.0255
29-30 0.006 0.230 * 1.01983=0.235
0.0255
29-31 0.006 0.230 * 1.01829=0.234
0.0256
31-32 0.006 0.230 * 1.01815=0.234
0.0256
33-34 0.007 0.230 * 1.02092=0.235
0.0298
35-36 0.007 0.230 * 1.01698=0.234
0.0299
35-37 0.007 0.230 * 1.01518=0.234
0.0299
37-38 0.007 0.230 * 1.01501=0.233
0.0300
Table 23: Calculated current in single phase lines
Single phase line connected between busbars
Single phase line supplying load in MVA
Phase voltage in KV=flat phase voltage in kV * voltage obtained in load flow in P.U.
Calculated current in kA=(Single phase line supplying load in MVA/ Phase voltage in kV)
39-40 0.008 0.230 * 1.01806=0.234
0.0342
41-42 0.008 0.230 * 1.01355=0.233
0.0343
41-43 0.008 0.230 * 1.01148=0.233
0.0343

Approximation of Unbalanced load flows using IPSA
Page 39 of 92
Table 24: Calculated current in single phase lines
Single phase line connected between busbars
Single phase line supplying load in MVA
Phase voltage in KV=flat phase voltage in kV * voltage obtained in load flow in P.U.
Calculated current in kA=(Single phase line supplying load in MVA/ Phase voltage in kV)
43-44 0.008 0.230 * 1.01129=0.232
0.0345
Table 25: Obtained Results of current in single phase lines
Single phase line connected between busbars
Single phase line current (KA) results obtained from IPSA
Multiplication factor
Actual two phase line in kA= Single phase line current (KA) results obtained from IPSA * Multiplication factor
15-16 0.909136 3 2.7274
16-17 0.299243 3 0.8977
16-18 0.610012 3 1.8300
18-19 0.303857 3 0.9115
18-20 0.306185 3 0.9186
20-21 0.306191 3 0.9186
26-27 0.025462 3 0.7639
26-33 0.029785 3 0.0894
26-39 0.034153 3 0.1025
27-29 0.016998 3 0.0510
33-35 0.019889 3 0.0597
39-41 0.022811 3 0.0684
27-28 0.008464 3 0.0254
29-30 0.008492 3 0.0255
29-31 0.008506 3 0.0255
31-32 0.008506 3 0.0255
33-34 0.009896 3 0.0297
35-36 0.009935 3 0.0298
35-37 0.009954 3 0.0299
37-38 0.009954 3 0.0299
39-40 0.011342 3 0.0340
41-42 0.011393 3 0.0342
41-43 0.011418 3 0.0343
43-44 0.011418 3 0.0343

Approximation of Unbalanced load flows using IPSA
Page 40 of 92
By comparing table 15 and 16 with 17 and 18, table 19 with 20 and table 21, 22, 23 and 24
with 25 it is clear that:
1) Calculated current for Single phase line/loads ≈ Results of Current in Single phase
line/loads obtained from IPSA * 3.
a) Results of current in single phase line/loads obtained from IPSA is the equivalent
three phase current for single phase line/loads.
b) Actual current in single phase line/loads is the calculated current for single phase
line/loads (or) Equivalent three phase current for single phase line/loads * 3.
2) Calculated current for two phase line ≈ Results of Current in two phase line obtained from
IPSA * √2.
a) Results of current in two phase line obtained from IPSA is Equivalent three phase
current for two phase line.
b) Actual current in two phase line is the calculated current for two phase line (or)
Equivalent three phase current for two phase line * √2.
4.2.4) Results of power loss in unbalance nodes: Power losses in unbalanced lines are directly obtained from balanced load flow which is
explained in detail in section 3.3.
Table 26: Results of power loss in unbalanced line
line/transformer in between busbars
Active power loss in MW (PL)
Reactive power loss in MVAr (QL)
Apparent power loss in MVA (SL = PL +j QL)
13-14 0.00084 -0.043956 0.04396∠-88.90
14-15 0.000071 0.000476 0.00048∠81.51
15-16 0.009092 0.022097 0.02389∠67.64
16-17 0.000246 0.000598 0.00065∠67.64
16-18 0.004093 0.009948 0.01076∠67.64
18-19 0.000254 0.000617 0.00067∠67.63
18-20 0.001031 0.002506 0.00271∠67.64
20-21 0.000258 0.000627 0.00068∠67.63
11-12a 0.000109 -0.021955 0.02196∠-89.71
12a-12b 0.000184 0.001227 0.00124∠81.47
26-27 0.000027 0.000015 0.00003∠29.05
27-28 0.000001 0 0.000001∠0

Approximation of Unbalanced load flows using IPSA
Page 41 of 92
Table 27: Results of power loss in unbalanced line
line/transformer in between busbars
Active power loss in MW (PL)
Reactive power loss in MVAr (QL)
Apparent power loss in MVA (SL = PL +j QL)
27-29 0.000036 0.000020 0.00004∠29.05
29-30 0.000001 0 0.000001∠0
29-31 0.000009 0.000005 0.000001∠29.05
31-32 0.000001 0 0.000001∠0
26-33 0.000075 0.000040 0.000085∠28.07
33-34 0.000001 0.000001 0.0000014∠45
33-35 0.000050 0.000027 0.000027∠28.37
35-36 0.000001 0.000001 0.0000014∠45
35-37 0.000013 0.000027 0.0000015∠28.30
37-38 0.000001 0.000001 0.0000014∠45
26-39 0.000147 0.000079 0.000167∠28.25
39-40 0.000001 0.000001 0.000075∠45
39-41 0.000066 0.000035 0.0000014∠27.94
41-42 0.000001 0.000001 0.000075∠45
41-43 0.000016 0.000009 0.000018∠29.36
43-44 0.000001 0.000001 0.0000014∠45
4.2.5) Results of positive sequence voltage: Balanced load flow for an unbalanced system will give positive sequence voltage.
Table 28: Results of positive sequence voltage at all three phase bus
Three phase bus Positive sequence voltage with its angle
1 (slack bus) 1∠0
2 1.05209∠29.71
3 1.02112∠29.76
4 1.01923∠31.74
5 (generating bus- wind farm) 1.01501∠63.43
6 0.993121∠27.79
7 0.989259∠27.55
8 0.989894∠27.46
9 0.988472∠27.32
10 0.983729∠56.66
11 0.989519∠27.41
13 0.989397∠27.39
22 1.04386∠28.27
23 1.02502∠27.16
24 1.02128∠26.94
25 1.02503∠27.16
26 1.02501∠57.16

Approximation of Unbalanced load flows using IPSA
Page 42 of 92
4.2.6) Voltage drop and current in two phase line depends on two network design: In the network designed in IPSA, rural side network has two unbalanced loads fed by two
phase feeder. Two network designs are assumed depending upon the phase feeding the
loads. These network designs are assumed to study voltage drop and current results
obtained from IPSA in two phase line. The following figure 10 and 11 gives the load
connection.
Figure 10: Showing network design 1
Figure 11: Showing network design 2
Loads supplied in both network designs: Traction load – 1 MVA and Farms – 0.600 MVA
a) Network design 1: Here traction load is supplied by two phase feeder connected to R and
Y phase. Farms are supplied by two phase feeder connected to Y and B phase.
Table 29: Network design 1 loading in MVA at bus 11
Load R phase loading in MVA
Y phase loading in MVA
B phase loading in MVA
Traction load 0.5 0.5 0
Rural farms 0 0.3 0.3
Total load at bus 11
0.5 0.8 0.3

Approximation of Unbalanced load flows using IPSA
Page 43 of 92
Network design 2: Here traction load and farms are supplied by two phase feeder connected
to R and Y phase.
Table 30: Network design 2 loading in MVA at bus 11
Load R phase loading in MVA
Y phase loading in MVA B phase loading in MVA
Traction load 0 0.5 0.5
Rural Farms 0 0.3 0.3
Total load at bus 11 0 0.8 0.8
From table 29 and 30 it is found:
A) Network design 1: Due to different loading of phases at bus 11:
1) Voltage magnitude on R and Y phase at busbar 12a will be different, so current flowing in
these phases will be different and thus voltage drop of these lines also will be different.
2) Voltage magnitude on Y and B phase at busbar 14 will be different, so current flowing in
these phases will be different and thus voltage drop of these lines also will be different.
3) So voltage drop found from IPSA for line between busbar 11-12a and 13-14 are not
correct.
4) Current flowing in lines 11 -12a and 13-14 are not correct.
B) Network design 2: Due to equal loading of two phases Y and B at bus 11:
1) Voltage magnitude on Y and B phase at busbar 12a will be same, so current flowing in
these phases will be same and thus voltage drop of these lines also will be same.
2) ) Voltage magnitude on Y and B phase at busbar 14 will be same, so current flowing in
these phases will be same and thus voltage drop of these lines also will be same.
3) So voltage drop found from IPSA for line between busbar 11-12a and 13-14 are correct.
4) Current flowing in lines 11 -12a and 13-14 are correct.

Approximation of Unbalanced load flows using IPSA
Page 44 of 92
4.3) Applying three phase fault at all bus and using methodology in finding voltage unbalance using fault level information:
Voltage unbalance for the network designed in IPSA is calculated using the method
explained in section 3.5
There are 5 unbalanced loads in the network so there will be 5 iterations.
1) Farms
2) Traction load
3) R phase urban houses
4) Y phase urban houses
5) B phase urban houses
4.3.1) Determining upstream and downstream bus:
a) Iteration 1: Farm load: 0.600 MVA
Table 31: Determining upstream and downstream bus for iteration 1
Upstream bus Downstream bus
13 ------
11 ------
8 9
10
6 7
3 4
5
2 ------
1 22
23
24
25
26
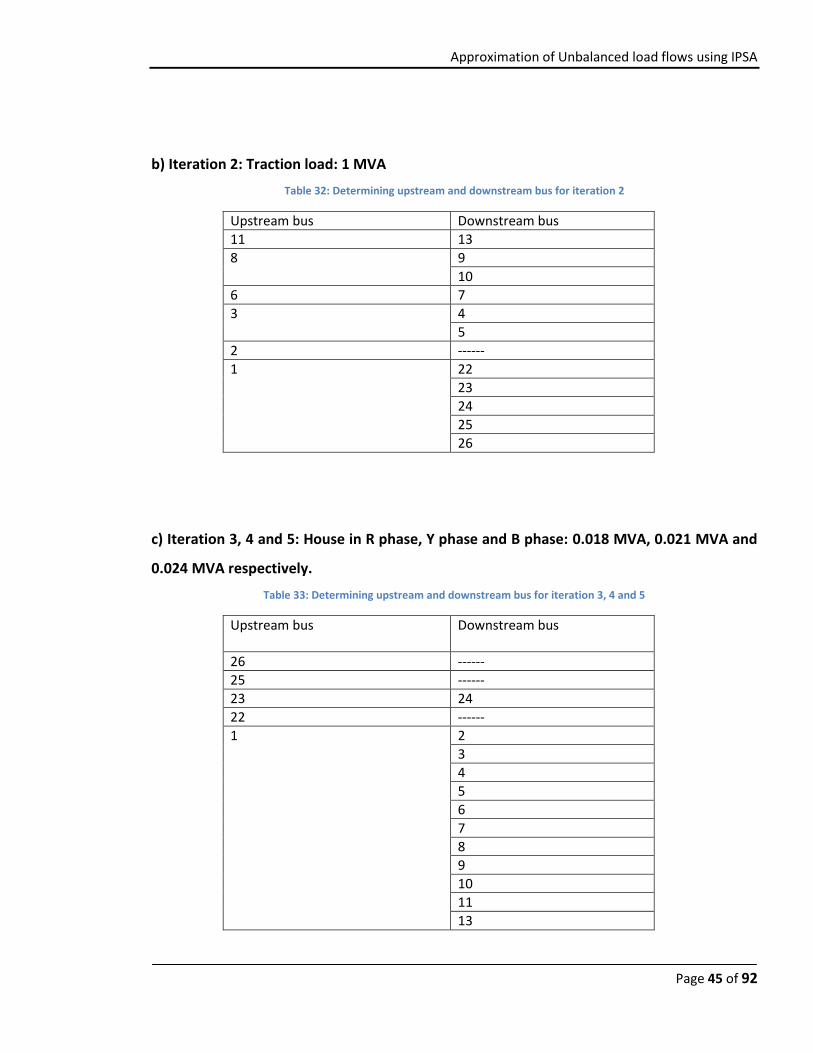
Approximation of Unbalanced load flows using IPSA
Page 45 of 92
b) Iteration 2: Traction load: 1 MVA
Table 32: Determining upstream and downstream bus for iteration 2
Upstream bus Downstream bus
11 13
8 9
10
6 7
3 4
5
2 ------
1 22
23
24
25
26
c) Iteration 3, 4 and 5: House in R phase, Y phase and B phase: 0.018 MVA, 0.021 MVA and
0.024 MVA respectively.
Table 33: Determining upstream and downstream bus for iteration 3, 4 and 5
Upstream bus Downstream bus
26 ------
25 ------
23 24
22 ------
1 2
3
4
5
6
7
8
9
10
11
13

Approximation of Unbalanced load flows using IPSA
Page 46 of 92
4.3.2) Voltage unbalance calculation:
a) Iteration 1: Farm load: Additional MVA: 0.600 MVA
Table 34: Voltage unbalance calculation for upstream bus in iteration 1
Upstream bus Fault level Voltage unbalance (in %) = (additional MVA/fault level) * 100
13 184.813 0.324
11 206.399 0.291
8 233.621 0.257
6 268.222 0.224
Upstream bus Fault level Voltage unbalance (in %) = (additional MVA/fault level) * 100
3 412.825 0.145
2 624.159 0.096
1 1000106.445 0.00005
Table 35: Voltage unbalance calculation for downstream bus in iteration 1
Upstream bus Downstream bus Voltage unbalance (%)
13 ------- ------
11 ------- ------
8 9 0.257
10 0.257
6 7 0.224
3 4 0.145
5 0.145
2 ------- -------
1 22 0.00005
23 0.00005
24 0.00005
25 0.00005
26 0.00005
b) Iteration 2: Traction load: Additional MVA: 1 MVA
Table 36: Voltage unbalance calculation for upstream bus in iteration 2
Upstream bus Fault level Voltage unbalance (in %) = (additional MVA/fault level) * 100
11 206.399 0.484
8 233.621 0.428
6 268.222 0.373
3 412.825 0.242
2 624.159 0.160
1 1000106.445 0.0001

Approximation of Unbalanced load flows using IPSA
Page 47 of 92
Table 37: Voltage unbalance calculation for downstream bus in iteration 2
Upstream bus Downstream bus Voltage unbalance (%)
11 13 0.484
8 9 0.428
10 0.428
6 7 0.373
3 4 0.242
5 0.242
2 ------- -------
1 22 0.0001
23 0.0001
24 0.0001
25 0.0001
26 0.0001
c) Iteration (345): Additional MVA: 0.063 MVA.
Iteration 3, 4 and 5 has same upstream and downstream bus so it is considered as single
iteration (345) by doing the following:
Additional MVA: House in R phase + House in Y phase + House in B phase = 0.018 + 0.021
+ 0.024 = 0.063 MVA.
Table 38: Voltage unbalance calculation for upstream bus in iteration (345)
Upstream bus Fault level Voltage unbalance (%) = (Additional MVA / Fault level) *100
26 202.040 0.0312
25 219.771 0.0287
23 314.210 0.0201
22 532.711 0.0118
1 1000106.443 0.000006
Table 39: Voltage unbalance calculation for downstream bus in iteration (345)
Upstream bus Downstream bus Voltage unbalance (%)
26 ------ -----
25 ------ -----
23 24 0.0201
22 ------ ------

Approximation of Unbalanced load flows using IPSA
Page 48 of 92
Table 40: Voltage unbalance calculation for downstream bus in iteration (345)
Upstream bus Downstream bus Voltage unbalance (%)
1 2 0.000006
3 0.000006
4 0.000006
5 0.000006
6 0.000006
7 0.000006
8 0.000006
9 0.000006
10 0.000006
11 0.000006
13 0.000006
Voltage unbalance calculated in each iteration is tabulated in table 40
Table 41: Results of voltage unbalance in each iteration
Three phase bus
Voltage unbalance (%) due to iteration 1
Voltage unbalance (%) due to iteration 2
Voltage unbalance (%) due to iteration (345)
1 0.00005 0.0001 0.000006
2 0.096 0.160 0.000006
3 0.145 0.212 0.000006
4 0.145 0.212 0.000006
5 0.145 0.212 0.000006
6 0.224 0.373 0.000006
7 0.224 0.373 0.000006
8 0.257 0.428 0.000006
9 0.257 0.428 0.000006
10 0.257 0.428 0.000006
11 0.291 0.484 0.000006
13 0.324 0.484 0.000006
22 0.00005 0.0001 0.0118
23 0.00005 0.0001 0.0201
24 0.00005 0.0001 0.0201
25 0.00005 0.0001 0.0287
26 0.00005 0.0001 0.0312

Approximation of Unbalanced load flows using IPSA
Page 49 of 92
4.3.3) Final results of voltage unbalance in the network:
Table 42: Final results of voltage unbalance at all the bus in the network
Three phase bus Approximated voltage unbalance result (in %) = Voltage unbalance result due to iteration 1 + Voltage unbalance result due to iteration 2 + Voltage unbalance result due to iteration (123)
1 0.000156
2 0.256006
3 0.357006
4 0.357006
5 0.357006
6 0.597006
7 0.597006
8 0.685006
9 0.685006
10 0.685006
11 0.775006
13 0.808006
22 0.011950
23 0.020250
24 0.020250
25 0.028850
26 0.031350
The graph in the figure 12 is plotted using table 42 data.
Figure 12: Graph showing voltage unbalance in the network

Approximation of Unbalanced load flows using IPSA
Page 50 of 92
The black dot in the graph corresponds to three phase bus which is directly connected to
unbalance load. It is clear from the graph that the voltage unbalance is higher in the end of
the network and it starts decreasing towards the beginning of the network.
Urban network comprises bus 22, 23, 24, 25, 26 and main bus (source bus) 1. Here bus 26 has
the highest voltage unbalance and bus 1 has the lowest voltage unbalance.
Rural network comprises bus 2, 3, 4, 5, 6, 7, 8, 9, 10, 11, 13 and main bus 1. Here bus 13 has
the highest voltage unbalance and bus 1 has the lowest voltage unbalance.
4.4) Negative sequence voltage magnitude calculation: Table 43: Calculation of negative sequence voltage magnitude at all three phase bus
Three phase bus |V1| in P.U. Voltage unbalance in % |V2| in P.U.=((|V1| * voltage unbalance in % ) / 100)
1 1 0.000156 0.00000156
2 1.05209 0.256006 0.00269341
3 1.02112 0.357006 0.00364546
4 1.01923 0.357006 0.00363871
5 1.01501 0.357006 0.00362365
6 0.993121 0.597006 0.00592899
7 0.989259 0.597006 0.00590594
8 0.989894 0.685006 0.00678083
9 0.988472 0.685006 0.00677109
10 0.983729 0.685006 0.0067386
11 0.989519 0.775006 0.00766883
13 0.989397 0.808006 0.00799439
22 1.04386 0.011950 0.00012474
23 1.02502 0.020250 0.00020757
24 1.02128 0.020250 0.00020681
25 1.02503 0.028850 0.00029572
26 1.02501 0.031350 0.00032134
4.5) Key points on results obtained: Thus using this methodology, unbalanced load flow results are obtained to a certain
extent. Results for unbalanced load/lines are obtained like current, voltage drop and power
loss. Results of positive sequence voltage, negative sequence voltage angle and voltage
unbalance has been found. One of the important results needed by a distribution network
operator is voltage unbalance in order to have a check whether the system is in safe limits.

Approximation of Unbalanced load flows using IPSA
Page 51 of 92
Chapter 5: Influence of terrace fixed solar panels on the voltage
unbalance at distribution transformer:
5.1) Distribution transformer and its load:
Figure 13: Showing a distribution transformer and its load
In the above network a distribution transformer (Dy11) rated for 250 KVA and 33/0.230 kV
supplies loads in R phase (12 houses), loads in Y phase (18 houses) and loads in B phase (10
houses).
Assuming parameters in the network:
Loads and lines are resistive. Resistance of distribution transformer negligible and resistance
between bus 1 and bus 2 is 1.3 P.U. So resistance between bus 1 and 3 will be R (1-3) = 1.3 P.U.
Voltage at bus 1 is always 1 P.U which is shown in table 39. All houses consumes same
amount of power. System base MVA is 100.
Table 44: Assumed phase voltages at bus 1 in P.U.
VBUS 1 (R) in P.U. VBUS 1 (Y) in P.U. VBUS1 (B) in P.U.
1∠0 1∠-120 1∠120

Approximation of Unbalanced load flows using IPSA
Page 52 of 92
It is assumed that there is off peak period and on peak period for loads as per their
consumption.
Table 45: Showing per house consumption in on and off peak period
Period Per house consumption in KVA
Per house consumption in P.U.
On peak period 5 0.00005
Off peak period 2.5 0.000025
Determining per house consumption in P.U:
Per house consumption in P.U = (Per house consumption in KVA * 10-3)/ (System base MVA)
Loads in each phase in P.U.
Table 46: Showing total load consumption in P.U in each phase at on and off peak period
Phase No of house as loads
On peak period load consumption (S) in P.U. = per house consumption at On peak period in P.U. * no of house
Off peak period load consumption (S) in P.U. = per house consumption at Off peak period in P.U. * no of house
R phase 12 0.00005 * 12 = 0.0006 0.000025 * 12 = 0.00030
Y phase 18 0.00005 * 18 = 0.0009 0.000025 * 18 = 0.00045
B phase 10 0.00005 * 10 = 0.0005 0.000025 * 10 = 0.00025
It is assumed that solar panel of unity power factor output 20 KVA is fixed in terrace of
house.
Solar panel output in P.U. = (solar panel output in KVA * 10-3)/*(system base MVA)
SSOLAR = (0.02/100) = 0.0002 P.U.
Three cases are carried out and analyzed for this network to find the influence of roof
mounted solar panel on voltage unbalance at bus 3.
5.2) Effect on distribution transformer with and without solar panel:
Table 47: Showing three cases to be analyzed understand the effect of solar panel effect on voltage unbalance
Case 1 (Initial condition) Case 2 Case 3
Solar panel not installed in any house
Solar panel of 20 KVA or of 0.0002 P.U. is installed in one of the house in Y phase.
Solar panel of 20 KVA or of 0.0002 P.U. is installed in one of the house in B phase.

Approximation of Unbalanced load flows using IPSA
Page 53 of 92
Figure 14: Showing three cases to be analyzed to understand the effect of solar panel effect on voltage unbalance
Calculation of SR, SY and SB
SR, SY and SB are the power flowing from bus 1 to bus 3:
All values in P.U.
1) SR = SLOAD (R) – SSOLAR (R)
2) SY = SLOAD (Y) – SSOLAR (Y)
3) SB = SLOAD (B) – SSOLAR (B)
Table 48: Calculated SR , Sy and SB in P.U. for three cases
Case Period SR in P.U. SY in P.U. SB in P.U.
Case 1 On peak period 0.0006 0.0009 0.0005
Off peak period 0.0003 0.00045 0.00025
Case 2 On peak period 0.0006 0.0007 0.0005
Off peak period 0.0003 0.00025 0.00025
Case 3 On peak period 0.0006 0.0009 0.0003
Off peak period 0.0003 0.00045 0.00005
Calculation of IR, IY and IB:
All values in P.U.
1) IR = (SR / VFLAT (R))*; VFLAT (R) = 1∠0
2) IY = (SY / VFLAT (Y))*; VFLAT (Y) = 1∠-120

Approximation of Unbalanced load flows using IPSA
Page 54 of 92
3) IB = (SB / VFLAT (B))*; VFLAT (B = 1∠120
The above equation gives approximate result of IR, IY and IB in P.U.
Table 49: Calculated IR, IY and IB in P.U. for three cases
Case Period IR in P.U. IY in P.U. IB in P.U.
Case 1 On peak period 0.0006∠0 0.0009∠-120 0.0005∠120
Off peak period 0.0003∠0 0.00045∠-120 0.00025∠120
Case 2 On peak period 0.0006∠0 0.0007∠-120 0.0005∠120
Off peak period 0.0003∠0 0.00025∠-120 0.00025∠120
Case 3 On peak period 0.0006∠0 0.0009∠-120 0.0003∠120
Off peak period 0.0003∠0 0.00045∠-120 0.00005∠120
Calculate phase voltage VBUS 3 (R), VBUS 3 (Y) and VBUS 3 (B) at bus 3:
All values in P.U.
1) VBUS 3 (R) = VBUS 1 (R) - (IR * R (1-3))
2) VBUS 3 (Y) = VBUS 1 (Y) - (IY * R (1-3))
3) VBUS 3 (B) = VBUS 1 (B) - (IB * R (1-3))
Table 50: Calculated VBUS 3 (R) , VBUS 3 (Y) and VBUS 3 (B) in P.U. at bus 3 for three cases
Case Period VBUS 3 (R) in P.U. VBUS 3 (Y) in P.U. VBUS 1 (B) in P.U.
Case 1 On peak period 0.99922∠0 0.99883∠-120 0.99935∠120 Off peak period 0.99961∠0 0.999415∠-120 0.999675∠120
Case 2 On peak period 0.99922∠0 0.99909∠-120 0.99935∠120 Off peak period 0.99961∠0 0.999675∠-120 0.999675∠120
Case 3 On peak period 0.99922∠0 0.99883∠-120 0.99961∠120
Off peak period 0.99961∠0 0.999415∠-120 0.999935∠120
VACTUAL = VP.U. * VBASE ; VBASE = 230 V
Table 51: Calculated value of VBUS 3 (R), VBUS 3 (Y) and VBUS 3 (B) in Volts at bus 3:
Case Period VBUS 3 (R) in V VBUS 3 (Y) in V VBUS 3 (B) in V
Case 1 On peak period 229.82∠0 229.73∠-120 229.85∠120 Off peak period 229.91∠0 229.86∠-120 229.925∠120
Case 2 On peak period 229.82∠0 229.79∠-120 229.85∠120 Off peak period 229.91∠0 229.925∠-120 229.925∠120
Case 3 On peak period 229.82∠0 229.73∠-120 229.91∠120 Off peak period 229.91∠0 229.86∠-120 229.99∠120
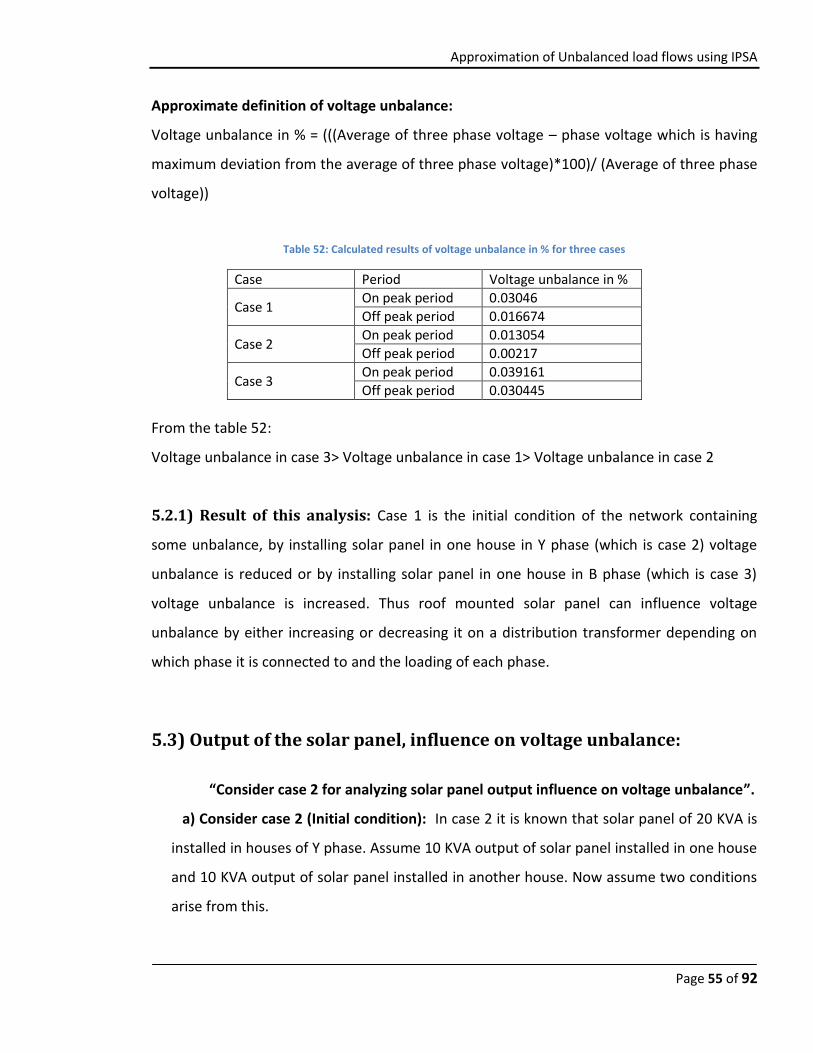
Approximation of Unbalanced load flows using IPSA
Page 55 of 92
Approximate definition of voltage unbalance:
Voltage unbalance in % = (((Average of three phase voltage – phase voltage which is having
maximum deviation from the average of three phase voltage)*100)/ (Average of three phase
voltage))
Table 52: Calculated results of voltage unbalance in % for three cases
Case Period Voltage unbalance in %
Case 1 On peak period 0.03046
Off peak period 0.016674
Case 2 On peak period 0.013054
Off peak period 0.00217
Case 3 On peak period 0.039161
Off peak period 0.030445
From the table 52:
Voltage unbalance in case 3> Voltage unbalance in case 1> Voltage unbalance in case 2
5.2.1) Result of this analysis: Case 1 is the initial condition of the network containing
some unbalance, by installing solar panel in one house in Y phase (which is case 2) voltage
unbalance is reduced or by installing solar panel in one house in B phase (which is case 3)
voltage unbalance is increased. Thus roof mounted solar panel can influence voltage
unbalance by either increasing or decreasing it on a distribution transformer depending on
which phase it is connected to and the loading of each phase.
5.3) Output of the solar panel, influence on voltage unbalance:
“Consider case 2 for analyzing solar panel output influence on voltage unbalance”.
a) Consider case 2 (Initial condition): In case 2 it is known that solar panel of 20 KVA is
installed in houses of Y phase. Assume 10 KVA output of solar panel installed in one house
and 10 KVA output of solar panel installed in another house. Now assume two conditions
arise from this.

Approximation of Unbalanced load flows using IPSA
Page 56 of 92
b) Condition 1: Assume here in phase Y, two more houses install solar panel of 10 KVA
each. Now in phase Y, total output produced by solar panel is 40 KVA.
c) Condition 2: Assume solar panel in one house got repair. So in phase Y total output
produced by solar panel is 10 KVA.
Table 53: Calculated voltage unbalance results for case 2 and its two conditions
Case 2 Output of Solar panel connected in Phase Y
Period |VR| in V |VY| in V |VB| in V Voltage unbalance in %
Degree of voltage unbalance
Initial condition
20 KVA On Peak
period
229.82 229.79 229.85 0.013054
LOW Off peak
period
229.91 229.925 229.925 0.00217
Condition 1
40 KVA On Peak
period
229.82 229.98 229.85 0.04205
HIGH Off peak
period
229.91 229.99 229.925 0.02102
Condition 2
10 KVA On Peak
period
229.82 229.76 229.85 0.021757
MEDIUM Off peak
period
229.91 229.89 229.925 0.007974
The graph below is plotted using data from Table 53.
Figure 15: Graph showing how solar panel output influence voltage unbalance

Approximation of Unbalanced load flows using IPSA
Page 57 of 92
5.3.1) Result of this analysis: From the graph in figure 15 it is clear that optimum output
of solar panel installed in Y phase is 20 KVA because it influences lowest voltage unbalance.
Thus roof mounted solar panel should be selected based on their output before installing in
order to avoid voltage unbalance.
5.4) Roof mounted solar panel influence on phase voltage:
By installing solar panel in a phase, voltage profile at that phase is increased
compared to the one where there is no solar panel. This can be seen from Table 46. It can be
both advantageous and disadvantageous depending upon two conditions. In United Kingdom
distribution supply voltage should be between 230 V -6% to 230 V + 10% .Therefore in each
house in United Kingdom voltage should not exceed 253 V or come below 216.2 V(7).
Considering two conditions which show influence of solar panel on phase voltage:
a) Condition 1: Assume at distribution transformer, at one phase the voltage is at 253 V
due to low load condition.
If a solar panel is installed in that phase then it will increase the voltage above 253 V. This
condition is not accepted in United Kingdom. It is an overvoltage condition caused by roof
mounted solar panel which results in damage to electrical equipment. Thus here solar
panel creates a disadvantage. But mostly at distribution transformer the voltage in any
phase will be less than 1 P.U. So this condition is less likely to occur.
b) Condition 2: Assume at distribution transformer, at one phase the voltage is less than 1
P.U. due to heavy load condition and assume due to this ,the last house in that phase is
supplied only with 215 V. This condition is not accepted in United Kingdom.
If a suitable solar panel is installed in that phase it will increase the voltage profile of that
phase at distribution transformer thus avoiding the chance of voltage becoming less than
the lower limit at that last house of that phase. So here solar panel provides advantage.
5.4.1) Result of this analysis: Roof mounted solar panel increases phase voltage profile in
the phase it is installed, so this result in both advantageous and disadvantageous depending
on the condition mentioned above.

Approximation of Unbalanced load flows using IPSA
Page 58 of 92
Chapter 6: Conclusion
Thus in this project it was found that it is possible to do an unbalanced load flow up to a
certain limit using a balanced power system analysis software such as IPSA with the help of
balanced load flow and fault level information. Thus results calculated are as follows:
1) Approximate Current, Voltage drop and Power loss in unbalance lines.
2) Positive sequence voltage with its angle for all three phase bus.
3) Voltage unbalance in % for all three phase bus.
4) Negative sequence voltage magnitude for all three phase bus.
Results of negative sequence voltage angle are not found in this project but by using circuit
solving technique it can be found. If it is found, then the individual phase voltages in all bus,
individual phase current at three phase load/lines and Voltage drop in three phase lines can
be found.
Future works which can be done to make this unbalanced load flow in IPSA more precise are
as follows:
1) Use the methodology which is discussed in this report for finding negative
sequence voltage angle.
2) To check the accuracy of the results obtained for the network using IPSA in
software which can perform unbalanced load flow.
Apart from unbalanced load flow other analysis done in this project are as follows:
1) It is found Negative sequence voltage angle is strong linked to positive sequence
voltage angle and on three phase voltage magnitudes. .
2) It is found roof mounted solar panel will increase or decrease voltage unbalance at
a distribution transformer depending on the phase it is connected to, loading of each
phase and output of the solar panel. It increases voltage profile in a phase to which it
is connected resulting in both advantage and disadvantage depending on the loading
in that phase.

Approximation of Unbalanced load flows using IPSA
Page 59 of 92
References
1. Electrical consulting and training ltd; Voltage unbalance; Internet:
http://www.elect.com.au/Attachments/Voltage%20Unbalance%20Information%20Sheet.pdf
[August 15, 2011]
2. P. Pillay, M. Manyag, “Definition of voltage unbalance” ;Internet :
http://users.encs.concordia.ca/~pillay/16.pdf May 2001 [August 15,2011]
3.Energy networks association; Planning limits for voltage unbalance in the United Kingdom;
Engineering recommendation P29 1990.
4. Technical info for eng, Analysis routines, Version 6.4 DINIS.
5. Energy networks association; Report on Voltage unbalance due to British Rail AC Traction
supplies; Engineering Technical Report No. 116 1989.
6. Kang Xiaoning, Suonan Jiale, Song Goubing, Fu Wei and Zhiqian Bo; “A novel three phase
load flow algorithm based on symmetrical component for distribution systems”,
Universities Power Engineering Conference, 2008. UPEC 2008. 43rd International.
7. Dti;Electrical Supply Tolerances and Electrical Appliance Safety; Internet:http://www.bis.gov.uk/files/file11548.pdf; Standards and technical regulations directorate July 2005 [August 31,2011]
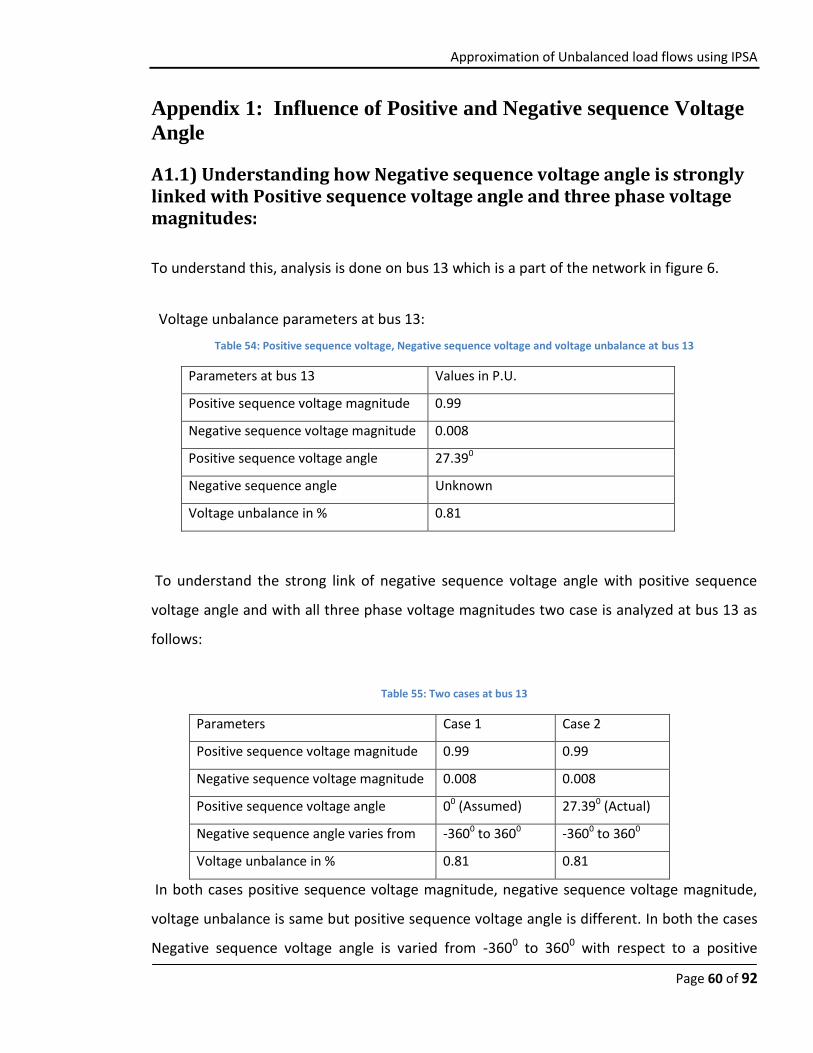
Approximation of Unbalanced load flows using IPSA
Page 60 of 92
Appendix 1: Influence of Positive and Negative sequence Voltage
Angle
A1.1) Understanding how Negative sequence voltage angle is strongly linked with Positive sequence voltage angle and three phase voltage magnitudes:
To understand this, analysis is done on bus 13 which is a part of the network in figure 6.
Voltage unbalance parameters at bus 13:
Table 54: Positive sequence voltage, Negative sequence voltage and voltage unbalance at bus 13
Parameters at bus 13 Values in P.U.
Positive sequence voltage magnitude 0.99
Negative sequence voltage magnitude 0.008
Positive sequence voltage angle 27.390
Negative sequence angle Unknown
Voltage unbalance in % 0.81
To understand the strong link of negative sequence voltage angle with positive sequence
voltage angle and with all three phase voltage magnitudes two case is analyzed at bus 13 as
follows:
Table 55: Two cases at bus 13
Parameters Case 1 Case 2
Positive sequence voltage magnitude 0.99 0.99
Negative sequence voltage magnitude 0.008 0.008
Positive sequence voltage angle 00 (Assumed) 27.390 (Actual)
Negative sequence angle varies from -3600 to 3600 -3600 to 3600
Voltage unbalance in % 0.81 0.81
In both cases positive sequence voltage magnitude, negative sequence voltage magnitude,
voltage unbalance is same but positive sequence voltage angle is different. In both the cases
Negative sequence voltage angle is varied from -3600 to 3600 with respect to a positive

Approximation of Unbalanced load flows using IPSA
Page 61 of 92
sequence voltage angle of that case. Thus by doing this analysis Negative Sequence Voltage
Angle influence and Positive Sequence Voltage Angle influence can be found at bus 13.
A1.1.1) Case 1:
Table 56: Showing R phase, Y phase and B phase voltage magnitude varying for different Negative sequence voltage angle
V1∠Φ1 V2∠Φ2 VR = (V1∠Φ1 + V2∠Φ2)
VY= (a2 * V1∠Φ1 + a * V2∠Φ2)
VB= (a *V1∠Φ1 + a2 *V2∠Φ2)
0.99∠0 0.008∠0 0.9980∠0 0.9860∠-120.40 0.9860∠120.40
0.99∠0 0.008∠1 0.9979∠0.01 0.9861∠-120.40 0.9859∠120.39 0.99∠0 0.008∠59 0.9941∠0.39 0.9939∠-120.40 0.9820∠120.00
0.99∠0 0.008∠60 0.9940∠0.39 0.9940∠-120.39 0.9820∠120
0.99∠0 0.008∠61 0.9939∠0.40 0.9941∠-120.39 0.9820∠119.99 0.99∠0 0.008∠119 0.9861∠0.40 0.9979∠-120 0.9859∠119.60
0.99∠0 0.008∠120 0.9860∠0.40 0.998∠-120 0.9860∠119.59 0.99∠0 0.008∠121 0.9859∠0.39 0.9979∠-119.99 0.9861∠119.59
0.99∠0 0.008∠179 0.9820∠0.01 0.9941∠-119.60 0.9939∠119.59 0.99∠0 0.008∠180 0.9820∠0 0.9940∠-119.60 0.9940∠119.60
0.99∠0 0.008∠181 0.9820∠-0.01 0.9939∠-119.59 0.9941∠119.60 0.99∠0 0.008∠239 0.9859∠-0.39 0.9861∠-119.59 0.9979∠119.99
0.99∠0 0.008∠240 0.9860∠-0.40 0.9860∠-119.59 0.998∠120
0.99∠0 0.008∠241 0.9861∠-0.40 0.9859∠-119.60 0.9979∠120
0.99∠0 0.008∠299 0.9939∠-0.40 0.9820∠-119.99 0.9941∠120.39 0.99∠0 0.008∠300 0.9940∠-0.39 0.982∠-120 0.9940∠120.39
0.99∠0 0.008∠301 0.9941∠-0.39 0.9820∠-120 0.9939∠120.40 0.99∠0 0.008∠359 0.9979∠-0.01 0.9859∠-120.39 0.9861∠120.40
0.99∠0 0.008∠360 0.9980∠0 0.9860∠-120.40 0.9860∠120.40 0.99∠0 0.008∠-1 0.9979∠-0.01 0.9859∠-120.39 0.9861∠120.40 0.99∠0 0.008∠-59 0.9941∠-0.39 0.9820∠-120 0.9939∠120.40
0.99∠0 0.008∠-60 0.9940∠-0.39 0.9820∠-120 0.9940∠120.39 0.99∠0 0.008∠-61 0.9939∠-0.40 0.9820∠-119.99 0.9941∠120.39 0.99∠0 0.008∠-119 0.9861∠-0.40 0.9859∠-119.60 0.9979∠120 0.99∠0 0.008∠-120 0.9860∠-0.40 0.9860∠-119.59 0.998∠120
0.99∠0 0.008∠-121 0.9859∠-0.39 0.9861∠-119.59 0.9979∠119.99 0.99∠0 0.008∠-179 0.9820∠-0.01 0.9939∠-119.59 0.9941∠119.60
0.99∠0 0.008∠-180 0.9820∠0 0.9940∠-119.60 0.9940∠119.60 0.99∠0 0.008∠-181 0.9820∠0.01 0.9941∠-119.60 0.9939∠119.59 0.99∠0 0.008∠-239 0.9859∠0.39 0.9979∠-119.99 0.9861∠119.59 0.99∠0 0.008∠-240 0.9860∠0.40 0.9980∠-120 0.9860∠119.59

Approximation of Unbalanced load flows using IPSA
Page 62 of 92
Table 57: Showing R phase, Y phase and B phase voltage varying for different Negative sequence voltage angle
V1∠Φ1 V2∠Φ2 VR = (V1∠Φ1 + V2∠Φ2)
VY= (a2 * V1∠Φ1 + a * V2∠Φ2)
VB= (a *V1∠Φ1 + a2 *V2∠Φ2)
0.99∠0 0.008∠-241 0.9861∠0.40 0.9979∠-120 0.9859∠119.60 0.99∠0 0.008∠-299 0.9939∠0.40 0.9941∠-120.39 0.9820∠119.99
0.99∠0 0.008∠-300 0.9940∠0.39 0.9940∠-120.39 0.9820∠120 0.99∠0 0.008∠-301 0.9941∠0.39 0.9939∠-120.40 0.9820∠120.00 0.99∠0 0.008∠-359 0.9979∠0.01 0.9861∠-120.40 0.9859∠120.39
0.99∠0 0.008∠-360 0.9980∠0 0.9860∠-120.40 0.9860∠120.40
The graph below plotted using table 56 and 57 data.
Figure 16: Graph Showing Variation of phase voltage magnitude with respect to variation of negative sequence voltage angle (Here positive sequence angle is 0).
The above graph should be a sine wave. It is not completely sinusoidal here because only
some values of negative sequence voltage angle are used for plotting the graph. From this
graph it is found that when negative sequence voltage angle changes with respect to positive
sequence voltage angle three phases voltage magnitude also varies. Thus it shows negative
sequence voltage angle strong link with three phase voltages magnitude (or) three phase
loading.

Approximation of Unbalanced load flows using IPSA
Page 63 of 92
A1.1.1) Case 2:
Table 58: Showing R phase, Y phase and B phase voltage varying for different Negative sequence voltage angle
V1∠Φ1 V2∠Φ2 VR = (V1∠Φ1 + V2∠Φ2)
VY= (a2 * V1∠Φ1 + a * V2∠Φ2)
VB= (a *V1∠Φ1 + a2 *V2∠Φ2)
0.99∠27.39 0.008∠27.39 0.9980∠27.39 0.9860∠-93.01 0.9860∠147.79 0.99∠27.39 0.008∠28.39 0.9979∠27.40 0.9861∠-93.01 0.9859∠147.78 0.99∠27.39 0.008∠86.39 0.9941∠27.78 0.9939∠-93.01 0.9820∠147.39 0.99∠27.39 0.008∠87.39 0.9940∠27.78 0.9940∠-93.01 0.9820∠147.39
0.99∠27.39 0.008∠88.39 0.9939∠27.79 0.9941∠-93 0.9820∠147.38
0.99∠27.39 0.008∠146.39 0.9861∠27.79 0.9979∠-92.61 0.9859∠146.99
0.99∠27.39 0.008∠147.39 0.9860∠27.79 0.998∠-92.61 0.9860∠146.98 0.99∠27.39 0.008∠148.39 0.9859∠27.78 0.9979∠-92.6 0.9861∠146.98
0.99∠27.39 0.008∠206.39 0.9820∠27.40 0.9941∠-92.21 0.9939∠146.98 0.99∠27.39 0.008∠207.39 0.9820∠27.39 0.9940∠-92.21 0.9940∠146.99
0.99∠27.39 0.008∠208.39 0.9820∠27.38 0.9939∠-92.2 0.9941∠146.99 0.99∠27.39 0.008∠266.39 0.9859∠27 0.9861∠-92.2 0.9979∠147.38
0.99∠27.39 0.008∠267.39 0.9860∠26.99 0.9860∠-92.2 0.998∠147.39 0.99∠27.39 0.008∠268.39 0.9861∠26.99 0.9859∠-92.21 0.9979∠147.39 0.99∠27.39 0.008∠326.39 0.9939∠26.99 0.9820∠-92.6 0.9941∠147.78
0.99∠27.39 0.008∠327.39 0.9940∠27 0.982∠-92.61 0.9940∠147.78 0.99∠27.39 0.008∠328.39 0.9941∠27 0.9820∠-92.61 0.9939∠147.79
0.99∠27.39 0.008∠386.39 0.9979∠27.38 0.9859∠-93 0.9861∠147.79
0.99∠27.39 0.008∠387.39 0.9980∠27.39 0.9860∠-93.01 0.9860∠147.79 0.99∠27.39 0.008∠26.39 0.9979∠27.38 0.9859∠-93 0.9861∠147.79
0.99∠27.39 0.008∠-31.61 0.9941∠27 0.9820∠-92.61 0.9939∠147.79 0.99∠27.39 0.008∠-32.61 0.9940∠27 0.9820∠-92.61 0.9940∠147.78
0.99∠27.39 0.008∠-33.61 0.9939∠26.99 0.9820∠-92.6 0.9941∠147.78
0.99∠27.39 0.008∠-91.61 0.9861∠26.99 0.9859∠-92.21 0.9979∠147.39 0.99∠27.39 0.008∠-92.61 0.9860∠26.99 0.9860∠-92.2 0.998∠147.39
0.99∠27.39 0.008∠-93.61 0.9859∠27 0.9861∠-92.2 0.9979∠147.38 0.99∠27.39 0.008∠-151.61 0.9820∠27.38 0.9939∠-92.2 0.9941∠146.99 0.99∠27.39 0.008∠-152.61 0.9820∠27.39 0.9940∠-92.21 0.9940∠146.99
0.99∠27.39 0.008∠-153.61 0.9820∠27.40 0.9941∠-92.21 0.9939∠146.98
0.99∠27.39 0.008∠-211.61 0.9859∠27.78 0.9979∠-92.6 0.9861∠146.98
0.99∠27.39 0.008∠-212.61 0.9860∠27.79 0.9980∠-92.61 0.9860∠146.98 0.99∠27.39 0.008∠-213.61 0.9861∠27.79 0.9979∠-92.61 0.9859∠146.99 0.99∠27.39 0.008∠-271.61 0.9939∠27.79 0.9941∠-93 0.9820∠147.78
0.99∠27.39 0.008∠-272.61 0.9940∠27.78 0.9940∠-93 0.9820∠147.39 0.99∠27.39 0.008∠-273.61 0.9941∠27.78 0.9939∠-93.01 0.9820∠147.39 0.99∠27.39 0.008∠-331.61 0.9979∠27.40 0.9861∠-93.01 0.9859∠147.78
0.99∠27.39 0.008∠-332.61 0.9980∠27.39 0.9860∠-93.01 0.9860∠147.79

Approximation of Unbalanced load flows using IPSA
Page 64 of 92
The graph below plotted using table 58 data.
Figure 17: Variation of phase voltage magnitude with respect to variation of negative sequence voltage angle (Here positive sequence angle is 27.39)
The above graph should be a sine wave. It is not completely sinusoidal here because only
some values of negative sequence voltage angle are used for plotting the graph. From this
graph it is found that when negative sequence voltage angle changes with respect to positive
sequence voltage angle three phases voltage magnitude also varies. Thus it shows negative
sequence voltage angle strong link with three phase voltage magnitude (or) three phase
loading.
A1.2) Analysis results: a) By comparing table 56 and 57 with 58 it is found that positive sequence voltage angle
shifts by a value “z” then negative sequence voltage angle, R phase voltage angle, Y phase
voltage angle and B phase voltage angle also shifts by that value “z”. Thus it shows negative
sequence voltage angle is strongly linked with positives sequence voltage angle.
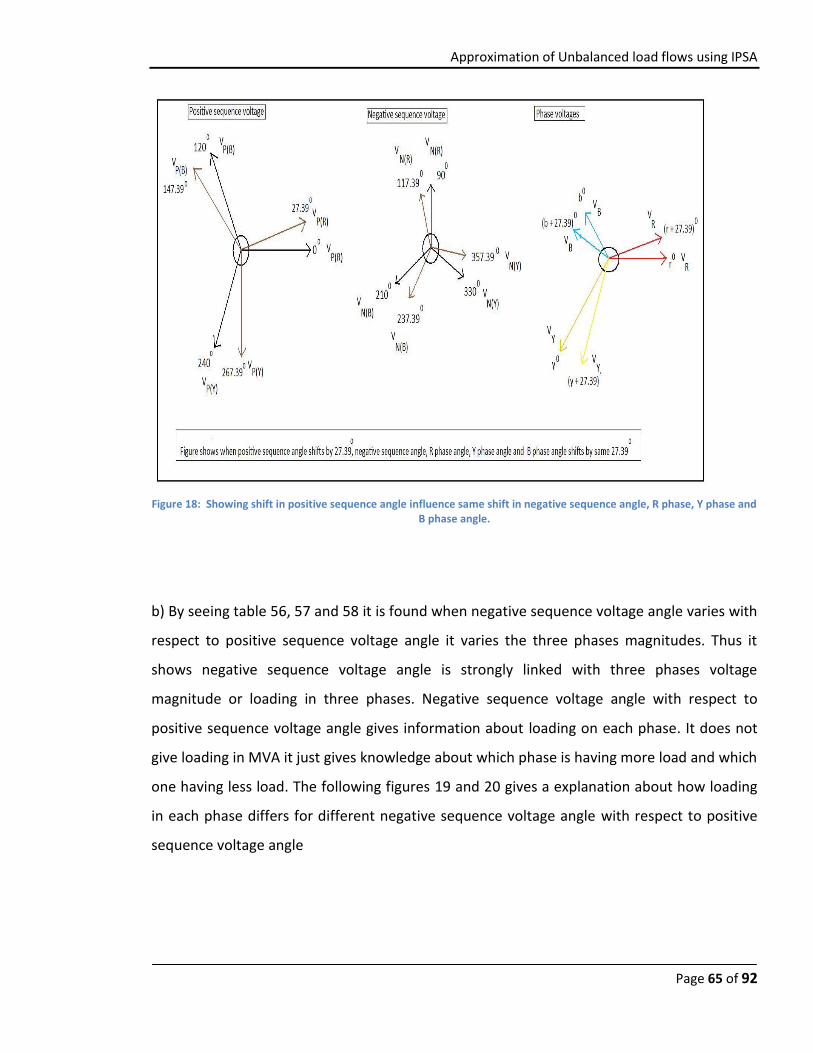
Approximation of Unbalanced load flows using IPSA
Page 65 of 92
Figure 18: Showing shift in positive sequence angle influence same shift in negative sequence angle, R phase, Y phase and B phase angle.
b) By seeing table 56, 57 and 58 it is found when negative sequence voltage angle varies with
respect to positive sequence voltage angle it varies the three phases magnitudes. Thus it
shows negative sequence voltage angle is strongly linked with three phases voltage
magnitude or loading in three phases. Negative sequence voltage angle with respect to
positive sequence voltage angle gives information about loading on each phase. It does not
give loading in MVA it just gives knowledge about which phase is having more load and which
one having less load. The following figures 19 and 20 gives a explanation about how loading
in each phase differs for different negative sequence voltage angle with respect to positive
sequence voltage angle

Approximation of Unbalanced load flows using IPSA
Page 66 of 92
Figure 19: Showing phase voltage magnitudes varies when negative sequence voltage angle varies from 00 to 360
0
Figure 20: Showing phase voltage magnitudes varies when negative sequence voltage angle varies from 00 to -360
0
Note: If a phase voltage magnitude is maximum compared to other phase means then
loading in that phase is minimum compared to other phase and vice versa.
In figure 19 when
Positive sequence voltage angle = 00; Negative sequence angle = (610 – 1190)

Approximation of Unbalanced load flows using IPSA
Page 67 of 92
Then VY > VR > VB (or) Loading in B phase > Loading in R phase > Loading in Y phase.
Thus for a bus if negative sequence voltage angle with respect to positive sequence voltage
angle is known, then from the above figure loading of that bus can be found.

Approximation of Unbalanced load flows using IPSA
Page 68 of 92
Appendix 2: Data entry in IPSA
A2.1) Data entry in IPSA for load:
Table 59: Assumed load values
A2.2) Data entry in IPSA for wind farm:
Table 60: Assumed generation of wind farm
S.NO Generation type
Real power(MW)
Power factor(cosΦ)
Apparent power(MVA)
Maximum reactive power(MVAr)
Minimum reactive power(MVAr)
1 Wind farm (10 wind turbines)
25 0.98 25.51 5.0764 -5.0764
S.NO Load type Apparent power(MVA)
Power factor(cosΦ)
Real power(MW)
Reactive power(MVAr)
1 Heavy industry
20 0.85 17 10.5356
2 Small industry
10 0.95 9.5 3.1224
3 Traction load
1 0.95 0.95 0.312
4 Farm 0.2 0.98 0.196 0.0398
5 Urban house (R phase)
0.006 0.98 0.00588 0.001194
6 Urban house (Y phase)
0.007 0.98 0.006860 0.001392
7 Urban house (B phase)
0.008 0.98 0.007840 0.001592

Approximation of Unbalanced load flows using IPSA
Page 69 of 92
Wind farm uses doubly fed induction generator. There are 10 parallel generating wind
turbines. IPSA does not have induction generator it has normal synchronous generator.
So for data entry in IPSA, synchronous generator parameters in IPSA database are used, but
the active power and reactive power values are entered as calculated.
A2.3) Selection of line conductors: Conductors are chosen approximately based on the current they carry and voltage levels of
the network at which they are there. Current ratings of the conductor (maximum current
carrying capacity of the conductor) used is much more than the current it carries originally.
Table 61: Selection of line conductors
Conductor used MVA rating
R in P.U/Km X in P.U/Km B in P.U/Km
42kV Bear 73 3310*10-6 17000*10-6 70*10-6
Trefoil 400 V 18*800mm
0.854 3.81932 9.28288 0
400 V 3C 300Al 0.243 73.016 39.1667 0
In the above table 61 all values are at 100 MVA base and its own voltage rating.
Since Bear conductor R (in P.U/Km), X (in P.U/Km) and B (in P.U/Km) is at 42 kV rating it has
to be converted to 33kV network voltage level.
Formula used:
1) Znew (in P.U/Km) = Zold (in P.U/Km) *(KVOLD/kVNEW)2 *(MVANEW/MVAOLD)
2) Bnew (in P.U/Km) = Bold (in P.U/Km) *(KVOLD/kVNEW)2 *(MVANEW/MVAOLD)
Table 62: Bear conductor parameters calculated for the system voltage level at 33 kV
Rnew (in P.U/Km) Xnew (in P.U/Km) Bnew (in P.U/Km)
0.00536165 0.02753719
0.000113388
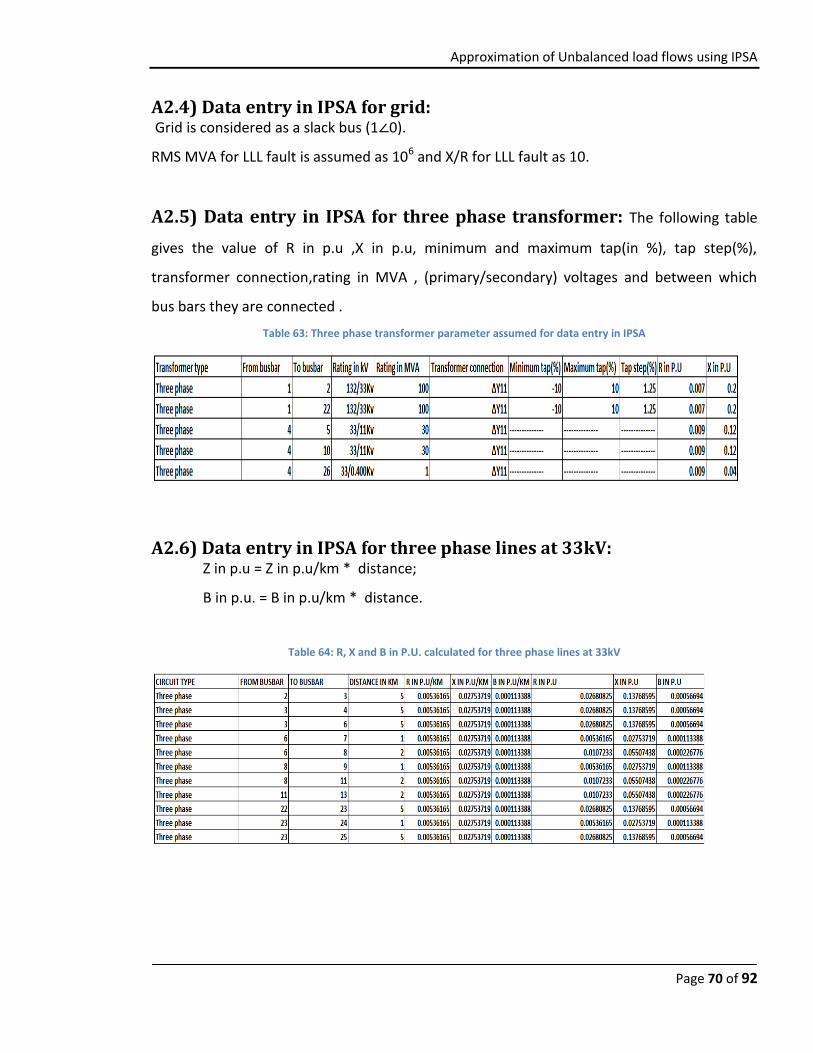
Approximation of Unbalanced load flows using IPSA
Page 70 of 92
A2.4) Data entry in IPSA for grid: Grid is considered as a slack bus (1∠0).
RMS MVA for LLL fault is assumed as 106 and X/R for LLL fault as 10.
A2.5) Data entry in IPSA for three phase transformer: The following table
gives the value of R in p.u ,X in p.u, minimum and maximum tap(in %), tap step(%),
transformer connection,rating in MVA , (primary/secondary) voltages and between which
bus bars they are connected .
Table 63: Three phase transformer parameter assumed for data entry in IPSA
A2.6) Data entry in IPSA for three phase lines at 33kV: Z in p.u = Z in p.u/km * distance;
B in p.u. = B in p.u/km * distance.
Table 64: R, X and B in P.U. calculated for three phase lines at 33kV

Approximation of Unbalanced load flows using IPSA
Page 71 of 92
A2.7) Data entry of zero sequence parameters in IPSA for transformers, lines and wind farm: Assuming:
1) For line conductor: zero sequence Z and B in P.U = positive sequence Z and B in P.U
respectively.
2) For transformer: zero sequence Z and B in P.U = 0.85 * positive sequence Z and B in
P.U respectively.
3) For wind farm: Positive and zero sequence impedance of synchronous machine taken
from IPSA data base.

Approximation of Unbalanced load flows using IPSA
Page 72 of 92
Appendix 3: Data entry of a single phase line at 0.230kV feeding
urban houses in IPSA:
A3.1) Data entry in IPSA for single phase conductor needs the following steps:
A3.1.1) Designing of neutral impedance.
A3.1.2) Conversion of single phase line to equivalent three phase line.
A3.1.1) Designing of neutral impedance: Single phase loads have a phase conductor and
neutral conductor. For a three phase balanced condition, current through the neutral
conductor is zero thus in IPSA there is no provision to enter neutral condcutor. For an
unbalanced analysis which is having single phase load there will be current flow through
neutral conductor. So it is a must to enter neutral conductor parameters. Since IPSA does not
support this, a methodology is followed.
Methodology to include neutral conductor parameters in IPSA :
1) Assumed neutral conductor impedance = Phase conuctor impedance
Figure 21: Showing urban houses connected to three different phase and different nodes of each phase

Approximation of Unbalanced load flows using IPSA
Page 73 of 92
Figure 22: Showing distance between houses
Figure 23: Showing distance between houses in R, Y and B phase
2) Since neutral conductor impedance and phase conductor impedance are equal,
distance of neutral conductor is added to phase conductor considering the current flow in
both these conductors.

Approximation of Unbalanced load flows using IPSA
Page 74 of 92
If Current flow in neutral impedance = Current flow in Phase impedance then
Then modification done to phase impedance.
Phase impedance = phase impedance + neutral impedance.
Figure 24: Showing current flow from each phase conductor through neutral conductor.

Approximation of Unbalanced load flows using IPSA
Page 75 of 92
3) Current flow in R phase and neutral conductor:
current flow in a(R)b(R)(phase conductor) = current flow in N1N2(neutral condutor) ;
current flow in b(R)c(R)(phase conductor) = current flow in N2N5(neutral condutor);
current flow in c(R)d(R)(phase conductor) = current flow in N5N8(neutral condutor)
4) Current flow in Y phase and neutral conductor:
current flow in a(Y)b(Y)(phase conductor) = current flow in N1N3(neutral condutor) ;
current flow in b(Y)c(Y)(phase conductor) = current flow in N3N6(neutral condutor);
current flow in c(Y)d(Y)(phase conductor) = current flow in N6N9(neutral condutor)
5) Current flow in B phase and neutral conductor:
current flow in a(B)b(B)(phase conductor) = current flow in N1N4(neutral condutor) ;
current flow in b(B)c(B)(phase conductor) = current flow in N4N7(neutral condutor);
current flow in c(B)d(B)(phase conductor) = current flow in N7N10(neutral condutor)
From 3), 4) and 5):
A) In R phase:
1) Neutral conductor N1N2 distance is added with phase conductor a(R)b(R).
2) Neutral conductor N2N5 distance is added with phase conductor b(R)c(R).
3) Neutral conductor N5N8 distance is added with phase conductor c(R)d(R).
B) In Y phase:
1) Neutral conductor N1N3 distance is added with phase conductor a(Y)b(Y).
2) Neutral conductor N3N6 distance is added with phase conductor b(Y)c(Y).
3) Neutral conductor N6N9 distance is added with phase conductor c(Y)d(Y).

Approximation of Unbalanced load flows using IPSA
Page 76 of 92
c) In B phase:
1) Neutral conductor N1N4 distance is added with phase conductor a(B)b(B).
2) Neutral conductor N4N7 distance is added with phase conductor b(B)c(B).
3) Neutral conductor N7N10 distance is added with phase conductor c(B)d(B).
Figure 25: Showing modified phase conductors distance and busbar number

Approximation of Unbalanced load flows using IPSA
Page 77 of 92
A3.1.2) Conversion of single phase line to equivalent three phase line: Z in p.u = Z in p.u/km * distance* 3;
This above formula will convert this 230V sinlge phase line to equivalent three phase 400 V
line.
Table 65: Values of R and X.in P.U. calculated for single phase line at 0.230 kV feeding urban house

Approximation of Unbalanced load flows using IPSA
Page 78 of 92
Appendix 4: Feasibility report
ABSTRACT
One of the problems which is faced in distribution systems is steady state voltage unbalance .This problem is due to either three phase unbalanced loads and single or two phase 11 kV spur lines which feeds the rural loads or traction loads on 132 kV network. Planning and designing of a distribution network is important before installing a real distribution network. Three phase balanced load flow analysis is a method used in planning, designing and operation of network which helps to identify power flow ,voltage and its angles at nodes, current and its angles to ensure equipment is within ratings and voltage are within limits. So by finding voltage unbalance in the network using load flow analysis, suitable changes can be done in the network like rearrangement of phase connections, using phase balancing equipment etc to reduce it [1]. IPSA is software which can be used to run a three phase balanced load flow analysis. By introducing some input data to IPSA using certain approximations and formulas, estimations of unbalance load flow results can be achieved. This approximated result is compared with accurate results obtained from a three phase unbalanced load flow analysis software Rectic master to find accuracy of IPSA approximations.

Approximation of Unbalanced load flows using IPSA
Page 79 of 92

Approximation of Unbalanced load flows using IPSA
Page 80 of 92
1. Introduction
1.1. Overview
One of the important works for power system engineers is to plan and design a network to make it a real efficient network which is reliable and secured. Planning and designing of network include minimize power loss, reduce voltage unbalance, reduce cost (investment, operation and maintenance cost), enhance reliability of supply by reducing power outages, operational constraints etc [2].
Different softwares are used for planning and designing of power system network based on their accuracy of result, features and cost. Accuracy of results is important in power system. Softwares are updated to improve its accuracy and to bring some new techniques in it. Load flow analysis is used for planning, designing and operation purposes in power system. This is one of the features in software like IPSA, Rectic master, DigSilent powerfactory, Etap, PSS®, DINIS etc. IPSA can perform only three phase balanced load flow but by using some approximations and manual calculations, three phase unbalance load flow is also possible. These approximations are initially proposed by Mr. N Little, South Wales Electricity [4]. DINIS has these approximations inbuilt in it [4].This project is about to have a check on accuracy of approximations which could be used in IPSA by comparing its result with accurate result.
Voltage unbalance of a three phase system is defined as “magnitude of at least one phase voltage is not within the acceptable limits of nominal voltage” [3]. Problem due to voltage unbalance result in malfunctioning of three phase equipments, damage of equipments, unbalance single phase loadings and fault on one of the phases.
Voltage unbalance is generally caused by unbalanced three phase loads, single phase loads and two phase loads connected to a three phase network. By estimating the voltage unbalance and other electrical parameters in the network in designing stage it will be easier to understand in which place of the network unbalance is high and thus designing the system according to that problem.
Limits of voltage unbalance in United Kingdom are as follows [1]:
a) Voltage unbalance should not increase beyond 2% for more than one minute time period.
b) In particular, voltage unbalance should not exceed
1) 1.3% for systems with Nominal voltage below 33kV.
2) 1% for systems with Nominal voltage no greater than 132kV.

Approximation of Unbalanced load flows using IPSA
Page 81 of 92
In order to calculate voltage unbalance, knowledge of system impedance and network loading is needed. In United Kingdom for distribution network operators, the requirement is only an occasional check on voltage unbalance. Therefore there is a significant attraction to being able to make a simple and reasonably accurate assessment based on around typical load flow and fault level information.
1.2. Objective
Objective of this project are as follows:
1) The main focus of this project is to find approximated methods for calculation of voltage unbalance for a three phase unbalance distribution network using IPSA and check its accuracy against results obtained from Rectic master.
2) Prepare a clear guide to approximating unbalanced analysis with a balanced load flow in IPSA.
Supplement objective of this project is: To perform an investigation of unbalance on a large real distribution network.
2. Literature review
2.1 General review: Nowadays power system distribution network has become more
complex so there is a higher demand for efficient and reliable system operation [6]. Due to this more complexity in the power system distribution network, unbalance in the network increases which affects the efficiency and reliability of the network. Load flow algorithms are the one which helps to indentify voltage unbalance thus by providing suitable idea for planning and designing and thus operating network within the specified voltage limits. Due to increasing complexity of power system there is a significant arise in interest among engineers to develop unbalanced load flow algorithms. Some of the algorithms are used in softwares because of their adequate accuracy and good speed.
Three- phase fast decoupled method [7], decomposed three phase power flow algorithm using sequence component frame [8], novel three phase load flow algorithm based on symmetrical components [9] etc are some of the algorithms used to perform an unbalanced load flow.

Approximation of Unbalanced load flows using IPSA
Page 82 of 92
2.2 Voltage unbalance Degree of voltage unbalance is expressed by the ratio (in
percent) between rms values of the negative sequence component and the positive sequence component of the voltage [1].
Voltage unbalance % = (Negative sequence voltage/Positive sequence voltage) * 100% [10].
Voltage unbalance caused due to unbalanced three phase loads or phase to phase loads can be found by using the formula [1]:
.
*100%
Voltage unbalance caused due to single phase load connected between phases can be found by using the formula [1]:
*100%
Voltage unbalance %= (Additional MVA/Fault level (MVA)) *100% [5]
So the above formulas can be used in the project if needed.
2.3 Unbalance loads Mainly unbalance is caused by single phase loads (for example
traction loads), two phase loads (for example 2N spur lines supply to rural areas) and three phase unbalanced loads.
Single phase loads are connected in two configurations
A) Single wire earth return
B) Single phase supply
Two phase loads are connected in two configurations
A) Two phase supplies
B) Two phase –Neutral supplies (2N)
2.4 Traction loads Traction loads are responsible for existence of high voltage unbalance in
the network compared to other unbalance loads. It is because from many research it has been found that it is possible to limit voltage unbalance less than 1% for all unbalance loads other than single phase traction loads [5]. So it is essential that traction loads must be modeled properly in order to reduce voltage unbalance caused due to it.
The 25kV traction load is usually connected at 132kV system. This traction system is usually connected from two single phase transformer each connected across two phases. Traction loads are designed in a way it is connected at various points from different phase pairs in order to maintain balanced condition in three phase network during normal operation [5].

Approximation of Unbalanced load flows using IPSA
Page 83 of 92
If in case there is a voltage unbalance in certain areas due to traction loads it is avoided by connecting a phase balancer at distribution voltage side busbar [5].If there are large number of 11kV or 33kV loads near traction load it is better to connect phase balancer in 132 kV system in order to avoid usage of large number of balancers.

Approximation of Unbalanced load flows using IPSA
Page 84 of 92
2.5 DINIS Distribution network information system [4] is software used to perform
unbalanced load flow. In this software algorithm certain approximation and phase conversion techniques are used. These phase conversion techniques are used and done manually in this project.
A simple approximation analysis is carried out in DINIS, by making an assumption that, the three phase core network which is the central spine of the system remains sensibly balanced with various unbalanced load connected to it.
The phase conversion techniques used in DINIS are as follows:
V = line volts
Z3Φ1 =Three phase positive sequence line impedance
Z2Φ1 =Two phase positive sequence line impedance
Z1Φ1 =Single phase positive sequence line impedance
ZS1 = SWER positive sequence line impedance
Z2N1 = 2N spur lines positive sequence line impedance
ZE =earth impedance
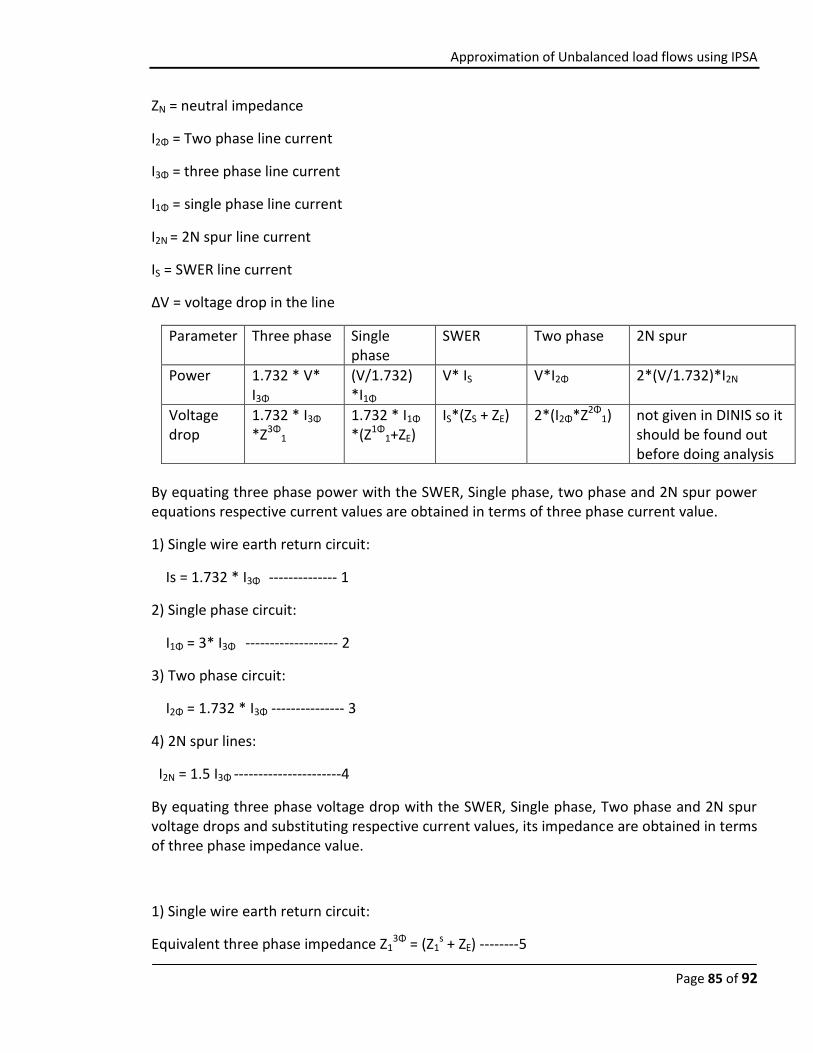
Approximation of Unbalanced load flows using IPSA
Page 85 of 92
ZN = neutral impedance
I2Φ = Two phase line current
I3Φ = three phase line current
I1Φ = single phase line current
I2N = 2N spur line current
IS = SWER line current
ΔV = voltage drop in the line
Parameter Three phase Single phase
SWER Two phase 2N spur
Power 1.732 * V* I3Φ
(V/1.732) *I1Φ
V* IS V*I2Φ 2*(V/1.732)*I2N
Voltage drop
1.732 * I3Φ
*Z3Φ1
1.732 * I1Φ *(Z1Φ
1+ZE) IS*(ZS + ZE) 2*(I2Φ*Z2Φ
1) not given in DINIS so it should be found out before doing analysis
By equating three phase power with the SWER, Single phase, two phase and 2N spur power equations respective current values are obtained in terms of three phase current value.
1) Single wire earth return circuit:
Is = 1.732 * I3Φ -------------- 1
2) Single phase circuit:
I1Φ = 3* I3Φ ------------------- 2
3) Two phase circuit:
I2Φ = 1.732 * I3Φ --------------- 3
4) 2N spur lines:
I2N = 1.5 I3Φ ----------------------4
By equating three phase voltage drop with the SWER, Single phase, Two phase and 2N spur voltage drops and substituting respective current values, its impedance are obtained in terms of three phase impedance value.
1) Single wire earth return circuit:
Equivalent three phase impedance Z13Φ = (Z1
s + ZE) --------5
Approximation of Unbalanced load flows using IPSA
Page 86 of 92
2) Single phase circuit:
Equivalent three phase impedance Z13Φ = 3*(Z1
1Φ + ZE) -----6
3) Two phase circuit:
Equivalent three phase impedance Z13Φ = 2*Z1
2Φ ------------7
4) 2N spur lines:
Equivalent three phase impedance Z13Φ = 1.5Z1
2N + (ZN/2). ----8
In DINIS, single phase and two phase loads are converted into an equivalent three phase model. Before performing analysis the single and two phase impedance are converted into equivalent three phase impedance by using the above equations (5 to 8). These values are then converted into per unit values. This is then given as input to OCEPS code (code used in DINIS) which performs unbalanced analysis. Now the per unit results are converted back to actual values. Now the obtained current values will be an equivalent three phase current value for single phase and two phase load current. So by using the above equations (1 to 4), single phase and two phase load current values are obtained. For three phase load, its impedance is converted into pu value and after analysis the obtained current value is converted from pu to actual value. No conversions of impedance and current value are done here.
This above method is used in this project which is mentioned in the methodology section.
2.6 Symmetrical components used for load flow Most of the distribution
systems are unearthed or indirectly earthed thus there will be no zero sequence voltage and current in the system during normal operation [9].Here in this algorithm positive sequence power, negative sequence power and coupled power is decomposed from the load bus. Load flow for positive sequence network is solved using conventional iterative algorithm. Load flow for negative sequence network is solved using algebraic methods. Inverse symmetrical component transformation is used to obtain three phase load flow.
The above method is followed in the project by solving results for positive sequence voltage and negative sequence voltage separately and then combing both the results to obtain voltage unbalance.
Positive sequence voltage is obtained using load flow method in IPSA and negative sequence voltage is obtained using fault analysis in IPSA.

Approximation of Unbalanced load flows using IPSA
Page 87 of 92
3. Methodology
a) Collect data to model a simple distribution network both in rectic master and IPSA.
b) Model same distribution network both in rectic master and IPSA for comparison purpose of results.
c) Perform a three phase unbalanced load flow for that simple distribution network in Rectic master and find voltage unbalance of that network. Tabulate the results of current and its angles at all lines, voltage and its angles at all nodes, voltage drop at all lines, power loss of all lines, power flows in the network and voltage unbalance at all points.
d) In IPSA perform a load flow for that distribution network.
e) Perform fault analysis in IPSA in that network with substituted load negative sequence impedance.
f) With fault and load flow information, approximated voltage unbalance result is obtained and checked for its accuracy against results obtained from rectic master.
g) Since both IPSA and rectic master results are tabulated, it will be easy to do a comparison. These tabulated results will be reviewed with a senior engineer to discuss the accuracy of the results.
An overview of how voltage unbalance can be obtained using IPSA.
1) To calculate two phase and single phase feeder voltages and power flow in a three phase balanced network.
2) To calculate voltage drops and power flow in a three phase feeder with unbalance load connected.
3) To calculate effects of general unbalance in 3 phase loads and calculate voltage unbalance at all points in a three phase system.
Since IPSA can run only three phase balanced load flow, by connecting single phase or two phase loads it considers those values as three phase values. So the single and two phase circuits are converted to equivalent three phase circuits for analysis purpose.
Before doing load flow, the impedance of two phase and single phase load circuit are converted into equivalent three phase impedance values and three phase load circuit impedance does not require any changes.
Formulas used [4]
1) Single wire earth return circuit:

Approximation of Unbalanced load flows using IPSA
Page 88 of 92
Equivalent three phase impedance Z13Φ = (Z1
s + ZE)
2) Single phase circuit:
Equivalent three phase impedance Z13Φ = 3*(Z1
1Φ + ZE)
3) Two phase circuit:
Equivalent three phase impedance Z13Φ = 2*Z1
2Φ
4) 2N spur lines:
Equivalent three phase impedance Z13Φ = 1.5Z1
2N + (ZN/2) (This formula needs to be checked before doing analysis)
So after doing calculations with these formulas the data are entered in IPSA and load flow is performed now in this result power flow in the three phase core network, current flow and voltage at nodes will not be correct. Current, power loss and voltage drop in two phase and single phase feeders are correct value. This current value is an equivalent three phase current value for single phase and two phase feeder current values. So this equivalent three phase current value is changed to single phase and two phase current value using formulas. Multiplying the calculated single phase and two phase current values with the single phase and two phase impedance respectively gives the voltage drop of those lines
Formulas used [4]
1) Single wire earth return circuit:
Is = 1.732 * I3Φ
2) Single phase circuit:
I1Φ = 3* I3Φ
3) Two phase circuit:
I2Φ = 1.732 * I3Φ
4) 2N spur lines:
I2N = 1.5 I3Φ
Now fault analysis is done in IPSA with substituted load negative sequence impedance to obtain negative sequence voltage. Cancelling effect of negative sequence voltage must be considered while doing the analysis. So by obtaining negative sequence voltages from fault analysis and positive sequence voltages from load flow, approximated voltage unbalance results can be obtained from IPSA.
Formula used to find % voltage unbalance = (Additional MVA/Fault level (MVA)) *100% [5].

Approximation of Unbalanced load flows using IPSA
Page 89 of 92
Additional MVA is the load in addition to balanced load.
4. Project planning
5. Project risks
Project risks can be as follows:
1) Data collection and analysis work can exceed the time which is mentioned in the plan.
2) There is a chance that results obtained from the software are not reviewed by any expert.
The above risks can be avoided by following ways:
1) As per project plan the main objective of the project, writing report about the project, printing and binding works can be done one week before submission date. The last week is

Approximation of Unbalanced load flows using IPSA
Page 90 of 92
kept for doing the supplement objective of the project. Incase when analysis and data collection takes time the last week can be used to adjust that time lag.
2) Any simulation results that are used to draw conclusions need to be checked by another person as a part of quality control and good engineering practice. The purpose of checking is to make sure that the simulations have been done correctly and that accidental mistakes have not been made when using IPSA or Retic Master. So the results are checked by a senior engineer who will make sure that the third risk in this project can be avoided.
6. References
1) Engineering recommendation P29, 1990 “Planning limits for voltage unbalance in the United Kingdom”.
2) American journal of applied science 2(3), ISSN 1546-9239 © science publication 2005”Distribution network planning and design using branch and bound methods” Jallal Abdallah – Tafila Applied University college, Amman, Jordan.
3) http://s.pangonilo.com/index.php/2010/06/three-phase-voltage-unbalance-causes-effects-mitigation.html
4) Technical info for eng, Analysis routines, Version 6.4 DINIS.
5) Engineering technical report No .116, 1989, Report on voltage unbalance due to British Rail AC traction supplies.
6) Journal of Theoretical and Applied Information Technology, © 2005 - 2009 JATIT,”J. B. V.
Subrahmanyam,”load flow solution of unbalanced radial distribution systems. 7) Iranian Journal of Electrical and Computer Engineering, Vol.6, No.1, Winter-Spring “Three-phase fast decoupled Load flow for unbalanced distribution Systems”. 8) “Decomposed three phase power flow solution using the sequence component frame”, K.L.Lo & C.Zhang ©IEE, 1993. 9)”A novel three phase load flow algorithm based on symmetrical component for distribution systems”, Kang Xiaoning, Suonan Jiale, Song Goubing, Fu Wei and Zhiqian Bo. 10) “Three phase unbalance distribution systems – Complementary Analysis and experimental case study” M.Tavakoli Bina*, A.Kashefi.

Approximation of Unbalanced load flows using IPSA
Page 91 of 92
7. Appendix
Healthy and safety risk assessment:
General Risk Assessment Form
Date: (1)
12/05/2011
Assessed by: (2)
Dr P Mancarella
Checked / Validated* by: (3)
Dr Graeme Bathurst
Location: (4)
TNEI office
Assessment ref no (5)
9884551250
Review date: (6)
17/06/2011
Task / premises: (7)
Office work which include working in computer and doing numerical calculations.
Activity (8)
Hazard (9)
Who might be harmed and how (10)
Existing measures to control risk (11)
Risk rating
(12)
Result (13)
Computer work
Upper
limb
disorders
I will be harmed and
affected by that upper
limb disorders
Having a comfortable
work environment and
practicing healthy working practices.
Medium A

Approximation of Unbalanced load flows using IPSA
Page 92 of 92