Marakolliya Home Garden Project Proposal - 8 Monhts -Approved
MODELING PRESSURE–TEMPERATURE CONDITIONS OF GARNET AMPHIBOLITE FROM THE HIMALAYA OF
NORTHWESTERN BHUTAN
Senior Thesis Submitted in partial fulfillment of the requirements for the
Bachelor of Science Degree At The Ohio State University
By
Jasper I. Mitchin
The Ohio State University 2018

1
Approved by
David J. Young, Advisor School of Earth Sciences

i
Abstract Garnet amphibolite collected in northwestern Bhutan was studied to determine the metamorphic conditions the sample underwent. Other studies in the central Himalaya reported eclogite-facies assemblages in mafic rocks, based upon the discovery of omphacite relics, but this could not be confirmed within the sample due to the lack of clinopyroxene. This is likely the result of higher temperatures overprinting the high-pressure peak metamorphic conditions during the post-peak stage of metamorphism. Equilibrium modelling of the sample to produce an isochemical section of mineral assemblages at various pressure and temperature conditions was refined by comparison with the measured modal composition consisting of hornblende, quartz, plagioclase, garnet, sphene and ilmenite. This comparison suggests the current mineral assemblage formed at approximately 4-8 kilobars and 400-750 ºC. Compositions of core and rim domains in garnet were compared to garnet compositions derived from the isochemical model to refine pressure and temperature conditions. A large discrepancy exists between measured and modeled phase compositions, thus making refinement unreliable. Despite this, the maximum temperature predicted by the thermodynamic modelling suggests the mineral assemblage does not reflect a peak pressure paragenesis. The mineral assemblage is proposed to have either grown early or late during the metamorphic event.
ii
Table of Contents Abstract………………………………………………………………………………i
Acknowledgements…………………………………………………………………...iii
List of Figures.………………………………………………………………………...iv
List of Tables.………………………………………………………………….……...iv
Introduction…………………………………………………………………………..1
Methods………………………………………………………………………………2
Modeling ………..……………………………………………………………2
QEMSCAN…………………………………………………………………..2
Energy-Dispersive X-ray Spectroscopy……………………………………….2
Results………………………………………………………………………………..4
Modeling……………………………………………………………………...4
QEMSCAN…………………………………………………………………..8
Energy-Dispersive X-ray Spectroscopy ………………………………………9
Discussion……………………………………………………………………….……12
Conclusions…………………………………………………………………….……..13
Future Work………………………………………………………………….……….14
References………………………………………………………………….…………15
iii
Acknowledgements I would like to thank my advisor Dr. David Young for guiding me through the process of research, writing this thesis, and locating samples. Thanks to Julie Sheets and Susan Welch for providing access to and instruction on the use of the School of Earth Science’s electron microscope. SEM/QEMSCAN images were acquired at the Subsurface Energy Materials Characterization and Analysis Laboratory (SEMCAL), School of Earth Sciences, The Ohio State University. Thanks to Clare Warren and Daniele Regis at the Open University, UK for supplying samples. Thanks also to Dr. Anne Carey for supervising the thesis writing process. Thanks to the staff and faculty of the School of Earth Sciences for dedicating themselves to running a top-notch undergraduate program here at The Ohio State University. I would also like to thank Cindy and Mike Morgan for their generous contribution to the 2017 School of Earth Sciences Field Experience Travel Fund. I will never forget the time I shared in Utah with a fantastic group of students, and instructors which the travel fund helped to make happen. Finally, I wouldn’t have made it here without the support of my parents, Bill and Mechteld Mitchin, my sister Sydney Mitchin, my grandmother Martha Wilson, and a wonderful circle of friends who endured my late night, dubious, and highly speculative ramblings about the past, present, and future of our planet.

iv
List of Figures 1. Modeled P-T pseudosection……………...................................................................................5
2. Modeled garnet by volume percent…….....................................................................................6
3. Modeled Garnet for varied H2O%…………………………………..…………………..7
4. QEMSCAN field superimposed on DRB12-22 thin section……….……….…………....8
5. Backscattered electron SEM image of garnets used in EDXS...............................................11
List of Tables 1. Bulk composition by oxide weight percent ………………………………..……………4
2. Modal mineral composition by oxide weight percent.…………………….………..……8
3. EDXS major oxide weight percent.……………………………………..………………9
4. EDXS garnet species molar fraction...……………………………….………….………10

1
Introduction Mafic, garnet-bearing rocks are found in numerous localities along the Himalayan orogen, but true eclogite-facies rocks (i.e., containing omphacite) are relatively rare, and found only in northwest Pakistan and northern India. Garnet and pyroxene-bearing mafic rocks occur in small localities through the upper Greater Himalayan Sequence in western Bhutan (Grujic et al., 2011). These are interpreted as eclogites, but no primary omphacite remains; instead, plagioclase + clinopyroxene (± orthopyroxene) symplectite is interpreted as a breakdown product of high-pressure sodic clinopyroxene. A float sample of mafic garnet amphibolite (DRB12-22) was collected by David Young from glacial outwash below the Jichu Drake massif, which drains the Higher Himalayan sequence in the Jomolhari region of northwestern Bhutan.
The objective of this study was to determine the pressure and temperature conditions at which the mineral assemblage grew, and to investigate whether a P-T path detailing the history of mineral growth and ultimate decompression could be calculated. This involved acquiring a major oxide bulk chemical analysis of an offcut of the DRB12-22 sample, calculating a thermodynamic model of the equilibrium phases present at various pressure and temperature conditions, and comparing these predictions to measured modal and compositional data from the sample.
2
Methods Modeling
Modelling of P-T conditions was performed using Perple_X version 6.8.1 (Connolly, 2009) utilizing Holland and Powell’s thermodynamic database (1998, revised by Connolly and Kerrick, 2002) for silicates in the lithosphere. The weight percentage of major oxides in DRB12-22 was measured by X-ray fluorescence at the GeoAnalytical Laboratory at Washington University in St. Louis. These quantities are entered as thermodynamic components within the Perple_X suite of programs. The program VERTEX utilizes equation of state algorithms to minimize Gibb’s free energy, which VERTEX then uses to compute phase stability fields over a user-defined pressure and temperature range. These calculations assume the system remains in equilibrium, which may be variably realistic in natural systems. Solution models allow compositional parameters to be extracted for specific phases, and include garnet (Holland and Powell, 1998), clinopyroxene (Holland and Powell, 1996), orthopyroxene (Holland and Powell, 1996), feldspar (Fuhrman and Lindsley, 1988), biotite (Powell and Holland, 1999), and amphibole (Dale et al., 2005). The calculated stability fields for various mineral phases are then plotted on a pressure temperature graph (Figure 1). This isochemical section (termed here a pseudosection) can be queried for modal amounts or compositional ranges of any mineral, and was used in this study to determine the pressure and temperature conditions at which the mineral assemblage formed, and combined with garnet zoning profiles, was applied to define a P-T path.
QEMSCAN
QEMSCAN is an automated mineral analysis system marketed by the FEI Company, which collects simultaneous energy-dispersive X-ray spectra (EDXS) and backscattered electrons (BSE) from an electron beam rastered across a sample in a scanning electron microscope. These data provide information on the elemental composition at each measurement point, which can be processed into a map of the phase assemblage and used for modal analysis. A thin section of DRB 12-22 was mounted on a QEMSCAN holder to calculate a modal mineral assemblage. EDXS and BSE data were collected at an accelerating potential of 25 keV. Forty-five small QEMSCAN fields with a 10 µm point spacing were stitched together to form a large 2 by 1 cm composite field. The long axis of the large field was oriented perpendicular to foliation to minimize mineral sampling bias. The results of the modal analysis of selected mineral phases provide a comparison point with the predictions of an equilibrium phase model.
Energy-Dispersive X-ray Spectroscopy Three garnets in DRB12-22 were analyzed by EDXS to measure compositional differences between their cores and rims. Garnets were selected based on large size, relatively euhedral crystal habit, and surrounding mineralogy. Large grains are preferred, as they may have formed during the prograde stage of metamorphism, potentially retain prograde compositional zoning, and are less likely to be partial sections containing only rim domains. Euhedral faces are preferred as they ideally preserve compositional zoning from the final stages of mineral growth. Compositional zoning is influenced by the free exchange of cations with surrounding phases, hence rim domains adjacent to amphibole and plagioclase were selected. EDXS spot analysis was conducted with a 3-µm beam diameter and an accelerating potential of 25 keV; data were corrected for ZAF effects (atomic number, absorption,

3
and fluorescence), but more accurate corrections using standards are not presently developed for the SEMCAL SEM instrumentation. Minor components in garnet such as Ti and Cr were not measured. Comparing core and rim compositions against PERPLEX models of garnet composition over a range of pressure and temperature conditions defines a P-T path during the prograde stage to peak conditions.

4
Results
Modeling The pseudosection model predicts a mineral stability field (amphibole, feldspar, garnet, clinopyroxene, and ilmenite) that nearly matches the observed modal mineral assemblage however no clinopyroxene was observed in QEMSCAN analysis. Modeled garnet composition did not match measured EDXS values. The largest discrepancy between the model and measured values exists with almandine, with the model predicting a range of Alm74-82, compared to Alm51-61 for the measured values. Calculated pyrope values are underestimated at Py0-10 compared to measured Py14-20. Grossular is also underestimated, with a modeled range of Grs11-21 compared to measured Grs20-27. Only one spot analysis for grossular (G3R2, Grs20) fell within the modeled range. Models for spessartine Sps0-3 did overlap with measured values sps0-3 but no distinct variation was observed between core and rim compositions.
Table 1. DRB 12-22 major oxide bulk composition (unnormalized weight percent)
SiO2 TiO2 Al2O3 FeO MnO MgO CaO Na2O K2O H2O Total Wt. %
50.01 2.916 14.24 14.89 0.264 5.57 9.60 0.68 0.55 0.30 99.02

5
Figure 1. P-T pseudosection using the bulk composition of DRB 12-22. Observed mineral assemblage (amphibole, feldspar, garnet, clinopyroxene (not observed), and ilmenite) highlighted in red field.

6
Figure 2. Calculated modal garnet by volume percent. Contour range spans 4-48 vol% garnet with a 2% interval. Bold blue contour represents 16% modal garnet estimated from QEMSCAN.

7
Figure 3. Model for fixed pressure (6 kbar) with water content varying 0–1.5% showing decreasing garnet stability above 0.6%. Measured low water wt.% shouldn’t affect garnet stability as maximum stability occurs in a large field spanning 0.3–0.6%.
8
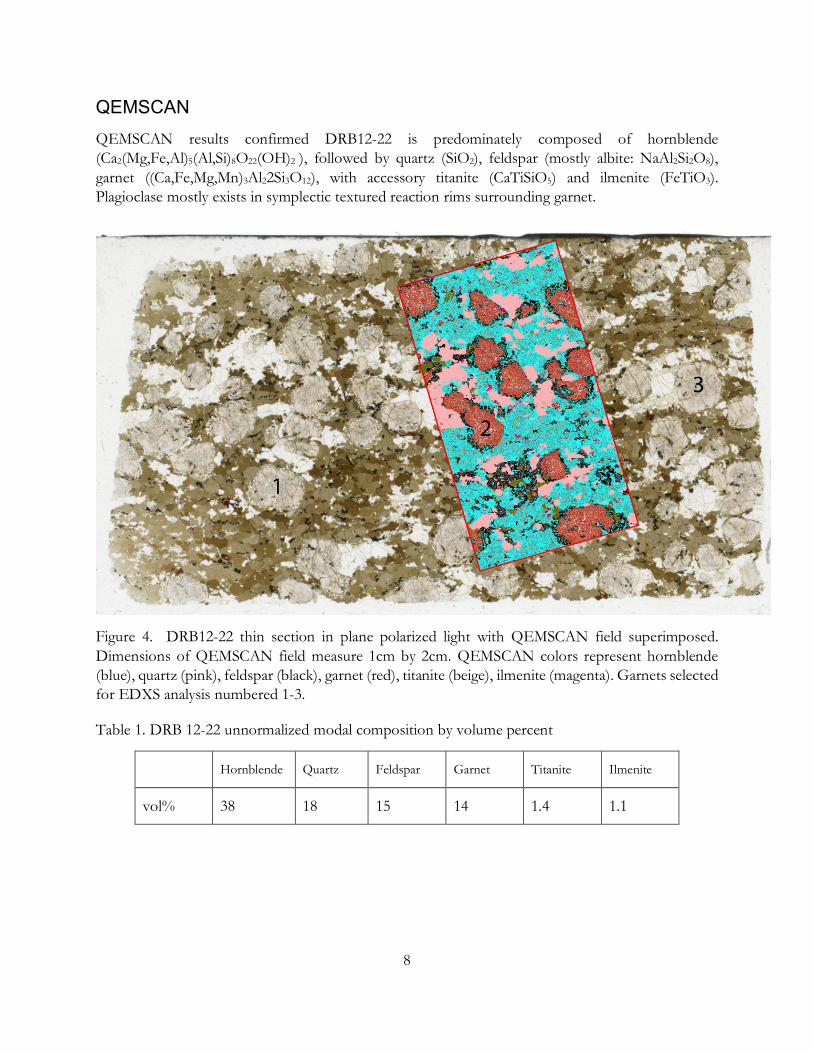
QEMSCAN QEMSCAN results confirmed DRB12-22 is predominately composed of hornblende (Ca2(Mg,Fe,Al)5(Al,Si)8O22(OH)2 ), followed by quartz (SiO2), feldspar (mostly albite: NaAl2Si2O8), garnet ((Ca,Fe,Mg,Mn)3Al22Si3O12), with accessory titanite (CaTiSiO5) and ilmenite (FeTiO3). Plagioclase mostly exists in symplectic textured reaction rims surrounding garnet.
Figure 4. DRB12-22 thin section in plane polarized light with QEMSCAN field superimposed. Dimensions of QEMSCAN field measure 1cm by 2cm. QEMSCAN colors represent hornblende (blue), quartz (pink), feldspar (black), garnet (red), titanite (beige), ilmenite (magenta). Garnets selected for EDXS analysis numbered 1-3.
Table 1. DRB 12-22 unnormalized modal composition by volume percent
Hornblende Quartz Feldspar Garnet Titanite Ilmenite
vol% 38 18 15 14 1.4 1.1
9
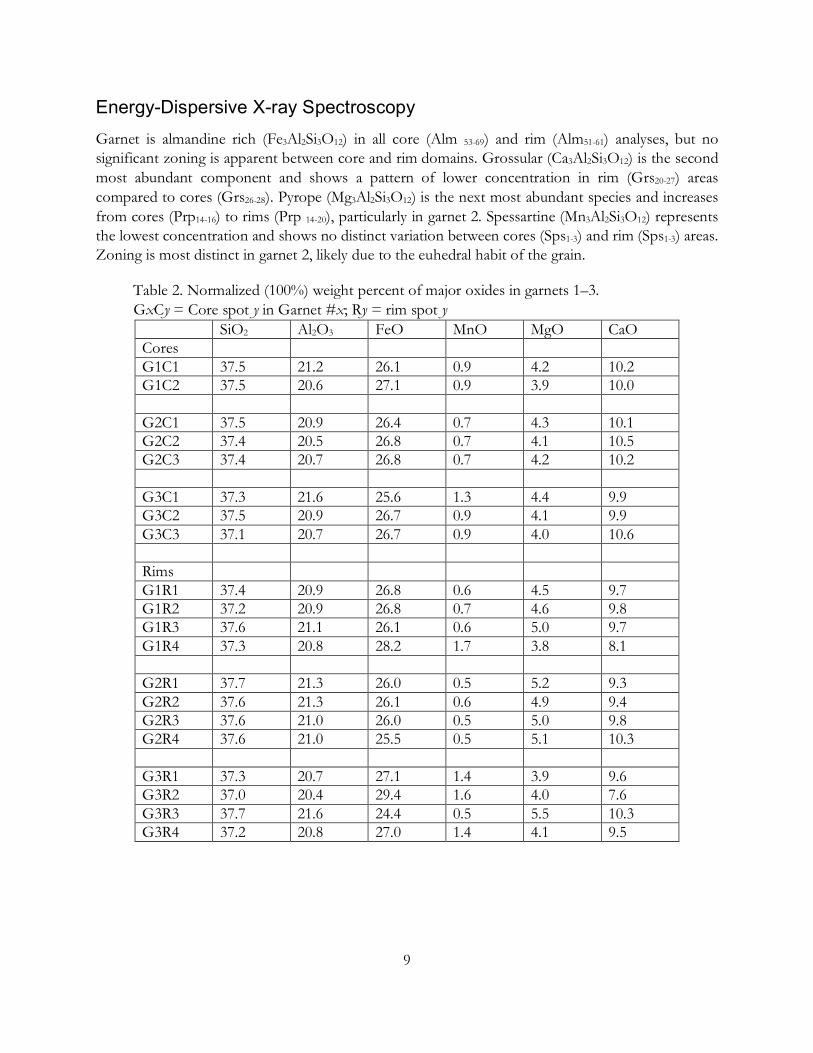
Energy-Dispersive X-ray Spectroscopy Garnet is almandine rich (Fe3Al2Si3O12) in all core (Alm 53-69) and rim (Alm51-61) analyses, but no significant zoning is apparent between core and rim domains. Grossular (Ca3Al2Si3O12) is the second most abundant component and shows a pattern of lower concentration in rim (Grs20-27) areas compared to cores (Grs26-28). Pyrope (Mg3Al2Si3O12) is the next most abundant species and increases from cores (Prp14-16) to rims (Prp 14-20), particularly in garnet 2. Spessartine (Mn3Al2Si3O12) represents the lowest concentration and shows no distinct variation between cores (Sps1-3) and rim (Sps1-3) areas. Zoning is most distinct in garnet 2, likely due to the euhedral habit of the grain.
Table 2. Normalized (100%) weight percent of major oxides in garnets 1–3. GxCy = Core spot y in Garnet #x; Ry = rim spot y
SiO2 Al2O3 FeO MnO MgO CaO Cores G1C1 37.5 21.2 26.1 0.9 4.2 10.2 G1C2 37.5 20.6 27.1 0.9 3.9 10.0 G2C1 37.5 20.9 26.4 0.7 4.3 10.1 G2C2 37.4 20.5 26.8 0.7 4.1 10.5 G2C3 37.4 20.7 26.8 0.7 4.2 10.2 G3C1 37.3 21.6 25.6 1.3 4.4 9.9 G3C2 37.5 20.9 26.7 0.9 4.1 9.9 G3C3 37.1 20.7 26.7 0.9 4.0 10.6 Rims G1R1 37.4 20.9 26.8 0.6 4.5 9.7 G1R2 37.2 20.9 26.8 0.7 4.6 9.8 G1R3 37.6 21.1 26.1 0.6 5.0 9.7 G1R4 37.3 20.8 28.2 1.7 3.8 8.1 G2R1 37.7 21.3 26.0 0.5 5.2 9.3 G2R2 37.6 21.3 26.1 0.6 4.9 9.4 G2R3 37.6 21.0 26.0 0.5 5.0 9.8 G2R4 37.6 21.0 25.5 0.5 5.1 10.3 G3R1 37.3 20.7 27.1 1.4 3.9 9.6 G3R2 37.0 20.4 29.4 1.6 4.0 7.6 G3R3 37.7 21.6 24.4 0.5 5.5 10.3 G3R4 37.2 20.8 27.0 1.4 4.1 9.5
10
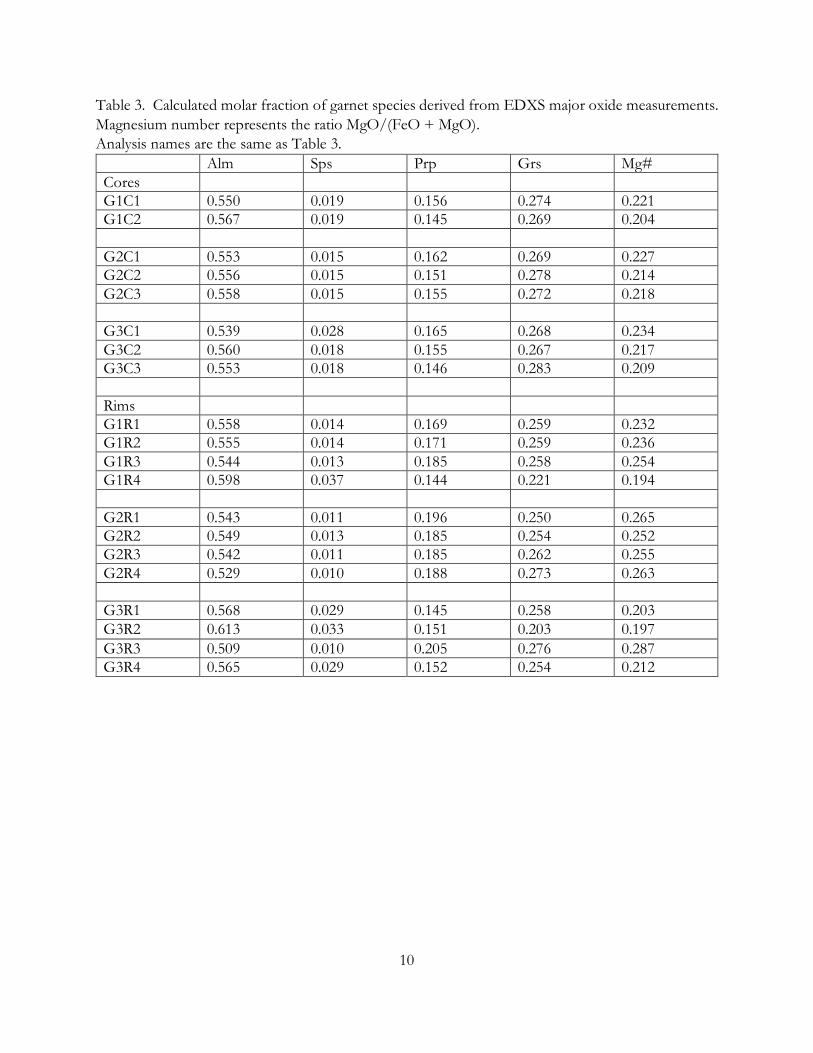
Table 3. Calculated molar fraction of garnet species derived from EDXS major oxide measurements. Magnesium number represents the ratio MgO/(FeO + MgO). Analysis names are the same as Table 3. Alm Sps Prp Grs Mg# Cores G1C1 0.550 0.019 0.156 0.274 0.221 G1C2 0.567 0.019 0.145 0.269 0.204 G2C1 0.553 0.015 0.162 0.269 0.227 G2C2 0.556 0.015 0.151 0.278 0.214 G2C3 0.558 0.015 0.155 0.272 0.218 G3C1 0.539 0.028 0.165 0.268 0.234 G3C2 0.560 0.018 0.155 0.267 0.217 G3C3 0.553 0.018 0.146 0.283 0.209 Rims G1R1 0.558 0.014 0.169 0.259 0.232 G1R2 0.555 0.014 0.171 0.259 0.236 G1R3 0.544 0.013 0.185 0.258 0.254 G1R4 0.598 0.037 0.144 0.221 0.194 G2R1 0.543 0.011 0.196 0.250 0.265 G2R2 0.549 0.013 0.185 0.254 0.252 G2R3 0.542 0.011 0.185 0.262 0.255 G2R4 0.529 0.010 0.188 0.273 0.263 G3R1 0.568 0.029 0.145 0.258 0.203 G3R2 0.613 0.033 0.151 0.203 0.197 G3R3 0.509 0.010 0.205 0.276 0.287 G3R4 0.565 0.029 0.152 0.254 0.212
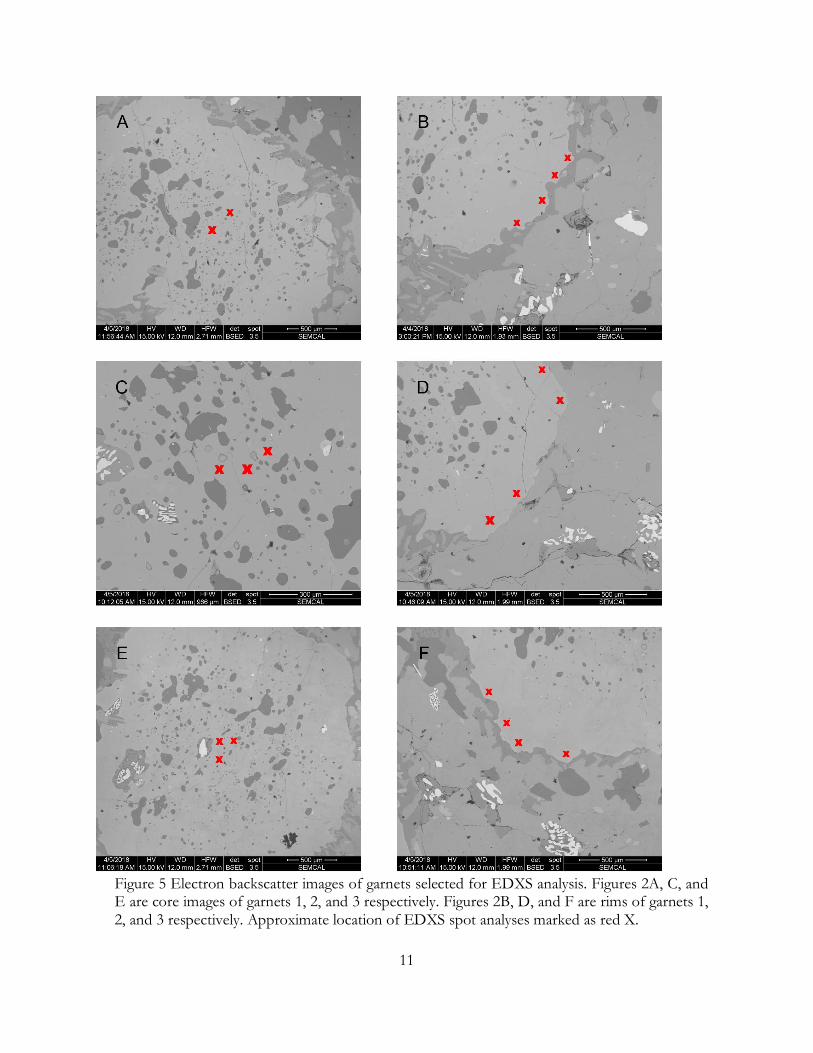
11
Figure 5 Electron backscatter images of garnets selected for EDXS analysis. Figures 2A, C, and E are core images of garnets 1, 2, and 3 respectively. Figures 2B, D, and F are rims of garnets 1, 2, and 3 respectively. Approximate location of EDXS spot analyses marked as red X.
12
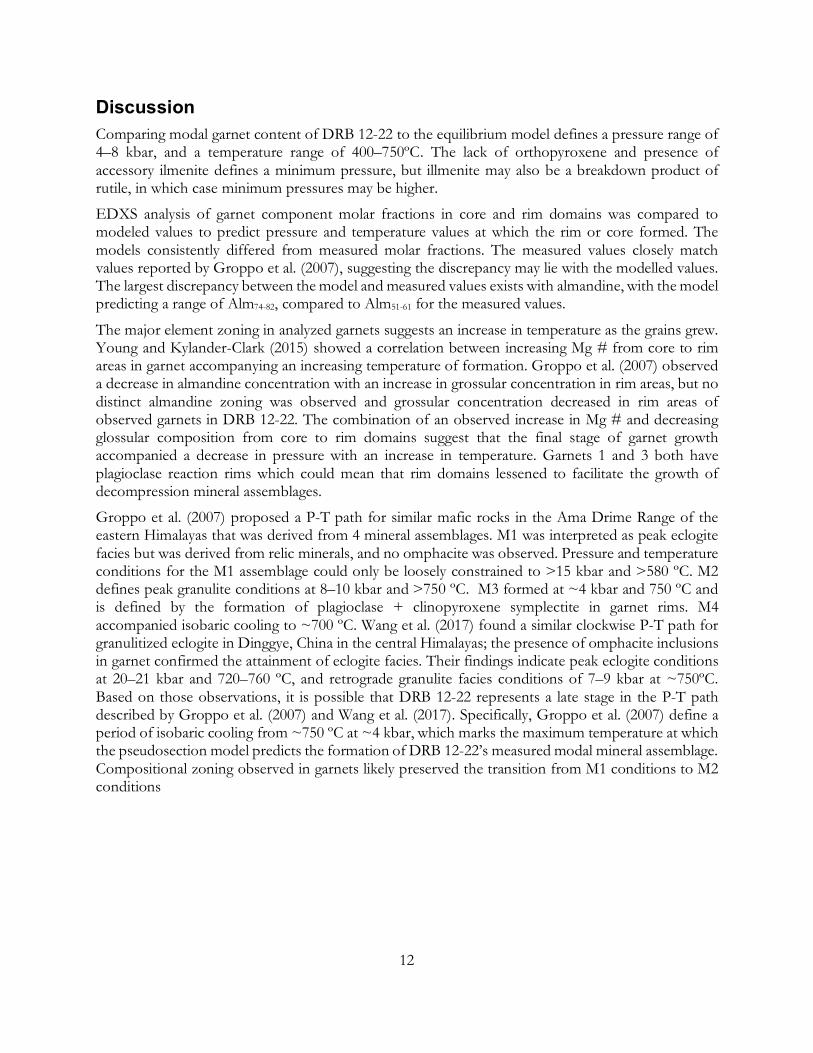
Discussion Comparing modal garnet content of DRB 12-22 to the equilibrium model defines a pressure range of 4–8 kbar, and a temperature range of 400–750ºC. The lack of orthopyroxene and presence of accessory ilmenite defines a minimum pressure, but illmenite may also be a breakdown product of rutile, in which case minimum pressures may be higher.
EDXS analysis of garnet component molar fractions in core and rim domains was compared to modeled values to predict pressure and temperature values at which the rim or core formed. The models consistently differed from measured molar fractions. The measured values closely match values reported by Groppo et al. (2007), suggesting the discrepancy may lie with the modelled values. The largest discrepancy between the model and measured values exists with almandine, with the model predicting a range of Alm74-82, compared to Alm51-61 for the measured values.
The major element zoning in analyzed garnets suggests an increase in temperature as the grains grew. Young and Kylander-Clark (2015) showed a correlation between increasing Mg # from core to rim areas in garnet accompanying an increasing temperature of formation. Groppo et al. (2007) observed a decrease in almandine concentration with an increase in grossular concentration in rim areas, but no distinct almandine zoning was observed and grossular concentration decreased in rim areas of observed garnets in DRB 12-22. The combination of an observed increase in Mg # and decreasing glossular composition from core to rim domains suggest that the final stage of garnet growth accompanied a decrease in pressure with an increase in temperature. Garnets 1 and 3 both have plagioclase reaction rims which could mean that rim domains lessened to facilitate the growth of decompression mineral assemblages.
Groppo et al. (2007) proposed a P-T path for similar mafic rocks in the Ama Drime Range of the eastern Himalayas that was derived from 4 mineral assemblages. M1 was interpreted as peak eclogite facies but was derived from relic minerals, and no omphacite was observed. Pressure and temperature conditions for the M1 assemblage could only be loosely constrained to >15 kbar and >580 ºC. M2 defines peak granulite conditions at 8–10 kbar and >750 ºC. M3 formed at ~4 kbar and 750 ºC and is defined by the formation of plagioclase + clinopyroxene symplectite in garnet rims. M4 accompanied isobaric cooling to ~700 ºC. Wang et al. (2017) found a similar clockwise P-T path for granulitized eclogite in Dinggye, China in the central Himalayas; the presence of omphacite inclusions in garnet confirmed the attainment of eclogite facies. Their findings indicate peak eclogite conditions at 20–21 kbar and 720–760 ºC, and retrograde granulite facies conditions of 7–9 kbar at ~750ºC. Based on those observations, it is possible that DRB 12-22 represents a late stage in the P-T path described by Groppo et al. (2007) and Wang et al. (2017). Specifically, Groppo et al. (2007) define a period of isobaric cooling from ~750 ºC at ~4 kbar, which marks the maximum temperature at which the pseudosection model predicts the formation of DRB 12-22’s measured modal mineral assemblage. Compositional zoning observed in garnets likely preserved the transition from M1 conditions to M2 conditions
13
Conclusions The closest match for measured modal mineral composition to the modeled pseudosection suggests a temperature range of 400–750 ºC and a pressure range of 4000–8000 Kilobars. This suggests the sample preserves conditions defined as an isobaric cooling phase during retrogression. There is a discrepancy between garnet compositions measured using EDXS and compositions calculated from the XRF bulk composition using PERPLEX. This discrepancy makes it difficult to refine temperature derived the large pseudosection P-T field, and a path from the prograde stage to peak conditions could not be established.
14
Future Work If the discrepancy between modelled and measured garnet components arises from the analyzed major oxide bulk composition, then a second bulk composition should be acquired, perhaps using alternative methods. Zoning profiles for garnet should be more accurately mapped using microprobe analysis to determine the effects of decompression on rim domain compositions. In-depth mineralogical examination should be conducted to search for relic omphacite to perhaps confirm the presence of overprinted eclogite facies.

15
References Cited Connolly, J.A.D., 2009, The geodynamic equation of state: what and how. Geochemistry, Geophysics,
Geosystems, v. 10, Q10014, doi 10.1029/2009GC002540.
Connolly, J.A.D., Kerrick, D.M., 2002, Metamorphic controls on seismic velocity of subducted oceanic crust at 100-250 km depth. Earth and Planetary Science letters. 204, p. 61-74.
Dale J., Powell R., White R.W, Elmer F.L., Holland T.J.B., 2005, A thermodynamic model for Ca-Na clinoamphiboles in Na2O-CaO-FeO-MgO-Al2O3-SiO2-H2O-O for petrological calculations. Journal of Metamorphic Geology, v 23, p. 771-91.
Fuhrman M.L., Lindsley D.H., 1988, Ternary-Feldspar Modeling and Thermometry. American Mineralogist, v. 73, p. 201-15.
Groppo, C., Lombardo, B., Rolfo, F., Pertusati, P., 2007, Clockwise exhumation path of granulitized eclogites from the Ama Drime range (Eastern Himalayas). Journal of Metamorphic Geology, v. 25, p. 51-75, doi: 10.1111/j.1525-1314.2006.00678.x
Grujic, D., Warren, C. J., Wooden, J. L., 2011, Rapid synconvergent exhumation of Miocene-aged lower orogenic crust in the eastern Himalaya: Lithosphere, v.3 e. 5, p. 346-366, doi 10.1130/L154.1
Holland T., Powell R, 1996, Thermodynamics of order-disorder in minerals. 2. Symmetric formalism applied to solid solutions. American Mineralogist, v. 81, p. 1425-37.
Holland T.J.B., Powell R., 1998, An internally consistent thermodynamic data set for phases of petrological interest. Journal of Metamorphic Geology, v. 16, p. 309-43.
Powell R., Holland T., 1999, Relating formulations of the thermodynamics of mineral solid solutions: Activity modeling of pyroxenes, amphiboles, and micas. American Mineralogist, v. 84, p. 1-14.
Wang, Y., Zhang, L., Zhang, J., Wei, C., 2017, The youngest eclogite in central Himalaya: P-T path, U-Pb zircon age and its tectonic implication. Gondwana Research, v. 41, p. 188-206, doi: 10.1016/j.gr.2015.10.013
Young, D.J, Kylander-Clark, A.R.C., 2015, Does continental crust transform during eclogite facies metamorphism? Journal of Metamorphic Geology, v. 33, p. 331-357.