Appropriate)Application)of)Paleoflood)) Information)for ... · Appropriate Application of...
53
Appropriate Application of Paleoflood Information for the Hydrology and Hydraulics Decisions of the U.S. Army Corps of Engineers
Transcript of Appropriate)Application)of)Paleoflood)) Information)for ... · Appropriate Application of...

Appropriate)Application)of)Paleoflood))Information)for)the)Hydrology)and)Hydraulics)Decisions)of)the)U.S.)Army)Corps)of)Engineers))

REPORT DOCUMENTATION PAGE Form Approved
OMB No. 0704-0188 Public reporting burden for this collection of information is estimated to average 1 hour per response, including the time for reviewing instructions, searching existing data sources, gathering and maintaining the data needed, and completing and reviewing this collection of information. Send comments regarding this burden estimate or any other aspect of this collection of information, including suggestions for reducing this burden to Department of Defense, Washington Headquarters Services, Directorate for Information Operations and Reports (0704-0188), 1215 Jefferson Davis Highway, Suite 1204, Arlington, VA 22202-4302. Respondents should be aware that notwithstanding any other provision of law, no person shall be subject to any penalty for failing to comply with a collection of information if it does not display a currently valid OMB control number. PLEASE DO NOT RETURN YOUR FORM TO THE ABOVE ADDRESS.
1. REPORT DATE (DD-MM-YYYY) February 2013
2. REPORT TYPE Technical Report
3. DATES COVERED (From - To)
4. TITLE AND SUBTITLE Appropriate Application of Paleoflood Information for the Hydrology and Hydraulics Decisions of the U.S. Army Corps of Engineers
5a. CONTRACT NUMBER
5b. GRANT NUMBER
5c. PROGRAM ELEMENT NUMBER
6. AUTHOR(S)
David Raff
5d. PROJECT NUMBER
5e. TASK NUMBER
5f. WORK UNIT NUMBER
7. PERFORMING ORGANIZATION NAME(S) AND ADDRESS(ES) 8. PERFORMING ORGANIZATION REPORT NUMBER
Institute for Water Resources U.S. Army Corps of Engineers
CWTS 2013-2
9. SPONSORING / MONITORING AGENCY NAME(S) AND ADDRESS(ES) 10. SPONSOR/MONITOR’S ACRONYM(S)
11. SPONSOR/MONITOR’S REPORT NUMBER(S)
12. DISTRIBUTION / AVAILABILITY STATEMENT Available from the National Technical Information Service Operations Division, 5285 Port Royal Road, Springfield VA 22161 13. SUPPLEMENTARY NOTES
14. ABSTRACT The U.S. Army Corps of Engineers (USACE) Hydrology, Hydraulics, and Coastal Community of Practice frequently studies past hydrology and assumptions about future hydrology to characterize potential future flood events and associated risks. USACE may be able to use information about floods from the very distant past to help characterize floods that have low probabilities of occurrence. This report briefly describes the collection of paleoflood information and various ways to trans-late that information into hydrologic frequency estimates for flood stage, discharge, and volumes. It addresses appropriate use of the paleoflood information for USACE hydrology and hydraulics applications.
15. SUBJECT TERMS
Hydraulics Hydrology Flood events Paleofloods
16. SECURITY CLASSIFICATION OF: 17. LIMITATION OF ABSTRACT
18. NUMBER OF PAGES
19a. NAME OF RESPONSIBLE PERSON
a. REPORT
U
b. ABSTRACT
U
c. THIS PAGE
U U 53 19b. TELEPHONE NUMBER (include area code)
Standard Form 298 (Rev. 8-98) Prescribed by ANSI Std. 239.18

Appropriate Application of Paleoflood Information for the Hydrology
and Hydraulics Decisions of the U.S. Army Corps of Engineers
Author:
David Raff, U.S. Army Corps of Engineers, Institute for Water Resources
Prepared by and for:
U.S. Army Corps of Engineers
Cover: Carlyle Lake, Carlyle, Illinois
DISCLAIMER: The contents of this report are not to be used for advertising, publication, or promotional purposes. Citation of trade names does not constitute an official endorsement or approval of the use of such commercial products.
All product names and trademarks cited are the property of their respective owners. The findings of this report are not to be construed as an official Department of the Army position unless so designated by other authorized documents.
DESTROY THIS REPORT WHEN NO LONGER NEEDED. DO NOT RETURN IT TO THE ORIGINATOR.

CWTS 2013-2 ii
Abstract
The U.S. Army Corps of Engineers (USACE) Hydrology, Hydraulics, and Coastal Community of Practice frequently studies past hydrology and as-sumptions about future hydrology to characterize potential future flood events and associated risks. USACE may be able to use information about floods from the very distant past to help characterize floods that have low probabilities of occurrence. This report briefly describes the collection of paleoflood information and various ways to translate that information into hydrologic frequency estimates for flood stage, discharge, and volumes. It addresses appropriate use of the paleoflood information for USACE hy-drology and hydraulics applications.

CWTS 2013-2 iii
Executive Summary
The U.S. Army Corps of Engineers (USACE) infrastructure, operations, safety, and maintenance programs are facing growing stresses caused by aging infrastructure, hydrologic nonstationarity, urban growth, coastal de-velopment, evolving navigation and shipping practices, changing agricul-tural practices, and increasing recognition of the need for ecosystem resto-ration. Our infrastructure is often operated beyond its anticipated service life, requiring inquiry into how such systems can best be managed. The Hydrology, Hydraulics, and Coastal (H,H,&C) Community of Practice (CoP) frequently conducts studies and assessments based on past hydrology and assumptions about future hydrology.
In the absence of direct foresight into future hydrologic events, past events are often used as surrogates. Paleohydrology describes the evidence of the movement of water and sediment in stream channels before the time of continuous hydrologic records or direct measurements (Costa 1987). Paleohydrologic information can be obtained or derived with respect to both floods and droughts, though the tools and practices for characterizing these two hydrologic extremes are somewhat different. This report focuses on the utilization of paleoflood data for supporting decisions of the practi-tioners of hydrology and hydraulics (H&H) within USACE. Paleoflood in-formation can be obtained for any time period prior to instrumental gage records, including the relatively recent past (50–500 years) to the very dis-tant past (500–10,000 years before present).
To best meet the mission goals and support the various H&H decision types and policies of USACE utilizing paleoflood information, it is necessary to identify how paleoflood data are collected, what analyses and assumptions are employed to interpret and transform those data into information for potential H&H decisions, and where and how that information can best be used within studies or designs. Table 1 presents appropriate uses of paleoflood information in UASCE decision-making based on this report.
The main conclusions of this report are:
• The utility of paleoflood information should be considered with respect to the H&H decision at hand, including both the policy and the tech-

CWTS 2013-2 iv
nical requirements of that decision. Paleoflood information is not rele-vant for all H&H decisions. For example, if the decision leads to the de-sign or modification of a high hazard dam, then the utility of paleoflood information is minimal, as the current design standard is based on the Probable Maximum Floods.
• For situations where the assumptions necessary to translate the evi-dence of paleofloods, or the lack of a paleoflood, into potentially useful H&H information are applicable, the resources necessary to conduct the translation should be weighed against the underlying uncertainties and assumptions. These assumptions include:
o That the channel and the surrounding watershed have remained stable since the paleoflood;
o That if statistics are to be applied, the underlying statistical distri-bution is reasonably assumed to apply across the full range of ob-servations and paleoflood data and that attribution of paleoflood type can be made;
o That the non-exceedance probabilities are reasonable with respect to the paleoflood information; and
o That the appropriate hydraulic models can be parameterized and calibrated with confidence.
• Paleofloods can provide direct and useful information about stage his-tories and can be used, given cautions, to estimate discrete event dis-charge values. However, there is limited evidence to support using paleoflood information to estimate a series of hydrologic events with multiple peaks, flood volumes, or durations.
• Paleoflood information is less useful if it is meant to inform a portfolio of projects or compare locations across a wide geographic region that has varied terrain and geological contexts. Paleoflood information is largely site specific, meaning that it is collected at one location and not easily transferrable to another. USACE is responsible for many very large facilities that have been altered through time, either by geologic or anthropogenic processes, and these facilities are not suitable for paleoflood analysis.

CWTS 2013-2 v
Contents Abstract ..................................................................................................................................................... ii!
Executive Summary ................................................................................................................................ iii!
Figures and Table .................................................................................................................................... vi!
1! Introduction ...................................................................................................................................... 1!
2! Context for the H&H Use of Paleoflood Hydrology ...................................................................... 4!
3! Paleoflood Data Collection: Determination of Stage ............................................................... 10!
4! Calculation of Paleoflood Discharge .......................................................................................... 16!4.1! Empirical Relationships ................................................................................................ 16!4.2! One-Dimensional Modeling (Step-Backwater Method) .............................................. 19!4.3! Two-Dimensional Modeling .......................................................................................... 21!
5! Calculation of Paleoflood Volume ............................................................................................... 24!5.1! Hydrograph Shape ........................................................................................................ 24!5.2! Precipitation Analysis ................................................................................................... 26!
6! Application of Paleoflood-Derived Information ......................................................................... 28!6.1! Assumptions ................................................................................................................. 28!6.2! Flood Frequency Analysis ............................................................................................. 28!6.3! Record Length and Extrapolation ................................................................................ 31!
7! Utility of Information within USACE Policies and Goals ........................................................... 33!7.1! Extrapolation ................................................................................................................. 33!7.2! Risk Inventory Consistency .......................................................................................... 33!7.3! Stage-, Discharge-, and Volume-Based Decisions ...................................................... 34!7.4! Consideration of Change .............................................................................................. 36!7.5! Risk and Design Decisions ........................................................................................... 36!
8! Conclusions .................................................................................................................................... 38!
References ............................................................................................................................................. 41!

CWTS 2013-2 vi
Figures and Table
Figures
Figure 1. Example of developing a portfolio of risks utilizing Equation 1 ............................................. 8!Figure 2. Example cross-section showing various paleoflood indicators, including slackwater deposits .................................................................................................................................. 11!Figure 3. Example stratigraphy showing paleoflood information for Hailstorm Alcove, Spring Creek, Black Hills, South Dakota ................................................................................................ 12!Figure 4. 1982 assessment of locations where slackwater deposits were favorable for paleoflood determinations ....................................................................................................................... 13!Figure 5. Paleohydrologic non-exceedance bound development ....................................................... 14!Figure 6. Sample stage–discharge relationship for the Laramie River at Laramie for 1933–1967 ............................................................................................................................................... 16!Figure 7. Example of hydrograph scaling through either a unit hydrograph approach or an observed hydrograph approach .............................................................................................................. 25!Figure 8. Peak flood frequency for Bear Creek and Western Run ...................................................... 30!
Table
Table 1. Summary of relative appropriateness of paleofloods for application leading to USACE H&H decisions .............................................................................................................................. 40!
CWTS 2013-2 1
1 Introduction
Sustainable integrated water resources management requires considera-tion of physical infrastructure, government policies, and social systems to provide a holistic focus on water resource challenges and opportunities that reflects coordinated development and management of water, land and related resources (USACE 2011). Global changes are increasing the vulner-abilities of the Civil Works missions of the U.S. Army Corps of Engineers (USACE), including aging infrastructure, hydrologic nonstationarity, de-mographic shifts and associated urban and coastal development, changes in navigation and shipping practices, and changes in agricultural practices and responsibilities for ecosystem restoration (USACE 2011). The assump-tions that defined the physical design and operational considerations for existing projects are, in some places and for some projects, no longer valid, given these global changes. USACE continually assesses the reliability of its infrastructure through evaluations of the potential risks associated with all continuing global stresses over a full range of loading conditions repre-senting minimum essential guidelines.
The USACE Hydrology, Hydraulics, and Coastal (H,H,&C) Community of Practice (CoP) conducts a wide variety of assessments of the stresses on USACE infrastructure, including the design and construction of dams and levees, operation criteria to meet the authorized purposes of projects, flood hazard and response, and water availability. The varied hydrology and hy-draulics (H&H) applications require a wide range of currently available data that can be applied to varying scales of economic and technical deci-sions, and practitioners continually search for additional information that can inform future decisions. The information required to support H&H decisions ranges from frequency estimates of river stage, to total volumet-ric runoff from one or more hydrologic events, to hydraulic calculations, to assessments of probable maximum floods or precipitation, and its uses can range from portfolio risk assessments to the design of new infrastructure. These varied requirements mean that there is no “one-size-fits-all” ap-proach to the application of information to H&H decisions. Rather, the considerations to determine the information appropriate for the decision at hand take into account:

CWTS 2013-2 2
• The availability of data. The use of available and documented data should be assessed, and new data should be peer reviewed and careful-ly documented.
• The scope of the decision. The information that feeds into an H&H de-cision should be as relevant as possible. For example, if a decision is to be made that requires knowledge of hydrologic volumes, historical or future information about hydrologic volumes should be sought.
• The economics of the decision. The economic impacts of a decision should be considered so that the level of effort to obtain information used in making that decision is not disproportionately expensive or time-consuming.
• The national consistency of USACE policies. USACE Civil Works has a national reach, so information used in one location should be con-sistent with information used in another.
• The mission and goals of USACE. USACE has Congressionally author-ized missions, and its projects and systems have authorized purposes. The application of information must be in accordance with these mis-sions and purposes.
Ultimately, having direct foresight of future events that may stress Civil Works projects is the perfect solution. Without knowledge of future events, planners make assumptions as they attempt to characterize the range of future possibilities. The most common assumption is that the observed record is a reasonable predictor of the future. However, this assumption has a variety of drawbacks, including potentially misplaced confidence in characterizing events that are possible but have not been observed. A sub-stitute for knowledge of future events with low probabilities is often sought in the very distant past as well as from streamflow gaging data from the past 10–100 years (the observed record). Paleohydrology describes the evidence of the movement of water and sediment in stream channels before the time of continuous hydrologic records or direct measurements (Costa 1987).
Many types of paleohydrologic information exist, such as dendrochronolo-gy, pollen samples, stratigraphy, and marine sediments, and they provide indirect evidence of different types of hydrologic events. Information can be derived with respect to both floods and droughts, though the tools and practices for characterizing these two hydrologic extremes are somewhat different. The application of paleohydrologic information to engineering practices is a specialized field that requires assumptions, costs, and knowledge that differ from those of more common H&H applications.

CWTS 2013-2 3
The goals of this report are to:
• Synthesize the relevant literature and scientific findings related to the utilization of geologically obtained and hydrologically transformed paleoflood data for use in the H&H assessments of USACE; and
• Present reasonable conclusions and recommendations about the use of paleoflood data with respect to the decisions faced by the H&H com-munity within USACE.
This document has been reviewed through an internal USACE process that included H&H experts as well as an independent external review. The ex-ternal review process—a quality information management review—was conducted by Abt Associates Inc. to enhance the quality and credibility of the report’s recommendations by ensuring that the scientific and technical work had received appropriate and objective reviews by independent ex-perts. This is in accordance with USACE’s Water Resources Policies and Authorities Civil Works Review Policy (EC 1165-2-209) and the Office of Management and Budget’s guidelines under the Federal Data Quality Act of 2000 (P.L. 106-54, Section 1(a)(3)[515]). The report underwent this rig-orous review process as it is intended to help inform H&H decisions on re-source allocations related to analyses of hydrologic risk characterization.

CWTS 2013-2 4
2 Context for the H&H Use of Paleoflood Hydrology
This report gathers definitions of paleoflood hydrology relevant to USACE design and operations, lists the relevant questions and decisions that face USACE H&H (such as estimating flood peak magnitudes, volumes, and durations for flood damage assessments, or evaluating design criteria us-ing the minimum essential guidelines), and explores the utility of paleohy-drology for flood estimation for specific decisions. A subsequent report will describe the design and maintenance questions and possible applica-tions of paleohydrology for water supply or drought estimation.
The report provides some of the rationale and justifications for the appro-priate use of paleoflood information for H&H decisions. An underlying as-sumption is that, over the period of time for which paleoflood information is available, numerous opportunities for floods to represent the hydrology of a particular watershed have occurred. Another assumption is that the paleoflood information is a reasonable predictor of the future for the time period for which a specific H&H decision is being made. This is an exten-sion of the stationarity assumption—that the past is a reasonable expecta-tion of the future—which is discussed later.
Paleoflood information is most often used in characterizing the probability of floods with low probabilities of occurrence (i.e., annual exceedance probabilities of less than 0.002). This makes intuitive sense, because floods with higher probabilities of occurring have a higher likelihood of being observed within the systematic or historical record. This report con-centrates on one decision type that often relies on these characterizations of floods with low probabilities of occurrence (infrastructure reliability as-sessment through risk analysis), but the report and its conclusions are not intended to be limited to this type of decision. This example was chosen because it presents a good opportunity to explore the use of paleoflood in-formation in the context of floods with low probabilities of occurrence that can threaten infrastructure reliability. This example is also beneficial be-cause infrastructure that is threatened by floods exists throughout the ge-ographic domain of USACE, so the concept of national consistency can be explored. The particular concept of risk analysis presented in this report applies both to the potential design and evaluation of site-specific infra-

CWTS 2013-2 5
structure and to the entire portfolio, with the intent to prioritize expendi-tures of resources in a way that reduces risk while meeting the objectives of the organization as a whole.
Risk analysis is useful for evaluating structures subject to vulnerabilities posed by floods, such as dams and levees, and the resulting consequences if there is infrastructure degradation or failure. Dam safety and levee safe-ty both employ risk analysis and often use similar technical approaches, but they do so differently based on different policy objectives, which are described below. Dam and levee safety programs represent significant in-frastructure investments within USACE for protecting human life and providing economic benefits. These programs are integral parts of ful-filling USACE policy goals—particularly life-safety goals—that must be met for all of the vast range of USACE infrastructure types and authorizations and for the wide-ranging locations and hydrological conditions where USACE operates.
The USACE policies related to the assessment of risk and the design of dams are potentially conflicting and inconsistent. The policy goal of the Dam Safety Program (ER 1110-8-2 FR, Engineering and Design - Inflow Design Floods for Dams and Reservoirs) is that “…a dam failure must not present a hazard to human life…,” while ER 1110-2-1156, Dam Safety – Organization, Responsibilities, and Activities, states that “Life Safety is paramount. A key mission of the USACE dam safety program is to achieve an equitable and reasonably low level of risk to the public from its dams.” The design of USACE dams must meet the minimum essential guidelines in which the Probable Maximum Floods (PMF) derived from the Probable Maximum Precipitation (PMP) can be passed by the dam without failure. By contrast, risk-based assessments of safety recognize that risk levels can never be zero—i.e., it is impossible to achieve no failures—so they use methods to attempt to ascertain meaningful assessments of the risk that does exist and “achieve an equitable and reasonably low level….”
In contrast, the Levee Safety Program has a policy goal to “… make sure that levee systems do not present unacceptable risks to the public, proper-ty, and environment” (USACE 2012). The design criteria are not based on the minimum essential guidelines establishing PMP and PMF passage. Therefore, there is a risk associated with levees that is consistent and can be interpreted as being greater than zero.

CWTS 2013-2 6
In addition to evaluating flood risk, dam and levee safety must consider other potential risks to safety. Risks to dam and levee safety span a wide range of potential hazard types, including seismic, hydrologic, design, and operation and maintenance. In this sense, dam and levee safety presents an opportunity to explore paleoflood information within the context of other types of information informing a decision maker. The flood infor-mation, assumptions, and limitations that go into their use must be con-sidered with respect to the other information sets also being characterized. For other potential decisions where paleoflood information may be appli-cable, the scope and scale of the decisions should also be considered when determining the appropriateness of data analysis, such as the characteriza-tion of seismic hazards up to the Maximum Considered Earthquake (MCE) (USACE 1995), or the regular observations and detection of infrastructure performance. Within a risk management framework, programmatic objec-tives are sometimes most efficiently met by allocating resources to the most significant hazards. There is, thus, a need to continually evaluate each of the potential risks in a systematic and consistent manner such that investment decisions can be made to continually provide the safety and economic benefits that are expected from USACE projects. The systematic and consistent evaluation of risk also should provide information for de-signing corrective actions.
Risk (R) is defined within this report as the product of the probability (P) of a particular event (e) that can or would cause the failure of infrastruc-ture at a particular location (i) with the consequences of that failure (C):*
Ri,e = Pi,e × Ci,e|Pi,e . (1)
While this report is focused on hydrologic events that could lead to a fail-ure mode, there are other hazard types that can cause performance fail-ures, including seismic events, material degradation, and seepage. Hydro-logic risk evaluation should be considered in context with these other risks as well. There are multiple types of hydrologic risks (e.g., convective pre-cipitation events, hurricanes, atmospheric rivers, snowmelt floods). Each event type can have multiple pathways (failure modes) in which they
* There are many specific definitions of risk within USACE guidance documents that are all relatively
consistent. For example, ER 1105-2-101 (USACE 2006) defines risk as “the probability an area will be flooded, resulting in undesirable consequences”; ER 1110-2-1156 (USACE 2011) defines risk as “a measure of the probability and severity of undesirable consequences or outcomes.” The definition used in this report is intended to be a generalization of risk definition that is consistent with USACE guidance.

CWTS 2013-2 7
threaten infrastructure. Each must be characterized in a comparable man-ner if policies are to be applied consistently so that corrective action deci-sions can be made for different failure modes. Equation 1 provides a valu-able tool to prioritize investments, both at a particular location and across an inventory of dam and levee assets. The total hydrologic risk at a given location is thus the summation across all hydrologic events (e) and across an entire inventory.
As indicated previously, the information necessary to make informed deci-sions should be scaled to the particular decision and its consequences. For example, levee failure is often evaluated by the probability of exceeding a specific stage within a river reach due to individual and discrete flood events. For large reservoirs or systems of reservoirs, the inflow volume over different time periods that may contain one or more discrete hydro-logic events (i.e., 3-, 7-, or 15-day volumes) is the critical metric for deter-mining risk. Risk-based approaches, therefore, must take into account not only the desire for consistency across infrastructure types, but also the dif-ferent failure modes and the critical metrics for determining the failure modes. Figure 1 depicts the risk management framework including these considerations. For appropriate depictions of projected risks across the entire USACE dam and levee inventory, consistency is desirable through-out all aspects of quantitative risk evaluation, from hazard, to event type, to location, to national perspective.
To be able to quantify risk utilizing Equation 1, USACE, and the risk man-agement community in general, assigns probabilistic attributes (P) to hy-drologic events using a variety of statistical techniques, physical system modeling, and professional engineering judgment. For example, this can include assigning probability distributions to systematic flood records or using systematic local or regional rainfall records to assign rainfall fre-quencies and evaluate runoff potentials through rainfall-runoff modeling. For USACE applications, these are described in:
• EM 1110-2-1411 (USACE 1965), Standard Project Flood Determi-nation;
• EM 1110-2-1413 (USACE 1984), Hydrologic Analysis of Interior Areas;
• EM 1110-2-1415 (USACE 1993a), Hydrologic Frequency Analysis; • EM 1110-2-1416 (USACE 1993b), River Hydraulics; • EM 1110-2-1417 (USACE 1994), Flood-Runoff Analysis;

CWTS 2013-2 8
Figure 1. Example of developing a portfol io of r isks uti l iz ing Equation 1. For information to inform decisions of resource al location to reduce r isk, each aspect of individual fai lure mode r isk, fai lure modes for each location, and locations across infrastructure inventory must be consistent and comparable.
• EM 1110-2-1419 (USACE 1995b), Hydrologic Engineering Re-
quirements for Flood Damage Reduction Studies; and • EM 1110-2-1619 (USACE 1996), Risk-Based Analysis for Flood
Damage Reduction Studies. The most common approach used in these guidance manuals for assigning probabilities to discrete hydrologic events is frequency analysis. The fre-quency analyses are primarily based on the period of observed record to make assertions about non-exceedance probabilities on the order of 10–2 to 10–3. There are and should be some limits to the extrapolation or inter-pretation of information when utilizing short systematic records, as indi-cated later in this report. This range of annual exceedance probabilities (AEPs), 10–2 to 10–3, is often in the range of somewhat reasonable extrapo-

CWTS 2013-2 9
lation given an approximate 50- to 100-year period of systematic or histor-ical record. Where risks to public safety and populations are especially large, which is the case for many USACE dams and levees, the design risk (i.e., for little to no loss of life) likely requires P values much smaller than 10–2 or 10–3. For this reason, hydrologic hazard estimates should be ascer-tained with orders-of-magnitude smaller non-exceedance probabilities.
To provide the information in the range of AEPs used in dam and levee safety, there are choices facing the USACE H&H practitioner for every ap-plication. These include what information to use, how to use the infor-mation, how much time to spend, and how to characterize the uncertainty associated with the results. There are four methods primarily used in en-gineering practice to estimate hydrologic event probabilities in this range of AEPs (Maidment 1992):
1. Extrapolation of a flood frequency curve, utilizing (where possible) his-toric floods and paleofloods and regionalization;
2. Extrapolation of rainfall frequency data to very low probabilities and estimation of the flood from this;
3. Generation of very long series of rainfall events from a stochastic rain-fall model, estimation of the floods from the largest rainfalls, and use of a frequency analysis of these large floods; and
4. Estimation of the probable maximum flood and use of either this or a smaller flood derived from it.
This report explores, specifically, the assumptions and application with respect to the use of paleoflood information within the context of USACE H&H studies for risk estimation. This report presents the information available from paleoflood field data, the hydraulic and hydrologic calcula-tions and assumptions that can be used to transform the field data into frequency information, and recommendations for the use of that infor-mation. For a complete review of the history of paleoflood information, which is not the purpose of this report, the reader is directed to Baker (2008).
CWTS 2013-2 10
3 Paleoflood Data Collection: Determination of Stage
Paleohydrology is the study of the evidence of the movement of water and sediment in stream channels before the time of continuous hydrologic rec-ords or direct measurements (Costa 1987). To inform risk management applications, information about very large hydrologic events that have oc-curred, or about bounds on floods that have not occurred, over a period of time is assembled from indirect evidence in slackwater deposits and other paleostage indicators. These floods, whose characteristics are assembled through this indirect evidence, are deemed paleofloods (Kochel and Baker 1982, Baker 1987). Baker (2008) described paleofloods as “past or ancient floods that occurred without being recorded by either (1) direct hydrological measurement during the course of operation …, or (2) observation and/or documentation by non-hydrologists.” Field measurements of paleofloods take place through measurement of the stage of the ancient flood utilizing the evidence that remains from the events (e.g., Baker 1987). Field meas-urements can also identify evidence that helps determine that certain stages have not been exceeded for a given time period (e.g., Levish 2002).
Evidence of paleofloods is commonly measured through slackwater deposits left where flood flows are separated from the primary channel velocity (Kochel and Baker 1988). A good description of how to look for slackwater deposits is given by Sridhar (2012) in a study of Holocene flood records of the Mahi River in western India, although the hydraulics are appropriate globally:
“For paleoflood studies, a slackwater sedimentation site should be optimum for both the accumulation and preservation of the relatively fine-grained sediments car-ried high in flood flows at maximum stage. The ideal sites of deposition and subsequent preservation of slackwater deposits are the tributary mouths, channel-margin al-coves, caves and rock shelter deposits. The local hydraulic conditions at these sites result in a drop in the flow veloc-ity and deposit flood sediments. In all alluvial terrain, however, such conditions seldom prevail and hence the slackwater sediments are not well preserved so as to give significant paleohydrological inferences.”

CWTS 2013-2 11
Geologists determine the paleostage (the height above the channel bed) and ages of slackwater deposits at the locations where indicators are pre-served (Figure 2), and estimate the age at which they were deposited through radiocarbon dating or other techniques (e.g., Stokes and Walling 2002). The stratigraphic record has long been used in estimating stage to evaluate flood histories adjacent to rivers (e.g., Mansfield 1938; Patton et al. 1979; Jarrett 1991). The stratigraphic example from Harden et al. (2011) shown in Figure 3 is documented by them as follows:
“Two pits were excavated 0.5 mi upstream from Super-scour Alcove at Hailstorm Alcove…. Pit A provided evi-dence of three floods since 382–192 B.C. The middle flood unit (II) was dated to A.D. 1296–1410 and is likely the same flood as described later in this section for the Temple of Doom Alcove. The most recent flood deposit in pit A is from 1972, with its relatively low elevation requir-ing a flow of 10,000 ft3/s for inundation. Pit B had evi-dence of two floods, the most recent being from 1972. The oldest flood unit (II) in pit B likely correlates with flood unit II in pit A. Because pit B is lower than pit A, corre-sponding flow values are smaller for pit B, thus limiting the utility of this pit in developing the overall flood chro-nology. A thin layer of flood sands that were dated to A.D. 1486–1644 was identified in a small crevice about 3 ft higher that pit A. The corresponding flow for deposition of these sands is about 18,200 ft3/s. ...”
Figure 2. Example cross-section showing various paleoflood indicators, including slackwater deposits. (Adapted from Jarrett and England 2002.)

CWTS 2013-2 12
Figure 3. Example stratigraphy showing paleoflood information for Hailstorm Alcove, Spring Creek, Black Hil ls , South Dakota. (From Harden et al . 2011.)

CWTS 2013-2 13
Information from stratigraphic records can provide paleoflood stages for individual events that occurred over a very wide range of the distant past. The uncertainties associated with the information will be discussed later in this report. The uncertainty associated with radiocarbon dating, which can be on the order of 100 years for a sample with an age of 10,000 years (Stedinger and Baker 1987) will not be addressed further; this uncertainty is not large if the time history is an order of magnitude older. However, where assumptions for interpreting paleoflood data cannot be supported, or where slackwater deposits from paleofloods (e.g., House 2002a,b) are not available at a particular location (Figure 4), then different information types may be available to provide information about stages that have not been exceeded over a given time period. Figure 4 is an example of a map that identifies where slackwater deposits might be expected to be found. Unfortunately, while there has been much progress in locating paleoflood information by academia and Federal agencies such as the Bureau of Rec-lamation, there is no standardized data warehouse to readily access or share this information, nor are there consistent peer-review guidelines to assure quality. Further, this information only applies to geographic areas where the geology is suitable, and it is not reasonable to expect that slack-water deposits are available in all locations; there are natural limitations in areas outside the well-studied arid and semi-arid climates (Kite et al. 2002).
Figure 4. 1982 assessment of locations where slackwater deposits were favorable for paleoflood determinations. Without question, more slack-water deposits have been located since then, but they remain l imited in geographic avai labi l i ty and no more-recent map exists. (Adapted from Kochel 1988.)
CWTS 2013-2 14
There are other methodologies that can expand the geographic availability of paleoflood data. Overbank deposits have been used as indicators, though they do not always clearly resolve flood magnitudes (e.g., Wang and Leigh 2011). Additional indicators of paleofloods include high water marks such as tree scars, erosional scars and gravel deposits (also included in Figure 2). Each method of determining the presence of a paleoflood has application over a range of elevations or time periods.
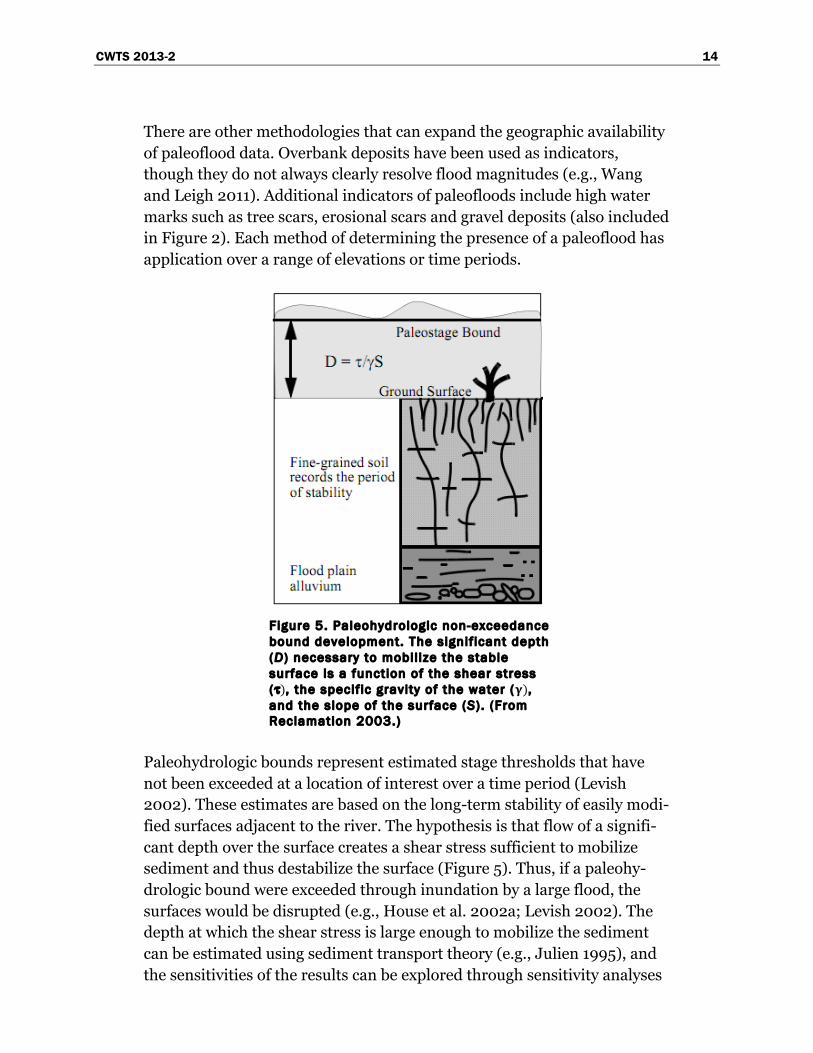
Figure 5. Paleohydrologic non-exceedance bound development. The signif icant depth (D ) necessary to mobil ize the stable surface is a function of the shear stress (τ), the specif ic gravity of the water (!), and the slope of the surface (S ) . (From Reclamation 2003.)
Paleohydrologic bounds represent estimated stage thresholds that have not been exceeded at a location of interest over a time period (Levish 2002). These estimates are based on the long-term stability of easily modi-fied surfaces adjacent to the river. The hypothesis is that flow of a signifi-cant depth over the surface creates a shear stress sufficient to mobilize sediment and thus destabilize the surface (Figure 5). Thus, if a paleohy-drologic bound were exceeded through inundation by a large flood, the surfaces would be disrupted (e.g., House et al. 2002a; Levish 2002). The depth at which the shear stress is large enough to mobilize the sediment can be estimated using sediment transport theory (e.g., Julien 1995), and the sensitivities of the results can be explored through sensitivity analyses

CWTS 2013-2 15
(e.g., Bauer and Klinger 2010). These sensitivities include varying the range of depths that might be necessary to mobilize sediment. This sensi-tivity can be carried through calculations of stage and elsewhere (as dis-cussed later). This sensitivity can ultimately be viewed as additional uncer-tainty within the analyses. There are also potential limitations to application of shear stress theory where vegetation exists in the flood plains either currently or in the past; it would be difficult to discern what shear stress is necessary to mobilize sediment that has vegetation growing on its surface. Where paleoflood indicators and bounds are available, a se-ries of estimates of both stages that have been exceeded over a given time period and stages that have not been exceeded are potentially available.
The resources associated with gathering paleoflood information are the costs of time associated with a field study, the costs associated with dating the materials gathered from the field, and the synthesis work to combine dates and stages.

CWTS 2013-2 16
4 Calculation of Paleoflood Discharge
Discharge can be calculated from the stage information gathered during field investigations in three primary ways: empirical relationships, one-dimensional modeling (e.g., Benson and Dalrymple 1967; Webb and Jar-rett 2002), and two-dimensional modeling. Each method requires differ-ent data sets and has different underlying assumptions, so each is associ-ated with different resources required and uncertainties in results.
4.1 Empirical Relationships
There are two primary empirical relationships that provide links between stage and discharge. The first are stage–discharge curves (Figure 6). With-in these relationships are observed flood events with observed values of instantaneous peak discharge and the stage associated with that flow. Stage–discharge relationships for long, straight, uniform channels often take the form of a power law equation of this form:
Q = C (h + a)N (2)
where: Q = discharge C and N = constants h = stage a = stage at which discharge is zero (Maidment 1992).
Figure 6. Sample stage–discharge relationship for the Laramie River at Laramie for 1933–1967. This example function was calculated directly from the unmodif ied record from the USGS NWIS database. (From waterdata.usgs.gov/nwis, accessed November 7, 2011.)
h"="0.23Q0.41"
0"
1"
2"
3"
4"
5"
6"
7"
8"
0" 500" 1000" 1500" 2000" 2500" 3000" 3500"
Stage&(()&
Annual&Maximum&Discharge&((3/s)&
Sample&Stage&Discharge&Rela;onship&Laramie&River&at&Laramie&(1933&A&1967)&

CWTS 2013-2 17
This approach is simple and direct but assumes that sufficient data exist to provide a statistically significant relationship. Uncertainties associated with stage–discharge relationships are typically on the order of 5–10% for low flows but can be much higher for a flood or paleoflood. Stage–discharge relationships include values of Q and h that are often significant-ly less than the paleoflood of interest because paleofloods exceed anything that has been observed since. Also, the physical nature of the channel form—the flood plains and terraces—that provides the paleoflood stage in-formation likely leads to discontinuities in the stage–discharge relation-ship; these discontinuities make it unlikely that extrapolation of an equa-tion similar to Equation 2, or one where overbank flows are considered in the rating curve but not at the desired magnitude, will provide reliable es-timates (ISO 1983).
The second empirical relationship that provides direct links between stage and discharge is Manning’s equation used with the continuity equation (Q = AV, where A is defined below and V is water velocity):
Q = 1.486nARh
23S f
12 (3)
where: A = cross-sectional area of the channel Rh = hydraulic radius Sf = friction slope n = characteristic roughness.
The form represented in Equation 3 is applicable when calculated in Eng-lish Standard Units.
To determine paleoflood discharge, the paleoflood field investigation can take survey measurements of the channel at the location where the stage information has been collected. Friction slope can be assumed to be the same as bed slope and can be surveyed in the field or calculated from a topographic map. If one- or two-dimensional modeling is planned to be used, there is no reason to apply Manning’s equation, so that approach is not discussed further.
The channel roughness can be determined using field manuals such as Barnes (1967) and Hicks and Mason (1991). The standard error in estima-

CWTS 2013-2 18
tion of n is ±30% (Maidment 1992). Errors in estimating roughness coeffi-cients can be expected to introduce less than 20% error in discharge esti-mation for step-backwater simulations in canyon rivers with channel gra-dients under 0.01 (Wohl 1998). There is varied understanding about the uncertainties associated with other indirect measurements of discharge and the time between the event and the measurement.
Although Manning’s equation is a well-known and widely applied empiri-cal hydraulic model, its application in a paleoflood context has additional uncertainties that are not usually encountered. First, it is not well known how the surveyed shape of the channel, and thus the cross-sectional area and the hydraulic radius, compares with the cross-sectional area during the paleoflood event. Any errors (or sensitivity analyses) in these meas-urements result in an exponential uncertainty in the calculation of dis-charge.
The friction slope is, by definition, the slope of the energy grade line. For cases of “uniform flow,” where the depth of the water surface does not vary significantly over a length of river, it is possible to substitute bed slope for friction slope. However, substituting bed slope for friction slope introduces additional uncertainties because the water surface profile, and thus the energy grade line, is not known for the actual paleoflood event. However, in determinations of Q, the significance of this uncertainty (or exploration of sensitivity) is somewhat reduced because of the square root relationship between friction slope and discharge.
Additional uncertainties are introduced in assuming a characteristic roughness and accounting for other types of energy losses. Field manual guidance for estimating roughness requires comparisons between the rocks in the channel, vegetation, woody debris, flood plain grasses, and other considerations to assume a single value of roughness. No methods are known for aggregating multiple flood plains and terraces to assume a single value of roughness. The channel can be divided into a main channel and flood plains, each being assigned a different roughness value. This would eliminate the difficulty in assigning a single roughness value. Sensi-tivity analyses are also possible, and they represent a valid approach to characterizing some aspects of uncertainty in assigning roughness values. Moreover, the types and coverages of grass, vegetation, woody debris, etc. during the paleo event are almost always unknown.

CWTS 2013-2 19
4.2 One-Dimensional Modeling (Step-Backwater Method)
To counter some of the shortcomings of empirical approaches to determin-ing discharge from paleoflood stage, physical modeling approaches are sometimes used. The least resource-intensive physical approach is to apply a one-dimensional physical model in a step-backwater method. Applied to paleofloods (O’Connor and Webb 1988), the physical basis is conservation of energy along a single flow line (Chow 1959):
Z1 + h1 +α1v
21
2g= Z2 + h2 +
α2v22
2g+ hf (4)
where (subscripts denote two locations within the hydraulic system): Z = thalweg elevation h = stage
α1v21
2g = kinetic energy
v = velocity g = gravity α = energy coefficient hf = frictional head loss.
This is an appropriate expression of conservation of energy for gradually varied flows, with the necessary assumptions that the loss of energy is the same for a uniform flow having the velocity and hydraulic radius of the channel section of interest. Discharge can then be calculated from velocity and channel shape as measured in the field. Implementation requires cal-culating the energy loss caused by friction using the empirical relation-ships described above for Manning’s equation and in Chow (1959) for eddy losses. The sensitivity of results associated with roughness coefficients can be explored by applying a range of roughness values (e.g., England et al. 2010).
The application of the step-backwater methods requires a number of addi-tional assumptions, including, but not limited to:
• That the cross sections measured and used are spaced so that the flow characteristics do not change significantly between them;
• That the discharge being modeled affected the entire reach at the same time;

CWTS 2013-2 20
• That the flow is “steady” and one-dimensional;* and • That the boundaries of the channel are constant.
The most significant concerns are the assumptions of one-dimensional be-havior and constant boundaries. Some estimate of approximate uncertain-ties can be explored through sensitivity analyses of assumptions on chan-nel geometry.
Floods are inherently multi-dimensional phenomena with two- and three-dimensional attributes of flood plains and eddies that are difficult to ac-count for empirically. Stable channel geometry requires that the cross sec-tions of the channel at the time of the paleoflood are the same as when the cross section measurements were taken. This approach is useful for bedrock channels that are known not to have been re-formed since the paleoflood (Baker 2008). As specified by O’Connor and Webb (1988), “best results are achieved for hydraulically simple reaches in stable channel systems that contain several representative paleoflood high-water indicators.”
Of special importance in a risk analysis application, all information must be in a geographic location at or transferrable to the location of interest. If transferrable, this transfer induces uncertainties not discussed in this re-port. Although one-dimensional models may be informative from a physi-cal perspective, they have many limitations, as described by Carrivick (2006):
“Whilst these 1D ‘step-backwater’ models compute energy-loss between successive cross-sections and ei-ther subcritical or supercritical flow regimes, they are unable to model many features of high-magnitude floods. Indeed step-backwater models, slope area methods and other paleohydrologic methods only provide reconstructions of peak discharge. Thus these methods do not provide information on how flow conditions varied before and after peak stage, or how long peak discharge persisted. Other features of high-magnitude floods are also excluded, such as rapidly varied flow, or specifically; simultaneous inundation
* Not all one-dimensional hydraulic models assume “steady” flow. Unsteady one-dimensional models
are available but require additional assumptions, calibration, and validation to conduct an unsteady analysis.

CWTS 2013-2 21
of multiple channels, sheet or unconfined flow, simul-taneous channel and sheet flow, flow around islands, hydraulic jumps, multi-directional flow including backwater areas, hydraulic ponding and multiple points of flood initiation. Without a quantification of the hydraulics associated with these flow conditions, high-magnitude flood impacts cannot be fully under-stood.”
The practical application of a physical modeling approach to a paleoflood study requires significantly more resources than do empirical methods, and users must recognize that one-dimensional modeling of paleofloods represents a different application of hydraulic models than do normal H&H assessments. The field investigations must sample enough cross sec-tions to satisfy the assumption that the flow is not changing significantly between them. Also, sufficient datable material needs to be collected to age flood deposits or terrace surfaces to provide consistent paleoflood infor-mation for each flood deposit and throughout a paleoflood study reach or reaches. Finally, additional hydraulic modeling must take place to conduct the step-backwater analysis. The actual computations can be done rela-tively easily through application of HEC models, and a wealth of applica-tions could be cited (e.g., England et al. 2010). A properly calibrated one- or multi-dimensional model can address some of the hydraulic features characterized by Carrivick (2006). However, except for the single case of a bedrock-confined single channel, it is not possible to know with any cer-tainty the hydraulic features of a paleoflood. Therefore, it is also not possi-ble to calibrate or validate a more complex hydraulic model. In most cases, when one-dimensional hydraulic models are used, the step-backwater steady flow assumptions are used without characterization of complex hy-draulic features.
4.3 Two-Dimensional Modeling
In cases where empirical approaches and one-dimensional modeling as-sumptions are not supported, it is possible to account for additional flood complexities through the application of physically based two-dimensional hydraulic modeling. As with one-dimensional modeling, two-dimensional modeling is a physical approach, based on first-order principles that can relate stage to discharge for a discrete paleoflood event. Unlike one-dimensional modeling, two-dimensional modeling allows for considera-tions of secondary currents of flood flows, which are likely to be a more
CWTS 2013-2 22
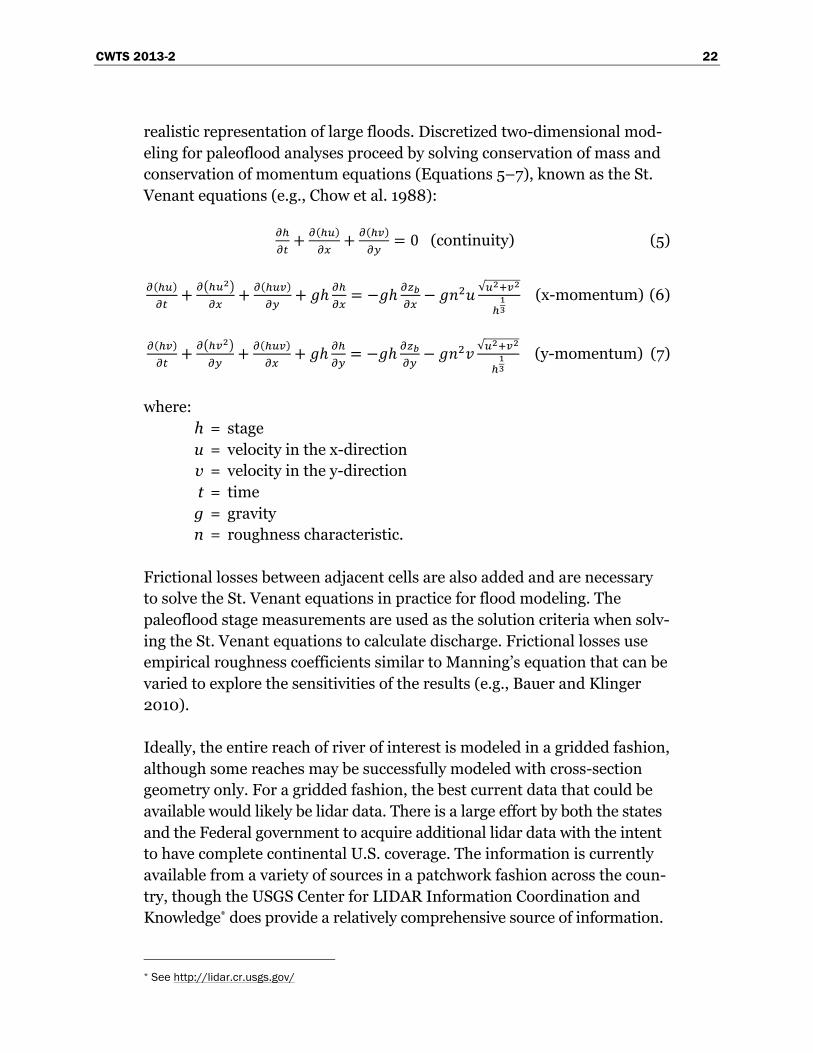
realistic representation of large floods. Discretized two-dimensional mod-eling for paleoflood analyses proceed by solving conservation of mass and conservation of momentum equations (Equations 5–7), known as the St. Venant equations (e.g., Chow et al. 1988):
!!!" +
! !!!" + ! !!
!" = 0 (continuity) (5)
! !!!" + ! !!!
!" + ! !!"!" + !ℎ !!!" = −!ℎ !!!!" − !!
!! !!!!!
!!!! (x-momentum) (6)
! !!!" + ! !!!
!" + ! !!"!" + !ℎ !!
!" = −!ℎ !!!!" − !!!! !!!!!
!!!
(y-momentum) (7)
where: h = stage u = velocity in the x-direction v = velocity in the y-direction t = time g = gravity n = roughness characteristic.
Frictional losses between adjacent cells are also added and are necessary to solve the St. Venant equations in practice for flood modeling. The paleoflood stage measurements are used as the solution criteria when solv-ing the St. Venant equations to calculate discharge. Frictional losses use empirical roughness coefficients similar to Manning’s equation that can be varied to explore the sensitivities of the results (e.g., Bauer and Klinger 2010).
Ideally, the entire reach of river of interest is modeled in a gridded fashion, although some reaches may be successfully modeled with cross-section geometry only. For a gridded fashion, the best current data that could be available would likely be lidar data. There is a large effort by both the states and the Federal government to acquire additional lidar data with the intent to have complete continental U.S. coverage. The information is currently available from a variety of sources in a patchwork fashion across the coun-try, though the USGS Center for LIDAR Information Coordination and Knowledge* does provide a relatively comprehensive source of information.
* See http://lidar.cr.usgs.gov/

CWTS 2013-2 23
The solution to the two-dimensional equations is capable of describing many of the complexities of floods, although significant assumptions must still be maintained. Among these is that the gridded surface to be modeled is the same now as it was during the paleoflood event, that the location to be modeled is at the location of interest for determining risk or is transfer-rable, and that the flow characterization as steady or unsteady and uni-form or nonuniform is consistent with the actual event. When appropriate assumptions are supportable, it is possible that the solutions can be ob-tained for very complex flood flows (e.g., Carrivick 2006). When a two-dimensional model is applied, care must be taken not to satisfy assump-tions by oversimplifying the physical processes and thereby reduce the robustness of the solution.
The data requirements and resources associated with collecting infor-mation to conduct two-dimensional analyses can be significantly higher than for a one-dimensional or empirical approach. Moreover, the compu-tational complexities of running two-dimensional models are significantly greater than for one-dimensional models, although government, academic, and commercial software is available and has been widely applied.

CWTS 2013-2 24
5 Calculation of Paleoflood Volume
Section 4 focused on methods of calculating instantaneous discharges as-sociated with the stages measured in the field. There are many H&H deci-sions that are based on volumes, rather than discharges. For paleoflood information to inform these decisions properly, it is necessary to calculate the volumes associated with stage and discharge measurements. There ex-ists at present no peer-reviewed literature that advocates or identifies how to directly infer hydrographs from paleoflood evidence; however, there are two primary means by which this can be done based on the discharge cal-culations determined using the methods discussed in Section 4. The first is to assume a characteristic hydrograph shape, and the second is to conduct a precipitation analysis.
5.1 Hydrograph Shape
The most straightforward way to calculate a volume associated with a peak discharge is by assuming the shape of the event hydrograph. This can be done either by assuming a unit hydrograph shape for the location of inter-est or by utilizing a hydrograph shape or shapes that have been observed at the location of interest.
The unit hydrograph represents the pulse response function of a linear hy-drologic system (Sherman 1932; Chow et al. 1988). A unit hydrograph rep-resents the input of a unit of water into a watershed and the timed outflow hydrograph at a location of interest. To estimate a paleoflood volume, it can be assumed that some rainfall event increases the input to the unit hy-drograph model such that the peak of the hydrograph is equal to the peak discharge calculated in a manner described in Section 4. This can also be extended to observed hydrographs, and it can be assumed that they repre-sent the basin response to rainfall input for a variety of magnitudes. Figure 7 represents this approach for both a unit hydrograph and an observed hy-drograph. For the unit hydrograph approach (and similarly for an ob-served hydrograph that can be standardized for each unit of rainfall input), it begins with a unit hydrograph that has been developed appropriately for the basin of interest with some base flow component. To estimate volume, every ordinate within the rainfall portion of the unit hydrograph is multi-
plied by !!!!− !!", where Qp is the paleoflood discharge, Qu is the maximum
CWTS 2013-2 25
Hydrograph Hydrograph Scaled to Paleoflood Discharge
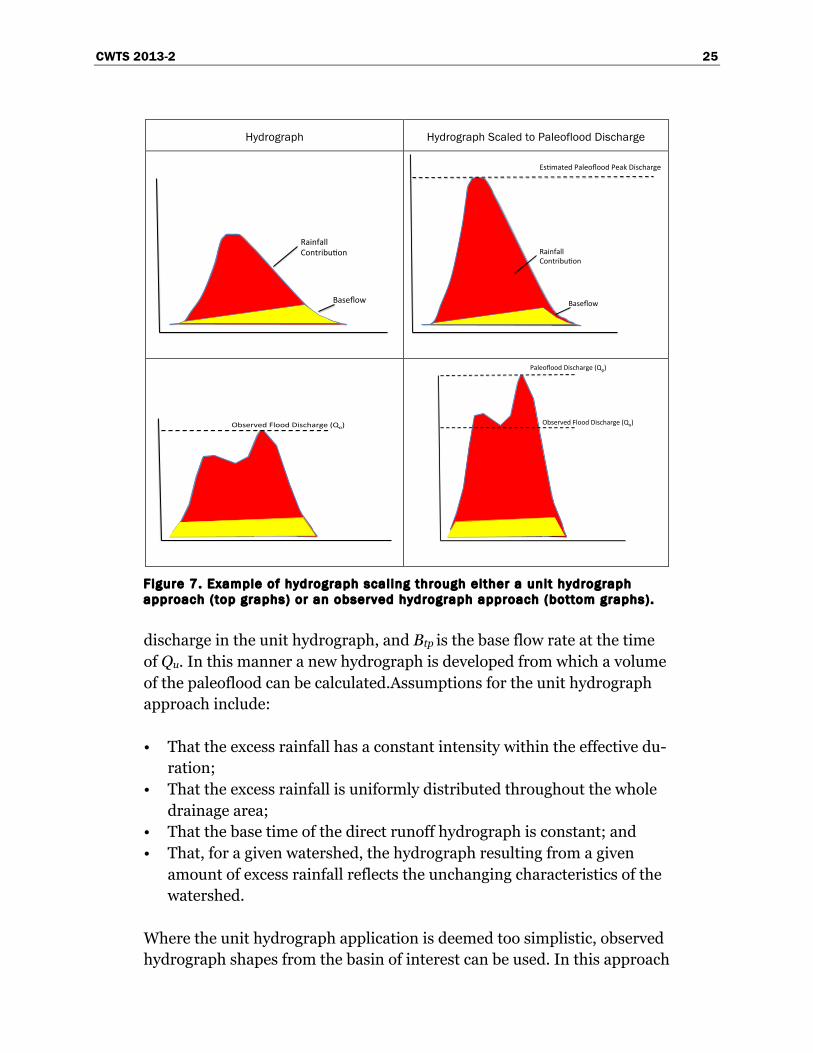
Figure 7. Example of hydrograph scal ing through either a unit hydrograph approach (top graphs) or an observed hydrograph approach (bottom graphs).
discharge in the unit hydrograph, and Btp is the base flow rate at the time of Qu. In this manner a new hydrograph is developed from which a volume of the paleoflood can be calculated.Assumptions for the unit hydrograph approach include:
• That the excess rainfall has a constant intensity within the effective du-ration;
• That the excess rainfall is uniformly distributed throughout the whole drainage area;
• That the base time of the direct runoff hydrograph is constant; and • That, for a given watershed, the hydrograph resulting from a given
amount of excess rainfall reflects the unchanging characteristics of the watershed.
Where the unit hydrograph application is deemed too simplistic, observed hydrograph shapes from the basin of interest can be used. In this approach
Baseflow(
Rainfall(Contribu3on(
Baseflow(
Rainfall(Contribu3on(
Es3mated(Paleoflood(Peak(Discharge(
Observed(Flood(Discharge((Qo)( Observed(Flood(Discharge((Qo)(
Paleoflood(Discharge((Qp)(

CWTS 2013-2 26
an observed hydrograph of a flood event is assumed to be characteristic of the watershed’s response to extreme precipitation. Base flow is character-ized, using observed flows in the basin and engineering judgment, for the flood event. Each ordinate of the rainfall contribution to the flood is then
scaled by !!!!− !!" in the same manner as for the unit hydrograph ap-
proach. The advantage of using observed hydrographs is that multiple hy-drographs can be used to account for sensitivities in shape in producing overall volume estimates. As with the unit hydrograph approach, there are significant assumptions about the rainfall runoff response inherent in the scaling approach to any hydrograph.
5.2 Precipitation Analysis
Another approach for estimating paleoflood volume is to combine a pre-cipitation analysis with the paleoflood discharge estimated through an ap-proach described in Section 5.1. Where the assumptions of rainfall homo-geneity in time and space are not warranted for a unit hydrograph approach as described above, a precipitation approach can add heteroge-neity that better reflects the physical rainfall process.
In this approach, various rainfall intensities, durations, and locations can be explored in a stochastic manner. The rainfall generation is coupled to a runoff model, and the generated rainfall isohyets can be manipulated until the peak discharge at the location of interest matches the paleoflood dis-charge calculated through methods described in Section 5.1. This can be obtained by stochastic storm transposition (Franchini et al. 1996) and rainfall scaling or through the direct use of a rainfall frequency curve cou-pled with a stochastic representation of the runoff process (e.g., HEC 2003; Bullard et al. 2007). For sufficiently large basins, the number of possible rainfall patterns and combinations that could theoretically pro-duce the paleoflood peak is large. Each of these has a different hydrograph and thus a different volume. If volume is the variable of interest, it may be prudent to explore the sensitivity of the results to hydrograph shape.
It should be apparent that this type of precipitation approach not only in-cludes the physical processes of rainfall, but also allows much greater flex-ibility, thus potentially providing a more direct estimate of volume runoff. The NRC (1988) and HEC (2003) both note that utilizing stochastic tech-niques of rainfall runoff along with the paleoflood information provides a sounder basis from which to estimate extreme runoff. This type of ap-

CWTS 2013-2 27
proach is consistent with EM 1110-2-1417 (Flood Runoff Analysis), which states that “streamflow peaks or volumes of a specified frequency can be caused by an infinite number of combinations of storms and watershed states.” An approach that uses the stochastics of various physical processes does not require assumptions of single watershed states or responses to single precipitation events. This, of course, comes at a resource cost, both in time and in the complexity of calculations. This type of approach also requires a great deal of engineering judgment to transform the myriad of potential solutions into usable products for decision making on a case-by-case basis.

CWTS 2013-2 28
6 Application of Paleoflood-Derived Information
6.1 Assumptions
Application of paleoflood information should take into account the various assumptions and uncertainties used in the development of the information described in Sections 2–5. It is always possible to employ equations and solve them, but assessments of these assumptions should not be ignored. Where assumptions are not justifiable, other sources of information should be sought or the decision requirement altered to one for which reli-able information is available, potentially through the application of risk-averse decision making. Of critical importance in any potential application of paleoflood information is landform stability, that is, that the river and flood plains have remained stable between the time of the paleoflood and the current era when calculations are being made. Furthermore, in charac-terizations of the flood frequency analysis described below, the assump-tion that the rainfall runoff response during the paleoflood is similar to current mechanisms must be supported. Changes in vegetation, soil mois-ture characteristics, and urbanization all affect the response of a basin to rainfall. The question about whether a rainfall event that occurred today would have had the same flood response throughout the paleoflood time period should be answered. For small headwater basins with little vegeta-tion or geologic change, this is a reasonable assumption. For large basins with significant regulation, urbanization, agricultural development, or other changes, this seems much less likely.
6.2 Flood Frequency Analysis
The ability of flood frequency methodologies to account for paleoflood in-formation has been advanced over the past decade through the develop-ment of methods such as the expected moments algorithm (EMA) (e.g., Cohn et al. 1997; England et al. 2003), which allows for the fitting of a Log-Pearson Type III distribution including paleoflood information. Eng-land et al. (2003) assumed that the paleofloods were perfectly known, so the uncertainties in discharge estimates were not evaluated; however, im-plementation techniques that allow uncertainties to be quantified are available.

CWTS 2013-2 29
Alternatively, methods to include paleoflood information have been devel-oped for other distributions in a parametric Bayesian framework (O’Connell et al. 2002) or in a nonparametric manner (O’Connell 2005). Each of the methods discussed here relates to the application and fit of frequency curves to stage and discharge. As mentioned earlier, there was no literature found on the development of volumetric information or dura-tion directly from paleoflood information.
Figure 8 illustrates the effect of using additional information such as paleoflood data with observed data. Paleoflood information can alter the calculated probabilities, so the observed floods can either reduce the prob-ability of occurrence (Figure 8, top) or increase the probability of occur-rence (Figure 8, bottom). There have been other examples that demon-strate how paleoflood information can inform flood frequency estimates of stage and peak discharge (e.g., Stedinger and Cohn 1986). What remains unknown, as is illustrated by Figure 8, however, is whether or not the paleoflood estimates come from the same distribution as the observed flood events. While methods applied over the entire probabilities of inter-est provide “fit” at any specific point within the frequency distribution, it is unknown whether the fit is an improvement to the actual characterization of flood frequency or simply an artifact of statistical manipulation. In both cases illustrated in Figure 8, the addition of the kth largest floods reduces the fit of the actual observed gaged floods. The question then arises whether the distribution is a reasonable fit across all of these floods. For example, in the Bear Creek flood frequency curve, if the kth largest floods (paleofloods) were generated by a particular mechanism (say, snowmelt) and the observed floods represent a different mechanism (say, discrete rainfall events), then the rainfall flood frequencies are being manipulated by snowmelt floods. For the case of the use of a non-exceedance bound, this is of less concern because the statement that a certain stage has not been exceeded would remain accurate, no matter the mechanism of flood generation.

CWTS 2013-2 30
Figure 8. Peak f lood frequency for Bear Creek (top) and Western Run (bottom). The sol id l ines show deviations from the gage data through uti l ization of the kth largest f loods. In both cases the inclusion signif icantly alters the shape of the f lood frequency distr ibution to account for the k th largest f loods but reduces f i t for the largest gaged f loods. (From England et al . 2003, with copyright permission.)
When one examines the Type I above-thresholdfloods (k and Qmax), EMA does a better job atpredicting the largest floods, 11 out of 13 sites usingthe k observations and 10 out of 13 sites using theQmax observation (Table 4). B17H appeared toperform marginally better than EMA for the NorthFork Poudre and Parana River sites when one uses theARD (g; k; and Qmax) numerical criteria. However,probability plots for these two sites (not shown)indicate that the performance of the estimators isnearly indistinguishable and most likely the differ-ences are well within data sampling variability. Incontrast, B17H performs poorly as compared to EMAfor several sites where the historical/paleoflood periodis long, especially for Bear Creek (Fig. 3), andsubstantially overestimates the largest floods. Thisfinding is similar to the Monte Carlo simulationresults reported by England (1998) for Type Icensored samples and long record lengths.
The EMA-B17H comparison for Type II censoredsamples indicated somewhat similar results as forType I samples. It appears that B17H does a
marginally better job at fitting the g observed floods(nine out of 12 sites) as indicated in Table 4; but againthe differences between the methods are practicallynegligible. B17H showed a slight advantage when theARDðgÞ results were summed for the Type II sites, butperformed worse than EMA for the large floods(Table 4). Based on the results shown in Table 4, thelargest difference between the two estimators, whereB17H performed better than EMA, was observed forthe Savannah River site. However, the EMA estimatorover-predicted the largest flood by about 13 percent,which is typically within measurement error for thelargest floods. The two estimated curves are verysimilar in shape and both provide a reasonable fit tothe data (Fig. 4).
The EMA estimator performed particularly well infitting the largest observed floods ðQmaxÞ at all 11 siteswhere k ¼ 1; as compared to the B17H estimator. Thisfinding is consistent with the simulation resultspresented by England (1998). The practical differ-ences between B17H and EMA for Type II samplesare illustrated by an example. For the Western Run
Fig. 3. Bear Creek flood frequency plot (Type I censoring, site 16).
J.F. England Jr. et al. / Journal of Hydrology 278 (2003) 172–196 185
data, the estimation procedure results were nearlyidentical for the g observations, with B17H perform-ing slightly better than EMA; frequency curves forthis site are shown in Fig. 5. However, B17Hunderestimated the maximum peak at Western Runby over 40 percent (Table 4), which is the oppositesituation from Bear Creek (Fig. 3).
Three Type II data sets have particularly short peakdischarge gage records (less than or equal to 20years): Muddy Creek, Junction Creek, and CoffeeCreek. For these sites, estimation of flood exceedanceprobabilities, for return periods greater than 40 years(about twice the record length), is highly problematic.The addition of the largest flood known in some longtime period can substantially improve extreme floodprobability estimates. The B17H estimator for thesethree data sets underutilizes the largest flood infor-mation because it represents a time period longer than500 years, and underestimates the largest floodmagnitude by 33–64 percent (Table 4). Thesepractical results agree with Type II Monte Carlosimulation results (England, 1998).
One interesting result is that EMAdoes not appear toprovide a good fit to the entire range of floodobservations, and over-predicts flood magnitudes inthe 10–5 percent exceedance range, for the three shortrecords mentioned above and for Clear Creek (site 14).However, B17H ignores the largest floods. EMA paysmore attention to the largest flood, fits it well, andappears to provide more accurate peak dischargeestimates for rare exceedance probabilities, for thesesites. One plausible explanation for this supposed lackof fit for certain ranges of the probability distribution isdata from mixed populations (e.g. Jarrett and Tomlin-son, 2000). The probability plots show that the largestflood is inconsistent or does not follow the general trendof the data and may indicate floods from differentmechanisms. One alternate possibility is thatuncertainties in paleoflood discharge and dateestimation have not been taken into account, or thatthe estimates are of poor quality. Other potential factorsinclude short streamflow records, inaccurate maximumdischarge estimates and/or flood dating errors, differentflood parent distributions (i.e. the data are not LP-III),
Fig. 4. Savannah River flood frequency plot (Type II censoring, site 6).
J.F. England Jr. et al. / Journal of Hydrology 278 (2003) 172–196186
CWTS 2013-2 31
Application for volumetric estimates using hydrograph scaling will result in frequency curves for varying durations that are directly parallel to each other and to the peak discharge frequency curves. This is a result of the linear relationship established through the scaling approach. Application of a stochastic rainfall approach in conjunction with the paleoflood infor-mation can result in sets of probabilistic estimates for each volume dura-tion of interest and probability of occurrence. The volume information will not be limited by a linear scaling relationship and can be further charac-terized through the use of hydrographs with multiple peaks for either one flood event or multiple events.
The hydrograph scaling approach has limited applicability, as will be dis-cussed below, whereas the rainfall approach has greater applicability but is highly resource intensive.
6.3 Record Length and Extrapolation
Practical application of paleoflood information should also consider the ability to inform the decision through extrapolation. It is important that the information should be tailored to the decision under consideration, and while paleoflood information may provide a longer time period, there are limits to the utility of extrapolation. McCuen and Galloway (2010) il-lustrated that uncertainty in parameter estimates increases with shorter record lengths, to the point of significant uncertainty when the record length is half of the desired estimate (e.g., 50 years of record for an esti-mate of a 100-year flood). Additionally, the Advisory Committee for Water Information (ACWI 2012) provided four rules to consider for flood fre-quency extrapolation:
“1) Don’t extrapolate if you don’t have to; 2) if you do have to extrapolate, do so, but only as far as neces-sary; 3) seek additional information to provide inde-pendent corroboration of the extrapolated values…; and 4) don’t give too much credibility to or place too much reliance on the extrapolated values.”
For the case of paleoflood information, if information from within exceed-ance probability of the paleoflood is desired from the frequency curve, it can provide the corroborating evidence desired for the location of interest. If a probability estimate is sought for a lower probability of occurrence, then there is little corroborating evidence available, because at present

CWTS 2013-2 32
there are no established means for regionalizing paleoflood information. If this is the case, key point 4 (“don’t give too much credibility to or place too much reliance on the extrapolated values”) should be the governing rule for determining the utility of the information. For example, Swain et al. (1998) suggested that
“…many paleoflood records do not extend to 10,000 years, and extensive regional paleoflood data sets do not currently exist. Using a record length of about 4,000 years, a typical limit of credible extrapolation might be an [Annual Exceedance Probability] of 1 in 15,000….”
Even this could be a reach, going from observations of 1 in 4,000 to 1 in 15,000, and is not entirely in the spirit of the more recent ACWI guide-lines. However, it is reasonable to expect some value for the extrapolation limit, but the exact amount is not yet known.

CWTS 2013-2 33
7 Utility of Information within USACE Policies and Goals
Sections 2-6 described the development of paleoflood information that could be available to inform decision making for H&H-based decisions within a risk context. This section now looks at the information within the context of these types of decisions.
7.1 Extrapolation
Throughout the remaining discussion, the concept of extrapolation should be kept in mind. At all times, information should considered in the context of limited extrapolation. As discussed earlier, there are no set rules for lim-its of extrapolation. The remainder of this discussion employs the rule of thumb that a record length should not be used to extrapolate to more than twice that length. For example, if a stage is determined to have a probabil-ity of exceedance of 10–3, this is not information that informs a decision based on anything less than approximately 5 × 10⁻⁴ (a 2,000-year return period). Given that the most recent ice age ended approximately 10,000 years ago, paleofloods should not be used to inform decisions requiring information less than approximately 5 × 10⁻⁵ (a 20,000-year return peri-od). This is mostly consistent with the interpretation of Swain et al. (1998) but with a slightly stricter extrapolation limit. In fact, there are no known statistics or information to inform analyses trying to estimate AEPs less than 5 × 10⁻⁵, nor are validation data currently available. Therefore, these return period requirements cannot be met through the use of paleoflood data, and different decision criteria should be sought.
7.2 Risk Inventory Consistency
Most paleoflood work is based on evidence gathered in the western U.S. or other arid areas throughout the world, but it is not directly relevant to all locations where USACE operates. This was recognized with slackwater ap-proaches (Figure 4), and it remains the case even with approaches such a thorough non-exceedance bounds. Figure 1 illustrates a hypothetical risk inventory model based on the widely used Equation 1 risk model. For each individual location, there are multiple hazards, of which hydrologic hazard is but one, and each hazard likely has multiple pathways through which it poses a risk to infrastructure. Across the Nation, this heterogeneity of haz-

CWTS 2013-2 34
ard and exposure represents a total risk to the organization. From the viewpoint of a risk-based inventory approach to asset management, we need to be able to answer questions about the utility of information that is available in one location but not in others. We must carefully consider how the two locations can be compared.
7.3 Stage-, Discharge-, and Volume-Based Decisions
Where decisions can be based solely on stage, there exists a strong founda-tion of peer-reviewed evidence that paleoflood information can inform such a decision with a reasonable amount of resource cost and quantifiable uncertainty. Care should be given to the various assumptions explored in this report, such as that the channel has remained stable over the time pe-riod of interest.
Great care should be given to the hydrologic modeling approaches to cal-culating discharge from stage, and this bears a significant resource cost as well as a priori consideration of the location of the calculation with respect to the decision location (i.e., transferability of information). There is a great deal of literature supporting the analysis of discharge from stage measurement, but to justify this approach, physically based hydraulic models should be applied, as opposed to empirical relationships. This typ-ically requires multiple paleoflood stage determinations in a reach of river. In some cases, such as single-channel, bedrock-constrained channels, one-dimensional modeling may be appropriate; however, outside of that, where possible, two-dimensional models should be applied. Not only does this require the development of a consistent set of stratigraphies along a reach, thus reducing the uncertainties of paleoflood stage measurements, but it also requires a more physical basis for the discharge determinations. Application of paleoflood information is not warranted where there are more significant uncertainties than the hydraulics associated with model-ing, and the uncertainties cannot be quantified.
For decisions that require additional analyses of paleoflood information, such as volume and duration probabilities, there are additional considera-tions. Although paleoflood information has been used successfully to in-form decisions at other Federal agencies, most notably the U.S. Depart-ment of the Interior Bureau of Reclamation, and within research programs at academic institutions, USACE is faced with a different set of responsi-bilities, policies, and goals. The most notable difference between Reclama-tion and USACE is the national scope of USACE and the very large flood

CWTS 2013-2 35
control and navigation reservoirs it manages. This leads to another con-sideration for application of paleoflood information: reservoir size.
At many large reservoirs, H&H risks are primarily calculated on total in-flow volume over varying periods of time. In this case, peak discharge is irrelevant for informing H&H decisions. Only information on volume and duration is valuable for making risk estimates, thus requiring some type of hydrograph.
Paleoflood information does not provide direct information on volume or duration and should only be used along with an equivalent-level analysis based on rainfall statistics, which should be done in a stochastic manner if a single hydrologic event analysis is desired. In this way, two sources of information can complement each other because unreasonable hydro-graphs are not generated through the stochastic process (identified by the peak discharge) but a variety of volumes and durations can be explored. This type of approach has a large resource cost because it requires an ex-tensive field investigation to inform (preferably) a two-dimensional analy-sis of the hydraulics and a significant rainfall frequency analysis and rain-fall-runoff model exercise. If these resources are reasonable with respect to the decision to be made, then it constitutes valuable information with jus-tifiable costs.
In addition, whereas stage and discharge calculations have strong support in the peer-reviewed literature, there is not a single example that could be found during the development of this report of a peer-reviewed publica-tion describing the use and development of a flood hydrograph for volume or precipitation. Given this lack of evidence, the well-established field of stochastic rainfall runoff hydrology could provide a reasonable approach for estimating potential hydrograph volumes and can be used in calibra-tion or in a check-and-balance manner with the paleoflood discharges (e.g., England 2006).
By its nature, paleoflood information describes discrete events in the an-cient past or event thresholds that have not been exceeded. If a USACE H&H decision needs to be based on consideration of multiple hydrologic events, or on operational considerations, then paleoflood information does not provide direct information to support those decisions. For example, the risk can be significant when non-extreme rainfall events persist for a long period of time. This persistent rainfall will not generate a discrete
CWTS 2013-2 36
flood event of significant magnitude that could be compared to a paleoflood, but its duration may pose a significant H&H risk at a large res-ervoir draining a large contributing area where that rainfall persists. For example, the Missouri and Mississippi River flooding in 2011 was generat-ed through a prolonged period of rainfall from several discrete events, in combination with historically rare snowfall distributions and unseasonable temperatures. It would be difficult, if not impossible, to assess the risk from that type of event based on single discharge estimates.
7.4 Consideration of Change
The global changes from demographics, land-use change (e.g., urbaniza-tion, agriculture), and climate variability and change should also be con-sidered when exploring the applicability of paleoflood information to H&H decisions. Not only does global change have relevance to the assumptions when applying the methods described in this report, but it also relates to the applicability of the information itself. This means that not only should the watershed have similar hydrologic response throughout the time peri-od of the paleoflood to satisfy the methodological assumptions, but it should also be anticipated to have a similar response for the future time period for which the H&H decision is to be applied. If this were not the case, then the decision could be made based on conditions of the past that are not applicable for the future. This is the concept of stationarity that has been well discussed in the literature (e.g., Milly et al. 2008). Methodologi-cal approaches of H&H should look towards opportunities to be informed by change.
7.5 Risk and Design Decisions
The utility of paleoflood information within H&H studies should be con-sidered within the context of not only the risk framework, but also how risk mitigation takes place. For example, two cases are considered: dam safety and levee safety. The Dam Safety and Levee Safety Programs are in-tegral to fulfilling USACE’s authorized purposes, which must be met across the vast range of infrastructure for which USACE is responsible.
The policy goal of the Dam Safety Program is that “…. a dam failure must not present a hazard to human life….” The design of USACE dams must therefore meet the minimum essential guidelines in which the Probable Maximum Precipitation (PMP) and Probable Maximum Flood (PMF) should not present a threat of failure to USACE dams. In contrast, risk-

CWTS 2013-2 37
based assessments of safety recognize that there is always inherent risk and try to ascertain meaningful assessments of that risk.
The Levee Safety Program has a policy goal to “… make sure that levee sys-tems do not present unacceptable risks to the public, property, and envi-ronment.” The design criteria are not based on the minimum essential guidelines establishing PMP and PMF passage. As with the Dam Safety Program, in practice, risk-based assessments recognize inherent risk and attempt to ascertain meaningful assessments of that risk.
To satisfy both the minimum essential guidelines for design and the prac-tical execution of the Dam and Levee Safety Programs, it is desirable to have a scientifically justifiable, nationally consistent, and physically based approach to assessments of hydrologic risk. For dam design, the determin-istic PMF is currently the design standard as a risk-averse approach to minimizing the potential loss to human life. By its nature, there is no probability associated with the occurrence of the PMF. This presents some difficulty in reconciling the requirement for probabilistic approaches to the desire to obtain as much information as possible to inform potential future conditions. For example, if it is possible to conduct a paleoflood analysis at one location but not another, and one satisfies a risk-based de-termination but the other does not, this can result in different classifica-tions of risk with the purpose of prioritizing resource allocation. The H&H analyses that inform risk and design should be consistent across infra-structure type and location to remain consistent with policy. This distinc-tion may not exist for evaluations of levee safety, where the policies do not appear to contrast, as discussed in Section 2.

CWTS 2013-2 38
8 Conclusions
Significant information about floods that have occurred or thresholds of floods that have not been exceeded can be gained through field investiga-tion of paleoflood information. There is a significant and growing body of literature supporting the utility of paleoflood information for stage and discharge frequency analysis, particularly for western and arid areas. This information and additional evidence, considered within the context of the national scope of the policies and goals of USACE H&H decisions, strongly influence the conclusions drawn within this report. The conclusions are intended to inform a wide set of decisions where practicing engineers are evaluating the most appropriate information to meet the particular needs of a decision.
The value to H&H decisions is limited where the scientific literature is cur-rently lacking or assumptions associated with specific information types are not valid. Additional complications due to stationarity questions that surround climate variability and change complicate H&H decisions and are being addressed through a series of activities with USACE in partner-ship with other Federal and non-Federal institutions..
There is evidence that stage frequency and discharge frequency analyses of paleoflood events are useful when the assumptions are clearly delineated and carefully supported. These might then be used to inform USACE H&H decisions when the resources necessary to produce the results are reason-able and consistency across the nationwide inventory is not required.
For USACE H&H decisions based on volumetric information, paleoflood information should only be employed in conjunction with comparable-level-of-effort stochastic rainfall analyses, when the resources associated with this type of analysis are reasonable with respect to the decision to be made, when site-to-site comparisons are not necessary across the Nation, and when a single-event-based hydrograph is to be considered.
Further, paleoflood analyses should only be used when the risk-based framework is consistent with the design framework that would be em-ployed to mitigate risk.

CWTS 2013-2 39
The following three governing points support the main conclusions drawn from this evaluation of the use of paleoflood information for H&H decision making within USACE:
• When considering the application of paleoflood information to directly inform H&H decisions, it is prudent to be cognizant, as stated by Cohn et al. (1997), that the “[u]se of unreliable historical information may degrade rather than improve flood-frequency estimates” (see also Hosking and Wallis 1986; National Research Council 1988; Kuczera 1992).
• While paleoflood information can effectively inform probabilistic esti-mates of stage and discharge in a straightforward manner by increasing record length, there are limits to extrapolation (as discussed in Section 7.1).
• The concept of a risk inventory is effective when all, or most, compari-sons are being made using similar information types.
The main conclusions of this report are:
• Not all H&H decisions are appropriate for the application of paleoflood information. For example, if the decision leads to the design or modifi-cation of a high hazard dam, then the utility of paleoflood information is minimal, as the current design standard is based on the PMF.
• Where the assumptions about paleofloods are reasonable, the re-sources necessary to translate paleoflood evidence (or the lack thereof) into potentially useful hydrology and hydraulic information should be weighed against the underlying uncertainties and assumptions. These assumptions include: that the channel and surrounding watershed have remained stable since the paleoflood; if statistics are to be ap-plied, that the underlying distribution is fully known and that attribu-tion of paleoflood type can be made; that the non-exceedance probabil-ities are reasonable with respect to the paleoflood information; and that the parameterization and calibration of the appropriate hydraulic models can be done with confidence. Paleofloods can provide direct and useful information about stage histories, which can be used, with caution, to estimate discrete event discharge values; however, there is limited evidence to support the application to estimates of multiple hy-drologic events, flood volumes, or flood durations.
• Paleoflood information is currently site specific and is not available for all USACE infrastructure locations, hindering its use in a portfolio as-

CWTS 2013-2 40
sessment. USACE is responsible for many large facilities that have been altered through time, either by geologic or by anthropogenic processes, or are not suitable for paleoflood analysis.
Table 1 summarizes the appropriate use of paleoflood information in USACE H&H decision making, based on the information developed for this report.
Table 1. Summary of relative appropriateness of paleofloods for application leading to USACE H&H decisions.
Paleoflood information
Geologic assumptions
Hydrologic assumptions
Appropriateness for input of exceedance frequency for H&H
decisions*
Approximate costs†
($K) Notes
Stage Channel stability
A 15–50 Information not appropriate for assessments of dams and reservoirs with volume considerations
Discharge Channel stability upstream and downstream
One-dimensional hydraulic modeling
C 100 Information not appropriate for assessments of dams and reservoirs with volume considerations
Stage–discharge relationship
C 35–50
Two-dimensional hydraulic modeling
B 250
Volume Channel stability upstream and downstream
Hydrograph shape
D 35–50
Precipitation, type, intensity, duration, location
A 250–400
* A = Application Justifiable, with H&H Policy Considerations B = Application Justifiable, with Significant H&H Policy, Budget, and Time Considerations C = Application Justifiable, with Severe H&H Policy Budget, and Time Considerations D = Application Unjustifiable, given H&H Design Criteria and Policies
† Cost estimates based on the author’s experience funding paleoflood studies within applications for Dam Safety Risk Analysis.
CWTS 2013-2 41
References ACWI. 2012. Limits of curve extrapolation. Bulletin 17-B, Guidelines for Determining
Flood Frequency, Frequently Asked Questions. Advisory Committee for Water Information, U.S. Department of the Interior. http://acwi.gov/hydrology/Frequency/B17bFAQ.html#limits.
Baker, V.R. 1987. Paleoflood hydrology and extreme flood events. Journal of Hydrology 96: 79–99.
Baker, V.R. 2008. Paleoflood hydrology: Origin, progress, prospects. Geomorphology 101: 1–13.
Barnes, H.H., Jr. 1967. Roughness Characteristics of Natural Channels. Water Supply Paper 1849, U.S. Geological Survey.
Bauer, T., and R.E. Klinger. 2010. Utilizing a two-dimensional hydraulic model for making discharge estimates of prehistorical paleofloods on the south fork Boise River, South-Central Idaho. Second Joint Federal Interagency Conference, Las Vegas, NV, June 27–July 1, 2010.
Benson, M.A., and T. Dalrymple. 1967. General field and office procedures for indirect discharge measurements. In Techniques in Water Resources Investigations, Book 3, Chapter A1, U.S. Geological Survey.
Bullard, K.L., M.G. Schaeffer, B.A. Barker, D. Sutley, and V. Leverson. 2007. The stochastic event flood model applied to Minidoka Dam on the Snake River, Idaho. World Environmental and Water Resources Congress 2007: Restoring Our Natural Habitat.
Carrivick, J.L. 2006. Application of 2D hydrodynamic modeling to high-magnitude outburst floods: An example from Kverkfjoll, Iceland. Journal of Hydrology 321. doi:10.1016/j.jhydrol.2005.07.042.
Chow, V.T. 1959. Open-Channel Hydraulics. New York, NY: McGraw-Hill Book Co.
Chow, V.T., D.R. Maidment, and L.W. Mays. 1988. Applied Hydrology. New York, NY: McGraw-Hill Book Co.
Cohn, T.A., W.L. Lane, and W.G. Baier. 1997. An algorithm for computing moments-based flood quantile estimates when historical flood information is available. Water Resources Research 33(9): 2089–2096.
Costa, J.E. 1987. A history of paleoflood hydrology in the United States, 1800-1970. History of Geophysics 3: 49–53.
England, J.F., Jr. 2006. Frequency Analysis and Two-Dimensional Simulations of Extreme Floods on a Large Watershed. Dissertation submitted to Colorado State University, Department of Civil Engineering.

CWTS 2013-2 42
England, J.F., Jr., R.D. Jarrett, and J.D. Salas. 2003. Data-based comparisons of moments estimators using historical and paleoflood data. Journal of Hydrology 278: 172–196.
England, J.F., Jr., J.E. Godaire, R.E. Klinger, T.R. Bauer, and P.Y. Julien. 2010. Paleohydrologic bounds and extreme flood frequency of the Upper Arkansas River, Colorado, USA. Geomorphology 124. doi:10.1016/j.geomorph.2010.07.021.
Franchini, M., K.R. Helmlinger, E. Foufoula-Georgiou, and E. Todini. 1996. Stochastic storm transposition coupled with rainfall-runoff modeling for estimation of exceedance probabilities of design floods. Journal of Hydrology 175: 511–532.
Harden, T., J.E. O’Connor, D.G. Driscoll, and J.F. Stamm. 2011. Flood-Frequency Analyses from Paleoflood Investigations for Spring, Rapid, Boxelder, and Elk Creeks, Black Hills, Western South Dakota. Scientific Investigations Report 2011-5131, U.S. Geologic Survey. Prepared in Cooperation with South Dakota Department of Transportation, Federal Emergency Management Agency, City of Rapid City, and West Dakota Water Development District.
HEC. 2003. Application of Paleohydrology to Corps Flood Frequency Analysis. Hydrologic Engineering Center, USACE. http://www.hec.usace.army.mil/publications/ResearchDocuments/RD-47.pdf
Hicks, D.M., and P.D. Mason 1991. Roughness Characteristics of New Zealand Rivers. Wellington, New Zealand: Water Resource Survey.
Hosking, J., and J. Wallis 1986. The value of historical data in flood frequency analysis. Water Resources Research 22(11): 1606–1612.
House, P.K., R.H. Webb, V.R. Baker, and D.R. Levish (Ed.). 2002a. Ancient Floods, Modern Hazards: Principles and Applications of Paleoflood Hydrology. Water Sciences and Application, vol. 5. Washington, DC: American Geophysical Union.
House, P.K., P.A. Pearthree, and J.E. Klawon. 2002b. Historical flood and paleoflood chronology of the lower Verde River, Arizona: Stratigraphic complexity and related uncertainties. In Ancient Floods, Modern Hazards: Principles and Applications of Paleoflood Hydrology (P.K. House, R.H. Webb, V.R. Baker, and D.R. Levish, Ed.). Water Sciences and Application, vol. 5, p. 267–294. Washington, DC: American Geophysical Union.
ISO. 1983. Liquid Flow Measurement in Open Channels. Handbook 16, International Standards Organization.
Jarrett, R.D. 1991. Paleohydrology and its value in analyzing floods and droughts. In Water-Supply Paper 2375, p. 105-116, U.S. Geological Survey (R.W. Paulson, E.B. Chase, R.S. Roberts, and D.W. Moody, compilers).
Jarrett, R.D., and J.F. England, Jr. 2002. Reliability of paleostage indicators for paleoflood studies. In Ancient Floods, Modern Hazards: Principles and Applications of Paleoflood Hydrology (P.K. House, R.H. Webb, V.R. Baker, and D.R. Levish, Ed.). Water Sciences and Application, vol. 5, p. 91–109. Washington, DC: American Geophysical Union.

CWTS 2013-2 43
Julien, P.Y. 1995. Erosion and Sedimentation. Cambridge University Press. QE571.j85 ISBN 0-521-44237-0.
Kite, J.S., T.W. Gebhardt, and G.S. Springer. 2002. Deposits as paleostage indicators in canyon reaches of the Appalachians: Reevaluation after the 1996 Cheat River flood. In Ancient Floods, Modern Hazards: Principles and Applications of Paleoflood Hydrology (P.K. House, R.H. Webb, V.R. Baker, and D.R. Levish, Ed.). Water Sciences and Application, vol. 5, p. 257–266. Washington, DC: American Geophysical Union.
Kochel, R.C., and V.R. Baker. 1982. Paleoflood hydrology. Science 215: 353–361.
Kochel, R.D., and V.R. Baker. 1988. Paleoflood analysis using slackwater deposits. In Flood Geomorphology (V.R. Baker, R.C. Kochel, and P.C. Patton, Ed.), p. 357–376. New York: Wiley.
Kuczera, G. 1992. Uncorrelated measurement error in flood frequency inference. Water Resources Research 28(1): 183–188.
Levish, D.R. 2002. Paleohydrologic bounds: Non-exceedance information for flood hazard assessment. In Ancient Floods, Modern Hazards: Principles and Applications of Paleoflood Hydrology (P.K. House, R.H. Webb, V.R. Baker, and D.R. Levish, Ed.). Water Sciences and Application, vol. 5, p. 175–190. Washington, DC: American Geophysical Union.
Maidment, D.R. 1992. Handbook of Hydrology. New York: McGraw-Hill.
Mansfield, G.R. 1938. Flood deposits of the Ohio River, January–February, 1937, A study of sedimentation. In Floods of Ohio and Mississippi Rivers, January-February, 1937 (N.C. Grover, Ed.). Water Supply Paper 838, U.S. Geological Survey, p. 693–736.
McCuen, R.H., and K.E. Galloway. 2010. Record length requirements for annual maximum flood series. Journal of Hydrologic Engineering 15(9). DOI: 10.1061/(ASCE)HE.1943-5584.0000223.
Milly, P.C.D., J. Betancourt, M. Falkenmark, R.M. Hirsch, Z.W. Kundzewicz, D.P. Lettenmaier, and R.J. Stouffer. 2008. Stationarity is dead: Whither water management? Science 319 (5836): 573–574. DOI: 10.1126/science.1151915.
National Research Council, Committee on Techniques for Estimating Probabilities of Extreme Floods. 1988. Estimating Probabilities of Extreme Floods, Methods and Recommended Research. Washington, DC: National Research Council.
O’Connell, D.R.H. 2005. Nonparametric Bayesian flood frequency estimation. Journal of Hydrology 313(102): 79–96.
O’Connell, D.R.H., D.A. Ostenaa, D.R. Levish, and R.E. Klinger. 2002. Bayesian flood frequency analysis with paleohydrologic bound data. Water Resources Research 38 (1058). DOI:10.1029/2000WR000028.
O’Connor, J.E., and R.H. Webb. 1988. Hydraulic modeling for paleoflood analysis. In Flood Geomorphology (V.R. Baker, R.C. Kochel, and P.C. Patton, Ed.). p. 393–402. New York: John Wiley and Sons.

CWTS 2013-2 44
Patton, P.C., V.R. Baker, and R.C. Kochel. 1979. Slack water deposits: A geomorphic technique for the interpretation of fluvial paleohydrology. In Adjustments of the Fluvial System (D.D. Rhodes, and G.P. Williams, Ed.). p. 225–253. Dubuque, IA: Kendall/Hunt Publishing Company.
Reclamation. 2003. Flood Hazard Analysis: Seminoe and Glendo Dams Kendrick Project and Pick Sloan Missouri Basin Program, Wyoming. Denver, CO: U.S. Department of the Interior, Bureau of Reclamation, Technical Service Center.
Sherman, L.K. 1932. Streamflow from rainfall by the unit graph method. Engineering News Record 108: 501–505
Sridhar, A. 2012. Geomorphic controls on the slackwater deposition: Example from the Mahi River Basin, western India. Vignettes – Key Concepts in Geomorphology. http://serc.carleton.edu/32001.
Stedinger, J.R., and T.A. Cohn. 1986. Flood frequency analysis with historical and paleoflood information. Water Resources Research 22(5): 785–793. doi:10.1029/WR022i005p00785
Stokes, S., and D. Walling. 2002. Chemical and physical methods for the direct dating and tracing of fluvial sediments. In New Quantitative Techniques for Fluvial Geomorphology (H. Pigey and E. Taylor, Ed.). p. 1–44. New York: John Wiley and Sons.
Swain, R.E., D. Bowles, and D. Ostenaa. 1998 A framework for characterization of extreme floods for dam safety risk assessments. Proceedings of the 1998 USCOLD Annual Lecture, Buffalo, New York.
USACE. 1965. Standard Project Flood Determination. EM 1110-2-1411, U.S. Army Corps of Engineers.
USACE. 1984. Hydrologic Analysis of Interior Areas. EM 1110-2-1413, U.S. Army Corps of Engineers.
USACE. 1991. Engineering and Design – Inflow Design Floods for Dams and Reservoirs. ER 1110-8-2(FR). U.S. Army Corps of Engineers.
USACE. 1993a. Hydrologic Frequency Analysis. EM 1110-2-1415, U.S. Army Corps of Engineers.
USACE. 1993b. River Hydraulics. EM 1110-2-1416, U.S. Army Corps of Engineers.
USACE. 1994. Flood-Runoff Analysis. EM 1110-2-1417, U.S. Army Corps of Engineers.
USACE. 1995a. Earthquake Design and Evaluation for Civil Works Projects. ER 1110-2-1806, Engineering and Design, U.S. Army Corps of Engineers.
USACE. 1995b. Hydrologic Engineering Requirements for Flood Damage Reduction Studies. EM 1110-2-1419, U.S. Army Corps of Engineers.
USACE. 1996. Risk-Based Analysis for Flood Damage Reduction Studies. EM 1110-2-1619, U.S. Army Corps of Engineers.

CWTS 2013-2 45
USACE. 2006. Risk Analysis for Flood Damage Reduction Studies. ER 1105-2-101, U.S. Army Corps of Engineers.
USACE. 2011. Safety of Dams – Policy and Procedures. ER 1110-2-1156, Engineering and Design, U.S. Army Corps of Engineers.
USACE. 2011. Sustainable Solutions to America’s Water Resources Needs. U.S. Army Corps of Engineers Civil Works Strategic Plan 2011-2015. http://www.usace.army.mil/Portals/2/docs/civilworks/news/2011-15_cw%20stratplan.pdf.
USACE. 2012. USACE Levee Safety Program. http://www.usace.army.mil/Portals/2/docs/civilworks/levee/fs_safety.pdf.
Wang, L., and D.S. Leigh. 2012. Late-Holocene paleofloods in the upper Little Tennessee River valley, Southern Blue Ridge Mountains, USA. The Holocene 22 (9). doi:10.1177/0959683612437863.
Webb, R.H., and R.D. Jarrett. 2002. One-dimensional estimation techniques for discharges of paleofloods and historical floods. In Ancient Floods, Modern Hazards: Principles and Applications of Paleoflood Hydrology (P.K. House, R.H. Webb, V.R. Baker, and D.R. Levish, Ed.). Water Sciences and Application, vol. 5, p. 111–125. Washington, DC: American Geophysical Union.
Wohl, E.E. 1998. Uncertainty in flood estimates associated with roughness coefficient. Journal of Hydraulic Engineering 124 (2): 219–223. doi: 10.1061/(ASCE)0733 – 9429.