Paleoflood History of the Lower Verde River, Yavapai...
36
Paleoflood History of the Lower Verde River, Yavapai County Central Arizona By P. Kyle House 1 , Philip A. Pearthree 2 , and Jeanne E. Klawon 3 Arizona Geological Survey Open-File Report 01-04 January, 2001 1 Nevada Bureau of Mines and Geology 2 Arizona Geological Survey 3 U.S. Bureau of Reclamation Arizona Geological Survey 416 W. Congress St., Tucson, AZ 85701 Includes 34 pages of text. Research supported by the National Science Foundation, the U.S. Geological Survey, the Salt River Project, the Arizona Geological Survey, the Nevada Bureau of Mines and Geology, the Desert Research Institute, and the U.S. Bureau of Reclamation
Transcript of Paleoflood History of the Lower Verde River, Yavapai...
Paleoflood History of theLower Verde River, Yavapai County
Central Arizona
By P. Kyle House1, Philip A. Pearthree2,and Jeanne E. Klawon3
Arizona Geological SurveyOpen-File Report 01-04
January, 2001
1Nevada Bureau of Mines and Geology2Arizona Geological Survey
3U.S. Bureau of Reclamation
Arizona Geological Survey416 W. Congress St., Tucson, AZ 85701
Includes 34 pages of text.
Research supported by the National Science Foundation, the U.S.Geological Survey, the Salt River Project, the Arizona Geological
Survey, the Nevada Bureau of Mines and Geology, the Desert ResearchInstitute, and the U.S. Bureau of Reclamation

1
ABSTRACT
A comprehensive analysis of slack-water flood deposits on the lower Verde River, Arizona,reconstructs the history of the largest floods on the river over the last 1600 years. The recordprovides unique information about the magnitude and frequency of extreme floods in the lateHolocene and places its short historical record into its appropriate long-term context. Theinvestigation was performed in a tributary mouth that is deeply backflooded during Verde Riverfloods and it provides important insights into a variety of uncertainties that combine to precludeconfident compilation of complete records of paleofloods in typical bedrock canyon slack-watersettings. There are numerous processes that act over time to compromise the integrity ofpaleoflood stratigraphy. Most importantly, vertical accretion that has occurred in most slack-water sequences ensures that the stratigraphic record is progressively self-censoring and biasedtowards larger and younger floods. Uncertainty in event and temporal resolution of paleofloodslack-water stratigraphy should be explicitly addressed in fluvial paleoflood studies, andsubsequent interpretations of paleoflood data in the context of flood-frequency analysis andpaleoenvironmental need to account for them.
INTRODUCTION
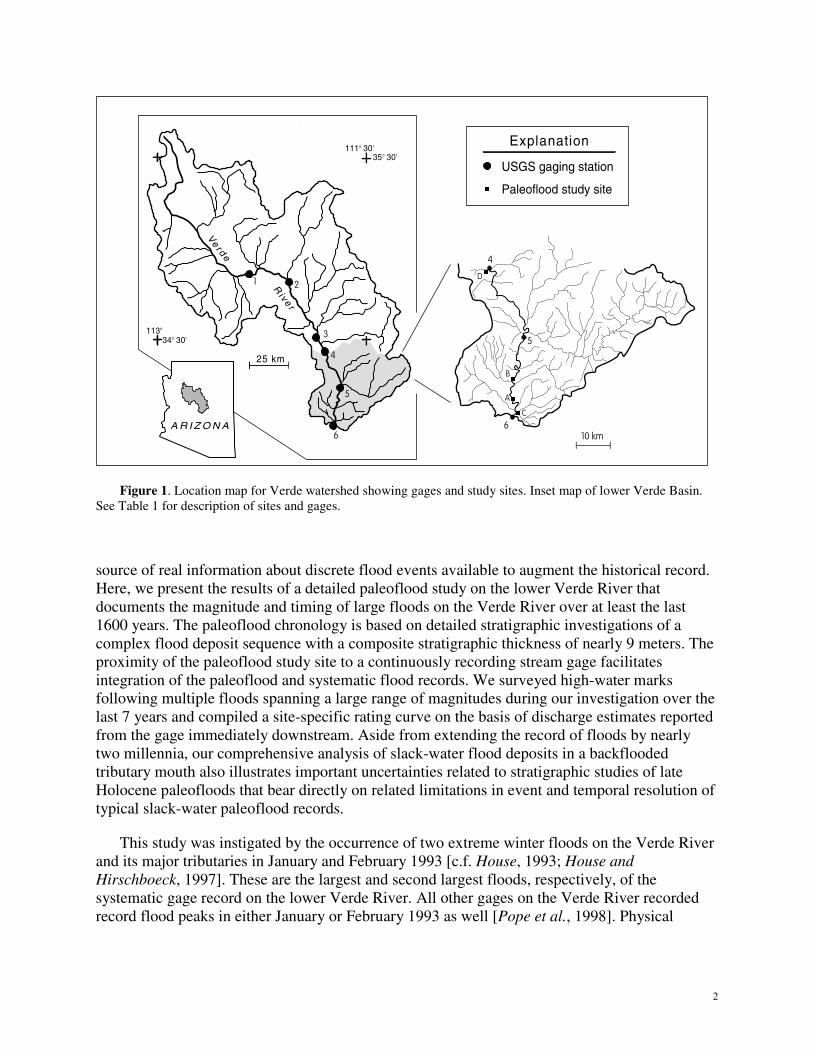
The Verde River integrates runoff slightly more than 14,000 km2 of strikingly contrastingphysiography in central Arizona (Figure 1). The river’s flood regime is characterized by extremeevents up to three orders of magnitude greater than its average flow conditions. Spatial andtemporal variations in the flood frequency in this region are strongly influenced by regional toglobal-scale climatic variability [Hirschboeck, 1985; Webb and Betancourt, 1992; Ely et al.,1995; House and Hirschboeck, 1997]. Precipitation, runoff, and flood generation in the Verdewatershed also vary significantly over space and time in and between individual events [e.g.Chin et al., 1991; House and Hirschboeck, 1997]. The complex genesis of floods, theirvariability in occurrence over time, and a relatively short gage record confound attempts toadequately evaluate flood magnitude and frequency over time scales greater than about 50 to 100years using the historical record alone. This presents a unique set of challenges to water resourcemanagers and flood control practices in the region. Fluvial paleoflood data constitute the only
2
10 km
Verde
Rive r
Explanation
C
D
A
B
34o 30'
111o 30'
113o
35o 30'
25 km
1 2
3
6
4
4
5
6
5
A R I Z O N A
USGS gaging station
Paleoflood study site
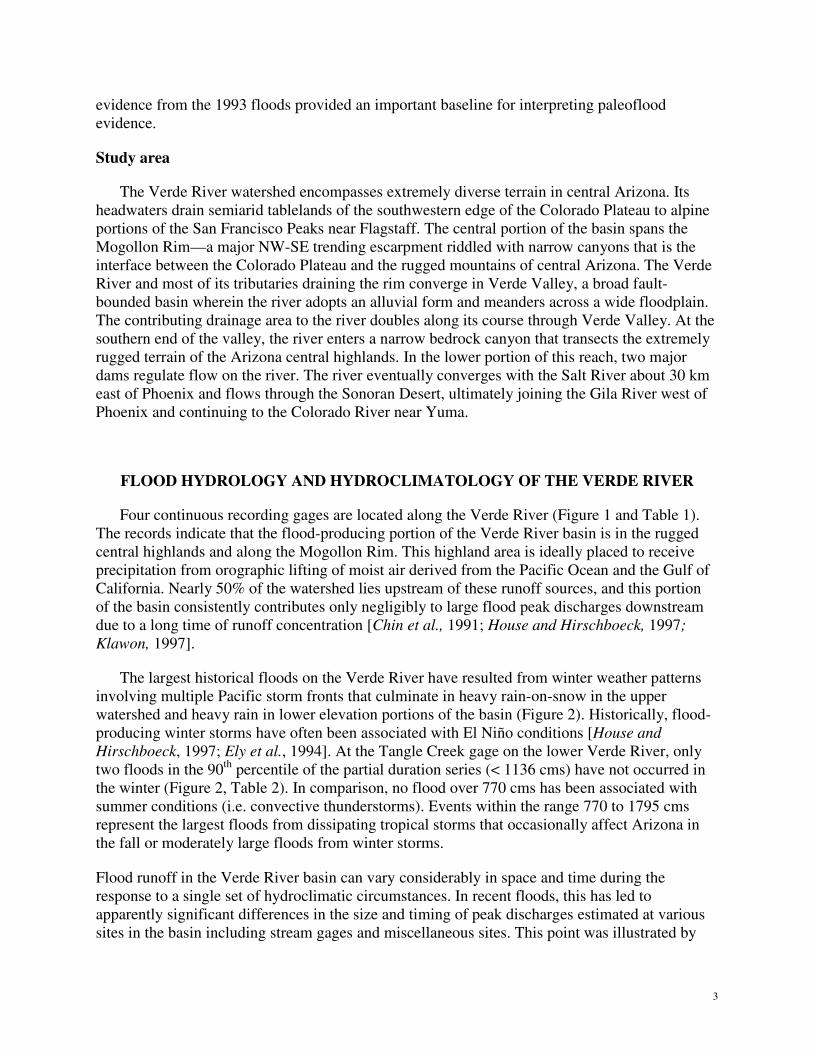
Figure 1. Location map for Verde watershed showing gages and study sites. Inset map of lower Verde Basin.See Table 1 for description of sites and gages.
source of real information about discrete flood events available to augment the historical record.Here, we present the results of a detailed paleoflood study on the lower Verde River thatdocuments the magnitude and timing of large floods on the Verde River over at least the last1600 years. The paleoflood chronology is based on detailed stratigraphic investigations of acomplex flood deposit sequence with a composite stratigraphic thickness of nearly 9 meters. Theproximity of the paleoflood study site to a continuously recording stream gage facilitatesintegration of the paleoflood and systematic flood records. We surveyed high-water marksfollowing multiple floods spanning a large range of magnitudes during our investigation over thelast 7 years and compiled a site-specific rating curve on the basis of discharge estimates reportedfrom the gage immediately downstream. Aside from extending the record of floods by nearlytwo millennia, our comprehensive analysis of slack-water flood deposits in a backfloodedtributary mouth also illustrates important uncertainties related to stratigraphic studies of lateHolocene paleofloods that bear directly on related limitations in event and temporal resolution oftypical slack-water paleoflood records.
This study was instigated by the occurrence of two extreme winter floods on the Verde Riverand its major tributaries in January and February 1993 [c.f. House, 1993; House andHirschboeck, 1997]. These are the largest and second largest floods, respectively, of thesystematic gage record on the lower Verde River. All other gages on the Verde River recordedrecord flood peaks in either January or February 1993 as well [Pope et al., 1998]. Physical
3
evidence from the 1993 floods provided an important baseline for interpreting paleofloodevidence.
Study area
The Verde River watershed encompasses extremely diverse terrain in central Arizona. Itsheadwaters drain semiarid tablelands of the southwestern edge of the Colorado Plateau to alpineportions of the San Francisco Peaks near Flagstaff. The central portion of the basin spans theMogollon Rim—a major NW-SE trending escarpment riddled with narrow canyons that is theinterface between the Colorado Plateau and the rugged mountains of central Arizona. The VerdeRiver and most of its tributaries draining the rim converge in Verde Valley, a broad fault-bounded basin wherein the river adopts an alluvial form and meanders across a wide floodplain.The contributing drainage area to the river doubles along its course through Verde Valley. At thesouthern end of the valley, the river enters a narrow bedrock canyon that transects the extremelyrugged terrain of the Arizona central highlands. In the lower portion of this reach, two majordams regulate flow on the river. The river eventually converges with the Salt River about 30 kmeast of Phoenix and flows through the Sonoran Desert, ultimately joining the Gila River west ofPhoenix and continuing to the Colorado River near Yuma.
FLOOD HYDROLOGY AND HYDROCLIMATOLOGY OF THE VERDE RIVER
Four continuous recording gages are located along the Verde River (Figure 1 and Table 1).The records indicate that the flood-producing portion of the Verde River basin is in the ruggedcentral highlands and along the Mogollon Rim. This highland area is ideally placed to receiveprecipitation from orographic lifting of moist air derived from the Pacific Ocean and the Gulf ofCalifornia. Nearly 50% of the watershed lies upstream of these runoff sources, and this portionof the basin consistently contributes only negligibly to large flood peak discharges downstreamdue to a long time of runoff concentration [Chin et al., 1991; House and Hirschboeck, 1997;Klawon, 1997].
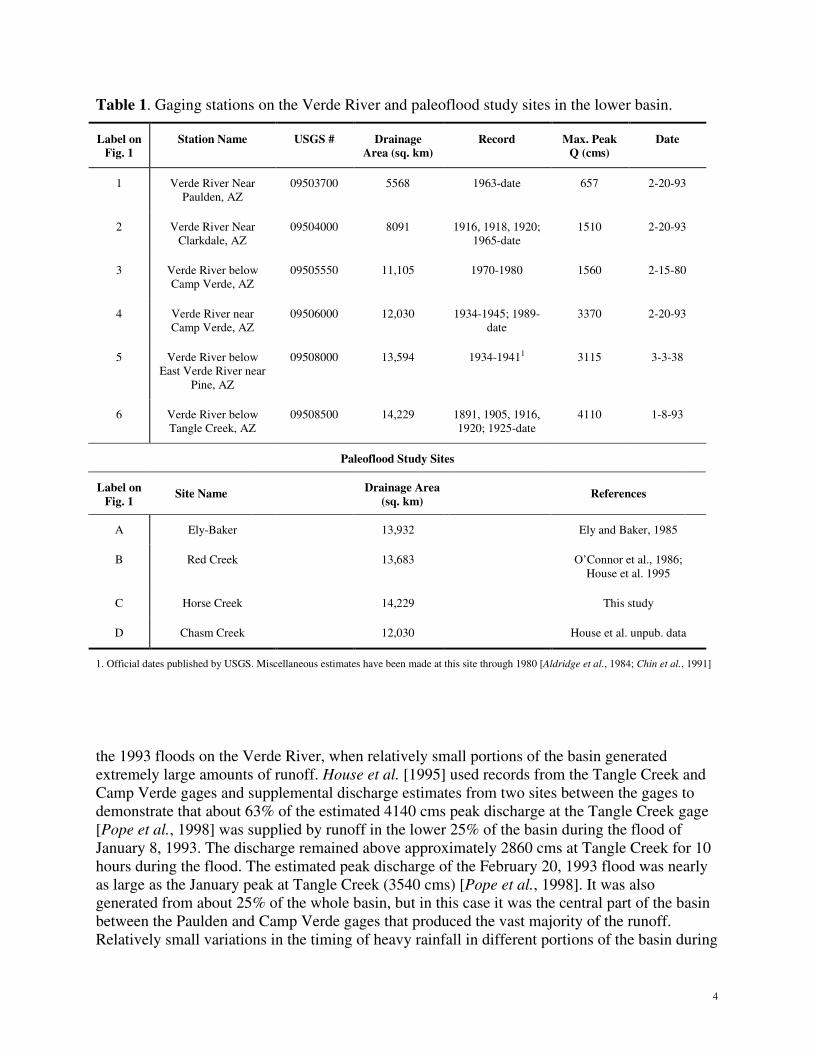
The largest historical floods on the Verde River have resulted from winter weather patternsinvolving multiple Pacific storm fronts that culminate in heavy rain-on-snow in the upperwatershed and heavy rain in lower elevation portions of the basin (Figure 2). Historically, flood-producing winter storms have often been associated with El Niño conditions [House andHirschboeck, 1997; Ely et al., 1994]. At the Tangle Creek gage on the lower Verde River, onlytwo floods in the 90th percentile of the partial duration series (< 1136 cms) have not occurred inthe winter (Figure 2, Table 2). In comparison, no flood over 770 cms has been associated withsummer conditions (i.e. convective thunderstorms). Events within the range 770 to 1795 cmsrepresent the largest floods from dissipating tropical storms that occasionally affect Arizona inthe fall or moderately large floods from winter storms.
Flood runoff in the Verde River basin can vary considerably in space and time during theresponse to a single set of hydroclimatic circumstances. In recent floods, this has led toapparently significant differences in the size and timing of peak discharges estimated at varioussites in the basin including stream gages and miscellaneous sites. This point was illustrated by
4
Table 1. Gaging stations on the Verde River and paleoflood study sites in the lower basin.
Label onFig. 1
Station Name USGS # DrainageArea (sq. km)
Record Max. PeakQ (cms)
Date
1 Verde River NearPaulden, AZ
09503700 5568 1963-date 657 2-20-93
2 Verde River NearClarkdale, AZ
09504000 8091 1916, 1918, 1920;1965-date
1510 2-20-93
3 Verde River belowCamp Verde, AZ
09505550 11,105 1970-1980 1560 2-15-80
4 Verde River nearCamp Verde, AZ
09506000 12,030 1934-1945; 1989-date
3370 2-20-93
5 Verde River belowEast Verde River near
Pine, AZ
09508000 13,594 1934-19411 3115 3-3-38
6 Verde River belowTangle Creek, AZ
09508500 14,229 1891, 1905, 1916,1920; 1925-date
4110 1-8-93
Paleoflood Study Sites
Label onFig. 1
Site Name Drainage Area(sq. km)
References
A Ely-Baker 13,932 Ely and Baker, 1985
B Red Creek 13,683 O’Connor et al., 1986;House et al. 1995
C Horse Creek 14,229 This study
D Chasm Creek 12,030 House et al. unpub. data
1. Official dates published by USGS. Miscellaneous estimates have been made at this site through 1980 [Aldridge et al., 1984; Chin et al., 1991]
the 1993 floods on the Verde River, when relatively small portions of the basin generatedextremely large amounts of runoff. House et al. [1995] used records from the Tangle Creek andCamp Verde gages and supplemental discharge estimates from two sites between the gages todemonstrate that about 63% of the estimated 4140 cms peak discharge at the Tangle Creek gage[Pope et al., 1998] was supplied by runoff in the lower 25% of the basin during the flood ofJanuary 8, 1993. The discharge remained above approximately 2860 cms at Tangle Creek for 10hours during the flood. The estimated peak discharge of the February 20, 1993 flood was nearlyas large as the January peak at Tangle Creek (3540 cms) [Pope et al., 1998]. It was alsogenerated from about 25% of the whole basin, but in this case it was the central part of the basinbetween the Paulden and Camp Verde gages that produced the vast majority of the runoff.Relatively small variations in the timing of heavy rainfall in different portions of the basin during
5
18
90
19
00
19
10
19
20
19
30
19
40
19
50
19
60
19
70
19
80
19
90
20
00
0
1000
2000
3000
4000
5000
Water Year
Peak
DIs
charg
e,cm
sWinter floodFall floodSummer flood
Figure 2. Annual flood series of the lower Verde River shown in relation to season of floodoccurrence.
the 1993 storms could have led to a larger peak discharge on the lower Verde River, especiallyduring the early January event [House et al. 1995, House and Hirschboeck, 1997].
Historical Flood Record
Archival and anecdotal accounts document large floods in central Arizona back to 1833[Dobyns, 1981]. The earliest accounts from natives and anglo settlers refer to floods on themiddle and lower Gila River. Here, we invoke them only as proxies for possible similar floodingon the Verde River. In the systematic record between 1930 and 1999, only 33% of the annualfloods on the Verde and the middle Gila occurred within 0 to 3 days of each other. In contrast, byusing the partial duration series censored below the 10% annual exceedance probability level[Pope et al., 1998] the correspondence is 44%. Only 3 of 4 floods near or above the 2% annualexceedance probability level on the Gila [Pope et al., 1998] did not have corresponding floodson the Verde. Thus, the comparison is of nominal reliability. Furthermore, the reliability of theanecdotal and archival accounts with respect to flood magnitude is uncertain. Desert floods arestill often perceived as exceptional circumstances, so it is possible that historical floods ofmoderate or even relatively low magnitude were remarked upon. Presumably, the largest floodsreceived greater attention.
Accounts of the Pima Tribe and Anglo settlers indicate that large floods on the lower Gila River(i.e. below its confluence with the Salt River) in 1833, 1862, 1867, 1868, 1874, and 1891[Dobyns, 1981]. The 1833 flood was apparently an extraordinary event based on its lateral extentreported by members of the Pima tribe [Huckleberry, 1995]. The calendar date of the flood is not
6
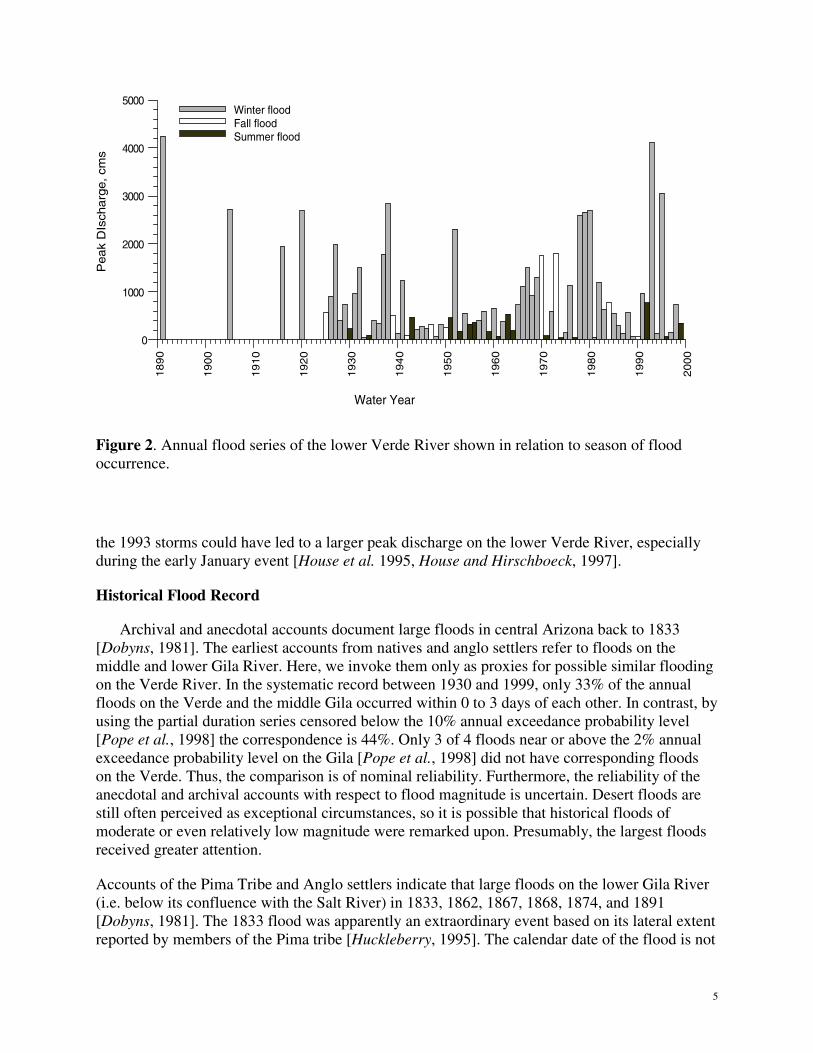
Table 2. Largest flood estimates1 reported from the Verde Rivergage below Tangle Creek (#9508500) [Pope et al, 1998].
Peak DischargeDate
cms cfs
24-Feb-1891 4248 150000
08-Jan-93 4106 145000
20-Feb-93 3511 124000
15-Feb-95 3058 108000
04-Mar-38 2832 100000
27-Nov-05 2718 96000
22-Feb-20 2690 95000
15-Feb-80 2684 94800
19-Dec-78 2662 94000
01-Mar-78 2588 91400
06-Mar-95 2543 89800
31-Dec-51 2311 81600
17-Feb-27 1982 70000
20-Jan-16 1951 68900
20-Feb-80 1863 65800
20-Oct-72 1795 63400
07-Feb-37 1784 63000
06-Sep-70 1753 61900
17-Jan-93 1509 53300
09-Feb-32 1501 53000
07-Dec-66 1501 53000
26-Jan-69 1297 45800
14-Mar-41 1240 43800
12-Mar-82 1192 42100
1. Values in the 90th percentile of the partialduration series
7
precisely known, only that it occurred after November 13, 1833 (and, presumably, beforeJanuary, 1834). Significant flooding occurred across much of the western United States in thewinter of 1862 [e.g. Engstrom, 1996], and the lower Gila evidently had a major winter flood thatyear. However, the Pima Indians living on the middle Gila River did not record it [Dobyns,1981]. This implies that the flood could have been derived primarily from the Salt and Verderivers (downstream from the middle Gila). In September 1868, catastrophic flooding comparableto the scale of the 1833 flood occurred on the middle and lower Gila River [Dobyns, 1981]. The1868 flood was regional in scale and presumably related to a dissipating tropical cyclone on thebasis of its seasonality. Historically, this type of storm has resulted in more significant floodingon the middle Gila River than the Verde.
A particularly significant episode of flooding affected most large rivers in Arizona inFebruary 1891. Flooding on the Salt River below its confluence with the Verde in the winter1891 was catastrophic and extensively documented because of its impact in the Phoenix area.This is the earliest historical flood in the Verde River record and its discharge “probablyexceeded” 4248 cms [Patterson and Somers, 1966; Pope et al., 1998]. This flood also causeddramatic channel changes in the Camp Verde area of Verde Valley [Pearthree, 1996]. Dischargeestimates for this event on the Salt River in Tempe, Arizona, (below the confluence of the Saltand Verde rivers) range from 7362 to 8495 cms [Fuller, 1987]—a discharge range similar towhat would have transpired in the Phoenix area in January 1993 if not for the influence ofmultiple reservoirs on the rivers upstream.
Systematic Flood Record
Systematic documentation of large floods on the Verde River began with the extraordinaryflood of February 1891 (Figure 2). Between 1891 and 1925, the largest floods on the lower riverwere measured indirectly at various sites above the confluence with the Salt River. In 1925, theofficial gaging program was initiated on the lower Verde River. Large winter floods weredocumented on the lower Verde River in 1905, 1920, and 1938 (estimated discharges of 2718,2690, and 2832 cms, respectively) [Pope et al., 1998]. After 1938, there was a prolonged periodof generally low to moderate magnitude flows through 1977. This changed dramatically in 1978,when large floods occurred in March 1978 (2588 cms), December 1978 (2662 cms); andFebruary 1980 (2684). A 13-year period of low to moderate flows was followed by the extremefloods of January and February 1993 (estimates of 4106 and 3540 cms, respectively).Interestingly, this episode was followed by two large floods in February and March 1995(estimates of 3058 and 2543 cms, respectively). Prior to the floods in 1993, the USGS estimatefor the 1% annual probability flood on the lower Verde River was 4690 cms [Garrett andGellenbeck, 1991]. Following the floods in 1993 and 1995, the estimate increased to 5720 cms[Pope et al., 1998]. Our study of the river’s flood history found no evidence substantiating theoccurrence of a flood this large in at least the last 800 years and possibly as long as the last 1600years.
Dendrohydrologic Record
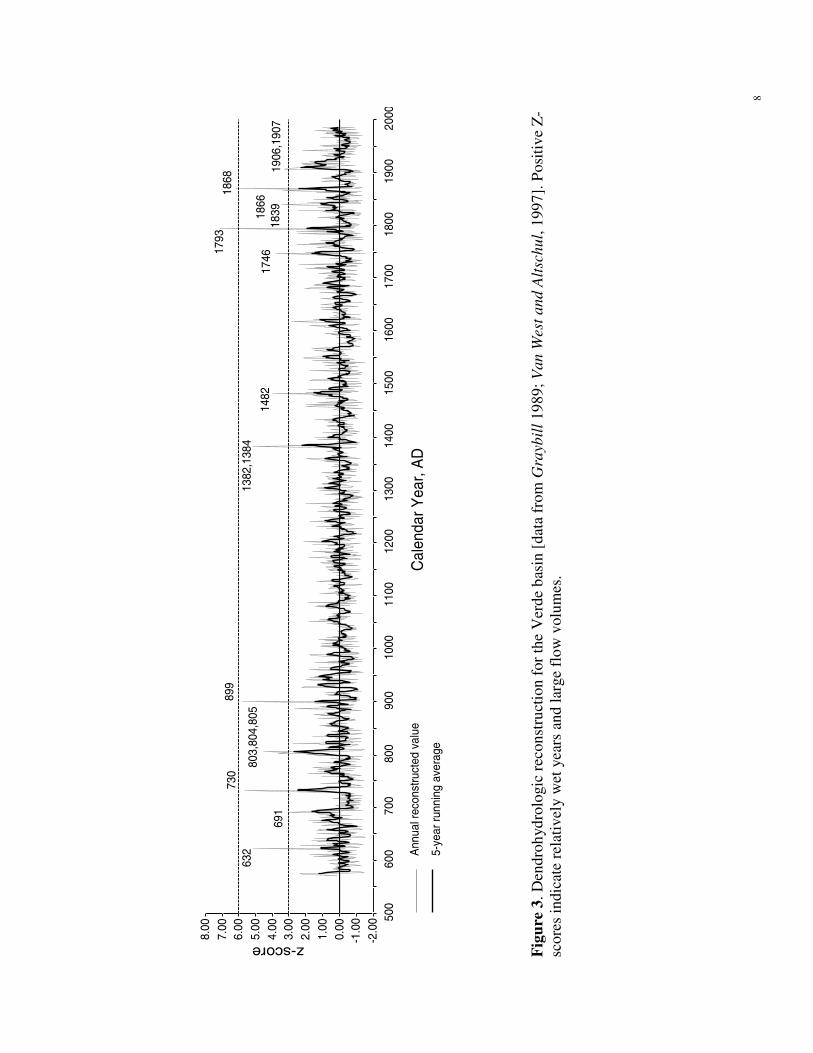
An annual dendrohydrologic (tree-ring-based) reconstruction of annual flow for the VerdeRiver is available that spans the period 1984 AD to 570 AD [Graybill, 1989; Van West andAltschul, 1997] (Figure 3). These data provide a relatively accurate record of annual flow
8
Ann
ualr
econ
stru
cted
valu
e
5-ye
arru
nnin
gav
erag
e
500
600
700
800
900
1000
1100
1200
1300
1400
1500
1600
1700
1800
1900
200 0
Cal
enda
rYea
r,A
D
-2.0
0-1
.00
0.00
1.00
2.00
3.00
4.00
5.00
6.00
7.00
8.00
z-score
1866
1868
1482
1382
,138
4
899
691
632
1906
,190
7
1793
1839
1746
803,
804,
805
730
Fig
ure
3.D
endr
ohyd
rolo
gic
reco
nstr
uctio
nfo
rth
eV
erde
basi
n[d
ata
from
Gra
ybil
l198
9;V
anW
esta
ndA
ltsc
hul,
1997
].P
ositi
veZ
-sc
ores
indi
cate
rela
tive
lyw
etye
ars
and
larg
efl
owvo
lum
es.
9
volumes on the Verde River, but their relation to the occurrence of large peak discharges is notparticularly strong. Historically, most periods of particularly high flow volumes are associatedwith a higher probability of the occurrence of one or more large floods comprising a portion ofthat volume. Major peaks in the tree-ring record in 1839, 1866, 1868 correspond directly to onlyone year with a particularly notable flood (Fall, 1868). In fact, the reconstructed value for 1868AD is the second largest departure from the mean in a 1414-year record (the largest is 1793 AD).It is notable that large floods in 1862 and 1891 are not associated with large departures in thetree-ring data, and large floods in the 20th century are not well represented. Thus, the linkage isindirect and variable, but the data provide an important point of comparison and a valuablerecord of hydrologic variability.
Flood-scarred trees are direct linkages to large floods because they reflect flood damage thatcan often be dated to the year of occurrence. McCord [1990] used flood-scarred trees toreconstruct the flood history of two tributaries to the Verde River (Rattlesnake Canyon and OakCreek). Where records overlap, the flood-scar data are consistent with the historical record offloods. In Rattlesnake Canyon, floods recorded by tree-scars occurred in 1828, 1831, 1852, 1890,1905, 1919, and 1970 (note that the events in 1919 and 1890 correspond to floods that occurredbefore the growing season in calendar years 1891 and 1920). This is a small tributary, however,and the likelihood of it recording floods from isolated convective storms that did notsignificantly impact the Verde River is high. In Oak Creek, one of the larger Verde Rivertributaries, tree-scars record floods in 1885 and 1938, both of which were notable floods on OakCreek, and one of which (1938) was a notable flood on the Verde.
THE LOWER VERDE PALEOFLOOD RECORD
We documented physical evidence of the Verde River’s largest paleofloods, historical floods,and modern floods by analyzing slack-water flood deposits (SWDs) and fresh high-water marksin the mouth of Horse Creek, a small tributary that is extensively backflooded during high VerdeRiver flows. The study site is in a bedrock-controlled reach of the Verde 1 km upstream from astream gage (Verde River below Tangle Creek, USGS gage 09508500) and 14.5 km upstreamfrom Horseshoe Dam, the first of two major dams on the river. Immediately before and duringour project several large floods on the river and its tributaries occurred providing progressivelyimproved exposures of a voluminous sequence of deposits and a unique opportunity to record thedeposition and subsequent removal of the slack-water depositional record in a dynamic tributary-mouth site.
Methods
Methods and concepts of paleoflood reconstruction using slack-water deposits have beendescribed repeatedly in the literature [e.g. Patton et al., 1979; Baker, 1987; Kochel and Baker,1982, 1988; Ely and Baker, 1985]. Thus, only some of the general concepts are briefly reiteratedhere. Compared to other methods for paleohydrologic and paleohydraulic reconstruction, slack-water paleoflood analysis in bedrock canyons is the most accurate technique for determining themagnitude and frequency of individual paleofloods [O’Connor and Webb, 1988].
10
Slack-water flood deposits are fine-grained suspended-load sediments deposited in areas ofmarkedly reduced flow velocities during large floods [Kochel and Baker, 1982, 1988]. They areeasily linked to flood events by virtue of sedimentology and their position relative to the channeland flood stages estimated using hydraulic models. However, SWDs are deposited under anunknown (but typically shallow) depth of water and represent only minimum flood stages andcorresponding discharges. Peak paleoflood stages can be inferred from other types of paleostageindicators (PSIs), including relict high-water marks such as flotsam lines, flood-scouredhillslopes and flood-damaged vegetation. An overall limit on paleoflood stage over time can beestablished using landforms such as abandoned river terraces that show no evidence of havingbeen inundated for thousands of years [Klawon et al., 2000]. Slack-water flood depositstratigraphy provides a unique, natural record of extreme floods. Its analysis and interpretationrequires concerted application of various methods and concepts of stratigraphy, sedimentology,and pedology.
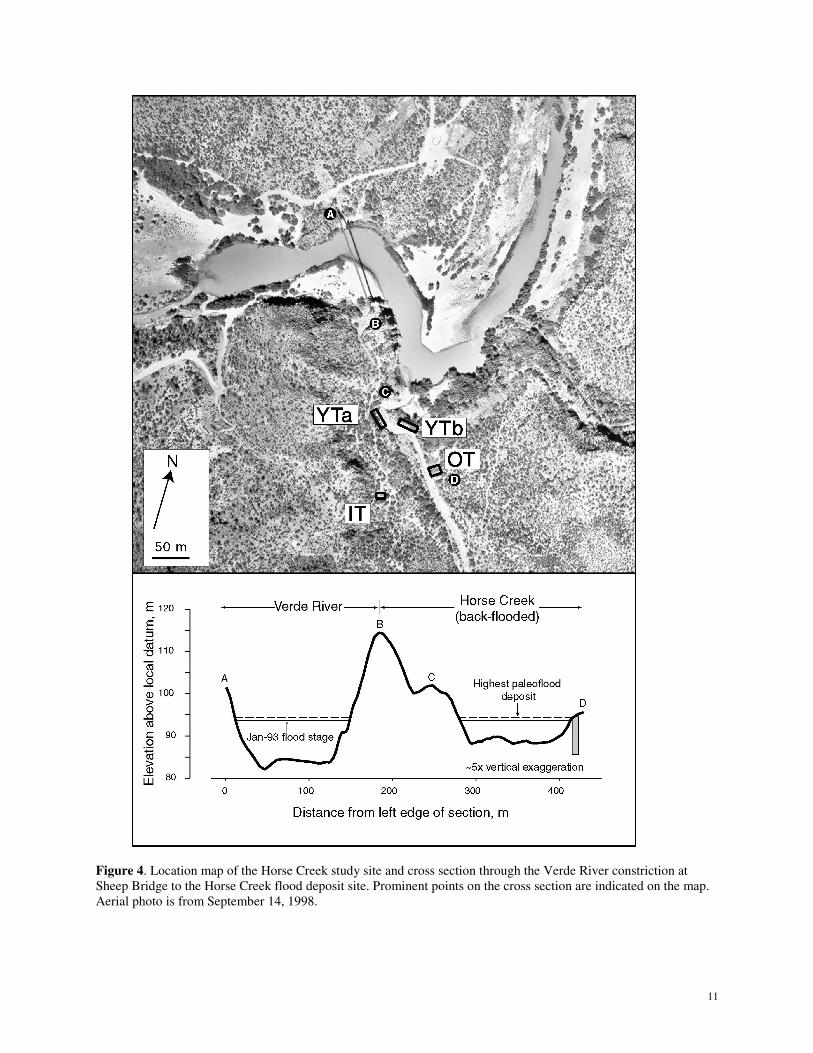
Slack-water deposits in the canyon of the lower Verde River are often preserved in extensive,high-standing terraces or “benches” along channel margins in wide, straight reaches, and thickslack-water terraces in tributary mouths [Ely and Baker, 1985; O’Connor et al., 1986; House etal., 1995]. We evaluated many of these types of sites at a reconnaissance level along much of thelower Verde River. We ultimately focused on a site at the confluence of the Verde River with asmall tributary, Horse Creek, where there is a particularly voluminous accumulation of SWDsjust upstream of a narrow bedrock constriction (Figure 4).
Geochronology. The collection and analysis of datable materials is required to place thestratigraphic record of floods in temporal context. Typical datable materials include charcoal andother organic substances that can dated radiometrically. Archaeological materials, such aspotsherds, are common at many sites in the Southwest, and can be dated to a cultural period onthe basis of diagnostic characteristics. Many organic samples found in flood sediments areallochthonous, or detrital in nature. Associated radiocarbon dates provide maximum constraintson the ages of the host deposit. This is particularly true in the case of charcoal [e.g. Blong andGillespie, 1978]. Datable material found in situ at boundaries between flood deposits can providetighter age constraints.
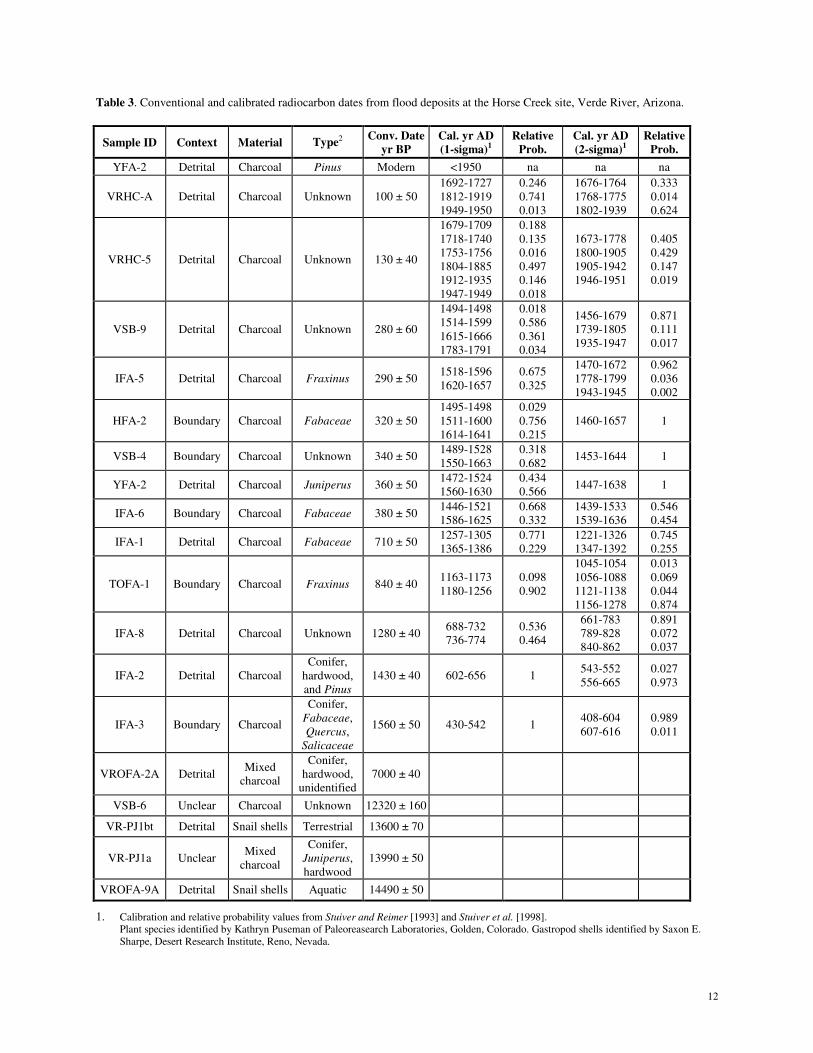
We obtained 18 radiocarbon dates from samples collected from flood deposits at the HorseCreek site, 16 from charcoal and 2 from snail shells (Table 3). We also encountered severalprehistorical artifacts in stratigraphic context. Most organic samples were identified to thespecies or genus level to evaluate their likely provenance in the watershed. This, in addition tostratigraphic context, can help determine whether a sample is in situ or far-traveled(allocthonous), as well as to get a general idea of the potential fidelity of the age to the date ofthe flood. This approach has only recently been rigorously employed in paleoflood studies,although it has been common practice in archeological studies for decades. Bulk samples fromseemingly sterile flood deposits were mined for datable material through flotation andmechanical separation of organic material from large (several kilograms) bulk sediment samples[e.g. Pohl, 1995]. This technique was successful in yielding sufficient quantities of datablematerial from numerous deposits, including a series of Pleistocene flood deposits.
11
Figure 4. Location map of the Horse Creek study site and cross section through the Verde River constriction atSheep Bridge to the Horse Creek flood deposit site. Prominent points on the cross section are indicated on the map.Aerial photo is from September 14, 1998.
12
Table 3. Conventional and calibrated radiocarbon dates from flood deposits at the Horse Creek site, Verde River, Arizona.
Sample ID Context Material Type2 Conv. Dateyr BP
Cal. yr AD(1-sigma)1
RelativeProb.
Cal. yr AD(2-sigma)1
RelativeProb.
YFA-2 Detrital Charcoal Pinus Modern <1950 na na na
VRHC-A Detrital Charcoal Unknown 100 ± 501692-17271812-19191949-1950
0.2460.7410.013
1676-17641768-17751802-1939
0.3330.0140.624
VRHC-5 Detrital Charcoal Unknown 130 ± 40
1679-17091718-17401753-17561804-18851912-19351947-1949
0.1880.1350.0160.4970.1460.018
1673-17781800-19051905-19421946-1951
0.4050.4290.1470.019
VSB-9 Detrital Charcoal Unknown 280 ± 60
1494-14981514-15991615-16661783-1791
0.0180.5860.3610.034
1456-16791739-18051935-1947
0.8710.1110.017
IFA-5 Detrital Charcoal Fraxinus 290 ± 501518-15961620-1657
0.6750.325
1470-16721778-17991943-1945
0.9620.0360.002
HFA-2 Boundary Charcoal Fabaceae 320 ± 501495-14981511-16001614-1641
0.0290.7560.215
1460-1657 1
VSB-4 Boundary Charcoal Unknown 340 ± 501489-15281550-1663
0.3180.682
1453-1644 1
YFA-2 Detrital Charcoal Juniperus 360 ± 501472-15241560-1630
0.4340.566
1447-1638 1
IFA-6 Boundary Charcoal Fabaceae 380 ± 501446-15211586-1625
0.6680.332
1439-15331539-1636
0.5460.454
IFA-1 Detrital Charcoal Fabaceae 710 ± 501257-13051365-1386
0.7710.229
1221-13261347-1392
0.7450.255
TOFA-1 Boundary Charcoal Fraxinus 840 ± 401163-11731180-1256
0.0980.902
1045-10541056-10881121-11381156-1278
0.0130.0690.0440.874
IFA-8 Detrital Charcoal Unknown 1280 ± 40688-732736-774
0.5360.464
661-783789-828840-862
0.8910.0720.037
IFA-2 Detrital CharcoalConifer,
hardwood,and Pinus
1430 ± 40 602-656 1543-552556-665
0.0270.973
IFA-3 Boundary Charcoal
Conifer,Fabaceae,Quercus,
Salicaceae
1560 ± 50 430-542 1408-604607-616
0.9890.011
VROFA-2A DetritalMixed
charcoal
Conifer,hardwood,
unidentified7000 ± 40
VSB-6 Unclear Charcoal Unknown 12320 ± 160
VR-PJ1bt Detrital Snail shells Terrestrial 13600 ± 70
VR-PJ1a UnclearMixed
charcoal
Conifer,Juniperus,hardwood
13990 ± 50
VROFA-9A Detrital Snail shells Aquatic 14490 ± 50
1. Calibration and relative probability values from Stuiver and Reimer [1993] and Stuiver et al. [1998].Plant species identified by Kathryn Puseman of Paleoreasearch Laboratories, Golden, Colorado. Gastropod shells identified by Saxon E.Sharpe, Desert Research Institute, Reno, Nevada.
13
We adopted a flexible, systematic approach to interpreting radiocarbon dates to develop aflood chronology that reasonably reflects the actual timing of floods. Numerous sources ofuncertainty combine to limit the resolution of radiocarbon dates from fluvial deposits, however,and tight resolution from the basis of radiocarbon dates (e.g. 200 yr. or less) is difficult to attainwith confidence. We adhered to the following guidelines to interpreting radiometric dates fromthe Verde River flood deposits (modified from Baker, 1989):
1. Age estimates from allocthonous charcoal samples are maxima for the host deposits andminima for underlying deposits. The critical assumption here is that the hillslope and pre-existing alluvial charcoal reservoir is depleted during extreme floods such that no subsequentflood can carry charcoal older than the underlying flood deposit.
2. Age estimates from in situ charcoal samples from paleosurfaces provide a maximum date forthe overlying deposit and a minimum date for the underlying deposit.
3. Large discrepancies in age estimates from detrital charcoal samples from an individualdeposit indicate an inconsistency that may stem from reworking of older alluvial deposits,biological reworking of anachronous organic materials, sampling problems, or (least likely)analytical errors. In these instances, chronological interpretations are based on site-specificcharacteristics and preponderance of evidence.
4. Overlapping dates within a single deposit are interpreted conservatively, such that thereported range extends from the youngest bound to the oldest bound associated with a givensample from the deposit—unless the implication is inconsistent with numerous other datesfrom the section.
Previous Paleoflood Studies of the Verde River
Three paleoflood studies of the Verde River have been conducted just upstream of the HorseCreek site, two prior to the floods of 1993, and the third immediately after them. The first VerdeRiver paleoflood study was performed approximately 6 km upstream of the Tangle Creek gage[Ely and Baker, 1985; Ely, 1985]. They reported stratigraphic evidence and related peakdischarges estimates for several historical floods and concluded that the largest of these was the1891 flood. Ely and Baker [1985] also found evidence for a substantially larger flood dated about1000 years B.P. O’Connor et al. [1986] studied a reach approximately 6 km upstream of the Ely-Baker reach (Figure 1). They concluded that the paleoflood record at that site was less completeand peak discharge estimates for presumably correlative flood deposits were consistently lowerthan at the nearby Ely-Baker reach. House et al. [1995] performed a detailed follow-up study atthe Red Creek site and a reconnaissance study at the Ely-Baker site following the floods in 1993.Similar to O’Connor et al. [1986], they report modeling results for the peak discharge of thelargest 1993 flood in the reach that are lower than that reported from the gage downstream aswell as that interpolated from a rating curve derived from model results reported from the Ely-Baker site [Ely, 1985]. These differences were ascribed to underestimation of discharge from thebasis of slack-water deposits and to augmentation of discharge by tributary input between thesites.
14
HORSE CREEK PALEOFLOOD STRATIGRAPHY
The floods of 1993 clearly demonstrated that large floods on the lower Verde Rivercorrespond to significant deposition of slack-water sediment in the mouth and lower reaches ofHorse Creek. One or both of the two 1993 floods on the river amounted to the flood of record atevery mainstem gage and most tributary gages in the basin. These floods and subsequent, lessextreme events in 1995 and 1998, left distinct stratigraphic evidence that provides a usefulconceptual framework for evaluating the context and integrity of the stratigraphic record andpeak discharges of past large floods.
The Horse Creek site is a nearly ideal paleoflood study site. It contains the most voluminoussequence of Holocene flood slack-water deposits that we have identified anywhere along theriver. The Horse Creek-Verde River confluence is on the outside of a nearly 90-degree bend inthe river that is immediately upstream of a narrow bedrock constriction. During large floods, thisgeometry results in the development of a large eddy that separates from the main channel flowand submerges the mouth of Horse Creek. This results in the deposition of large volumes ofsuspended sediment and, in the case of the 1993 floods, tremendous amounts of flotsam in thelower reaches of Horse Creek [c.f. Denlinger et al., in prep.]. The site is less than 0.4 kmupstream from the final stream gage on the unregulated portion of the Verde River,[;] and nosignificant tributaries occur between the study site and the gage. A wide range of flood estimateshave been reported from the gage over the course of our study—4106 cms (January 1993), 3540cms (February 1993), 3058 cms (February 1995), 2543 cms (March 1995) and 731 cms (April1998). We have surveyed high-water marks from most of these events to compile a stage–discharge rating curve at the site that allows a direct linkage of the paleoflood stage record withthe systematic record of flood discharge estimates.
We have evaluated the flood stratigraphy of the Horse Creek site is exposed in 4 exposures ofthree inset terraces, informally named the young (YT), intermediate (IT), and old (OT) terraces(Figure 4). Each terrace occupies a separate large niche along the lower channel of Horse Creek.The composite stratigraphic thickness of the sequence is approximately 8 meters. Taken together,these flood deposits provide a continuous record of the largest floods on the Verde River over thelast 1600 years (Table 4).
Young Terrace. We described extensive exposures of slack-water flood deposits in the youngterrace (YT) on either side of Horse Creek (Figure 5). One exposure (YTa) measuresapproximately 9-m wide by 4-m high and is in a terrace that occupies a bedrock alcove on theleft bank of Horse Creek and is inset below the IT. The other exposure (YTb) measuresapproximately 20-m wide by 5-m high, and is in a terrace remnant farther upstream the channeland on the opposite bank of Horse Creek. Based on historical artifacts, radiocarbon dates, andphysical characteristics of the deposits, it is possible to correlate the exposed units in YTa andYTb across the channel of Horse Creek although the thickness and relative elevation of some ofthe units vary. All of these flood deposits are less than 400-500 years old, and the uppermost 5deposits (including 2 from 1993) are from historical floods. In general, the stratigraphic andsedimentologic characteristics of deposits in the YT exposures are much more clear and complexthan the older deposits at the study site, which reflects a difference in the energetics of flow anddeposition at each site (the YFT being closest to the Verde River channel) as well as muting offine textural details over time.
15
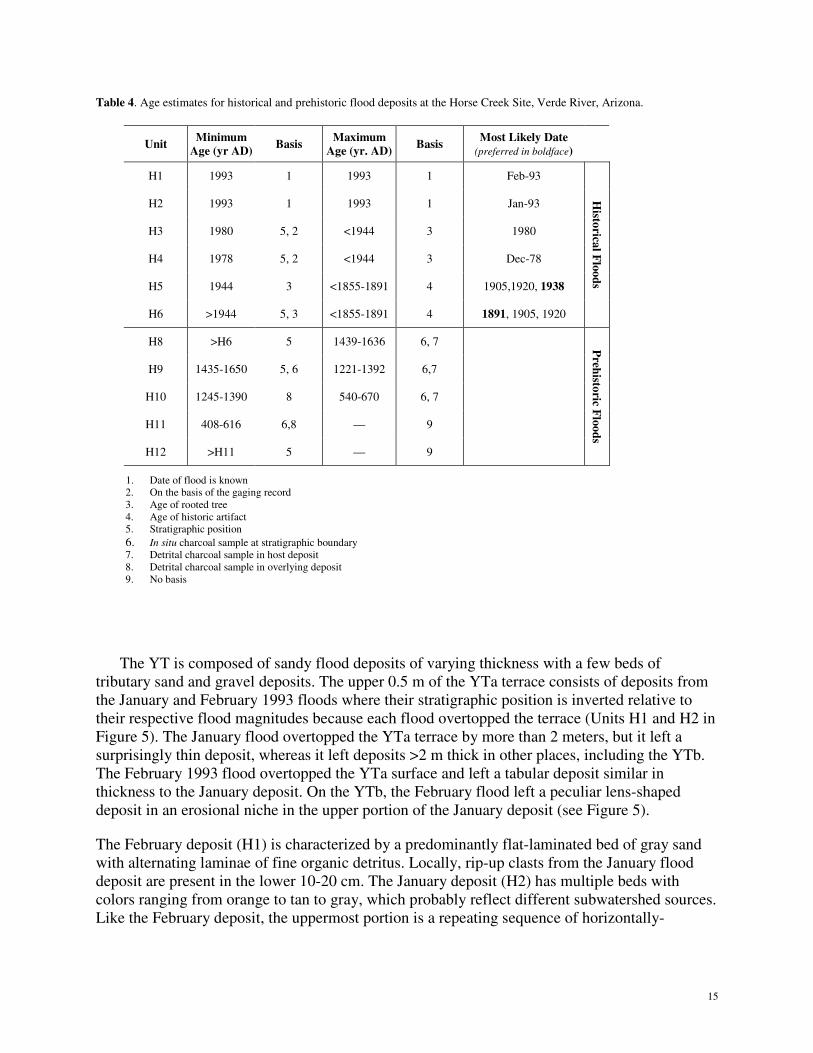
Table 4. Age estimates for historical and prehistoric flood deposits at the Horse Creek Site, Verde River, Arizona.
Unit MinimumAge (yr AD) Basis Maximum
Age (yr. AD) Basis Most Likely Date(preferred in boldface)
H1 1993 1 1993 1 Feb-93
H2 1993 1 1993 1 Jan-93
H3 1980 5, 2 <1944 3 1980
H4 1978 5, 2 <1944 3 Dec-78
H5 1944 3 <1855-1891 4 1905,1920, 1938
H6 >1944 5, 3 <1855-1891 4 1891, 1905, 1920
HistoricalF
loods
H8 >H6 5 1439-1636 6, 7
H9 1435-1650 5, 6 1221-1392 6,7
H10 1245-1390 8 540-670 6, 7
H11 408-616 6,8 — 9
H12 >H11 5 — 9
Prehistoric
Floods
1. Date of flood is known2. On the basis of the gaging record3. Age of rooted tree4. Age of historic artifact5. Stratigraphic position6. In situ charcoal sample at stratigraphic boundary7. Detrital charcoal sample in host deposit8. Detrital charcoal sample in overlying deposit9. No basis
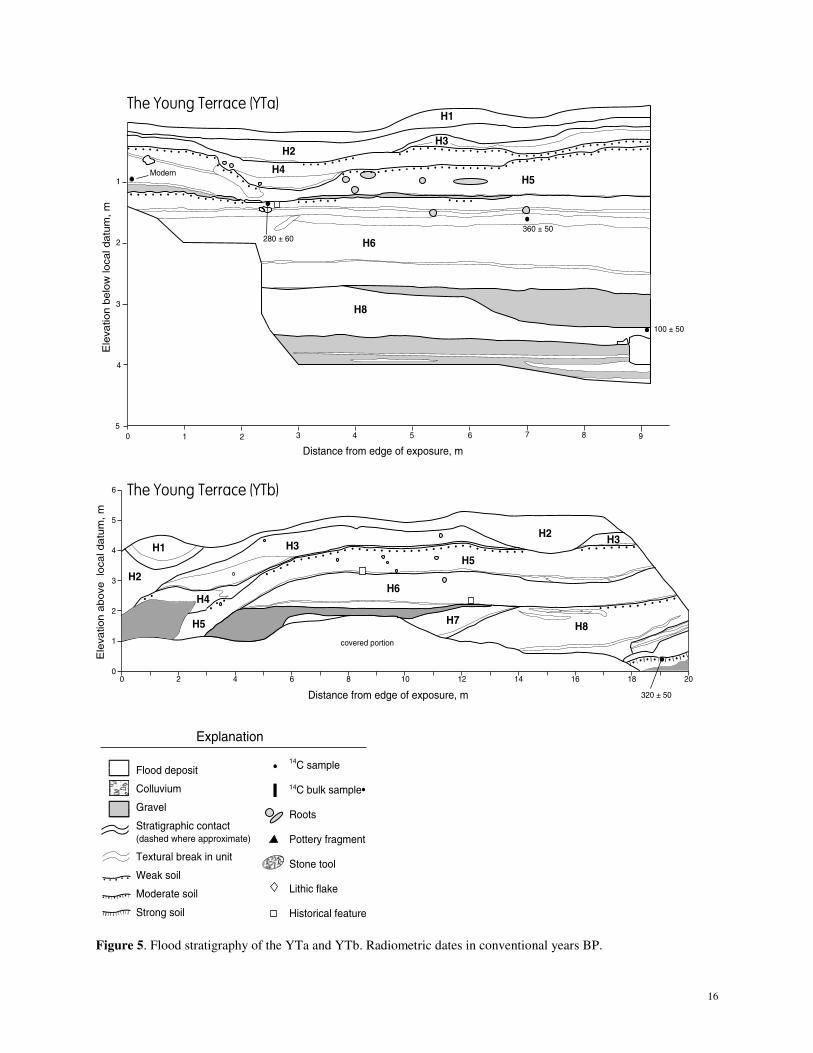
The YT is composed of sandy flood deposits of varying thickness with a few beds oftributary sand and gravel deposits. The upper 0.5 m of the YTa terrace consists of deposits fromthe January and February 1993 floods where their stratigraphic position is inverted relative totheir respective flood magnitudes because each flood overtopped the terrace (Units H1 and H2 inFigure 5). The January flood overtopped the YTa terrace by more than 2 meters, but it left asurprisingly thin deposit, whereas it left deposits >2 m thick in other places, including the YTb.The February 1993 flood overtopped the YTa surface and left a tabular deposit similar inthickness to the January deposit. On the YTb, the February flood left a peculiar lens-shapeddeposit in an erosional niche in the upper portion of the January deposit (see Figure 5).
The February deposit (H1) is characterized by a predominantly flat-laminated bed of gray sandwith alternating laminae of fine organic detritus. Locally, rip-up clasts from the January flooddeposit are present in the lower 10-20 cm. The January deposit (H2) has multiple beds withcolors ranging from orange to tan to gray, which probably reflect different subwatershed sources.Like the February deposit, the uppermost portion is a repeating sequence of horizontally-
16
H1
H4H5
H6
H8
H3H2
H1H2
H4
H5
H5
H6
H7 H8
H3 H3
H2
4
58 91 2 3 4 5 6 70
1
2
3
Distance from edge of exposure, m
Ele
vatio
nbelo
wlo
cald
atu
m,m
280 ± 60360 ± 50
Modern
100 ± 50
0 2 4 6 8 10 12 14 16 18 20
6
5
4
3
2
1
0
Distance from edge of exposure, m
Ele
vatio
nabove
loca
ldatu
m,m
covered portion
320 ± 50
14C sample
14C bulk sample•
Roots
Pottery fragment
Stone tool
Lithic flake
Historical feature
Explanation
Flood deposit
Colluvium
Gravel
Stratigraphic contact(dashed where approximate)
Textural break in unit
Weak soil
Moderate soil
Strong soil
The Young Terrace (YTa)
The Young Terrace (YTb)
Figure 5. Flood stratigraphy of the YTa and YTb. Radiometric dates in conventional years BP.
17
laminated fine sand with organic interlaminae reflecting deposition near the organic detritus-laden water surface in a swash environment [e.g. Topping et al., 1999]. We observed thischaracteristic in fresh flood deposits throughout the basin following the 1993 events. The surfaceof the January deposit is approximately 2 m below the peak water surface, suggesting that theinterval when the flood stage was significantly above the YT was relatively brief.
The deposit immediately below the January 1993 unit (H3) is discontinuously preservedalong the extent of the YTa exposure as a couplet of gray sand overlain by orange sand. Thiscouplet is thicker and continuously exposed across the YTb exposure. This deposit is notsignificantly bioturbated and overlies multiple historical flood deposits. We tentatively assign itto the 1980 flood. Unit H4 partially buries a grove of mesquite trees on the YTa surface and ispenetrated by small roots. It is from a slightly older historic flood (1978 or 1980). We recentlycollected a corroded 9-volt battery that had fallen out of the YTa exposure from either H3 or H4,suggesting that one or both of them date to the mid-20th century or later. Unit H5 is a distinctivebed with clear upper and lower boundaries except the portions that are extensively bioturbated byrooting. In the YTa exposure it is separated from unit H4 by a thin bed of angular colluvium. Thegrove of mesquite trees is rooted principally in unit H5 in the YTa terrace. We extracted a radialcross-section from the main stalk of a mesquite that had recently fallen from the exposure. Thisspecies has been shown to provide reliable annual ring counts [Flinn et al., 1994] andapproximately 56 annual rings were discernible on the specimen [F. Biondi, writtencommunication] indicating that it probably germinated no earlier than 1944. A charcoal samplecollected from this unit just beyond the left edge of the described exposure yielded a modern date(<1950 AD). It was from a zone somewhat disturbed by rooting and may have been translocateddownward. The tree-ring date represents a better minimum age of the unit.
Historical artifacts collected from Unit H5 further indicate that it is younger than the middle1800’s. Amorphous pieces of pure aluminum were collected from the uppermost part of the unitin the YTa. Intense bioturbation of the zone from which these samples were collected introducessome uncertainty, but it is likely that they are from the stratigraphic boundary between units H4and H5, although they may have been translocated from the surface of unit H4. Mass productionof aluminum was patented in 1880s, which provides a constraint on the minimum age of H5 andthe maximum age of H4. A conspicuous and presumably historical campfire was identified atthis same stratigraphic boundary in the YTb.
Unit H6 is a thick deposit with multiple beds and variable sedimentology that suggest acomplex and long-duration flood hydrograph. A piece of a small wooden box with a metal frameattached with badly corroded wire nails was collected from the bounding surface between H5and H6 in the YTb exposure. The metal frame was attached to the wood with what appeared tobe badly corroded wire nails. This dates the item to no earlier than 1855-1891 [Sutton andArkush, 1998, pp. 166-170]. It is most likely that unit H6 is from the 1891 flood. The 1862 or1868 floods are less likely possibilities. In the YTa, the contact between units H6 and H7 variesfrom a sharp, flat contact between massive beds of silty sand to a sloping, erosional contactbetween alluvial gravels and massive silty sand (Figure 5). In the YTb exposure, unit H6 has aflat, erosional contact with two flood deposits (units H7 and H8) that also appear to be separatedby an erosional unconformity (Figure 5). It is not clear which of these deposits underlies H6 inthe YTa. To clarify subsequent discussions, we assume that unit H7 is not present in the YTasequence, it having been removed during the interval of erosion represented by the gravel layer
18
between H6 and H8. The lower 1-meter of the YTb includes eroded remnants of 3 flood depositsthat are not present in the YTa. Because of this, and the fact that the deposits are low in thesequence, we do not include them in the tally of large floods. A radiocarbon data from an in situcharcoal sample from the lowest of the 3 deposits establishes the maximum span of the YT as545-335 years. Thus, more than 5-meters of net vertical accretion of slack-water flood depositshas occurred in the mouth of lower Horse Creek over this period. Any record of flood depositionprior to this at the sites of YTa and YTb has been removed by erosion or is covered by theyounger deposits.
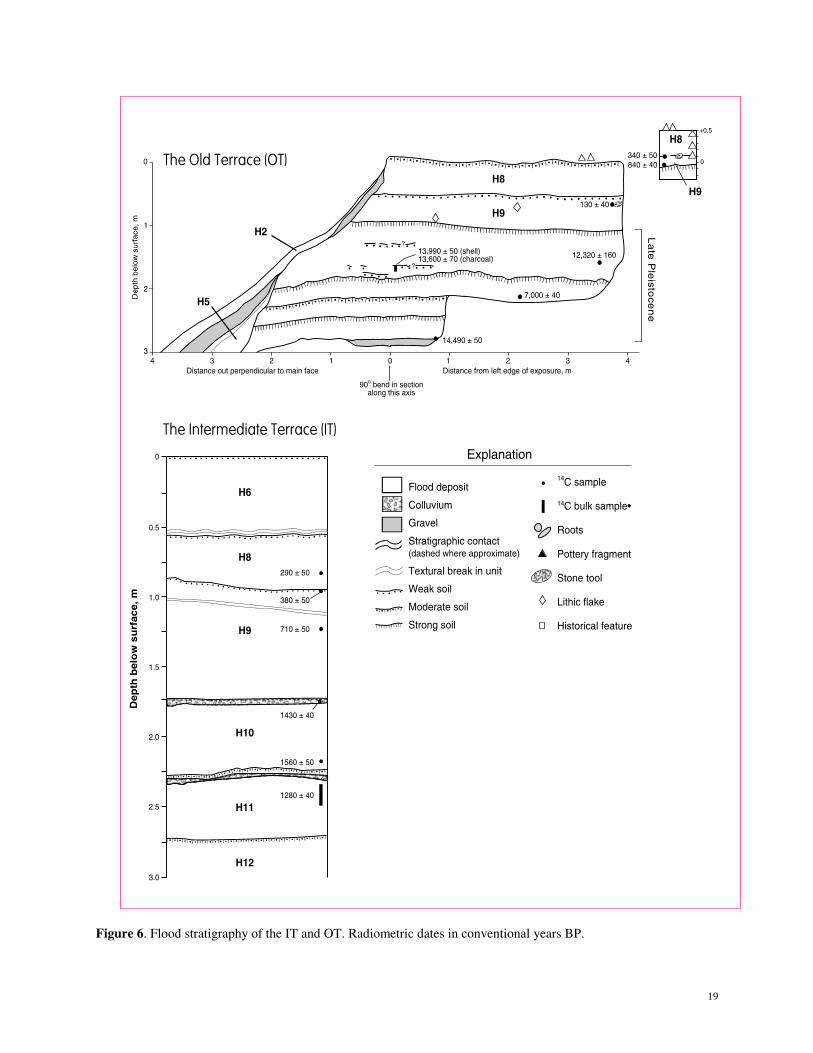
Intermediate Terrace. We described the flood stratigraphy of the intermediate terrace (IT) in agully exposure measuring approximately 2-m wide by 3-m high. Evidence from the IT lengthensthe flood record to approximately 1500-1600 years (Figure 6). We interpret it as a continuousrecord of the largest floods over this time interval since no diagnostic erosional unconformitieswere identified within this sequence. Clearly, the aggradation of the terrace to its present levelbegan on a lower, and presumably erosional surface at some time prior to approximately 1600years ago. The January 1993 flood barely lapped onto lower portions of the surface of the ITlocally, but it did not inundate the IT surface at the site where we examined the stratigraphy.
We have no direct constraints on the age of the youngest deposit in the IT, but an in situcharcoal sample from a distinct paleosurface at the base of the underlying deposit provides amaximum age for both units of 1439-1636 AD. The upper two units are also separated by adistinct paleosurface, although the relative degree of weathering appeared to be less. Weconclude that the second unit from the top is H8 on the basis of radiometric dates, stratigraphicposition, and relation with units in the OT (discussed below). We conclude that the uppermostunit is H6, the 1891 flood deposit. It is unlikely to be from any of the other historical floodsbecause of the flood magnitude implication of the position of the deposit (4083 cms), which isconsistent with published estimates for the event (4248 cms) [Pope et al., 1998].
Unit H8 is separated from H9 by a distinct paleosurface with a minimum age of 1439-1636AD. A date from allocthonous charcoal within H9 establishes a maximum age of 1221-1392 AD.The contact between H9 and H10 is characterized only by a distinct change in texture (increasein induration and carbonate accumulation) and a strikingly older radiocarbon date from anallocthonous sample (543-665 AD). The approximately 700-year difference in dates from withinH9 and H10 suggests a multi-centennial hiatus in flood deposition above the level of H10, aconclusion that is corroborated by stratigraphic relations in the OT. The date from H10 isconsistent with a date (408-616 AD) from a buried surface beneath a thin bed of colluviumseparating units H11 and H12. The ages of units H11 and H12 are difficult to determine becauseof sparse datable material and an age-reversal. We are forced to conclude that the two units sharea minimum date of 408-616 AD. There is no basis for assigning a maximum date to either unit.
19
H2
H8
H8
H9
H9
H5
H10
H12
H6
H8
H11
H9
••••••••••••••••••••••••••••••
Distance from left edge of exposure, m
1
11234
2
23
3 4
De
pth
be
low
surf
ace
,m
0
0
12,320 ± 160
130 ± 40
?
?
14,490 ± 50
13,990 ± 50 (shell)13,600 ± 70 (charcoal)
7,000 ± 40
+0.5
0840 ± 40340 ± 50
90o bend in sectionalong this axis
Distance out perpendicular to main face
La
teP
leisto
cen
e
Dep
thb
elo
wsu
rfac
e,m
0.5
0
1.0
1.5
2.0
2.5
3.0
290 ± 50
380 ± 50
710 ± 50
1430 ± 40
1560 ± 50
1280 ± 40
14C sample
14C bulk sample•
Roots
Pottery fragment
Stone tool
Lithic flake
Historical feature
Explanation
Flood deposit
Colluvium
Gravel
Stratigraphic contact(dashed where approximate)
Textural break in unit
Weak soil
Moderate soil
Strong soil
The Old Terrace (OT)
The Intermediate Terrace (IT)
Figure 6. Flood stratigraphy of the IT and OT. Radiometric dates in conventional years BP.
20
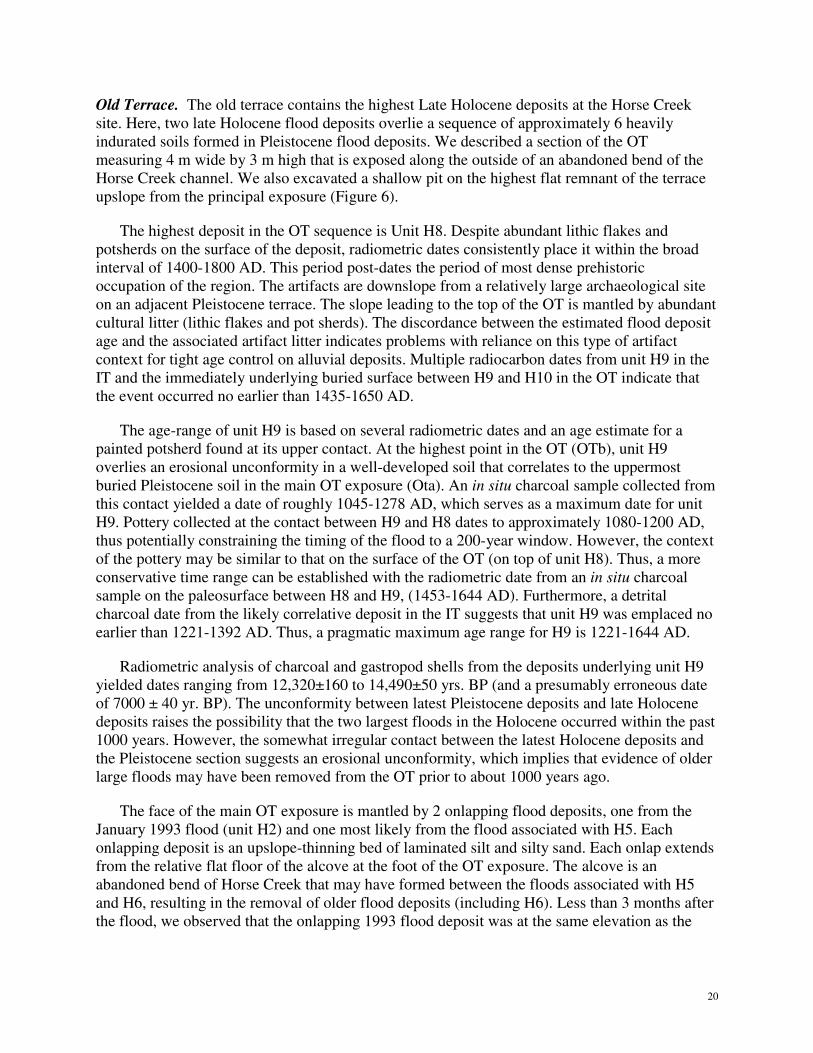
Old Terrace. The old terrace contains the highest Late Holocene deposits at the Horse Creeksite. Here, two late Holocene flood deposits overlie a sequence of approximately 6 heavilyindurated soils formed in Pleistocene flood deposits. We described a section of the OTmeasuring 4 m wide by 3 m high that is exposed along the outside of an abandoned bend of theHorse Creek channel. We also excavated a shallow pit on the highest flat remnant of the terraceupslope from the principal exposure (Figure 6).
The highest deposit in the OT sequence is Unit H8. Despite abundant lithic flakes andpotsherds on the surface of the deposit, radiometric dates consistently place it within the broadinterval of 1400-1800 AD. This period post-dates the period of most dense prehistoricoccupation of the region. The artifacts are downslope from a relatively large archaeological siteon an adjacent Pleistocene terrace. The slope leading to the top of the OT is mantled by abundantcultural litter (lithic flakes and pot sherds). The discordance between the estimated flood depositage and the associated artifact litter indicates problems with reliance on this type of artifactcontext for tight age control on alluvial deposits. Multiple radiocarbon dates from unit H9 in theIT and the immediately underlying buried surface between H9 and H10 in the OT indicate thatthe event occurred no earlier than 1435-1650 AD.
The age-range of unit H9 is based on several radiometric dates and an age estimate for apainted potsherd found at its upper contact. At the highest point in the OT (OTb), unit H9overlies an erosional unconformity in a well-developed soil that correlates to the uppermostburied Pleistocene soil in the main OT exposure (Ota). An in situ charcoal sample collected fromthis contact yielded a date of roughly 1045-1278 AD, which serves as a maximum date for unitH9. Pottery collected at the contact between H9 and H8 dates to approximately 1080-1200 AD,thus potentially constraining the timing of the flood to a 200-year window. However, the contextof the pottery may be similar to that on the surface of the OT (on top of unit H8). Thus, a moreconservative time range can be established with the radiometric date from an in situ charcoalsample on the paleosurface between H8 and H9, (1453-1644 AD). Furthermore, a detritalcharcoal date from the likely correlative deposit in the IT suggests that unit H9 was emplaced noearlier than 1221-1392 AD. Thus, a pragmatic maximum age range for H9 is 1221-1644 AD.
Radiometric analysis of charcoal and gastropod shells from the deposits underlying unit H9yielded dates ranging from 12,320±160 to 14,490±50 yrs. BP (and a presumably erroneous dateof 7000 ± 40 yr. BP). The unconformity between latest Pleistocene deposits and late Holocenedeposits raises the possibility that the two largest floods in the Holocene occurred within the past1000 years. However, the somewhat irregular contact between the latest Holocene deposits andthe Pleistocene section suggests an erosional unconformity, which implies that evidence of olderlarge floods may have been removed from the OT prior to about 1000 years ago.
The face of the main OT exposure is mantled by 2 onlapping flood deposits, one from theJanuary 1993 flood (unit H2) and one most likely from the flood associated with H5. Eachonlapping deposit is an upslope-thinning bed of laminated silt and silty sand. Each onlap extendsfrom the relative flat floor of the alcove at the foot of the OT exposure. The alcove is anabandoned bend of Horse Creek that may have formed between the floods associated with H5and H6, resulting in the removal of older flood deposits (including H6). Less than 3 months afterthe flood, we observed that the onlapping 1993 flood deposit was at the same elevation as the
21
best high-water marks. If the underlying onlap is comparably faithful to the associated peakstage, the flood may have been comparable in magnitude to the February 1993 flood (3411 cms).
Rating Curve and Discharge Estimation
The duration of our intermittent fieldwork at this site since 1993 has allowed us to compile arating curve based on reported peak discharges from the gage downstream—Verde River belowTangle Creek (USGS gage #09508500) (Figure 1, Tables 1 and 2). We surveyed high-watermarks from events in 1993 (two floods), 1995 (two floods), and 1998, with reported dischargesof 4106 cms, 3511 cms, 3058 cms, 2543 cms, and 731 cms, respectively. Here we report ourresults in relation to the officially reported values for the sake of consistency and ease ofcomparison with the systematic record of floods. However the resulting rating curve is atconsiderable variance with 2-D hydraulic modeling of a 6-km long reach of the river thatcontains the gage and the Horse Creek slack-water site [Denlinger et al., this volume]. High-water marks from the largest floods in 1993, 1995, and 1998 were unambiguous in post-floodinvestigations, and we are confident that the rating curve between these three points is soundwith respect to the reported flood discharges. The precise stage of the February 1993 and theMarch 1995 floods were more difficult to determine. In each case, the stage that we report is
Table 5. Discharges corresponding to flood units in each terrace at theHorse Creek Site, Verde River, Arizona.
Unit YTa YTb IT OTa OTb
H1 3248 3085 — — —
H2 3242 3351 — 40671 —
H3 3175 3192 — —
H4 3121 2788 — —
H5 3095 3004 —
35401,2
—
H6 2893 2680 4083 — —
H8 2321 2462 3927 4216 4326
H9 — — 3810 3996 4216
H10 — — 3563 — —
H11 — — 3345 — —
H12 — — 3178 — —
Pleist. — — — 3891 4145
1. Onlapping deposit2. Correlation uncertain
22
based on our best field estimate of the maximum stage of the flood. We fit a logarithmic curve tothe points in the range of 2543-4107 and a linear curve between 731 and 2543 to estimate theminimum discharges corresponding to the various flood deposits in the study site (Table 5). Weextrapolated the rating curve beyond the peak stage of the January 1993 flood to estimate theminimum discharges associated with the highest SWDs found at Horse Creek. Based on this, thefloods that emplaced units H8 and H9 must have had a peak discharges in excess of 4216 and4326 cms, respectively.
DISCUSSION
Paleoflood Chronology of the Lower Verde River
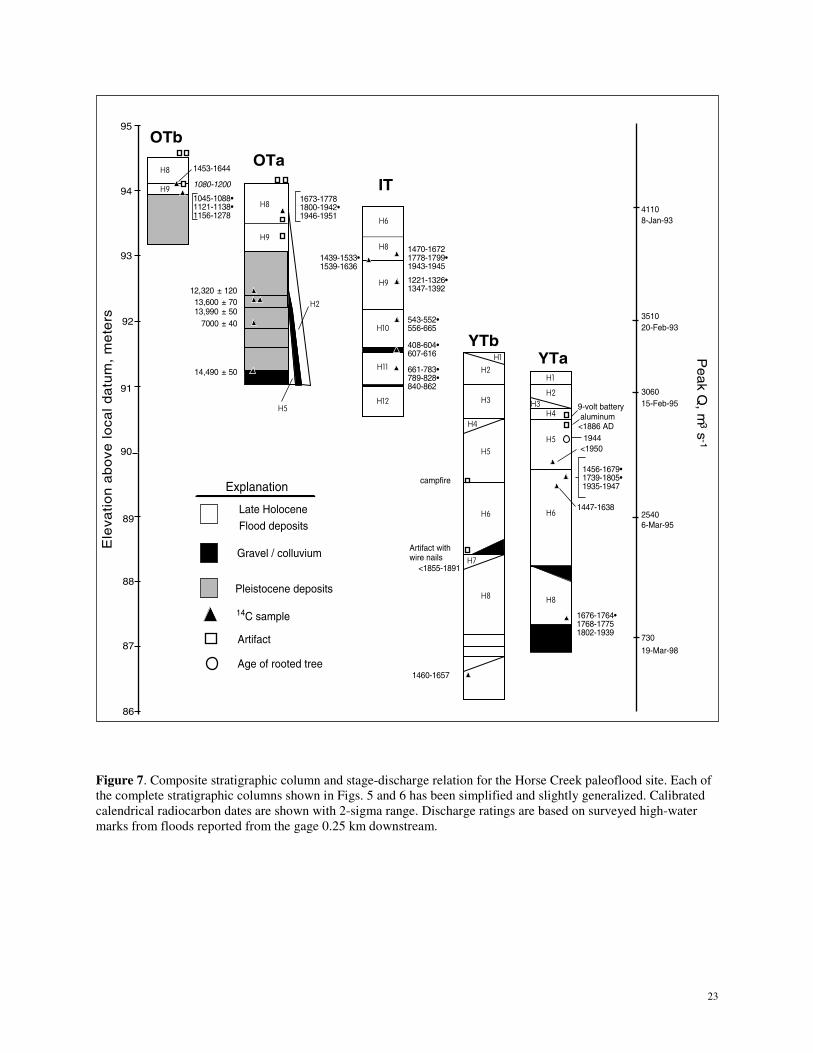
The sequence of flood deposits that we studied at the Horse Creek site contains a record ofthe of the river’s 11 largest floods over the last 1600 years, including the two large floods in1993 and four other historical floods. The stratigraphic record of floods from the four exposuresthat we examined is generalized and compiled in Figure 7, the timing of each event issummarized in Table 4, and the minimum peak discharge associated with each of the deposits inthe four exposures are listed in Table 5. Units H1 through H6 are historical flood deposits whichare known to correspond to winter floods, and on the basis of the flood hydroclimatology of thelargest floods on the Verde River [e.g. House and Hirschboeck, 1997], it is likely that this is alsothe case for each of the prehistoric events (H8 through H12), although it is possible that some ofthe deposits may correspond to floods from intense dissipating tropical storms unprecedented inthe historical record. The history of the YT is indicative of the volatility of the lowest terraces ina typical tributary-mouth slack-water site. The stratigraphy of the YT is informative with respectto establishing age-control for relatively recent floods; however, due to the relative youth andlow elevation of the two YT exposures, they are not a particularly valuable source of informationabout large paleofloods. The higher and more protected exposures in the IT and OT are mostuseful in this regard and, taken together, record the occurrence of 6 large floods over the past1600 years. The large floods of 1993 are not recorded in these SWD sequences. Depositsassociated with the January 1993 flood exist only as a thin onlap on the steep face of the OT,however. The long-term preservation potential for this feature is extremely low.
Relation to Other Paleoflood and Holocene Stratigraphic Studies on the Verde River
Ely and Baker [1985] described a series of three distinct slack-water deposit “benches” withinset relationships at various sites along a 3.5 km reach of the Verde River. The middle benchincluded deposits from the most recent large floods on the river up to and including 1978 and1980 floods. It is a likely that this sequence is correlative to the YT sequence at the Horse Creeksite. The upper bench probably corresponds with the IT at Horse Creek. Ely and Baker [1985]concluded that it was composed of only one deposit where preserved in their reach andtentatively assigned it to the 1891 flood from the basis of rooted, mature vegetation and theassociated flood discharge. They also described a higher, isolated deposit. An artifact on itssurface dated to approximately 1200 AD, and radiometric analysis on disseminated charcoal 50cm below the surface yielded an age of 1010 ± 50 yr. It is likely that this deposit is correlative to
23
H1
H1
H2
H2
H3 H3
H4
H5
H5 H4
H5
H6
H6 H6
H8
H9
H9
H9
H10
H11
H12
H8
H8
H8 H8
H7
H2
Late Holocene
Flood deposits
Pleistocene deposits
Gravel / colluvium
14C sample
Artifact
Age of rooted tree
8-Jan-93
20-Feb-93
15-Feb-95
6-Mar-95
19-Mar-98
4110
91
92
95
94
93
90
86
87
88
89
Ele
vatio
na
bo
velo
cald
atu
m,
me
ters 3510
3060
2540
730
IT
YTbYTa
OTaOTb
Peak
Q,
m3
s-1
Explanation
1470-16721778-1799•1943-1945
1439-1533•1539-1636
1221-1326•1347-1392
543-552•556-665
408-604•607-616
661-783•789-828•840-862
<1855-1891
1673-17781800-1942•1946-1951
13,600 ± 7013,990 ± 50
7000 ± 40
12,320 ± 120
14,490 ± 50
1453-1644
1080-1200
1045-1088•1121-1138•1156-1278
1460-1657
1456-1679•1739-1805•1935-1947
1447-1638
1676-1764•1768-17751802-1939
Artifact withwire nails
aluminum<1886 AD
<19501944
9-volt battery
campfire
Figure 7. Composite stratigraphic column and stage-discharge relation for the Horse Creek paleoflood site. Each ofthe complete stratigraphic columns shown in Figs. 5 and 6 has been simplified and slightly generalized. Calibratedcalendrical radiocarbon dates are shown with 2-sigma range. Discharge ratings are based on surveyed high-watermarks from floods reported from the gage 0.25 km downstream.
24
unit H9. The age discordance may reflect a somewhat ambiguous context for the artifacts and adetrital charcoal date that is too old.
O’Connor et al. [1986] identified a series of deposits at the Red Creek study site (site B inFigure 1) that is very likely correlative to the YT at Horse Creek. They found no evidence forany older, particularly large floods. In a follow-up study, House et al. [1995] largely confirmedthe findings of the earlier study, but did find a very isolated exposure of higher and olderdeposits that correlates to either the IT or the OT. No detailed stratigraphic analysis at this sitewas performed by House et al. [1995].
Overall the paleoflood records from the Ely-Baker reach and the Horse Creek site correspondfairly well. However, the lack of a deposit more clearly correlative with unit H8 is a significantdiscrepancy. It is possible that the flood discharge increase between the sites associated with unitH9 was less than that of unit H8 such that their relative magnitudes were reversed. Somesignificant tributaries enter the river between the two sites (Tangle Creek, Wet Bottom Creek,and Sycamore Creek) that, historically, may have contributed more than 425 cms to mainstemfloods [House et al.,1995]. It is also possible that they did not recognize the deposit because ofinadequate exposure, or erosion. The stratigraphic record from the Chasm Creek site upstreamsuggests that a fairly recent (within the past few hundred years), tremendous flood would beevident at a relatively high stratigraphic level at the Ely-Baker site. Moreover, Fuller [1987]reports that two exceptionally large paleofloods occurred in the last 1000 years on the Salt Riverbelow it’s confluence with the Verde River. One of these occurred within the past 410 years andis likely correlative with unit H8. The other occurred approximately 800-1000 yr. BP and islikely correlative with unit H9.
Ely [1992] compiled paleoflood stratigraphic data from 19 rivers throughout Arizona andsouthern Utah (including the Verde River) to develop a regional flood chronology that spans thelast 5000 years. The regional stratigraphic record is based on parsing an extensive radiocarbonchronology of paleofloods into 200-year increments. The data suggest that flood events aredistributed non-randomly in time. Ely [1992, 1997] reports that late Holocene intervalsassociated with increased frequency of large floods include 3800-2200 BC, 400 BC-1100 AD,and 1400 AD to the present. She reports that periods with apparently low frequency of largefloods include 2200-400 BC and 1200-1400 AD. The apparent variability in the regionalpaleoflood record corresponds with other types of paleoclimatic data consistent with hydrologicvariability over periods of decades to centuries.
The somewhat conservative approach to interpreting the radiocarbon chronology we havetaken in this study does not lend itself to subdividing the record into 200-year increments.However, the Verde flood record is a comprehensive record from a river with large floods thatare demonstrably responsive to the same hydroclimatic mechanisms being evaluated by Ely[1992, 1997]. Thus, it should provide an important point of comparison with the regional record.In general the correspondence is only marginal. For example, the possible 700-year hiatus inlarge floods that we inferred from the records in the IT and OT (~600 AD to ~1055 AD) does notmesh particularly well with the regional chronology. Nor does the Verde River record clearlyshow the apparent sharp decrease in flood frequency in the interval of 1200-1400 AD, because atleast one large flood may have occurred in that period (H9). The record at Horse Creek doesdocument the occurrence of numerous large floods within the last 300-400 years, an observations
25
that Ely [1992, 1997] reports from multiple sites in the Southwest. This seems to be due at leastin part to the much higher preservation potential for younger floods.
The generally marginal correspondence between the regional record and our record from asingle river may reflect the variable response of a single element within a larger composite. Itmay also reflect the influence of various sources of uncertainty in compiling fluvial paleoflooddata, including limitations of age-estimation techniques, differing interpretation of the absence ofevidence, and analysis of records that can be biased towards the largest and youngest floods. Ourexperience at the Horse Creek site suggests that it is most likely a combination of several sourcesof uncertainty that are largely inevitable in this type of analysis.
Stratigraphic Complexity and Implications for Record Completeness at the Horse Creek Site
The principal goal of a typical SWD paleoflood investigation is to enumerate the floodsrepresented in the flood stratigraphy as accurately and completely as possible and to determinetheir timing as precisely as possible. In attempting to do this on the lower Verde River, wediscovered that the ease of this task is influenced by the time between floods; deposit thickness,composition and texture; the adequacy of stratigraphic exposure, and the time available for theanalysis. Our extensive investigation of the paleoflood history of the lower Verde River indicatesthat, aside from the vagaries of sedimentological / stratigraphic ambiguity, weathering, and basiclogistical complications, it is inevitable that the slack-water stratigraphic record is complex,incomplete, and often biased towards the most recent large floods. These observations are notnew. They have been stated previously in the paleoflood literature with varying degrees ofemphasis [e.g. Baker, 1989; Kochel and Baker, 1988; Ely, 1997] and have been exploredrecently in other slack-water settings [Webb et al., this volume]. Our study at Horse Creekclearly illuminates several types of uncertainty and suggests several others. Specifically, theseinclude the effects of stratigraphic ambiguity, erosion, internal stratigraphic and complexity andincomplete exposure, pedogenesis, and stratigraphic record self-censoring. The effects of thesealone, or in combination, have important implications for evaluating the information content ofregional or site-specific fluvial paleoflood data.
Stratigraphic Ambiguity. Individual flood deposits can be differentiated using pedologic,stratigraphic and sedimentologic criteria, including changes in grain size, induration, andsediment color; the presence of intercalated deposits of different origin, organic horizonsrepresenting buried surfaces, and concentrations of archaeological materials [Baker, 1987, 1989].Some of these criteria that are textural in nature may be present within a single deposit(intradeposit features). It is critical and occasionally difficult to discriminate intraflood featuresfrom actual stratigraphic breaks (interdeposit features). For example, abrupt changes in grain sizeand sediment color can reflect hydraulic variability in flood hydraulics and suspended sedimenttransport. Changes in color and induration can reflect development of soil horizons and thepresence of buried surfaces, which are diagnostic indicators of a stratigraphic break. The key tointerpreting stratigraphic breaks in flood deposit sequences and differentiating them fromtextural breaks within single deposits is to identify evidence of subaerial exposure at the contactbetween individual units [e.g. Smith, 1993; Hattingh and Zawada, 1996]. Thus, the best types ofevidence for stratigraphic breaks include buried soils/paleosurfaces, erosional unconformities,and intercalated deposits that are not from mainstem river floods, such as colluvium, tributarysediments, or concentrations of archaeological materials [Baker, 1987]. In instances where
26
separate flood deposits were emplaced in a very short interval of time (for example the Januaryand February 1993 floods) stratigraphic breaks can be essentially indistinct from textural breakswithin single flood units. This poses a problem for tallying individual floods.
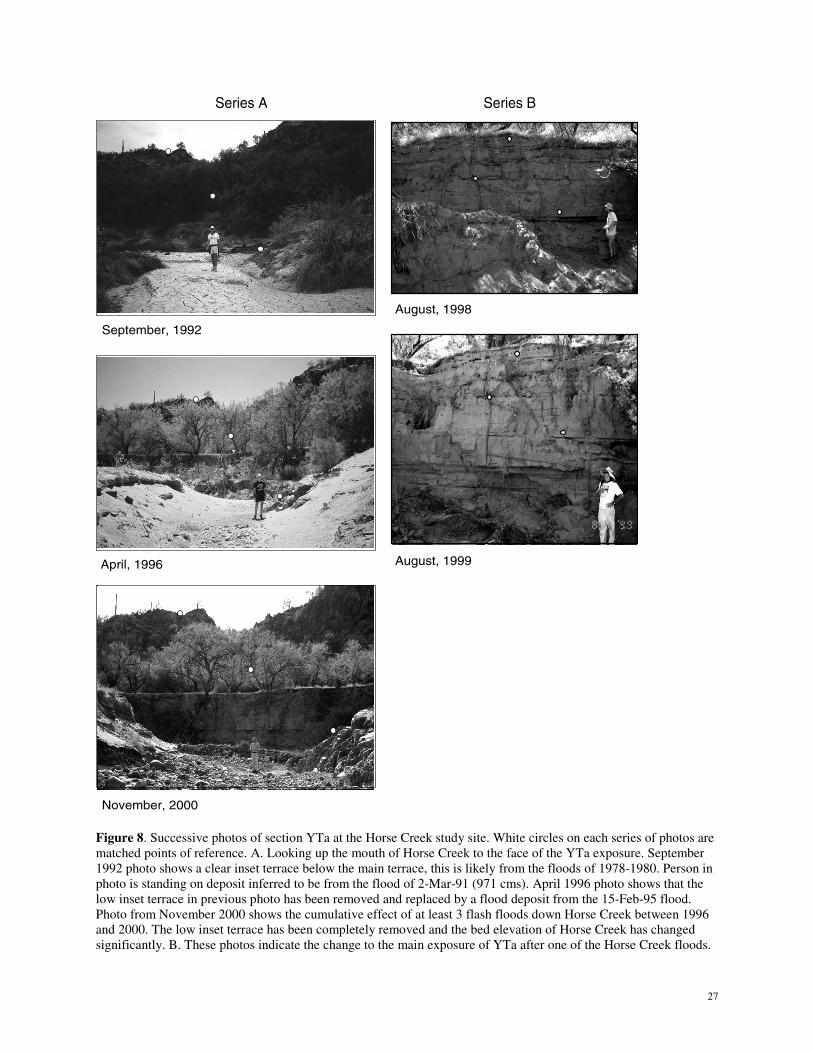
Erosion. The extant stratigraphic record of floods in the mouth of Horse Creek was changedby the occurrence of three large winter floods down the Verde River and 3-4 sizable flows downHorse Creek during the course of our field investigations. We have compiled a photographicrecord of geomorphic and stratigraphic changes in the study area over the period 1992-2000 thatillustrate the impact of these events at the mouth of Horse Creek and at the face of the YTaexposure (Figure 8). Also, in our earliest investigations of the flood stratigraphy we observed anddescribed flood deposits from large floods on the Verde River that have since been completelyeroded from the site.
The YTa is located along the outside of a tight bend in the Horse Creek channel, which hascontributed to the removal of a substantial amount of inset flood stratigraphy since the VerdeRiver floods of 1993. We first visited the Horse Creek site in September of 1992 and observedtwo distinct terraces of flood SWDs in the location of the YTa. The high terrace was the YTaproper and the low terrace was a large inset feature approximately 1-2 meters below the (then)YT surface. We again visited the site two months after the large floods in 1993, and observedfresh deposits from the February flood at least 1 meter thick overlying the inset terrace andonlapping the surface of the YT. We extracted an early to mid-1970s vintage beer can from theinset deposits, which we infer were laid down by one or more of the large floods in 1970, 1972,or 1978. By 1996, most of the inset terrace and the underlying historical deposits had beenremoved or were buried by the largest Verde River flood in 1995. This event did not overtop thesurface of the YT but instead left an inset terrace in essentially the same location as the previousinset. Between 1996 and 1998, the entire inset sequence (including the deposits from the 1995flood) was completely removed by at least two substantial flows on Horse Creek between 1996and 1998. Horse Creek floods in the summers of 1999 and 2000 removed even more of the YTa.
The dynamics of this environment over this brief period indicate the great potential forchanges over 10s to 100s of years. The existing record in the YT is incomplete—even in whatamounts to be a nearly ideal environment for the accumulation and preservation of slack-waterflood deposits. Evidence from the largest floods does seem to have a much higher likelihood oflong-term preservation than does evidence from small and moderate magnitude floods because itis emplaced in locations that are farther removed from modern channels. However, gaps in thatstratigraphic record and the geomorphic setting of the deposits indicate that they too are subjectto periodic removal.
Duration of Subaerial Exposure and Pedogenesis. The relationship between the duration ofsubaerial exposure, the thickness of an individual flood deposit, and the elevation of the surfaceof the deposit relative to the channel (thus flood magnitude) dictates the degree to which theintegrity of the deposit and its differentiation from the underlying deposit(s) is potentiallycompromised by bioturbation. Bioturbation of flood deposits at the Horse Creek site was mostpronounced where a grove of mesquites is rooted in the upper portions of the YT (in units H4and H5), and in the Pleistocene SWDs in the lower portion of the OT. In the OT, bulk samplestaken from indurated, buried A-horizons were composed almost entirely of insect burrow casts
27
August, 1998
August, 1999
September, 1992
April, 1996
November, 2000
Series A Series B
Figure 8. Successive photos of section YTa at the Horse Creek study site. White circles on each series of photos arematched points of reference. A. Looking up the mouth of Horse Creek to the face of the YTa exposure. September1992 photo shows a clear inset terrace below the main terrace, this is likely from the floods of 1978-1980. Person inphoto is standing on deposit inferred to be from the flood of 2-Mar-91 (971 cms). April 1996 photo shows that thelow inset terrace in previous photo has been removed and replaced by a flood deposit from the 15-Feb-95 flood.Photo from November 2000 shows the cumulative effect of at least 3 flash floods down Horse Creek between 1996and 2000. The low inset terrace has been completely removed and the bed elevation of Horse Creek has changedsignificantly. B. These photos indicate the change to the main exposure of YTa after one of the Horse Creek floods.
28
[K. Puseman, written communication]. Pedogenesis in this sequence had advanced to the pointof making stratigraphic analysis aside from the delineation of buried soil features largelyimpossible. However, in this case, the presence of the uppermost buried soil was the only criticalstratigraphic evidence needed to interpret the Holocene record.
In the framework of vertically accreting, progressively self-censoring deposits, the impact ofpedogenesis is potentially enhanced as the threshold increases because, in general, this results inprogressively longer periods of subaerial exposure, and progressively thinner deposits over time.Differentiation of individual flood deposits near the top of the YTa was not compromised bypedogenesis because the lateral extent of the exposure was great enough to trace contacts longdistances through disturbed and undisturbed zones, but interpretation of smaller exposures couldhave been more difficult.
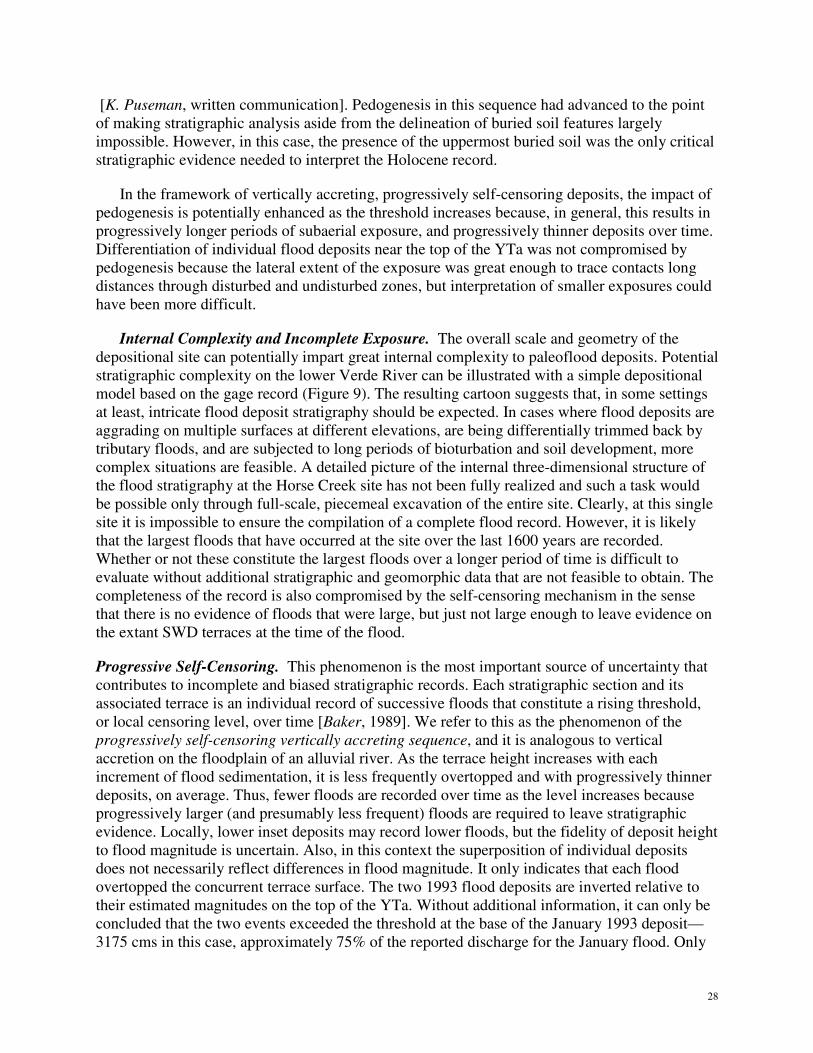
Internal Complexity and Incomplete Exposure. The overall scale and geometry of thedepositional site can potentially impart great internal complexity to paleoflood deposits. Potentialstratigraphic complexity on the lower Verde River can be illustrated with a simple depositionalmodel based on the gage record (Figure 9). The resulting cartoon suggests that, in some settingsat least, intricate flood deposit stratigraphy should be expected. In cases where flood deposits areaggrading on multiple surfaces at different elevations, are being differentially trimmed back bytributary floods, and are subjected to long periods of bioturbation and soil development, morecomplex situations are feasible. A detailed picture of the internal three-dimensional structure ofthe flood stratigraphy at the Horse Creek site has not been fully realized and such a task wouldbe possible only through full-scale, piecemeal excavation of the entire site. Clearly, at this singlesite it is impossible to ensure the compilation of a complete flood record. However, it is likelythat the largest floods that have occurred at the site over the last 1600 years are recorded.Whether or not these constitute the largest floods over a longer period of time is difficult toevaluate without additional stratigraphic and geomorphic data that are not feasible to obtain. Thecompleteness of the record is also compromised by the self-censoring mechanism in the sensethat there is no evidence of floods that were large, but just not large enough to leave evidence onthe extant SWD terraces at the time of the flood.
Progressive Self-Censoring. This phenomenon is the most important source of uncertainty thatcontributes to incomplete and biased stratigraphic records. Each stratigraphic section and itsassociated terrace is an individual record of successive floods that constitute a rising threshold,or local censoring level, over time [Baker, 1989]. We refer to this as the phenomenon of theprogressively self-censoring vertically accreting sequence, and it is analogous to verticalaccretion on the floodplain of an alluvial river. As the terrace height increases with eachincrement of flood sedimentation, it is less frequently overtopped and with progressively thinnerdeposits, on average. Thus, fewer floods are recorded over time as the level increases becauseprogressively larger (and presumably less frequent) floods are required to leave stratigraphicevidence. Locally, lower inset deposits may record lower floods, but the fidelity of deposit heightto flood magnitude is uncertain. Also, in this context the superposition of individual depositsdoes not necessarily reflect differences in flood magnitude. It only indicates that each floodovertopped the concurrent terrace surface. The two 1993 flood deposits are inverted relative totheir estimated magnitudes on the top of the YTa. Without additional information, it can only beconcluded that the two events exceeded the threshold at the base of the January 1993 deposit—3175 cms in this case, approximately 75% of the reported discharge for the January flood. Only
29
1891
pre-1891
?
1993a
1980a1938
1982
1927
1937
1932
1951
1972
1941
1970
1966
1969
1980b
1993c
1993b
1995a
1995b1978b1920
1916
19051978a
1000
2000
3000
Pe
ak
dis
cha
rge
(cm
s)
4000
Figure 9. Idealized stratigraphy from historical floods on the lower Verde River. Only floods in the 90th percentileof the partial duration series are shown (see Table 2). The schematic assumes that all floods above 1000 cms arerecorded, and no erosion occurs between floods.
in rare cases where multiple exposures of correlative deposits at different elevations can relativeflood magnitude be determined with confidence [c.f. Baker, 1989].
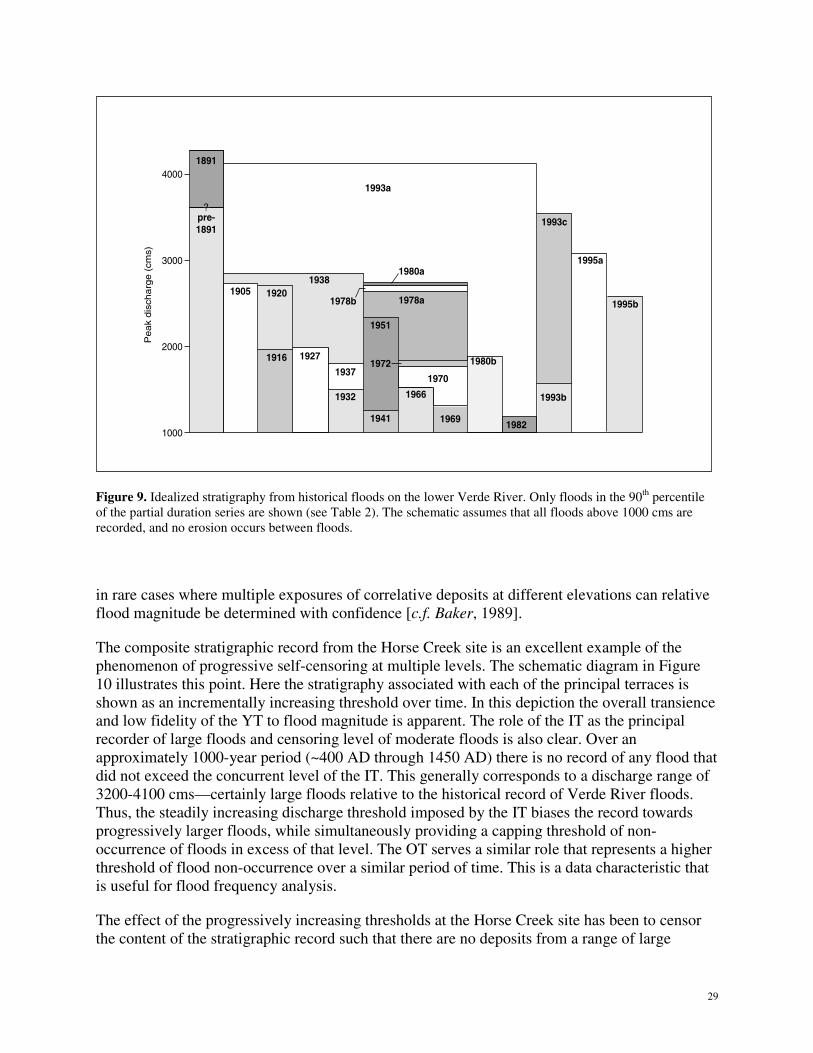
The composite stratigraphic record from the Horse Creek site is an excellent example of thephenomenon of progressive self-censoring at multiple levels. The schematic diagram in Figure10 illustrates this point. Here the stratigraphy associated with each of the principal terraces isshown as an incrementally increasing threshold over time. In this depiction the overall transienceand low fidelity of the YT to flood magnitude is apparent. The role of the IT as the principalrecorder of large floods and censoring level of moderate floods is also clear. Over anapproximately 1000-year period (~400 AD through 1450 AD) there is no record of any flood thatdid not exceed the concurrent level of the IT. This generally corresponds to a discharge range of3200-4100 cms—certainly large floods relative to the historical record of Verde River floods.Thus, the steadily increasing discharge threshold imposed by the IT biases the record towardsprogressively larger floods, while simultaneously providing a capping threshold of non-occurrence of floods in excess of that level. The OT serves a similar role that represents a higherthreshold of flood non-occurrence over a similar period of time. This is a data characteristic thatis useful for flood frequency analysis.
The effect of the progressively increasing thresholds at the Horse Creek site has been to censorthe content of the stratigraphic record such that there are no deposits from a range of large
30
flood discharges that may have occurred within a period of approximately 1000 years. Thefloods that have occurred within approximately the last 400 years have been recorded in the YTsequences, but with potentially poor fidelity to the associated flood magnitude. It is possible thatthe former circumstance could be interpreted as evidence for no floods as opposed to the equallylikely situation of no potential for flood deposit preservation; and the latter circumstance couldresult in significant underestimation of paleoflood discharges.
2000
1000
1900
1800
1700
1600
400
300
200
100
1500
500
1400
600
1300
700
1200
800
1100
900
Calendar year
Ele
vatio
na
bo
velo
cald
atu
m,
me
ters
95
94
93
92
91
90
89
88
87
Pe
ak
Disch
arg
e,
m3/s
4500
4000
3500
3000
2500
2000
1500
1000
H1/H2
H3H4
H5
H6
H6H10
H11
H12
H8
H8
H9
?
?
?
H2 onlap
2nd onlap
?
Figure 10. Schematic diagram of progressive self-censoring of flood stratigraphy at the Horse Creek site. Eachflood unit is expressed as an vertical increment along a continuous time scale. Dates of floods are based oninformation in Table 5. Each line represents a local censoring level associated with each flood-deposit terracesurface. No flood below the line is recorded on that particular surface. Discharges on the right Y-axis arebased on the rating curve derived from information shown in Fig. 7. Recent deposits that onlap the face of theOT are indicated but not used to develop the local censoring levels.
31
CONCLUSIONS
Our comprehensive paleoflood investigation on the lower Verde River, Arizona,demonstrates both the strengths and weaknesses of slack-water paleoflood hydrology as atechnique for improving our understanding of the frequency of large floods in bedrock riverenvironments. The greatest strength of this approach to paleoflood reconstruction is that it allowsfor the enumeration of individual floods that have occurred along the river over time scalessignificantly longer than the systematic record. The greatest weakness is the collective effect ofvarious physical processes, logistical circumstances, and methodological limitations that hamperthe ability to confidently compile complete and accurate tallies of paleofloods at a high level ofevent and temporal resolution.
We compiled a complete record of the largest floods that have occurred over the last 1600years. However, there are a variety of uncertainties that can combine to preclude confidentaccounting of all large floods that may have occurred during this period. Between 1600 BP to400 BP the record is incomplete for events with magnitudes less than the immediately precedingrecorded flood. Overall, the first 1200 years of record is incomplete for floods less than about3200 cms, based on the lowest censoring level imposed by the IT over that interval. The last 400years of record is more complete, but the overall fidelity of flood deposit elevation in the youngterraces to associated flood magnitude is low, and the vulnerability of the entire sequence toremoval by erosion is high.
Our study on the lower Verde River indicates that the most important uncertainty is thephenomenon of progressive self-censoring, an internal filtering process that results in a biasedand incomplete stratigraphic record in a predominantly vertically accreting depositionalenvironment. There are a variety of other processes that can also compromise the completenessof the paleoflood record. At the Horse Creek site we are confident that the largest floods over thelast ~1600 years are represented. However, the frequency of floods that were lower in stage thanlocal censoring levels at any given point in time cannot be known.
The value of fluvial paleoflood information for extending flood records in real time cannot beunderstated. It offers the only means to clarify the long-term context of short historical records. Itcan be a powerful component of flood-frequency analysis and can contribute to improving ourunderstanding of the linkages between regional climate and local extreme events [Redmond etal., this volume]. However, there are important and, arguably, inevitable sources of uncertaintythat compromise record completeness. More effective incorporation of paleoflood informationinto the realm of water resource management and applied hydrology is predicated on explicitlyrecognizing and addressing its limitations. Paleoenvironmental applications of paleofloodinformation should also focus on interpretation within the limits of event and temporal resolutionof typical paleoflood data sets and make allowances for alternative interpretations of the apparentabsence of stratigraphic evidence.
32
REFERENCES
Aldridge, B.N., and J.H. Eychaner, 1984, Floods of October 1977 in southern Arizona andMarch 1978 in central Arizona, U.S. Geol. Surv. Water-Supply Paper 2223, 143 pp.
Baker, V.R., 1987, Paleoflood hydrology and extraordinary flood events: J. Hydrol., v. 96, p. 79-99.
Baker, V.R., 1989, Magnitude and frequency of palaeofloods: in Floods: Hydrological,Sedimentological, and Geomorphological Implications, edited by K. Beven, and P. Carling,p. 171-183, John Wiley, New York.
Benson, L., and R.A. Darrow, 1981, Trees and Shrubs of the Southwestern Deserts: Tucson, TheUniversity of Arizona Press, 416 p., 3rd ed.
Blong, R.J., and R. Gillespie, 1978, Fluvially transported charcoal gives erroneous 14C ages forrecent deposits, Nature, 271, 739-741.
Chin, E.H., B.N. Aldridge, and R.J. Longfield, 1991, Floods of February 1980 in southernCalifornia and central Arizona, U.S. Geol. Surv. Prof. Pap. 1494, 126 pp..
Denlinger et al, in prep., Robust determination of stage and discharge: An example from anextreme flood on the Verde River in Arizona: American Geophysical Union PaleofloodVolume.
Dobyns, H.R., 1981, From fire to flood, Historic human destruction of Sonoran desert riverineoases: Socorro, New Mexico, Ballena Press, 222 p.
Ely, L.L., 1985, Reconstructing paleoflood hydrology with slack-water deposits: Verde River,Arizona: M.S. Thesis, Univ. Ariz., Dept. of Geosciences, 48 pp.
Ely, L.L., 1992, Large floods in the southwestern United States in relation to late Holoceneclimatic variations, [Ph.D. thesis]: Tucson, University of Arizona, 326 p.
Ely, L.L., 1997, Response of extreme floods in the southwestern United States to climaticvariations in the late Holocene, Geomorphology, 19, 175-201.
Ely, L.L., and Baker, V.R., 1985, Reconstructing paleoflood hydrology with slack-waterdeposits: Verde River, Arizona, Physical Geography, v. 6, pp. 103-126.
Ely, L.L., J.E. O’Connor, and V.R. Baker, 1988, Paleoflood hydrology of the Salt and Verderivers, central Arizona, in U.S. Committee on Large Dams, 8th Annual Lecture Series,Phoenix, Arizona, pp. 3.1-3.35.
Ely, L.L., Y. Enzel, and D.R. Cayan, 1994, Anomalous north Pacific atmospheric circulation andlarge winter floods in the southwestern United States, J. Climate, 7, 977-987.
Ely, L.L., Y. Enzel, V.R. Baker, and D.R. Cayan, 1993, A 5000-year record of extreme floodsand climate change in the southwestern United States: Science, 262, 410-412.
Engstrom, W.N., 1996, The California storm of 1862, Quat. Res., 46, 141-148.
Flinn, R.C., S. Archer, T.W. Boutton, and T. Harlan, 1994, Identification of annual rings in anarid-land woody plant, Prosopis Glandulosa, Ecology, 75, 850-853.
33
Fuller, J.E., Paleoflood hydrology of the alluvial Salt River, Tempe, Arizona, 1987: [MS Thesis]Dept. of Geosciences, University of Arizona, 70 p.
Garrett, J.M., and Gellenbeck, D.J., 1991, Basin characteristics and streamflow statistics inArizona as of 1989: U.S. Geological Survey Water-Resources Investigations Report 91-4041, 612 p.
Graybill, D.A.,1989, The reconstruction of prehistoric Salt River streamflow, in The 1982-1984Excavations at Las Colinas: Environment and Subsistence, by D.A. Graybill, D.A. Gregory,F.L. Nials, S.K. Fish, R.E. Gasser, C.H., Miksicek, and C.R. Szuter, pp. 25-38,Archaeological Series No. 162, v. 5, Arizona State Museum, University of Arizona, Tucson.
Hattingh, J., and P.K. Zawada, 1996, Relief peels in the study of palaeoflood slack-watersediments, Geomorphology, 16, 121-126.
Hirschboeck, K.K., 1985, Hydroclimatology of flow events in the Gila River Basin, central andsouthern Arizona: [Ph.D. thesis]: Tucson, University of Arizona, 335 pp.
House, P.K., 1993, The Arizona floods of January and February 1993: Arizona Geology, v. 23,n. 2, p. 1, 6-9.
House, P.K., and K.K. Hirschboeck, 1997, Hydroclimatological and paleohydrological context ofextreme winter flooding in Arizona, 1993, in Storm-induced Geologic Hazards: CaseHistories from the 1992-1993 Winter in Southern California and Arizona, ed. by R.A. Larsonand J.E. Slosson, pp. 1-24, Boulder, CO, Geological Society of America Reviews inEngineering Geology, v. 11.
House, P.K., P.A. Pearthree, and J.E. Fuller, 1995, Hydrological and paleohydrologicalassessment of the 1993 floods on the Verde River, central Arizona: Arizona GeologicalSurvey Open-File Report 95-20, 38 p.
Huckleberry, G.A., 1995, Archaeological implications of late-Holocene channel changes on theMiddle Gila River, Arizona: Geoarchaeology, v. 10, n. 3, p. 159-182.
Klawon, J.E., 1998, Paleoflood hydrology and historic flood analysis in the upper Verde Riverbasin, central Arizona: Arizona Geological Survey Open-File Report 98-5, 93 p.
Klawon, J.E., Levish, D.R., and O’Connel, D.R.H., 2000, Paleofloods and paleosols on the NorthPlatte River: Stratigraphic records of exceedance and nonexceedance: Geological Society ofAmerica Abstracts with Programs, v. 32, n. 7., p. A-509.
Kochel, R.C., and V.R. Baker, 1982, Paleoflood hydrology, Science, 215, 353-361.
Kochel, R.C., and V.R. Baker, 1988, Paleoflood analysis using slack-water deposits, in FloodGeomorphology, edited by V.R. Baker, R.C. Kochel, and P.C. Patton, pp. 357-376, JohnWiley, New York.
McCord, V.A.S., 1990, Augmenting flood frequency estimates using flood-scarred trees [Ph.D.thesis]: Tucson, University of Arizona, 182 pp.
O’Connor, J.E., and R. H. Webb, 1988, Hydraulic modeling for paleoflood analysis, in FloodGeomorphology, edited by V.R. Baker, R.C. Kochel, and P.C. Patton, pp. 393-402, JohnWiley, New York.
34
O'Connor, J.E., Fuller, J.E., and Baker, V.R., 1986, Late Holocene flooding within the Salt Riverbasin, central Arizona: Unpublished report to the Salt River Project, 84 pp.
Patterson, J.L., and W.P. Somers, 1966, Magnitude and frequency of floods in the United States,Part 9, Colorado River Basin, U.S. Geol. Svy. Water Supply Paper 1683.
Patton, P.C., V.R. Baker, and R.C. Kochel, 1979, Slack-water deposits: A geomorphic techniquefor the interpretation of fluvial paleohydrology, in Adjustments of the Fluvial System, ed. byD.P. Rhodes and G.P. Williams, Kendall / Hunt Pub. Co., Dubuque, Iowa, 225-253.
Pearthree, P.A., 1996, Historical geomorphology of the Verde River: Arizona Geological SurveyOpen-File Report 96-13, 26 p..
Pohl, M., 1995, Radiocarbon ages on organics from piedmont alluvium, Ajo Mountains,Arizona, Phys. Geog., 16, 339-353.
Pope, G.L., P.D. Rigas, and C.F. Smith, 1998, Statistical summaries of streamflow data andcharacteristics of drainage basins for selected streamflow-gaging stations in Arizona throughwater year 1996: U.S. Geological Survey Water Resource Investigations Report 98-4225,907 pp.
Smith, G.A., 1993, Missoula flood dynamics and magnitudes inferred from sedimentology ofslack-water deposits on the Columbia Plateau, Washington, Geol. Soc. Am. Bull., 105, p. 77-100.
Stuiver, M., and P.J. Reimer, 1993, Extended 14C database and revised CALIB radiocarboncalibration program (ver. 4.1), Radiocarbon, 35, 215-230.
Stuiver, M., P.J. Reimer, E. Bard, J.W. Beck, G.S. Burr, K.A. Hughen, B. Kromer, F.G.McCormac, J. v. d. Plicht, and M. Spurk, 1998, INTCAL98 Radiocarbon age calibration24,000 - 0 cal BP., Radiocarbon, 40, 1041-1083.
Sutton, M.Q. and Arkush, B.S., 1998, Archaeological Laboratory Methods, Kendall/Hunt Pub.Co., Dubuque, IA, 381 pp.
Topping, D.J., D.M. Rubin, J.M. Nelson, P.J. Kinzel III, and J.P. Bennett, 1999, Linkagebetween grain-size evolution and sediment depletion during Colorado River floods, in TheControlled Flood in Grand Canyon, ed. R.H. Webb, J.C. Schmidt, G.R. Marzolf, and R.A.Valdez, pp. 71-98, Amer. Geophys. Union Geophys. Mono. Ser., 110, Washington, D.C.
Van West, C.R., and J.H. Altschul, 1997, Environmental variability and agricultural economicsalong the Lower Verde River, A.D. 750-1450, in Vanishing River, Landscapes and Lives ofthe Lower Verde Valley: The Lower Verde Archaeological Project, Overview, Synthesis, andConclusions, edited by S.M. Whittlesey, R. Ciolek-Torrello, and J.H. Altschul, Chapter 9, pp.337-392, SRI Press, Tucson, Arizona.
Webb, R.H., and J.L. Betancourt, 1992, Climatic variability and flood frequency of the SantaCruz River, Pima County, Arizona: U.S Geological Survey Water-Supply Paper 2379, 40 p.