Approaches to Assessment of Impacts and Vulnerability to Climate ...
43
Approaches to Assessment of Impacts and Vulnerability to Climate Change and Adaptation Options Hideki Kanamaru, Ph.D. Natural Resources Officer (Climate Change) Roberto C. Sandoval Jr., Ph.D. Climate Change and Food Security Specialist
Transcript of Approaches to Assessment of Impacts and Vulnerability to Climate ...

Approaches to Assessment of
Impacts and Vulnerability to Climate
Change and Adaptation Options
Hideki Kanamaru, Ph.D. Natural Resources Officer (Climate Change)
Roberto C. Sandoval Jr., Ph.D. Climate Change and Food Security Specialist

Outline
I. Two types of assessments to support climate change adaptation
II. Climate impact and vulnerability assessment – two vulnerability frameworks
III. Categorizing methodologies and methods under two vulnerability frameworks
IV. Overview: Designing climate impact and vulnerability assessment
V. Overview: Climate change adaptation options assessment
Examples
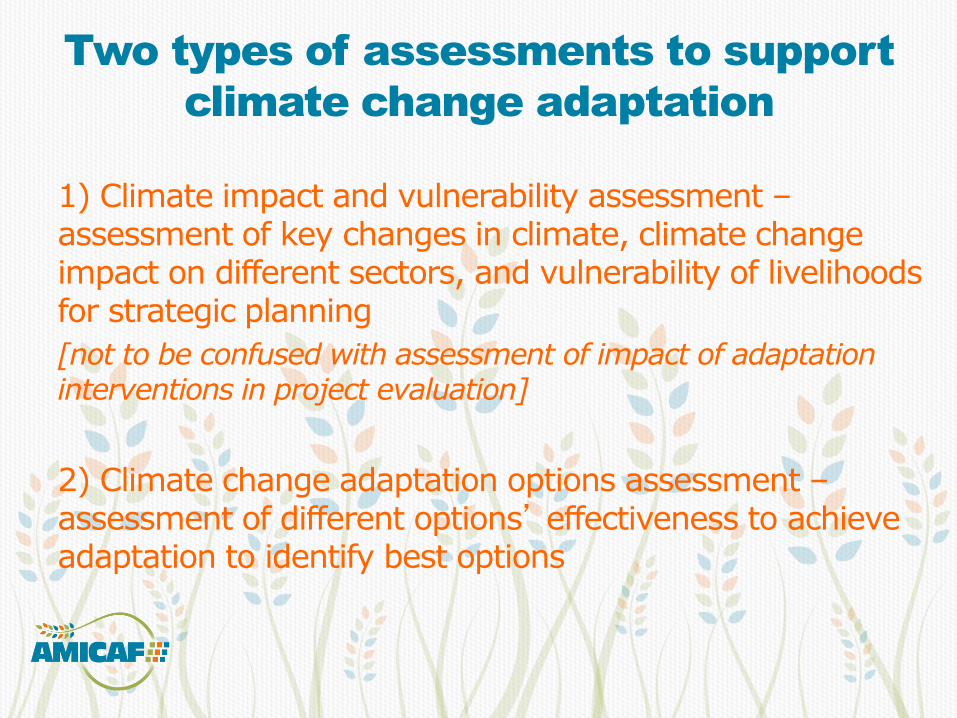
Two types of assessments to support
climate change adaptation
1) Climate impact and vulnerability assessment – assessment of key changes in climate, climate change impact on different sectors, and vulnerability of livelihoods for strategic planning
[not to be confused with assessment of impact of adaptation interventions in project evaluation]
2) Climate change adaptation options assessment – assessment of different options’ effectiveness to achieve adaptation to identify best options
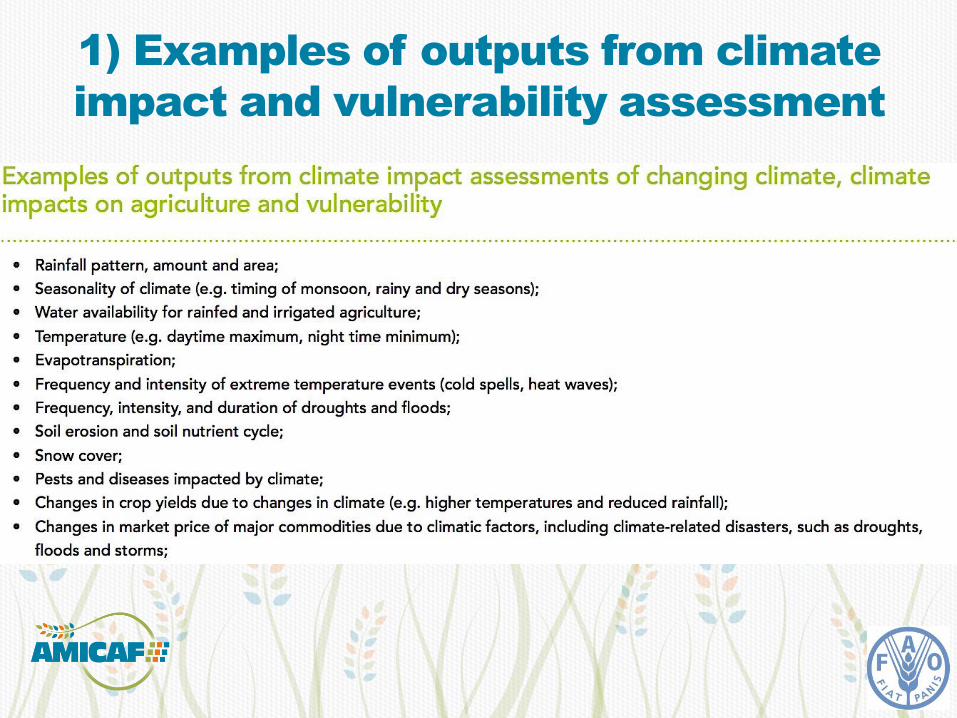
1) Examples of outputs from climate
impact and vulnerability assessment

2) Examples of assessed benefits of
climate change adaptation options

1) Climate impact and vulnerability
assessment – two vulnerability
frameworks
Outcome vulnerability
Traditional concept in climate change work
Top-down approach
Context vulnerability
Emerging concept in climate change work
Bottom-up approach
Vulnerability of social-ecological systems is determined by multiple factors and processes
Climate change is treated as one of the threats

Outcome vulnerability

Contextual vulnerability

Categorizing methodologies and methods under two
vulnerability frameworks

Designing climate impact and
vulnerability assessments
Literature review
Identification of stakeholders
Assessment of information needs of stakeholders
Evaluation of role and capacity of stakeholders
Design of assessments, including agreement of adaptation objectives by stakeholders

What is your “adaptation” goal?
There are different views on how to define “adaptation” to climate change (e.g. DRR and CCA links)
What constitutes “successful adaptation” to climate change? (e.g. being to articulate contributions to resilience)
Need to define adaptation goals with the wide participation of different stakeholders
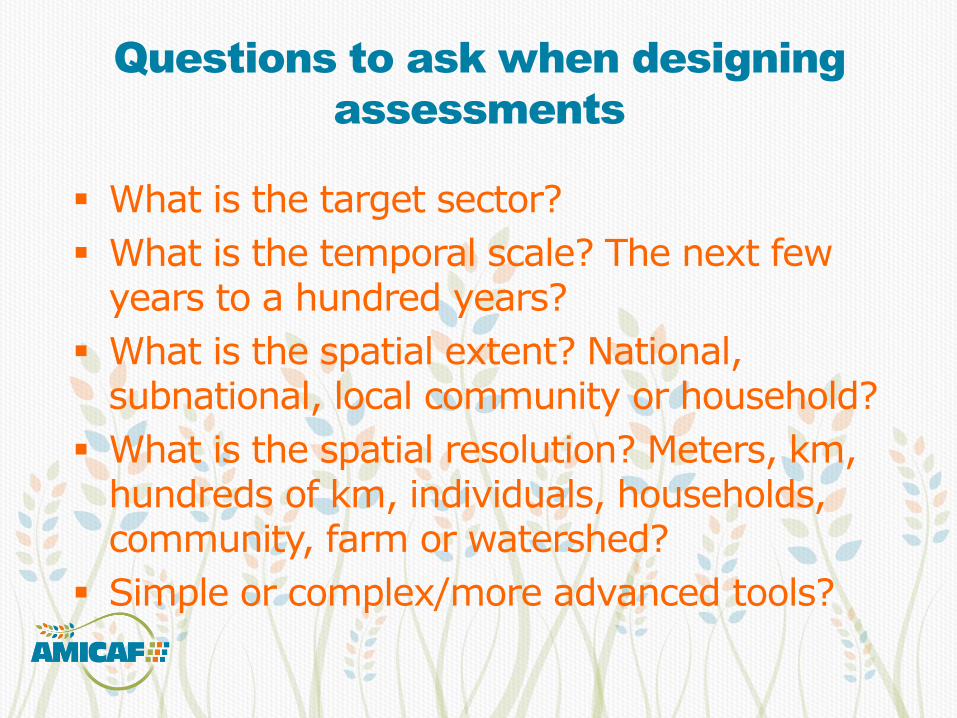
Questions to ask when designing
assessments
What is the target sector?
What is the temporal scale? The next few years to a hundred years?
What is the spatial extent? National, subnational, local community or household?
What is the spatial resolution? Meters, km, hundreds of km, individuals, households, community, farm or watershed?
Simple or complex/more advanced tools?

“Categorization is not so clear-cut in reality”
Example 1:
FAO’s AMICAF Framework

AMICAF Framework: Addressing the Linkage
Between Climate Change and Food Security
Impacts of Climate Change on Agriculture
(Step1)
Food Insecurity Vulnerability
Analysis at household level (Step2)
Livelihood Adaptation to
Climate Change (Step3)
Institutional Analysis and Awareness Raising (Step4)
Global Guideline for Implementation in other
countries (Global delivery)

Step 1 Impacts of climate
change on agriculture
MOSAICC – Modeling System for Agricultural Impacts of Climate Change
Multiple impact models (Climate downscaling, Crops, Hydrology, Economy) in one package
Software plus training
Newly developed Partial Equilibrium Agricultural Market Model, named PAM (Provincial Agricultural Model), is used in addition to MOSAICC’s climate downscaling, crop and hydrology modules.

Step 1: Impacts of climate change
on agriculture
MOSAICC has 4 components and uses several tools:
1. CLIMATE - facilitates the preparation of statistically downscaled climate data using an adaptation of a portal developed with the EU ENSEMBLES project.
2. HYDROLOGY - estimates water resources under future climate conditions and uses STREAM, a grid-based precipitation run-off model, to simulate the discharge rate in large catchment areas.

Step 1: Impacts of climate change
on agriculture
3. CROPS - simulates crop yields under future climate change and technological progress scenarios. It uses WABAL (crop specific water balance model), the industrial version of FAO’s AgroMetShell.
4. ECONOMY - makes use of a Provincial Agricultural Market (PAM) Model to evaluate the economic impacts of future crop yields and water resources projections.

Menu containing containing the different functions/tools of MOSAICC including
the built-in data interpolation tools (e.g. Kriging, AURELHY)

MOSAICC with Agricultural
Market Model
Climate
projections
downscaling Historical
weather
records
Downscaled
Climate
projections
Hydrological
Model
Crop growth
Simulation
IPCC GCM
Low resolution
projections
Historical
discharge
records
Water
availability
for irrigation
Historical
water use
statistics
Historical
yield
records
Yield
projections
Crop
parameters
Soil data
Technology
trend
scenarios
Soil and
Land use
data
Dam data
Provincial Agricultural Market Impact
Step2 (Food Insecurity Vulnerability Analysis)
Provincial Agricultural Model
(PAM)

Step 1 Impacts of climate change on agriculture
Downscaling products
Downscaling of reanalysis for 1979-2010. Reproduces daily historical weather variation at the local level. For use in the calibration of crop/hydrology models.
Downscaling of (free-running) GCM for the twentieth century (20C3M) for 1971-2000. For use with the calibrated model to establish current baseline.
Downscaling of GCM for future periods 2011-2050 (up to end of 21st century possible). For use by the calibrated model as input to make projections.
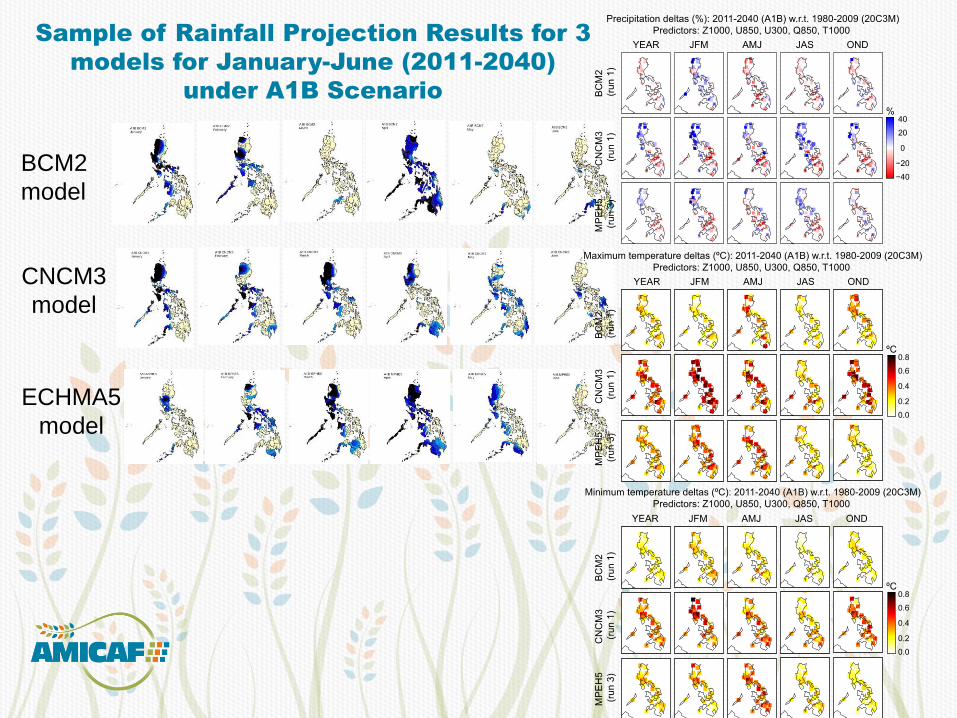
Sample of Rainfall Projection Results for 3
models for January-June (2011-2040)
under A1B Scenario
BCM2
model
CNCM3
model
ECHMA5
model
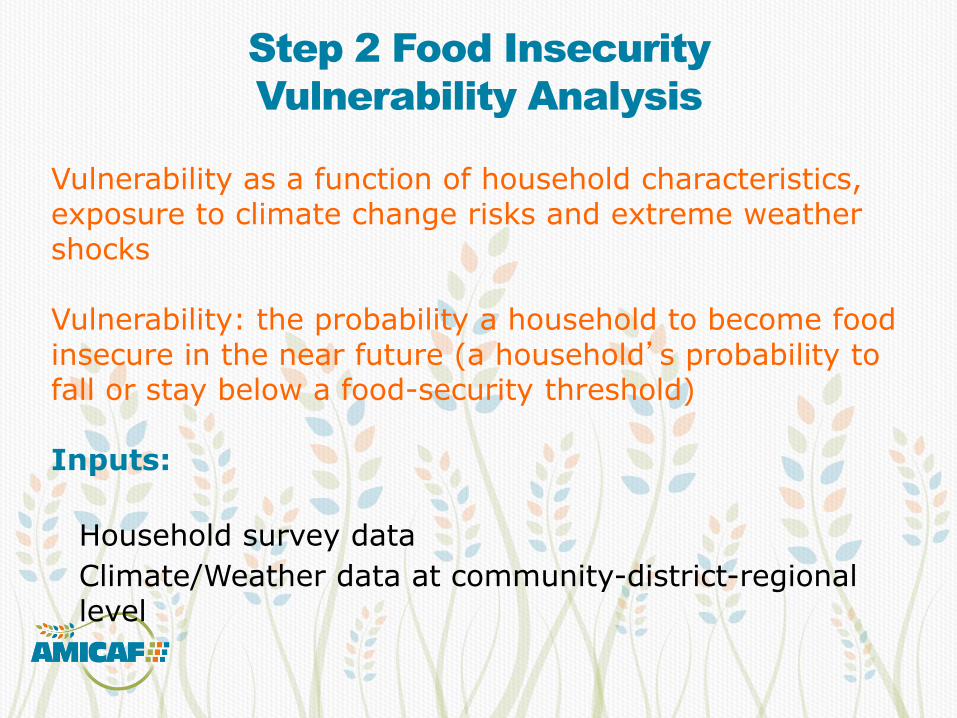
Step 2 Food Insecurity
Vulnerability Analysis
Vulnerability as a function of household characteristics, exposure to climate change risks and extreme weather shocks Vulnerability: the probability a household to become food insecure in the near future (a household’s probability to fall or stay below a food-security threshold) Inputs:
Household survey data
Climate/Weather data at community-district-regional level

Model:
Direct impact of climate shocks to farm productivity (and caloric intake?) and then to food insecurity
Outputs:
Channels of transmission of shocks to food insecurity are identified
Profile of vulnerable population groups (e.g. chronically vs. temporarily food insecure)
Exploring the relative efficiency of different policy tools in reducing vulnerability
Step 2 Food Insecurity
Vulnerability Analysis

Methodological framework on vulnerability to food insecurity from climate change
High-resolution CC projections
Detailed profiling of vulnerable households
groups
Policy recommendations for the design and implementation of
targeted policy interventions
Climate Downscaling
Analysis of vulnerability to food insecurity
Analysis of implications at
policy level
Addressing the linkages between CC and vulnerability to food insecurity
Climate change: enters the model through the impacts that temperature and precipitation changes (from Step 1) have on income (value of land productivity) and food consumption (expenditure); and caloric intake

Data gathering (from NSO, CBMS, FNRI) for the FAO econometrics model using national household datasets (using income expenditures from FIES-NSO, calorie intake from FNRI) for national analysis
Variety of socio-economic data at smaller administrative units (5 provinces using CBMS dataset) and with Step 3 pilot provinces (Cam Sur and Surigao Norte) for community-level (municipal/barangay) VA using CBMS dataset
Current work on
Vulnerability Analysis to food insecurity
Step 3 Livelihood Adaptation to
Climate Change
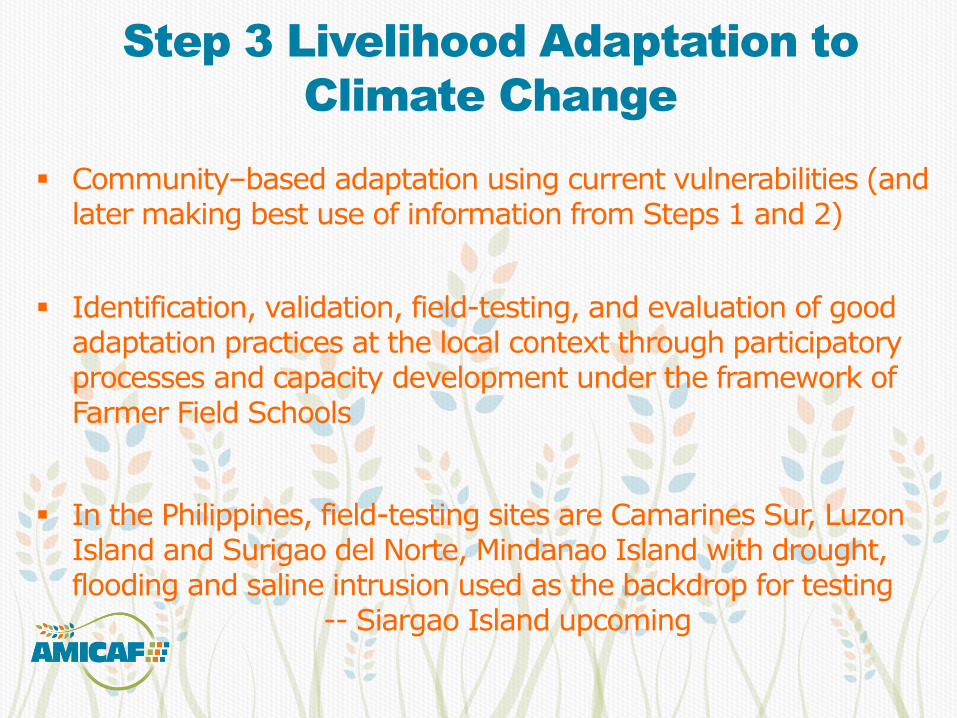
Community–based adaptation using current vulnerabilities (and later making best use of information from Steps 1 and 2)
Identification, validation, field-testing, and evaluation of good adaptation practices at the local context through participatory processes and capacity development under the framework of Farmer Field Schools
In the Philippines, field-testing sites are Camarines Sur, Luzon Island and Surigao del Norte, Mindanao Island with drought, flooding and saline intrusion used as the backdrop for testing -- Siargao Island upcoming

Example 2:
Enhanced CCA Capacity of
Communities in Contiguous Fragile
Ecosystems

Enhanced Climate Change
Adaptation Capacity of
Communities in Contiguous Fragile
Ecosystems in the Cordilleras
The project aimed to: (1) develop inter-sectoral, rights- based, and gender-friendly adaptation approaches, including “no regret” options, in contiguous mountain/forest-lowland agriculture ecosystems and (2) test innovative adaptation measures/technologies for agriculture, water/watershed management including biodiversity conservation.

The demonstration sites were located in the low, middle, and high elevation
areas of Benguet and Ifugao representing agriculture and forest ecosystems.
Benguet is a representative site for vegetable-based agriculture.
Ifugao is a representative for rice-based agriculture.

Example 3:
FAO’s Regional Rice model under
Climate Change

FAO’s Regional Rice model Under Climate Change
AMICAF (Existing)MOSAICC (Existing)
Regional Rice Markets (Newly develop)
Downscaled Climate
Projection Model
Crop Yield Projection
model
Hydrological
Model
Provincial Agricultural Market Model (PAM)
Provincial agricultural markets (79 provinces and 2 Cities)
The Phillipines Market (Sub-national level)
Thailand (Sub-national level)
Other Asean countries (Lao PDR, Indonesia, Malaysia, Vietnam,
Cambodia and Myanmar)(National level)
China, Japan, Korea, USA, EU27, India and other world (National level)
International Rice Price
(Market Equilibrium Price)
World Agriculal
commodities (except for rice) , Livestock market projection (From AGLINK-COSIMO)
(Existing)
Climate change impacts on rice yield in Thailand
(RAP/ UC Berkley)
Rice yield projection (sub-natiopnal level)
Future climate change Impacts (BCM2, CNCM3 and ECHAM5; A1B and A2 scenario)

2) Climate change adaptation options
assessment
Builds on climate impact and vulnerability assessment
Assessment examines the extent to which different adaptation measures may achieve the adaptation objective
The result of assessment helps practitioners identify effective adaptation options

Example 1:
Two approaches for climate change adaptation
options field-testing and assessments
i) Participatory
Action Research
ii) Climate-Smart
Farmer Field
Schools

Participatory Action Research
Enhanced Climate Change Adaptation
Capacity of Communities in Contiguous
Fragile Ecosystems in the Cordilleras

Develo
p v
iable
adapta
tion o
ptions
Collate local, introduced and improved
adaptation options
Synthesize into potentially suitable adaptation
options for location specific conditions
Scientific validation of adaptation options
Local prioritization/selection of adaptation
options for field testing
Vuln
era
bility
Assessm
ent
Field-testing; Monitoring and evaluation;
with consideration to both climate-
related risks and hazards
Seasonal Assessment
Stakeholder involvement
at every step/stage
Considerations for launching community-based adaptation and
disaster reduction processes
Local working groups

ii) Climate-Smart Farmer Field Schools
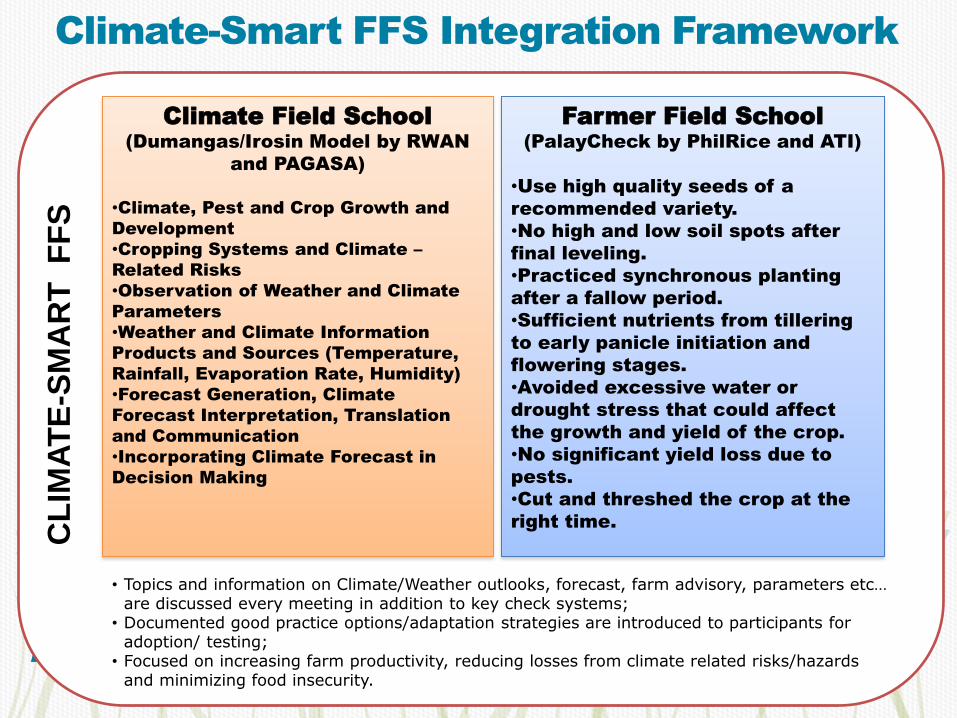
Climate-Smart FFS Integration Framework
Climate Field School
(Dumangas/Irosin Model by RWAN
and PAGASA)
•Climate, Pest and Crop Growth and
Development
•Cropping Systems and Climate –
Related Risks
•Observation of Weather and Climate
Parameters
•Weather and Climate Information
Products and Sources (Temperature,
Rainfall, Evaporation Rate, Humidity)
•Forecast Generation, Climate
Forecast Interpretation, Translation
and Communication
•Incorporating Climate Forecast in
Decision Making
Farmer Field School
(PalayCheck by PhilRice and ATI)
•Use high quality seeds of a
recommended variety.
•No high and low soil spots after
final leveling.
•Practiced synchronous planting
after a fallow period.
•Sufficient nutrients from tillering
to early panicle initiation and
flowering stages.
•Avoided excessive water or
drought stress that could affect
the growth and yield of the crop.
•No significant yield loss due to
pests.
•Cut and threshed the crop at the
right time.
CL
IMA
TE
-SM
AR
T
FF
S
• Topics and information on Climate/Weather outlooks, forecast, farm advisory, parameters etc… are discussed every meeting in addition to key check systems;
• Documented good practice options/adaptation strategies are introduced to participants for adoption/ testing;
• Focused on increasing farm productivity, reducing losses from climate related risks/hazards and minimizing food insecurity.

Activities and materials developed under the
Climate-Smart FFS
A Facilitator’s Guide for AEWs in the conduct of CS-FFS is being finalized
A set of flipcharts on climate information, CCA/DRR and examples of good practice options is developed for AEWs doing CSFFS
Seasonal Climate Outlook and Advisory Bulletin is prepared at start of season
Conduct of CCA options field-testing

Example 2:
FAO’s AMICAF and
RRI Policy
Simulations under
Climate Change

Step1; Regional econometric simulation of Rice under climate change in the Asian region
Step2; Conduct policy simulation to alleviate climate risks of rice production systems and rice markets
Final Goal; Policy Recommendation to alleviate risks of rice production systems and rice markets (include price volatility)
The concept of the regional economic simulation and policy simulation
FAO NRC, FAO Philippines and partners
FAO RAP and NRC

Building RRMCC
Policy Simulation (Regional level)
Technical Report
Policy Simulation (The Philippines, National level)
Detect Policy variables (Regional level)
Detect Policy variables (The Philippines, National level)
Technical Report (Mid-term and Final)
Policy Recommendation to alleviate risks of rice production systems and rice markets
AMICAF (Step4)


Thank you for your attention
Acknowledgement
Tatsuji Koizumi, Ph.D. (FAO Rome) Karfakis Panagiotis (FAO Rome)
Stephan Bass, Ph.D. (FAO Rome) Eulito Bautista, Ph.D. (FAO Phi)