APPRAISAL REPORT - images.bizbuysell.com
223
APPRAISAL REPORT APPRAISAL OF A 2,400-Square-Foot Industrial Building Located at 1961 Whitney Mesa Drive Henderson, Nevada 89014 Owner of Record: County Funeral Services, LLC APN: 161-32-712-013 PREPARED FOR Clark County Credit Union c/o Mr. John Gentile 87 E. Lake Mead Parkway Henderson, Nevada 89015 PREPARED BY Luke J. Adamo, MAI Britton-Adamo Group/ROI Appraisal 55 Gibson Road, Suite 104 Henderson, Nevada 89012 Phone: 702-558-2144 Fax: 702-558-9933 File # 20-089 DATE OF “AS IS” VALUATION September 25, 2020
Transcript of APPRAISAL REPORT - images.bizbuysell.com

APPRAISAL REPORT
APPRAISAL OF
A 2,400-Square-Foot Industrial Building
Located at 1961 Whitney Mesa Drive
Henderson, Nevada 89014
Owner of Record: County Funeral Services, LLC
APN: 161-32-712-013
PREPARED FOR
Clark County Credit Union
c/o Mr. John Gentile
87 E. Lake Mead Parkway
Henderson, Nevada 89015
PREPARED BY
Luke J. Adamo, MAI
Britton-Adamo Group/ROI Appraisal
55 Gibson Road, Suite 104
Henderson, Nevada 89012 Phone: 702-558-2144 Fax: 702-558-9933
File # 20-089
DATE OF “AS IS” VALUATION
September 25, 2020

ROI Appraisal BBRRIITTTTOONN--AADDAAMMOO GGRROOUUPP
RR EE AA LL EE SS TT AA TT EE AA PP PP RR AA II SS EE RR SS && CC OO NN SS UU LL TT AA NN TT SS
55 South G ibson Road • Su i te 104 • Henderson, NV 89012
Phone 702.558.2144 • Fax 702.558.9933
September 29, 2020
Clark County Credit Union
c/o Mr. John Gentile
87 E. Lake Mead Parkway
Henderson, Nevada 89015
RE: A 2,400-square-foot industrial building located at 1961 Whitney Mesa Drive, Henderson,
Nevada 89014
Owner of Record: County Funeral Services, LLC
APN: 161-32-712-013
To Whom It May Concern:
As you requested, I have completed an appraisal of the above referenced property. The subject
property consists of a single-tenant, industrial building, located at 1961 Whitney Mesa Drive,
Henderson, Nevada 89014. The subject improvements consist of 2,400 square feet of total
building area, containing approximately 480 square feet of one-story office space and 1,920
square feet of warehouse space, indicating an office space ratio of roughly 20%. The subject is
situated on a 0.16-acre site located within the interior of the Green Valley Industrial Park, along the
south side of Whitney Mesa Drive, east of Mountain Vista Street, in the southeast portion of the
Las Vegas Valley, in the City of Henderson, Clark County, Nevada. The subject was constructed
in 2006 and is in an overall good condition for its age.
The subject is currently being operated as a crematorium and includes specific built-in
equipment for the business operation. The equipment is separately identified and valued within
the appraisal. The property is fully described in the attached report, which contains the data and
analysis from which the value estimates were formed.
The purpose of this appraisal is to estimate the market value of the subject property based upon the
following valuation scenario:
• Market Value of the Real Estate – “As Is” – fee simple interest
• Fair Market Value in Continued Use of the Equipment – “As Is” – fee simple interest
The client of this appraisal is Clark County Credit Union. The intended user of this appraisal is
Clark County Credit Union, the Small Business Administration and Nevada State Development
Corporation. The intended use of this appraisal is for loan underwriting and/or credit decisions.
The use of the appraisal, or any information contained herein, by any other party other than the
stated client, or for any other use than the stated intended use, is considered unauthorized and is

55 South G ibson Road • Su i te 104 • Henderson, NV 89012
Phone 702.558 .2144 • Fax 702.558.9933
prohibited. The appraisers and the appraisal firm will assume no responsibility for the results
from the unauthorized use of this report or the contents herein.
This appraisal has been prepared to comply with the Financial Institutions Reform, Recovery and
Enforcement Act of 1989 (FIRREA), the Uniform Standards of Professional Appraisal Practice
(USPAP), as promulgated by the Appraisal Standards Board and the Office of the Comptroller of
Currency, and Clark County Credit Union appraisal requirements. This report has been prepared
in an Appraisal Report format, as set forth under Standards Rule 2-2(a) of USPAP. The depth of
discussion contained in the report is specific to the needs of the client and for the intended use
stated herein.
After considering all of the available facts and subject to the underlying assumptions and limiting
conditions contained herein, it is our opinion that the market values in the subject, as of
September 25, 2020 are:
Component Market Value
Real Estate – “As Is” – fee simple interest $430,000
Continued Use of the Equipment – “As Is” – fee simple interest $100,000
To determine actual mechanical condition of the equipment is outside of our expertise and the
scope of this assignment. The equipment appeared to be in functional and good condition. If it is
the client’s desire to verify the physical condition and/or needed repairs of the subject
equipment, the client should consult a qualified mechanic/technician.
The equipment value is for business personal property only and exclude consideration of real
estate or goodwill, and it is assumed there are no hidden defects which are not discernible from a
visual inspection and which could affect value. The owner is further assumed to have fee simple
ownership of the various appraised items, which are appraised assuming a clear and marketable
title.
The exposure time associated with the value conclusion is estimated at 12 months. The
estimated marketing time for the subject, as of the date of value, is 12 months.
55 South G ibson Road • Su i te 104 • Henderson, NV 89012
Phone 702.558 .2144 • Fax 702.558.9933
Thank you for giving us the opportunity to be of service to you in this important matter. If you
have any questions regarding the attached appraisal report, or require further assistance, please
do not hesitate to call our office at 702-558-2144.
Sincerely,
Luke J. Adamo, MAI
Certified General Appraiser #07352
State of Nevada

55 South G ibson Road • Su i te 104 • Henderson, NV 89012
Phone 702.558 .2144 • Fax 702.558.9933
COVID-19 Disclaimer
As of the date of this appraisal, the world is being significantly affected by COVID-19, also
known as the coronavirus. Reports are that this virus has obviously affected all aspects of the
real estate market. Specifically, there are less sales as potential buyers and brokers cannot
inspect properties and the majority of real estate professionals are working remotely from their
homes. According to CoStar as of March 15, 2020, “Early signs are emerging of a potential
slowdown in U.S. commercial real estate sales from the impact of the coronavirus pandemic. For
the three-week period following Feb. 21, when stock markets first began retreating from historic
highs, the pace of commercial property sales was about half what it was same three weeks a year
ago, according to CoStar data. Multifamily property sales were down about 58%. Industrial sales
sank 63%, retail declined 61% and hospitality showed a 37% drop. The one relative bright spot
was office property sales, which were only off slightly by 4.4%.”
This is obviously one of the most significant economic events in history and the fall out is
difficult to measure for the next few months. Never before has the Governor of the State of
Nevada ordered all casinos and non-essential businesses to close. These closures started on
March 18, 2020. Although phased reopening has begun, this has already lead to significant
layoffs, which will undoubtedly result in missed mortgage payments and other financial damage
to the local economy. Based on the current market data and the recent historical operation of the
subject, the opinion of the market value in this appraisal is valid. However, this pandemic could
cause this opinion of value to change once the effects of the market conditions are more known,
which could be at any time.
The positive aspect of this crisis is that interest rates have been significantly lowered which is
leading to an increase in the refinancing of real estate. In the first week of March, Treasury
yields on some bonds fell to their lowest level since 2001 and the Federal Reserve took the rare
action of making an emergency cut to interest rates to support the market. When Treasury yields
fall, banks charge lower interest rates for mortgages. These rates have really fallen since the first
of March 2020. On top of collapsing Treasury yields, the Federal Reserve announced a rare
emergency rate cut in response to concern over the effect of the rapidly spreading coronavirus on
global growth. They announced a 50-basis point reduction in the target rate on March 3, 2020.
According to the Mortgage Bankers Association (MBA), their Refinance Index increased 26%
on the second week of March from the previous week before much of the capital markets’
turmoil. “The 30-year fixed rate mortgage dropped to its lowest level in more than seven years
last week, amidst increasing concerns regarding the economic impact from the spread of the
coronavirus, as well as the tremendous financial market volatility,” Mike Fratantoni, MBA's
senior vice president and chief economist, said in a statement. “Given the further drop in
Treasury rates this week, we expect refinance activity will increase even more until fears subside
and rates stabilize.” Although these refinance statistics are more reflective of the residential

55 South G ibson Road • Su i te 104 • Henderson, NV 89012
Phone 702.558 .2144 • Fax 702.558.9933
mortgage industry, the lower interest rates will also lead to the refinancing of commercial real
estate mortgages.
A historical analysis or real estate prices due to catastrophic economic events indicates prices
will likely decrease. The great recession caused by the sub-prime lending crises that took hold in
2008 and continued into 2011. The charts below illustrate industrial building prices for the Las
Vegas area.
The price decline in 2008 at the start of the great recession was far greater, dropping over 70%
from 3rd Quarter 2007 to 3rd Quarter 2010, and remaining stagnant through 2013. As indicated in
the table above, according to CoStar Analytics, the anticipation is for declines in property values
of nearly 20% over the next year with an equivalent recovery over the following year.
There is great debate about how the Covid-19 Pandemic will impact commercial real estate
prices. To date there has been nominal data to indicate whether prices are decreasing, as many
sellers have pulled their listings off the market and most buyers remain sidelined to determine
the fallout from lost employment and shuttered small businesses.
A number of brokers in the Las Vegas market area were consulted over the previous month in
regard to the impact of the current market conditions with consideration given to COVID-19.
Although there is limited comparable data to develop a specific adjustment, there is a generally
consensus of some negative impacts to commercial real estate. We are aware of transactions that
have been renegotiated a slightly lower rates of 5%-10%, rate reductions by property managers

55 South G ibson Road • Su i te 104 • Henderson, NV 89012
Phone 702.558 .2144 • Fax 702.558.9933
as a concession to existing tenants of 5%, and deferred rent payments. These factors were
considered in various components within the valuation.
While this appraisal reports an exposure time opinion, marketing times may increase due to the
overall uncertainty in the market at this time due to market participants putting buying/selling
plans on hold until a more clear picture of the extent of the impacts of the virus is determined.
The few transactions that have closed, have yet to show any clear impact. A recent article
published in Market Watch reports delinquencies on commercial mortgage-backed securities
(CMBS), which are loans on malls, skyscrapers, apartments, offices and other property types
packaged into bond deals, stood at 2.57% in March, far lower than their 10.06% peak in July
2012 in the wake of the global financial crisis, according to Moody’s Investors Service’s latest
tally.
But those figures also don’t fully capture the economic disruptions caused by the coronavirus
pandemic, Moody’s analysts warned, adding that property-level “cash-flow stress, particularly
across hotels and retail properties,” will trigger more defaults. Much, naturally, will hinge on
how many borrowers struggle to stay current on their debts in the coming months, if property
loan defaults spike and whether financing conditions start to thaw after freezing up last month.
Even recent positive developments, including talk of daily life eventually resuming, come with
the caveat that the pandemic will leave scars. There are relief efforts for commercial property
owners, which could benefit from some of the Federal Reserve’s up-to-$2.3 trillion in emergency
facilities to keep credit flowing in financial markets. In April 2020, the Fed expanded its reach
to include older commercial mortgage-backed securities, which provided a boost to secondary
trading after liquidity dried up in March. But unlike the Fed’s broad backstop of corporate debt,
new CMBS issuance remains outside of its reach, casting a shadow over the more-than-$60
billion of debt that borrowers will need to refinance through 2022, per Cantor Fitzgerald
estimates.
In conclusion, it is probable property values will decrease in the short term while the economy
re-opens. To date, current data available is not showing any clear downward pressure with
limited inventory in the subject’s property type; however, market fundamentals (increased
unemployment, business closures, loan defaults), will eventually take hold and negatively impact
property values.

Britton-Adamo Group/ROI Appraisal
File Number 20-089
T A B L E O F C O N T E N T S
EXECUTIVE SUMMARY .......................................................................................................... 1
SUBJECT PHOTOGRAPHS ...................................................................................................... 4
INTRODUCTION......................................................................................................................... 8
N E I G H B O R H O O D D E S C R I P T I O N ........................................................................ 14
INDUSTRIAL MARKET OVERVIEW ................................................................................... 29
PROPERTY TAXES AND ASSESSOR’S VALUES .............................................................. 39
SITE DESCRIPTION ................................................................................................................. 42
DESCRIPTION OF IMPROVEMENTS .................................................................................. 45
HIGHEST AND BEST USE ANALYSIS ................................................................................. 48
METHOD OF VALUATION .................................................................................................... 56
SALES COMPARISON APPROACH ..................................................................................... 57
INCOME CAPITALIZATION APPROACH .......................................................................... 74
RECONCILIATION .................................................................................................................. 88
INSURABLE VALUE ................................................................................................................ 91
VALUATION OF EQUIPMENT .............................................................................................. 92
VALUATION ANALYSIS ....................................................................................................... 100
ASSUMPTIONS AND LIMITING CONDITIONS .............................................................. 102
CERTIFICATION .................................................................................................................... 107
ADDENDA
Engagement Letter
Subject Property Information
CoStar Analytics
Definitions
Qualifications of the Appraiser

Britton-Adamo Group/ROI Appraisal
File Number 20-086 1
E X E C U T I V E S U M M A R Y
Real Estate
Property Identification: A single-tenant, free standing industrial building located at 1961
Whitney Mesa Drive, Henderson, Nevada 89014
Assessor Parcel Number: 161-32-712-013
Site Size: 0.16 acres; 7,000 square feet
Building Area: Office – 480 sf
Warehouse – 1,920 sf
Total - 2,400 sf
Office Build-Out: 20%
Number of Units: 1
Occupancy 100% Owner-Occupied
Year Built: 2006
Remaining Economic Life: 35 years
Census Tract: 5101
Zoning: IL, Limited Industry District (Henderson)
Land Use Designation: Commercial (Henderson)
Flood Zone: Zone X; FEMA Flood Insurance Rate Map 32003C 2580F
Highest & Best Use “As Vacant Land”: Hold for industrial development
Highest & Best Use “As Is”: Continued use as industrial building
Probable Buyer: Owner-user
Real Estate Market Value “As Is”: $430,000
Extraordinary Assumptions: None
Hypothetical Condition: None
Insurable Value $195,000

Britton-Adamo Group/ROI Appraisal
File Number 20-086 2
Equipment
General Description: The subject is currently being operated as a crematorium and
includes specific built-in equipment for the business operation.
The primary components of the equipment include:
• Human cremator retort
• Cremains processing station
• 2 walk-in coolers
• Hydraulic lift table
• Mortuary freezer
Assumption/Condition: To determine actual mechanical condition is outside of our
expertise and the scope of this assignment. The equipment
appeared to be in functional and good condition. If it is the
client’s desire to verify the physical condition and/or needed
repairs of the subject equipment, the client should consult a
qualified mechanic/technician.
The equipment values is for business personal property only
and exclude consideration of real estate or goodwill, and it is
assumed there are no hidden defects which are not discernible
from a visual inspection and which could affect value. The
owner is further assumed to have fee simple ownership of the
various appraised items, which are appraised assuming a clear
and marketable title.
Title of Appraised Property: All appraised items are presumably owned by County Funeral
Services, LLC; owner of the aforementioned real property
Highest & Best Use “As Is”: Continued use as crematory
Fair Market Value: $100,000
Sale History of Appraised Items: Other than the acquisition by the current owner, we are
unaware of any prior sales of the appraised items. To our
knowledge, none of the items are currently listed for sale.
Class of Property: Crematory equipment
Use on Effective Date: Crematory equipment
Use on Report Date: Crematory equipment
Measurable Marketplace: Similar businesses that provide comparable products and
services throughout Nevada
Exposure/Marketing Time: 0-6 months

Britton-Adamo Group/ROI Appraisal
File Number 20-086 3
General
Dates of Value: September 25, 2020
Interest Appraised: Fee simple
Date of Report: September 29, 2020
Client Clark County Credit Union
Intended User Clark County Credit Union, the Small Business Administration
and Nevada State Development Corporation
Intended Use: The intended use of this appraisal is for loan underwriting
and/or credit decisions.
Exposure/Marketing Period: 12 months

Britton-Adamo Group/ROI Appraisal
File Number 20-086 4
S U B J E C T P H O T O G R A P H S
Aerial Photograph
SUBJECT
SUBJECT

Britton-Adamo Group/ROI Appraisal
File Number 20-086 5
View to the southwest facing the subject property
South
Yard entrance
Primary access to office
Office
Britton-Adamo Group/ROI Appraisal
File Number 20-086 6
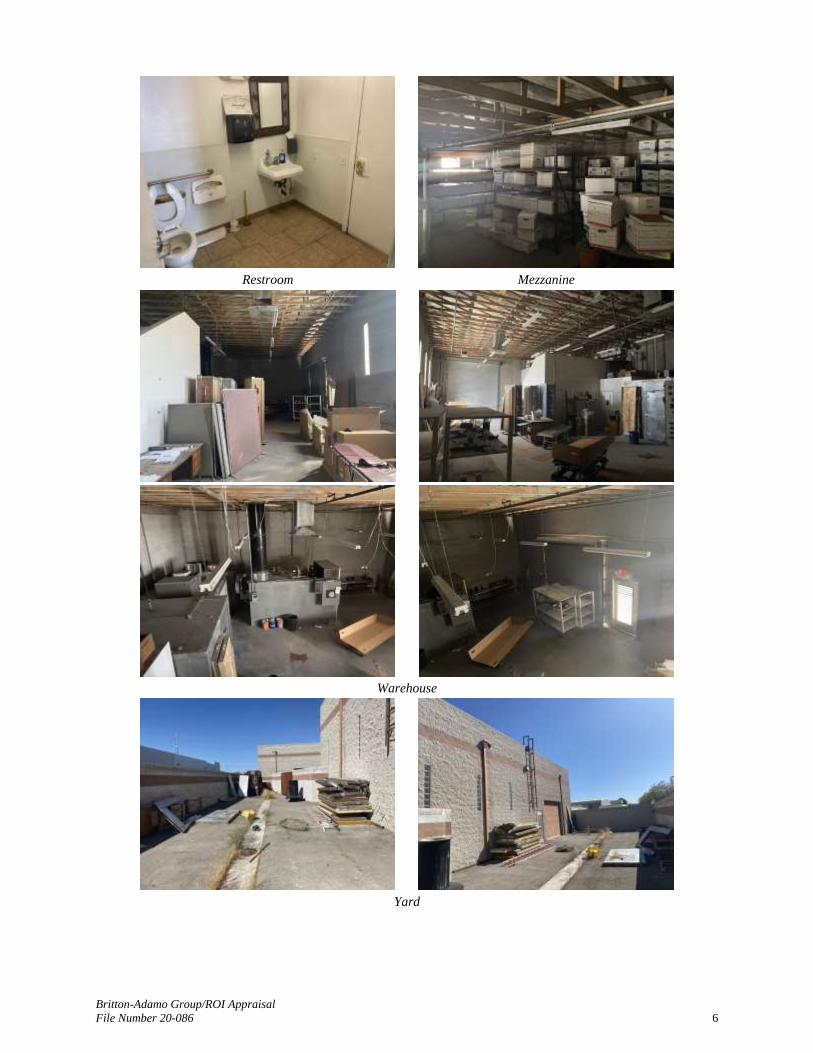
Restroom
Mezzanine
Warehouse
Yard

Britton-Adamo Group/ROI Appraisal
File Number 20-086 7
Equipment
Human cremator retort
2 walk-in coolers
4-person mortuary freezer
Cremains processing station
Hydraulic lift

Britton-Adamo Group/ROI Appraisal
File Number 20-086 8
I N T R O D U C T I O N
Subject Identification
The subject property consists of a single-tenant, industrial building, located at 1961 Whitney
Mesa Drive, Henderson, Nevada 89014. The subject improvements consist of 2,400 square feet
of total building area, containing approximately 480 square feet of one-story office space and
1,920 square feet of warehouse space, indicating an office space ratio of roughly 20%. The
subject is situated on a 0.16-acre site located within the interior of the Green Valley Industrial
Park, along the south side of Whitney Mesa Drive, east of Mountain Vista Street, in the southeast
portion of the Las Vegas Valley, in the City of Henderson, Clark County, Nevada. The subject
was constructed in 2006 and is in an overall good condition for its age.
The subject is currently being operated as a crematorium and includes specific built-in
equipment for the business operation. The equipment is separately identified and valued within
the appraisal. The remaining discussion and analysis of the equipment is provided following the
conclusion of the real property.
The subject property is also identified as Clark County assessor’s parcel number 161-32-712-
013.
Property Ownership and History
The subject is currently under the ownership of County Funeral Services, LLC. The subject
recently transferred to the current owner in July of 2020 via bankruptcy sale at a recorded price
of $215,000 (Document #: 20200717:02663). The current owner operates within the mortuary
industry and was familiar with the distressed nature of the sale. The difference between the
current market value and the recent sale price is primarily attributed to the conditions of sale.
There have been no other transfers involving the subject property in the prior three-year period.
Legal Description
A legal description is provided within the title report as follows:

Britton-Adamo Group/ROI Appraisal
File Number 20-086 9
The subject property is also described by its Clark County assessor’s parcel number 161-32-712-
013 or by its common street address of 1961 Whitney Mesa Drive, Henderson, Nevada 89014.
The property is further described by the maps and exhibits contained within this report.
Census Tract
The subject property is located in Census Tract 5101.
Purpose of the Appraisal
The purpose of this appraisal is to estimate the market values of the subject property based upon the
following valuation scenarios:
• Market Value of the Real Estate – “As Is” – fee simple interest
• Fair Market Value in Continued Use of the Equipment – “As Is” – fee simple interest
Property Rights Appraised
The interest that is the subject of this valuation is the fee simple estate, defined below.
Fee Simple Estate
“Absolute ownership unencumbered by any other interest or estate, subject only to the
limitations imposed by the governmental powers of taxation, eminent domain, police
power, and escheat.”
Source: Appraisal Institute, The Dictionary of Real Estate Appraisal, 6th ed. (Chicago: Appraisal Institute, 2015)
Client of the Appraisal
The client of this appraisal is Clark County Credit Union.
Intended User of the Appraisal
The intended user of this appraisal is Clark County Credit Union, the Small Business
Administration and Nevada State Development Corporation.
Intended Use
The intended use of this appraisal is for loan underwriting and/or credit decisions. The
conclusions and opinions in this appraisal are not to be relied upon for purposes other than the
above stated intended use. The appraisers and the appraisal firm assume no responsibility for
results from the reliance on all or part of the appraisal for any other use other than the specified
intended use.
Effective Date of Valuation/Inspection Date
The effective date of the “as is” market value, as well as the inspection date of the property is
September 25, 2020.
Date of Report
The date of this report is September 29, 2020.

Britton-Adamo Group/ROI Appraisal
File Number 20-086 10
Market Value Defined
Market Value means the most probable price which a property should bring in a competitive and
open market under all conditions requisite to a fair sale, the buyer and seller each acting
prudently and knowledgeably, and assuming the price is not affected by undue stimulus. Implicit
in this definition is the consummation of a sale as of a specified date and the passing of title from
seller to buyer under conditions whereby:
(1) Buyer and seller are typically motivated;
(2) Both parties are well informed or well advised, and acting in what they consider
their own best interests;
(3) A reasonable time is allowed for exposure in the open market;
(4) Payment is made in terms of cash in U.S. dollars or in terms of financial
arrangements comparable thereto; and
(5) The price represents the normal consideration for the property sold unaffected by
special or creative financing or sales concessions granted by anyone associated
with the sale. (Source: Office of the Comptroller of the Currency under 12 CFR, Part 34, Subpart C- Appraisals, 34.42 Definitions [f].)
Competency Provision
The signers of this report have the knowledge and experience to complete this appraisal
assignment in a competent manner. They have performed a number of appraisal assignments
recently for this property classification in the market area. Included in the Addenda are the
appraisers’ qualifications and the reader is referred to this section for additional information.
Appraisal Development and Reporting Process
This appraisal has been presented as an Appraisal Report as defined by the Uniform Standards of
Professional Appraisal Practice (USPAP), promulgated by the Appraisal Standards Board of
The Appraisal Foundation, and Clark County Credit Union appraisal requirements. The
reporting guidelines for an Appraisal Report are set forth under Standards Rule 2-2(a) of
USPAP and relate to the content and level of information provided in the report. This reporting
format requires all the necessary research and analysis to be performed however, some of the
information presented can be in an abbreviated format.
This appraisal is also intended to comply with the appraisal standards required by 12 CFR Part
34, dated June 7, 1994 of FIRREA (Federal Financial Institutions Reform, Recovery and
Enforcement Act), and to comply with the 2020-2021 Edition of USPAP, as published by the
Appraisal Foundation, and the appraisal standards of the client.

Britton-Adamo Group/ROI Appraisal
File Number 20-086 11
Scope of the Appraisal
The scope of the appraisal required investigating sufficient data relative to the subject property to
derive an opinion of value. The depth of the analysis was intended to be appropriate in relation
to the significance of the appraisal problem. In preparing this appraisal, the appraisers solely
inspected the exterior of the subject and researched specific subject property information deemed
relevant to this appraisal. This included information relating to ownership, zoning and planning,
flood hazard potential, tax assessment information, as well as other property information that may
affect the highest and best use of the subject. The appraisers also examined the subject's market
area for information on comparable sales, pending sales and listings of similar properties, as well
as general real estate and economic statistics and trends that are applicable to the subject’s
valuation. The market area was also examined to determine the demand and marketability of
properties with the subject's classification.
• Information provided for this appraisal included a brief description of the subject, bankruptcy
purchase agreement, summary of equipment and an engagement letter.
The opinions of the appraisers, and the analyses used to arrive at a conclusion(s) of value, is
based upon the market data available, together with the appraisers’ sole education, experience
and knowledge concerning the type of property being appraised. The appraisers are not
responsible for any items of fact in public records databases, subscription (fee) information
providers, or any other sources deemed reliable, that are incorrect.
Limitations of Scope
None
Environmental Hazards & Conditions
An environmental assessment report for the subject was not provided for review and
environmental issues are beyond my scope of expertise. During the course of this assignment,
there were no obvious signs of adverse environmental conditions or hazardous materials on or
near the property. Therefore, it is assumed that the subject is not adversely affected by
environmental hazards or conditions.

Britton-Adamo Group/ROI Appraisal
File Number 20-086 12
AREA MAP
SUBJECT

Britton-Adamo Group/ROI Appraisal
File Number 20-086 13
NEIGHBORHOOD MAP
Britton-Adamo Group/ROI Appraisal
File Number 20-086 14
N E I G H B O R H O O D D E S C R I P T I O N
The Dictionary of Real Estate Appraisal, (Sixth Edition, 2015, page 156) defines a neighborhood
as “a group of complementary land uses; a congruous grouping of inhabitants, buildings, or
business enterprises.” Neighborhoods are defined by both physical and social boundaries to
delineate areas in which social, economic, governmental and environmental influences work in a
complementary fashion to affect the use and value of real estate. A neighborhood may be an
urban or suburban development, which may include residential, commercial, industrial or other
land uses that are generally characterized as being homogeneous in some respects, and includes a
unified area with some definite boundaries. Neighborhood boundaries may consist of well-
defined natural or man-made barriers or they may be defined by a distinct change in land use or
in the character of the inhabitants.
The purpose of a neighborhood analysis is to provide a bridge between the study of general
influences on all property values and the more detailed influencing characteristics of a localized
neighborhood. Neighborhood analysis is important in that it is concerned with the relationship
of the immediate surrounding urban environment to a particular parcel in its current or proposed
use. This evaluation is a necessary link of the property under study to the general market supply
and demand situation.
Location
The subject neighborhood is located approximately 10 miles south and southeast of downtown
Las Vegas, and is generally delineated by the following boundaries:
North: Russell Road
East: Lake Mead National Recreation Area
South: Black Mountain Range
West: Interstate 15
The majority of the neighborhood is within the City of Henderson boundaries, but also includes
unincorporated portions of Clark County and a section of Paradise Valley Township. Henderson
comprises the majority of the southeast Las Vegas Valley and includes the majority of the
population in the area. Most of the developments that have an impact on the area are within the
city limits of Henderson, including large well-established master-planned communities.
Statistical data for the city of Henderson is primarily presented as it provides the best indications
of the trends seen in the neighborhood.

Britton-Adamo Group/ROI Appraisal
File Number 20-086 15
HENDERSON MAP
Demographics
The following map and table delineates the neighborhood zip codes.

Britton-Adamo Group/ROI Appraisal
File Number 20-086 16
Information on population, housing and income for the City of Henderson are presented in the
following tables:
CITY OF HENDERSON POPULATION BY ZIP CODE
The population in the City of Henderson has had significant growth in recent years with a total
increase of nearly 55% from 2000 to 2015, indicating an annual growth rate of near 3%.
Between 2000 and 2006, Henderson was the fastest growing city in the country in terms of
percentage growth in the United States. The population has grown to over 300,000. The current
population projections indicate growth to nearly 364,000 over the next 5 years with an average
growth rate of nearly 2% per year over the next 10 years.
CITY OF HENDERSON - Housing Estimates by Zip Code

Britton-Adamo Group/ROI Appraisal
File Number 20-086 17
Business/Employment
The City is actively trying to attract new businesses to Henderson and there has been steady
growth in the number of businesses and employment. There are many incentives that attract new
business, as is shown in the list below.
A summary of the Henderson Employment figures are below:
Henderson has a higher median household income than Las Vegas, North Las Vegas and
unincorporated Clark County, and is approximately 23% above the income in all of Clark
County, Nevada.
The business climate is strong due to the many programs to lower various costs of doing
business. The following table provides Henderson’s largest private employers, ranked by the
number of employees.

Britton-Adamo Group/ROI Appraisal
File Number 20-086 18
Henderson Largest Private Employers
Source: City of Henderson – http://hendersondata.com/industrial-structure
The following tables provide information on employment and wages by industry for Clark
County, Nevada.

Britton-Adamo Group/ROI Appraisal
File Number 20-086 19
Source: City of Henderson – http://hendersondata.com/labor-force
Land Use/Development
The city is comprised of a variety of land uses, from low density residential to industrial and
commercial. Land within Henderson and in other local jurisdictions, by land usage is shown in
the following tables.
Land Area (Acres)
Source: http://hendersondata.com/jurisdictional-comparison
% of Land Area
Source: http://hendersondata.com/jurisdictional-comparison

Britton-Adamo Group/ROI Appraisal
File Number 20-086 20
The total land value of each property type for Henderson and other local jurisdictions, is
summarized in the table below.
Total Value By Land Use (2018)
Source: http://hendersondata.com/jurisdictional-comparison
The assessed value per acre for each of the various land uses in Henderson and other local
jurisdictions is summarized in the following table.
Value per Acre (2018)
Source: http://hendersondata.com/jurisdictional-comparison
Single family residential land in Henderson has an assessed value of approximately $676,000 per
acre, higher than Las Vegas, North Las Vegas and unincorporated Clark County, and nearly 25%
above the value per acre for all of Clark County.
Since the turn of the century, Henderson has experienced a tremendous amount of commercial
and residential development. Significant commercial development has occurred to support the
population base including the relocation of numerous businesses to the area. Retail and office
development are primarily located along the major roadways and much of the new construction
has been in the southwest portion of the city along St. Rose Parkway and Eastern Avenue. New
commercial projects not only provide an amenity to the area residents, but also add to the
employment base. Large developments include the Galleria Regional Mall, Green Valley Ranch
District, Sunset Station Hotel/Casino and the Green Valley Auto Center, all of which have been
well received and added to the employment opportunities in Henderson. The Galleria Mall is a
major regional mall with Robinson’s-May, Dillard’s and JC Penney as anchor tenants. The
District is an open-air village retail center adjacent to the Green Valley Ranch Resort with
upscale stores and restaurants at ground level and condominium units above.

Britton-Adamo Group/ROI Appraisal
File Number 20-086 21
Industrial development has primarily been along the U.S. 95 corridor, generally between Sunset
Road on the north and Lake Mead Drive on the south. Industrial parks such as Black Mountain
Business Park, Gibson Business Park, Green Valley Business Park and Whitney Mesa have
attracted new businesses, many relocating to the Las Vegas area. Over the previous year, there
has been an influx of new industrial development in the West Henderson area of the submarket,
with large distribution centers and warehousing.
With an increasing population base, supporting commercial facilities have increased in demand.
Office buildings had been generally well received by the market, as have most retail centers.
These facilities are generally located along the major thoroughfares, with secondary locations
being built-out with residential product. An indirect influence of the subject neighborhood is the
City of Henderson downtown core. This older section of Henderson is undergoing revitalization
supported by the Redevelopment Agency and is evidenced by several new retail, residential, and
office projects.
The following summarizes the commercial market segments in Henderson as of the 4th Quarter
of 2019.

Britton-Adamo Group/ROI Appraisal
File Number 20-086 22
Taxable Retail Sales
The following table reflects the year over year retail sales trends and categories.
.
Master Planned Communities
The development of master planned communities in Henderson has accounted for much of the
population growth in the city over the past 20 years. The larger communities include a variety of
single family and multi-family residential products, supporting commercial uses and significant
parks and public recreation and cultural facilities. As of 2017, these communities are in various
stages of development, with most of the anticipated growth in the coming years expected to
occur in the Inspirada and Cadence development, which combined are planned to add over
25,000 units to the city. The major master planned communities in Henderson are presented on
the following page.
HENDERSON MASTER PLANNED COMMUNITIES

Britton-Adamo Group/ROI Appraisal
File Number 20-086 23
Lake Las Vegas is a large master-planned residential and resort community surrounding a 320
acre lake with more than ten miles of shoreline established in 1984. This community (roughly
half of which is gated) has the additional following amenities: waterfalls, wildlife, high-end
resorts and hotels, a yacht and beach club, a fitness center, three golf courses dispersed
throughout the community, smaller ponds also dispersed throughout the community and
incredible views. There are 19 distinct neighborhoods including custom home sites, courtyard
villas, waterfront & golf villas, resort condominiums, luxury executive homes and courtyard
town homes. Hyatt opened a hotel/casino at Lake Las Vegas in 1999, and the 350-room Ritz-
Carlton hotel/casino was completed in 2003. The community has had ongoing financial
problems and changes in ownership beginning about 2007 when the past developers pushed the
project into bankruptcy. The project emerged from bankruptcy in 2010 under the control of
Credit Suisse and Highland Capital. There have been some positive signs of improvement, with
rising home prices, hotel occupancy improving and sales of vacant sites to developers and
homebuilders. The Falls golf course and the Reflection Bay Golf Club both closed in 2009
however, reopened in 2014. The Casino MonteLago was completed in 2003 and has closed
multiple times, most recently in 2013 and has yet to reopen.
MacDonald Highlands is within the MacDonald Ranch development, a 3,200-acre development
with 4 villages including Del Webb's Sun City MacDonald Ranch, in the city of Henderson,
Nevada. MacDonald Highlands, formerly known as The Foothills at MacDonald Ranch, is a
private gated golf course community in the foothills of the McCullough Mountains south of
Horizon Ridge Parkway, and is planned for 500+ homes on semi-custom and custom home lots.
It features an 18-hole golf course designed by Jay Morrish and David Druzisky, completed in
2001. This 18-hole private course has an open guest policy and is surrounded by custom homes
and custom home lots ranging from about one-third of an acre to over 2 acres.

Britton-Adamo Group/ROI Appraisal
File Number 20-086 24
Features of this community include a 27,000-square-foot clubhouse, planned to be completed in
2003, which will offer a golf shop, exercise facility, swimming pool, tennis courts and dining, as
well as various community parks and hiking trails. Additional community amenities will include
three parks encompassing 10 acres, featuring tennis, basketball and volleyball courts; play areas;
and picnic facilities. Five miles of fitness trails are also planned in the foothills of Black
Mountain.
Seven Hills is located a mile south of Lake Mead Drive at Eastern Avenue. This 1,300 acre
master-planned community has been developed in two villages, with one oriented to an 18-hole
golf course. The community, upon final build-out, will have 3,600 units, with 735 units in the
golf-oriented portion. The residential projects include rental apartments, detached units, and
custom home sites. Amenities include a golf course, 26 neighborhoods, parks, and discovery
trails. The focal point of this community is Rio Secco, a 72-par championship golf course. One-
third of the total area has been allocated to open area, which includes golf, trails and common
areas.
Anthem is an approximate 5,000 acre community located in southern Henderson, southeast of
Seven Hills and features Sun City Anthem (age-restricted 55 and up), and Solera, a moderately-
priced community within Sun City Anthem, Anthem Country Club (a gated golf course
community), as well as Anthem Highlands, a traditional "family" community with a variety of
single-family homes covering a spectrum of product and prices.
Serving the Sun City residents is the 77,000 square foot Anthem Center clubhouse located at the
high point of the area with commanding views of the Las Vegas Valley. This facility provides a
high-quality environment for a large variety of activities and amenities. Included within the
Anthem Center are: restaurant, a fitness/exercise/wellness center, indoor walking track, indoor
and outdoor pools and spas (handicap accessible), tennis center, ballroom/meeting rooms, studios
for various crafts and activities, bocce ball, billiards, and a library, among others. In 2005,
Independence Center, housing the 300-seat Freedom Hall Theater and SCA-TV studios was
completed at the corner of Anthem Parkway and Hampton Road. Sun City also features The
Revere Gold Club, which offers 2 professional 18-hole golf courses; the Lexington and the
Concord.
The Anthem Country Club community features a gated entry, a Hale Irwin/Keith Foster-
designed golf course and a 33,000 square foot clubhouse housing a dining room, the Club Grille
& Sports Bar and a pro shop, among other features. Anthem Country Club also has a 13,700
square foot athletic club with tennis courts, a six-lane lap pool, resort and wading pools, spa,
volleyball and a poolside cafe. This is an exclusive guard gated private golf neighborhood of
upper end production homes and custom home lots.

Britton-Adamo Group/ROI Appraisal
File Number 20-086 25
Anthem Highlands and Madeira Canyon are more recent developments at the southern end of
Anthem. These communities offer a variety of single family homes, including the Club at
Madeira, a guard gated community with over 500 homes of 2,500 to 4,800 square feet and prices
averaging over $500,000. Amenities include a clubhouse, swimming pool, tennis courts and
recreational facilities.
Inspirada is a 1,950-acre master planned community located south of the Henderson Executive
Airport and west of Sun City Anthem and Anthem Highlands planned for approximately 15,500
residential units. This development was envisioned as a New Urbanist community which was
designed to capture an “old town” feeling where residents can walk to work, schools, churches
and parks. The development is planned for residential, commercial, mixed-use, and casino
components, and there has been many new residential communities under construction, as well
as roadways and recreation centers with community centers, pools and sports fields.
Residential Market
Recent single family residential market statistics for Henderson and the Las Vegas area are
presented below.

Britton-Adamo Group/ROI Appraisal
File Number 20-086 26
Accessibility
Accessibility is considered good to most portions of the neighborhood. The US 95 Freeway,
Lake Mead Drive, Boulder Highway, and the I-215/Las Vegas Beltway are the major traffic
thoroughfares for this area and provide good accessibility in and around the market area. The
Las Vegas Beltway “flyover” interchange with US 95 at Lake Mead Parkway provides
uninterrupted traffic flow between the two freeways. The extension of the I-215/Las Vegas
Beltway along Lake Mead Parkway and the interchange with US 95 greatly improves access
throughout Henderson and has helped increase the development in the neighborhood. In
addition, the interchange at St. Rose Parkway and Interstate 15, which opened in 2008, and the
widening of St. Rose Parkway to eight lanes of traffic should satisfy the anticipated growth of
the area over the foreseeable future.

Britton-Adamo Group/ROI Appraisal
File Number 20-086 27
Public Services
With the expansion of the residential base, schools, fire stations, and similar services have been
completed and/or are proposed in the neighborhood. Henderson has been approved for several
new schools, which will likely be located in the southern portion of the neighborhood where the
majority of the residential development is occurring.
Public utilities, police protection and other public services are available to meet the needs of the
neighborhood. As the residential base expands, additional services will be made available.
Conclusion
The City of Henderson has seen substantial growth in the past two decades and continues to
grow, albeit not at the rate seen in the 1990s and early 2000s. During that time Henderson was
the fastest growing city over 100,000 residents in the United States from 1990 to 1996.
Development has been primarily centered in the more than 25 master planned communities
which are predominantly residential with some associated commercial and service uses.
Residential uses include all types of product from entry level condominiums to high-end custom
homes. Commercial development and community services and roadways have been expanded
throughout the area and have for the most part, kept up with the expanding population and
employment base. The future outlook is considered positive with new development occurring
throughout the city, although primarily in the west and east portions where there is still available
vacant land.
Britton-Adamo Group/ROI Appraisal
File Number 20-086 28
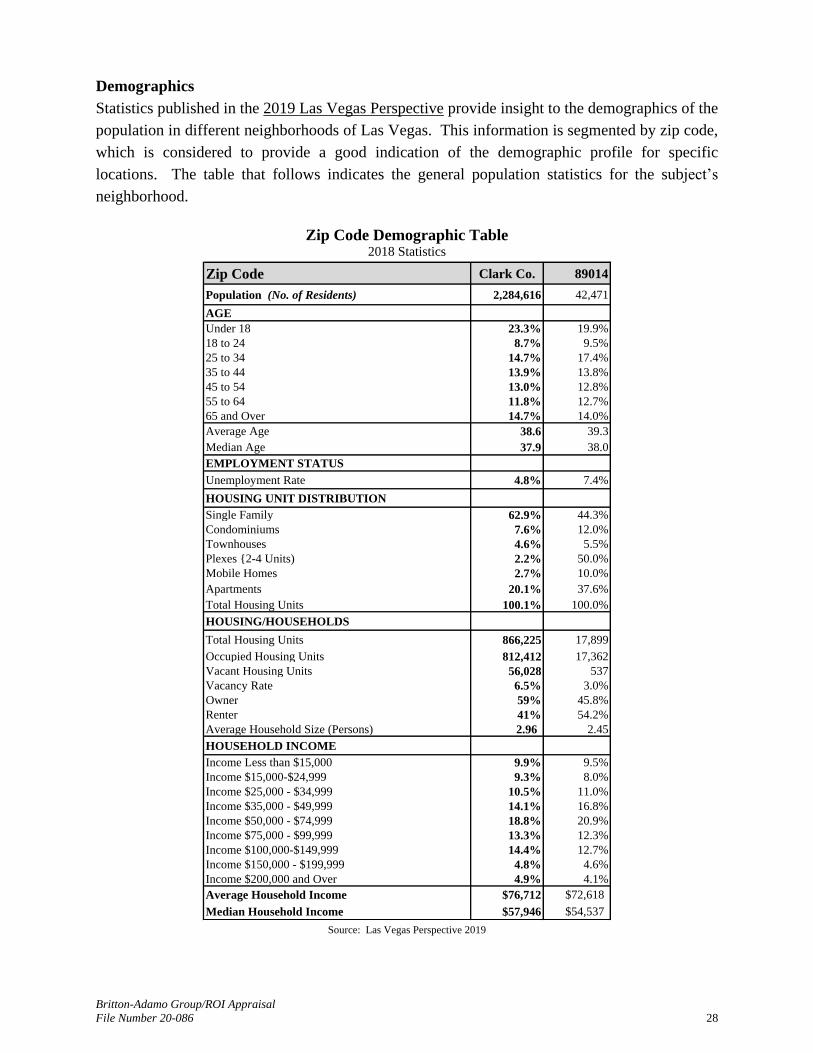
Demographics
Statistics published in the 2019 Las Vegas Perspective provide insight to the demographics of the
population in different neighborhoods of Las Vegas. This information is segmented by zip code,
which is considered to provide a good indication of the demographic profile for specific
locations. The table that follows indicates the general population statistics for the subject’s
neighborhood.
Zip Code Demographic Table
2018 Statistics
Zip Code Clark Co. 89014
Population (No. of Residents) 2,284,616 42,471
AGE
Under 18 23.3% 19.9%
18 to 24 8.7% 9.5%
25 to 34 14.7% 17.4%
35 to 44 13.9% 13.8%
45 to 54 13.0% 12.8%
55 to 64 11.8% 12.7%
65 and Over 14.7% 14.0%
Average Age 38.6 39.3
Median Age 37.9 38.0
EMPLOYMENT STATUS
Unemployment Rate 4.8% 7.4%
HOUSING UNIT DISTRIBUTION
Single Family 62.9% 44.3%
Condominiums 7.6% 12.0%
Townhouses 4.6% 5.5%
Plexes {2-4 Units) 2.2% 50.0%
Mobile Homes 2.7% 10.0%
Apartments 20.1% 37.6%
Total Housing Units 100.1% 100.0%
HOUSING/HOUSEHOLDS
Total Housing Units 866,225 17,899
Occupied Housing Units 812,412 17,362
Vacant Housing Units 56,028 537
Vacancy Rate 6.5% 3.0%
Owner 59% 45.8%
Renter 41% 54.2%
Average Household Size (Persons) 2.96 2.45
HOUSEHOLD INCOME
Income Less than $15,000 9.9% 9.5%
Income $15,000-$24,999 9.3% 8.0%
Income $25,000 - $34,999 10.5% 11.0%
Income $35,000 - $49,999 14.1% 16.8%
Income $50,000 - $74,999 18.8% 20.9%
Income $75,000 - $99,999 13.3% 12.3%
Income $100,000-$149,999 14.4% 12.7%
Income $150,000 - $199,999 4.8% 4.6%
Income $200,000 and Over 4.9% 4.1%
Average Household Income $76,712 $72,618
Median Household Income $57,946 $54,537 Source: Las Vegas Perspective 2019

Britton-Adamo Group/ROI Appraisal
File Number 20-086 29
I N D U S T R I A L M A R K E T O V E R V I E W
The market overview addresses historic and current trends in the industrial real estate segment
within the Las Vegas metropolitan area. Various sources of market statistics were utilized in this
analysis, including Applied Analysis, Voit Real Estate Services, Colliers International, Restrepo
Consulting Group and Grubb & Ellis. The industrial market statistics presented in the tables
includes speculative and non-speculative incubator, flex, midbay, distribution, freestanding and
other.
The six types of industrial buildings categorized in the Voit Industrial Market Report - Quarterly
Market Survey, are briefly described as follows:
Incubator: 500 - 1,500 sf divisibility, minimal office, one roll-up door
Flex: 1,500 - 3,000 sf divisibility, 40% or more office build-out, one roll-up door, high visibility
Midbay: 5,000 - 15,000 sf divisibility, 10%-15% office build-out, dock high and grade level loading
Distribution: over 15,000 sf divisibility, 3%-5% office build-out, multiple docks and grade level loading
Free standing: single or dual user(s)
Other: tenant improvements to a non-conventional build-out
The Las Vegas market is segmented into submarkets which have the same general location
characteristics, including access, proximity to employment centers, municipal boundaries and
surrounding land uses. The segmentation of the building type and submarket provides the
opportunity to analyze specific segments of the industrial market.
Las Vegas Industrial Market Trends
The following table provides a summary of the primary statistics for the Las Vegas industrial
market in recent years.
Source: Colliers International
The Las Vegas industrial market has consistently gown over the previous 10 years. Lease rates
have also significantly increased over the previous 5 years.
Britton-Adamo Group/ROI Appraisal
File Number 20-086 30
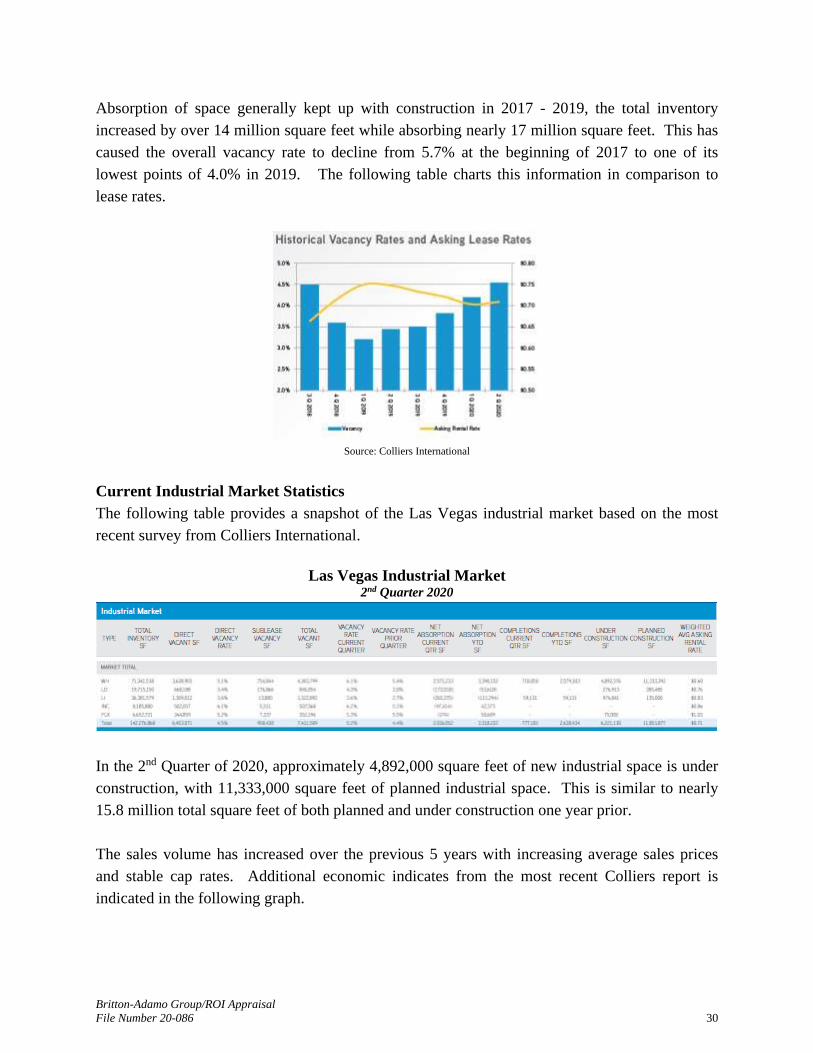
Absorption of space generally kept up with construction in 2017 - 2019, the total inventory
increased by over 14 million square feet while absorbing nearly 17 million square feet. This has
caused the overall vacancy rate to decline from 5.7% at the beginning of 2017 to one of its
lowest points of 4.0% in 2019. The following table charts this information in comparison to
lease rates.
Source: Colliers International
Current Industrial Market Statistics
The following table provides a snapshot of the Las Vegas industrial market based on the most
recent survey from Colliers International.
Las Vegas Industrial Market 2nd Quarter 2020
In the 2nd Quarter of 2020, approximately 4,892,000 square feet of new industrial space is under
construction, with 11,333,000 square feet of planned industrial space. This is similar to nearly
15.8 million total square feet of both planned and under construction one year prior.
The sales volume has increased over the previous 5 years with increasing average sales prices
and stable cap rates. Additional economic indicates from the most recent Colliers report is
indicated in the following graph.

Britton-Adamo Group/ROI Appraisal
File Number 20-086 31
Britton-Adamo Group/ROI Appraisal
File Number 20-086 32
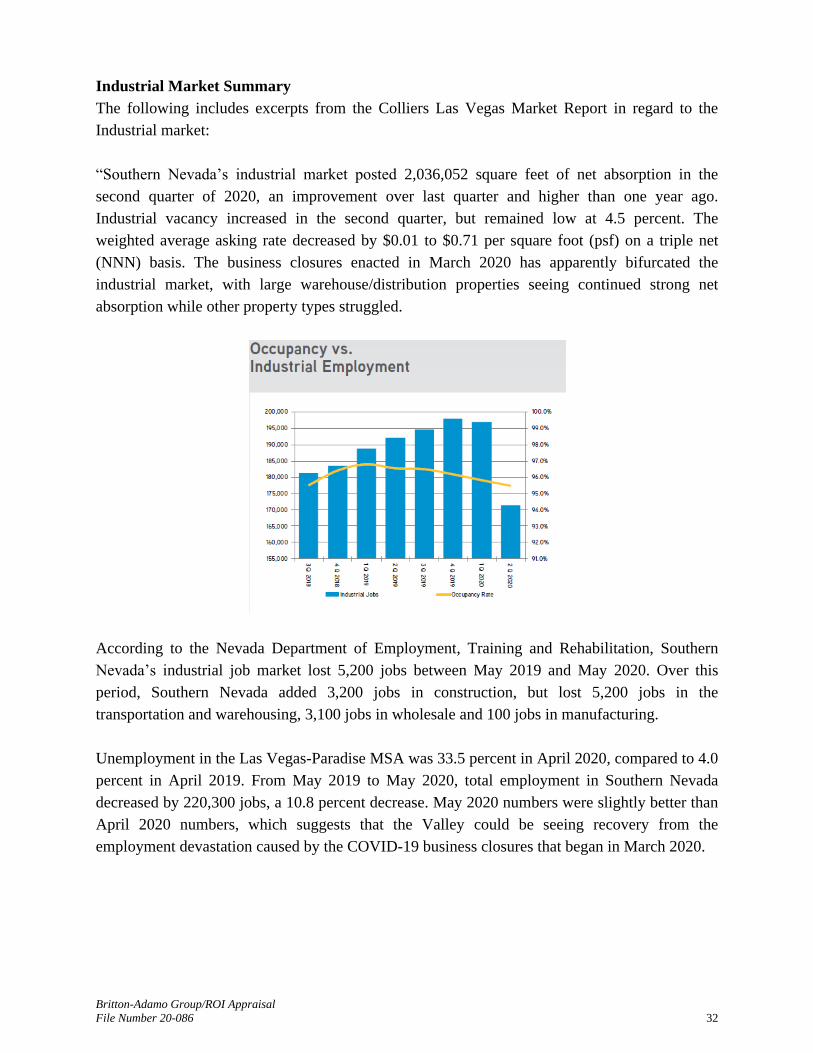
Industrial Market Summary
The following includes excerpts from the Colliers Las Vegas Market Report in regard to the
Industrial market:
“Southern Nevada’s industrial market posted 2,036,052 square feet of net absorption in the
second quarter of 2020, an improvement over last quarter and higher than one year ago.
Industrial vacancy increased in the second quarter, but remained low at 4.5 percent. The
weighted average asking rate decreased by $0.01 to $0.71 per square foot (psf) on a triple net
(NNN) basis. The business closures enacted in March 2020 has apparently bifurcated the
industrial market, with large warehouse/distribution properties seeing continued strong net
absorption while other property types struggled.
According to the Nevada Department of Employment, Training and Rehabilitation, Southern
Nevada’s industrial job market lost 5,200 jobs between May 2019 and May 2020. Over this
period, Southern Nevada added 3,200 jobs in construction, but lost 5,200 jobs in the
transportation and warehousing, 3,100 jobs in wholesale and 100 jobs in manufacturing.
Unemployment in the Las Vegas-Paradise MSA was 33.5 percent in April 2020, compared to 4.0
percent in April 2019. From May 2019 to May 2020, total employment in Southern Nevada
decreased by 220,300 jobs, a 10.8 percent decrease. May 2020 numbers were slightly better than
April 2020 numbers, which suggests that the Valley could be seeing recovery from the
employment devastation caused by the COVID-19 business closures that began in March 2020.

Britton-Adamo Group/ROI Appraisal
File Number 20-086 33
New completions of industrial space in the second quarter of 2020 totaled 777,181 square feet.
The majority of the industrial space completed this quarter was warehouse/distribution space
located in North Las Vegas. Approximately 64 percent of this space was preleased at completion.
An additional 2.8 million square feet of industrial space is scheduled for completion in the third
quarter of 2020, with approximately 33 percent of this space preleased.

Britton-Adamo Group/ROI Appraisal
File Number 20-086 34
Industrial net absorption was 2,036,052 square feet in the second quarter of 2020, an increase
from one year ago when net absorption was 1,831,220 square feet. The Valley’s highest net
absorption this quarter was in North Las Vegas, at 2,343,153 square feet, followed by the West
Henderson submarket at 154,291 square feet. Net absorption was negative in most other
submarkets, with Southwest experiencing the lowest net absorption, negative 186,568 square
feet. Net absorption was 2,571,233 square feet in warehouse/distribution, negative 172,018
square feet in light distribution, negative 265,375 square feet in light industrial, negative 97,414
square feet in incubator and negative 374 square feet in flex properties.
Southern Nevada’s industrial vacancy rate increased to 4.5 percent in the second quarter of 2020.
The Valley’s lowest vacancy rate was 1.7 percent in the Henderson submarket. The Valley’s
highest vacancy rate was 8.2 percent in rapidly expanding West Henderson, followed by 6.3
percent in North Las Vegas. Among product types, vacancy was lowest in light distribution
properties at 3.4 percent, followed by light industrial at 3.6 percent, 5.1 percent in
warehouse/distribution, 5.2 percent in flex and 6.1 percent in incubator properties.
The industries most active in occupying space in the second quarter of 2020 were involved in
manufacturing (36.3 percent), wholesale (22.4 percent) and transportation and warehousing (12.6
percent). Local companies took 31.5 percent of the leased square footage we tracked in the
second quarter of 2020. Companies headquartered in the Midwest took 29.7 percent of the space
occupied, followed by the Northeast U.S. at 20.3 percent and Southwest U.S. 15 percent.

Britton-Adamo Group/ROI Appraisal
File Number 20-086 35
The weighted average asking rate for industrial product in Southern Nevada decreased in the
second quarter of 2020. The weighted average asking rate was $0.71 psf, a $0.01 increase from
one quarter ago, and a $0.04 decrease from one year ago. Asking rates increased by $0.03 psf in
flex properties, $0.02 psf in light industrial properties and remained flat in
warehouse/distribution properties. Asking rates decreased by $0.09 psf in incubator and $0.05
psf in light distribution properties.
Industrial investment sales in the second quarter of 2020 showed an improvement over 2019, and
were on par to match the recent high point in investment sales in 2018. Sales volume was $447.1
million in 39 sales totaling 3,343,000 square feet at an average sales price of $130.19 psf. The
average cap rate increased to 7.7 percent from last year’s 6.3 percent, and the average size of a
sold property increased to 88,000 square feet.
The second quarter of 2020 managed to produce over 2 million square feet of industrial net
absorption despite the business closures that began in March 2020. The business closures took a
serious toll on the local economy, with Southern Nevada losing more than 220,000 jobs since
May 2019. The loss of jobs, and the loss of occupied industrial space, was not felt evenly in the
market. Warehouse/distribution product posted all of the Valley’s positive net absorption in the
second quarter of 2020. Other industrial product types, which rely more heavily on small
businesses, suffered negative net absorption. While it is likely that warehouse/distribution
demand will remain relatively strong through the remainder of 2020, it is unknown how quickly
Britton-Adamo Group/ROI Appraisal
File Number 20-086 36
small businesses will recover. By the end of 2020, we may see an overall positive industrial
picture that nevertheless obscures the challenges faced by many landlords of non-
warehouse/distribution properties in the Valley.
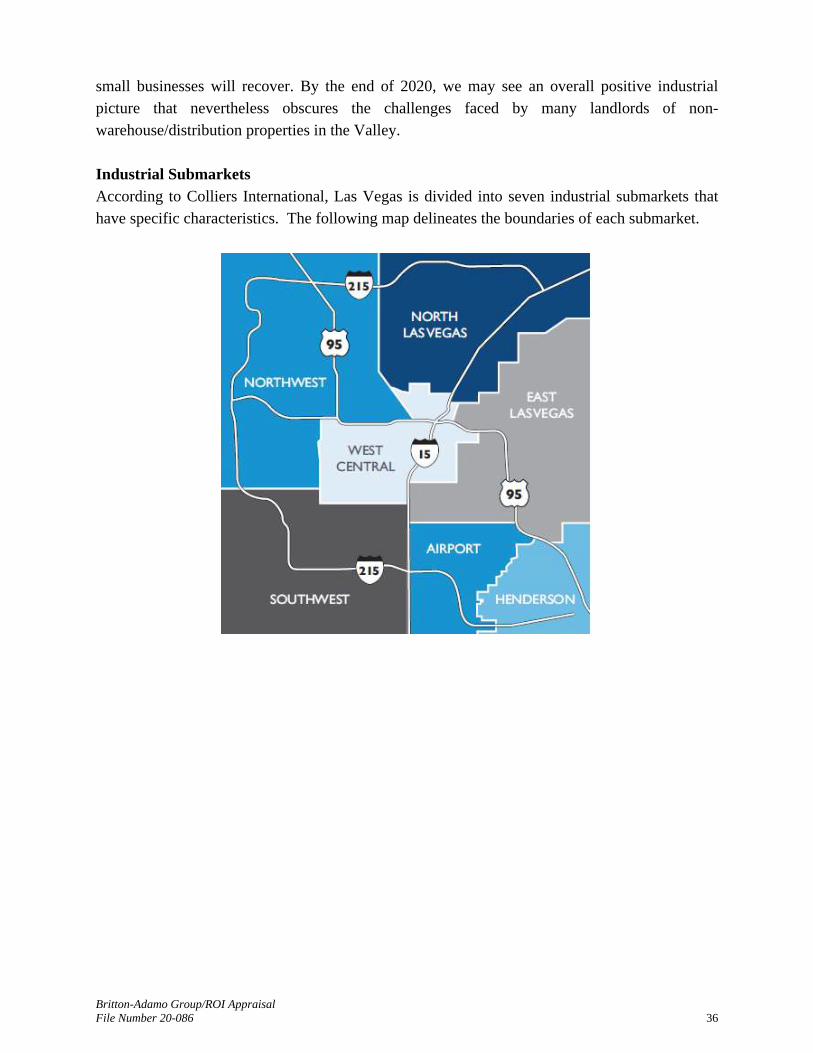
Industrial Submarkets
According to Colliers International, Las Vegas is divided into seven industrial submarkets that
have specific characteristics. The following map delineates the boundaries of each submarket.

Britton-Adamo Group/ROI Appraisal
File Number 20-086 37
The following table delineates the characteristics of the individual submarkets throughout the
Las Vegas Valley.
Las Vegas Industrial Submarkets 2nd Quarter 2020

Britton-Adamo Group/ROI Appraisal
File Number 20-086 38
Conclusion
The Las Vegas industrial market has improved over the past 5 years, with vacancy decreasing
below 5%. We have been in complete recovery from the recessions in 2007. As indicated in the
following tables, capitalization rates in the Las Vegas market as well national rates have
continued to improvement with signs of stabilization, after a period improving rates over recent
years.
PwC Real Estate Investor Survey
The occupancy levels for this product type has been relatively consistent in recent years, a trend
that will likely extend to second-tier markets such as Las Vegas over the next few years,
assuming a short-term affect from COVID-19.
Overall based on the provided market data, the industrial market is toward the end of the period
of recovery from the previous recession with positive signs of improvements.

Britton-Adamo Group/ROI Appraisal
File Number 20-086 39
P R O P E R T Y T A X E S A N D A S S E S S O R ’ S V A L U E S
The State of Nevada employs a millage structure for real estate taxation. Nevada Revised
Statutes require that all property be valued every five years based on a "Replacement Cost"
approach. The Assessor's Office determines the cost necessary to replace an improvement, less
depreciation. The land value is also included, based upon market sales.
During non-reevaluation years, the values are updated every year by an Index computed by the
State Department of Taxation. Current Nevada law requires that all property be factored each
year to reflect the increased cost of construction. This factor varies by location and type of
property. The assessment ratio is 35% as defined in NRS 361.225. In addition, each property
also has a "Computed Taxable" value that cannot exceed the full cash value.
The State of Nevada operates on a fiscal basis with a fiscal year which begins on July 1st and
ends on June 30th of the following calendar year. In Clark County there are a number of tax
districts. The tax rates for each of these districts are based on the amount of monies budgeted to
them for the necessary maintenance and improvements of their facilities and services. The
monies collected must pay for schools, roads, police, and fire protection, along with the other
services that a taxpayer expects from the local government. The tax rates vary depending on the
type of services provided to a particular area.
A comparison of cities of comparable size to those in the Las Vegas Valley shows that Las
Vegas and Clark County have some of the lowest property tax burdens in the western United
States. This helps attract new residents and businesses to the area.
The subject property consists of a legal parcel located in tax area 505 (Henderson), which has a
tax rate for fiscal year 2020/2021 of 2.9291%. The subject’s current assessment and estimated
tax obligation is indicated in the table below.
Clark County Assessment and Cap Reduction Information
APN Land Improvements Total Taxes as
Assessed
Less Cap
Reduction Net Taxes
161-32-712-013 $18,784 $42,860 $61,644 $1,805.61 $355.73 $1,449.88
The Nevada Legislature passed a property tax relief measure in the Spring of 2005 to curb the
impact of rapidly escalating property values. The law limits the amount that taxes can increase
from one year to the next. The tax increases are capped at 3% for owner/occupied homes and a
6.7% cap on most other properties, including the subject. The subject property’s tax liability has
been reduced in the current tax year.

Britton-Adamo Group/ROI Appraisal
File Number 20-086 40
According to the Clark County Treasurer’s office, as of September 25, 2020, the subject does not
have delinquent taxes. The value conclusion in this appraisal assumes that the taxes have been
paid in full, and there are no outstanding taxes due.
Additional Clark County assessor’s and treasurer’s information for the subject property is located
in the Addenda to this report.

Britton-Adamo Group/ROI Appraisal
File Number 20-086 41
ASSESSOR’S PARCEL MAP
SUBJECT
SUBJECT

Britton-Adamo Group/ROI Appraisal
File Number 20-086 42
S I T E D E S C R I P T I O N
Configuration and Size
The subject site includes a 0.16-acre parcel located within the interior of the Green Valley
Industrial Park, along the south side of Whitney Mesa Drive, east of Mountain Vista Street. The
site is near rectangular in shape with roughly 109 feet in a north/south direction and 66 feet in an
east/west direction.
Topography and Flood Hazard
The subject property is generally flat and level with the surrounding properties and adjacent
roadways. According to the FEMA Flood Insurance Rate Map (FIRM) 32003C 2580F, the
subject property is in Zone X, an area determined to be outside the 0.2% annual chance
floodplain. There were no obvious signs of any significant flood hazards that affect the subject
property and none were reported to us during the course of this assignment. It is an assumption
of this report that the subject is not affected by any atypical flood hazards or conditions which
would adversely affect the market value or development potential of the property. A copy of the
flood map is located in the Addenda to this report.
This parcel IS NOT in a 100-year flood zone.
Parcel 16132712013
Owner LEE PROPERTIES NEVADA INC
Address 1961 WHITNEY MESA
Entity Henderson
Contact 702-267-3058
Flood Zone This parcel IS NOT in a 100-year flood zone.
FIRM Panel View FIRM Panel (2580)
LOMR This parcel is not affected by a LOMR
SUBJECT
Britton-Adamo Group/ROI Appraisal
File Number 20-086 43
Soils and Subsoil
A soil report for the property was not provided to us during the course of this assignment. Based
upon a physical inspection of the property, as well as a review of various maps and site plans,
there are no obvious signs of any significant adverse soil conditions on the subject property. In
addition, no adverse soil conditions were reported to us during the course of this assignment.
Overall, there is no evidence of any adverse soil conditions that would affect the market value or
development potential of the subject property. However, we are not qualified professionals in
this field, and therefore; cannot provide a valid determination of the soil conditions. It is
assumed the soils are capable of supporting a variety of utilizations and developments.
Easements and Encroachments
A title report was not provided for our review and no adverse easements or encroachments were
noted. Based upon a physical inspection of the subject property, the subject is encumbered by
various utility easements, which are typical for industrial buildings in the area. The existing
easements are common to the neighborhood and do not adversely affect the value of the
property. The following describes the easement derived from the deed.
The easements that exist on the subject property are typical for the area and do not significantly
affect the development potential or highest and best use of the property.
Environmental Conditions
A Phase I Environmental Site Assessment was not provided to us. Based upon a physical
inspection of the subject property, there does not appear to be any significant adverse
environmental conditions that are obvious and would affect the market value of the property. In
addition, there were no reported adverse conditions on the subject site, or any adjacent sites.
However, we are not professionals in this field and are not qualified to determine environmental
hazards or conditions. Therefore, we take no responsibility to the existence of any known or
unknown environmental hazards or conditions that may exist on the subject property (see
Assumptions and Limiting Conditions #8).
Seismic Hazard
The Nevada Bureau of Mines and Geology has published a map of known faults and fissures in
the area. Fault scarps are common in the Las Vegas Valley; yet, horizontal or vertical land
movement is generally low. According to consulting geologist Dr. Burton Slemmons, in “Land
Subsidence in Las Vegas”, faults of Las Vegas Valley have low rates of activity with recurrence
intervals of about 10,000 years or more; greatly lower than the 150-300 years for the San
Andreas, Hayward, and Calaveras faults of California.
Britton-Adamo Group/ROI Appraisal
File Number 20-086 44
Nevada has no regulations for determining earthquake hazard/risk for a specific site, although
Clark County has adopted Uniform Building Code (Zone 2B) requirements, which include
foundation-wall-roof anchoring and steel reinforcement provisions.
Utilities
All public utilities are available and at adequate capacity to accommodate a wide variety of
potential developments, including the existing building improvements. They are provided by the
following:
Electricity: NV Energy
Natural Gas: Southwest Gas Company
Water: Las Vegas Valley Water District
Sewer: Clark County Sanitation District
Telephone: CenturyLink Communications
Disposal: Republic Services
Street Improvements and Access
The subject property is located within the interior of the Green Valley Industrial Park, along the
south side of Whitney Mesa Drive, east of Mountain Vista Street. Access to the subject is
provided from reciprocal access agreements within the development. The development is
accessed by two sets of curb cuts located along Whitney Mesa Drive. Whitney Mesa Drive is a
two lane 60-foot wide roadway, which has a signalized intersection with Mountain Vista Street,
roughly one-quarter mile to the west. Mountain Vista Street is secondary neighborhood arterial,
which intersects with Russell Road roughly one mile to the north and continues throughout
residential communities also intersecting with Tropicana Avenue and Flamingo Road. Mountain
Vista Street turns into and intersects with Sunset Road roughly one-half mile to the south, which
traverses the southern portion of the Las Vegas Valley. The nearest freeway interchanges are at
US Highway 95 via Tropicana Avenue roughly 2 miles to the northwest and via Russell Road
roughly 2 miles to the east. Overall, access to the subject property is considered to be average.
Zoning
The subject property is currently zoned IL, Limited Industry District with the City of Henderson.
The IL district is established to provide areas appropriate for low-intensity industrial uses
including light manufacturing, warehousing and distribution, research and development, and
commercial services, and to protect these areas, to the extent feasible, from the disruption and
competition for space from unrelated retail uses, primary office uses, and general industrial uses.
Conversion of buildings and sites to general office use is permitted only as expressly stated in
this Development Code. Secondary accessory office uses on the site are allowed.
Additional information on this zoning designation is located in the Addenda to this report.

Britton-Adamo Group/ROI Appraisal
File Number 20-086 45
D E S C R I P T I O N O F I M P R O V E M E N T S
The subject is an existing single-tenant industrial building built with 2,400 square feet of
building area. The building includes roughly 480 square feet of office space, which is generally
and open space, and a 2-fixture restroom. The public entrance to the building is situated at the
north side of the building structure via a single glass doorway. There is a grade level doorway
along the west side of the building providing access to the warehouse area from the enclosed
storage yard, and one additional grade level door along the north side of the building. The yard
area includes nearly 2,000 square feet.
In addition, the warehouse also includes roughly 400 square feet of open mezzanine storage
space above the office. The mezzanine is accessed via an interior stairwell in the warehouse.
Due to the quality of the space, it is not considered as part of the total building area is a
beneficial characteristic. The improvements were constructed in 2006 and are in an overall good
condition.
A complete set of building plans as well as a detailed list of the interior improvements were not
provided.
Type of Improvement Office/warehouse building
Number of Buildings One
Number of Stories One
Number of Units One
Year Built 2006
Building Size Office – 480 sf
Warehouse – 1,920 sf
Total - 2,400 sf
Percent Office 20% (480 SF/2,400 SF)
Site Coverage Ratio 34% (2,400 SF/7,000 SF)
Floor Area Ratio 34% (2,400 SF/7,000 SF)

Britton-Adamo Group/ROI Appraisal
File Number 20-086 46
Construction Components
Foundation Reinforced concrete slab
Structural System: Concrete block (CMU)
Roof: A flat built-up commercial roof.
Exterior Walls: Painted concrete
Interior Walls: The interior walls are wood-frame with painted, textured
and taped drywall in office and smooth concrete in
warehouse.
Building Height: 18’ (16’ clear height)
Floor Finish: Ceramic tile throughout the office and smooth concrete in the
warehouse
Plumbing: There is one 2-fixture restroom.
Sprinklers: Yes
Electricity: Commercial grade that is assumed to meet code.
Ceilings & Lighting: Taped and textured drywall with fluorescent light fixtures
in office. Warehouse includes open beam with skylights
and hung metal halide bay light fixtures.
Interior & Exterior Doors: The entryway to the office area consist of glass in an
aluminum frame. The majority of the interior doorways are
wood in wood frames. The warehouse is served by two
external grade level doors.
Heating & A/C: Roof mounted package HVAC unit assumed to maintain
adequate year-round temperatures in office with swap
coolers in the warehouse areas.
Glass: There are storefront glass storefront windows along the
main building façade.
Parking: The subject property has 3 front parking stalls with
additional potential parking in the yard. The parking is
considered to satisfy the current development restrictions.

Britton-Adamo Group/ROI Appraisal
File Number 20-086 47
Yard Improvements: There is minimal landscaping along the perimeter of the
development. The subject includes an enclosed storage
yard with a manual gate along the west side of the building.
Americans with Disabilities Act (ADA) Compliance
The Americans with Disabilities Act (ADA) became effective January 26, 1992. The appraisers
have not made a specific compliance survey and analysis of this property to determine whether
or not it is in conformity with the various detailed requirements of the ADA. It is possible that a
compliance survey of the property together with a detailed analysis of the requirements of the
ADA could reveal that the property is not in compliance with one or more of the requirements of
the act. If so, this fact could have a negative effect upon the value of the property. Since the
appraisers have no direct evidence relating to these issues, the appraisers did not consider
possible non-compliance with the requirements of ADA in estimating the value of the property.
Hazardous Materials
We are not aware of any potentially hazardous materials (such as formaldehyde foam insulation,
asbestos insulation, radon gas emitting materials, or other potentially hazardous materials) which
will be used in the construction of the improvements. However, we are not qualified to detect
such materials and urge the client to employ an expert in the field to determine if such hazardous
materials exist.
Construction Class/Economic Life
According to the Marshall Valuation Cost reference manual, the subject improvements are
classified as a good quality Class "C" Light Industrial/Warehouse Shell Building, with average
quality Industrial, Interior Office Space (Section 14, Page 35). The life expectancy tables in the
manual (Section 97) indicate an economic life of approximately 45 years for this type of
building.
Effective Age/Condition
The subject property was completed in 2006. The subject improvements have an actual age of
14 years. The overall subject improvements are considered to be in good condition, with an
effective age estimated to be below the actual age at 10 years, indicating a remaining economic
life of 35 years.
Functional Utility
The subject has a design and layout that is typical in the marketplace for a light industrial use,
and is not considered to have any significant functional inadequacies that would limit the
potential use of the property.
Economic Utility
There do not appear to be any external influences which negatively affect the subject property.
Britton-Adamo Group/ROI Appraisal
File Number 20-086 48
H I G H E S T A N D B E S T U S E A N A L Y S I S
Highest and best use, as used in this report, is defined as follows:
“The reasonably probable use of property that results in the highest value. The four criteria that the highest
and best use must meet are legal permissibility, physical possibility, financial feasibility, and maximum
productivity.” Source: Appraisal Institute, The Dictionary of Real Estate Appraisal, 6th ed. (Chicago: Appraisal Institute, 2015)
Highest and best use identifies the most profitable, competitive use to which a property can be
put. A property's highest and best use is determined by the competitive forces in the market in
which the property is located. It may or may not reflect the current or proposed use.
The four criteria the highest and best use must meet are physically possible, legally permissible,
financially feasible and maximally productive.
In this analysis, the highest and best use of the property as if vacant and as improved is
addressed. Each criteria identified in the preceding paragraph is considered.
HIGHEST AND BEST USE OF THE SITE AS VACANT
Physically Possible
The subject is situated on a 0.16-acre site located within the interior of the Green Valley Industrial
Park, along the south side of Whitney Mesa Drive, east of Mountain Vista Street, in the southeast
portion of the Las Vegas Valley, in the City of Henderson, Clark County, Nevada. The site is near
rectangular in shape with roughly 109 feet in a north/south direction and 66 feet in an east/west
direction. Access to the subject is provided from reciprocal access agreements within the
development.
The subject property is generally flat and level with the surrounding properties and adjacent
roadways. The site has full utility services available and at adequate capacity to accommodate
most potential developments. The soil conditions appear capable of supporting a range of
development, and the parcel is situated outside the 100-year flood zone. Additionally, no
adverse environmental conditions were noted at the time of inspection. The site offers adequate
utility to support a variety of developments. Overall, there does not appear to be any physical
constraints that would limit potential development of the subject property.
Legally Permissible
The subject property is currently zoned IL, Limited Industry District with the City of Henderson.
The IL district is established to provide areas appropriate for low-intensity industrial uses
including light manufacturing, warehousing and distribution, research and development, and
commercial services, and to protect these areas, to the extent feasible, from the disruption and
competition for space from unrelated retail uses, primary office uses, and general industrial uses.

Britton-Adamo Group/ROI Appraisal
File Number 20-086 49
In conclusion, a variety of legally permissible industrial uses exist for the subject site.
Financially Feasible/Maximally Productive
Financial feasibility of the site as if vacant requires the analysis of uses, which have potential
both physically and legally. As stated previously, legally the development of the site is limited
to industrial uses. Of these potential uses, the use that is maximally productive and results in the
highest net present value is the maximally productive use of the site.
The subject property is located within the interior of the Green Valley Industrial Park, along the
south side of Whitney Mesa Drive, east of Mountain Vista Street. Access to the subject is
provided from reciprocal access agreements within the development. The development is
accessed by two sets of curb cuts located along Whitney Mesa Drive. Whitney Mesa Drive is a
two lane 60-foot wide roadway, which has a signalized intersection with Mountain Vista Street,
roughly one-quarter mile to the west. Mountain Vista Street is secondary neighborhood arterial,
which intersects with Russell Road roughly one mile to the north and continues throughout
residential communities also intersecting with Tropicana Avenue and Flamingo Road. Mountain
Vista Street turns into and intersects with Sunset Road roughly one-half mile to the south, which
traverses the southern portion of the Las Vegas Valley. The nearest freeway interchanges are at
US Highway 95 via Tropicana Avenue roughly 2 miles to the northwest and via Russell Road
roughly 2 miles to the east. Overall, access to the subject property is considered to be average.
Considering the subject’s location in an industrial project, and the physical and legal constraints,
an industrial use is considered feasible.
The Las Vegas industrial market has historically performed well in terms of low vacancy rates,
positive net absorption, and lease rates. The demand for industrial space has been increasing
over the previous five years, which is reflected by the increasing absorption. The expectations
for the long-term are optimistic.
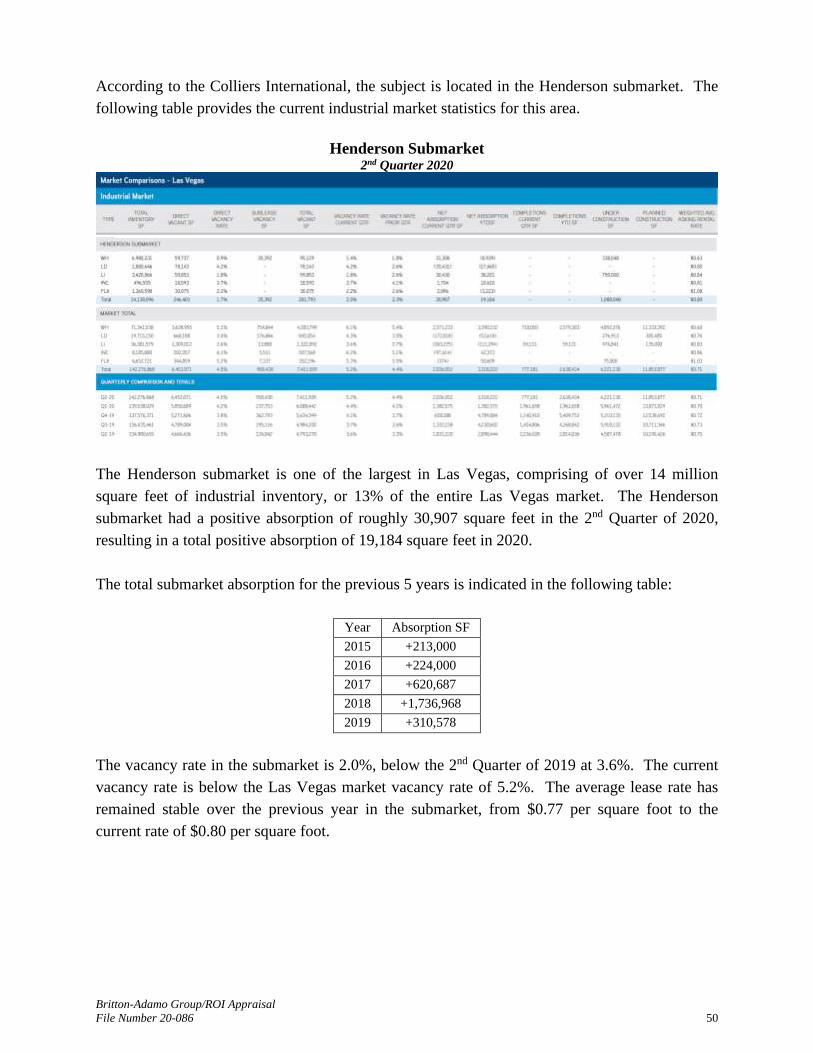
Britton-Adamo Group/ROI Appraisal
File Number 20-086 50
According to the Colliers International, the subject is located in the Henderson submarket. The
following table provides the current industrial market statistics for this area.
Henderson Submarket 2nd Quarter 2020
The Henderson submarket is one of the largest in Las Vegas, comprising of over 14 million
square feet of industrial inventory, or 13% of the entire Las Vegas market. The Henderson
submarket had a positive absorption of roughly 30,907 square feet in the 2nd Quarter of 2020,
resulting in a total positive absorption of 19,184 square feet in 2020.
The total submarket absorption for the previous 5 years is indicated in the following table:
Year Absorption SF
2015 +213,000
2016 +224,000
2017 +620,687
2018 +1,736,968
2019 +310,578
The vacancy rate in the submarket is 2.0%, below the 2nd Quarter of 2019 at 3.6%. The current
vacancy rate is below the Las Vegas market vacancy rate of 5.2%. The average lease rate has
remained stable over the previous year in the submarket, from $0.77 per square foot to the
current rate of $0.80 per square foot.

Britton-Adamo Group/ROI Appraisal
File Number 20-086 51
There has been no new inventory added to the market in 2020. The total submarket new
inventory for the previous 5 years is indicated in the following table:
Year Added Inventory SF
2015 28,000
2016 685,000
2017 240,000
2018 1,900,930
2019 75,000
In addition, there is nearly 1.1 million square feet of industrial space under construction with no
new space under construction. Most of the new space is in the west Henderson area of the
submarket and includes large distribution space that does not compete with the subject.
The long-term viability of the Henderson area is considered good due primarily to the
accessibility and proximity to transportation routes and employment centers. As less new
construction occurs in the industrial market, and absorption improves, the markets will continue
to stabilize.
COVID-19 Market Indicators
Continuing from the Colliers Market Report, the following are excerpts from the general market
conditions:
“The strong start Southern Nevada’s economy had in 2020 has been more then reversed in the
past three months due to the business closures enacted to slow the spread of the COVID-19
virus. Job losses so far this year have been staggering, though there is hope that the re-opening of
businesses in May and of hospitality properties in June will mean an equally impressive rebound
in employment.
Unemployment in the Las Vegas-Paradise MSA was 33.5 percent in April 2020, 29.5 points
higher than in April 2019. Unemployment last peaked in Southern Nevada at 14 percent in
January 2011. The region’s previous low unemployment rate was 3.8 percent in March 2019.
The latest national unemployment figure was 13.3 percent in May 2020, 9.7 points higher than in
May 2019. The national labor force participation rate was 60.8 percent in May 2020, a 2 percent
decrease from one year ago.
From May 2019 to May 2020, employment in Southern Nevada decreased by 220,300 jobs to
816,300 jobs. This was roughly the lowest number of jobs in Southern Nevada since October
2011, and represented 21.3 percent annual growth. On a year-over-year basis, the majority of
new jobs lost in Southern Nevada in May 2020 were in leisure and hospitality (-122,400 jobs),
professional and business services (-32,600 jobs), retail (-24,000 jobs), education and health
services (-14,800 jobs), other services (-7,800 jobs), transportation and warehousing (-5,200

Britton-Adamo Group/ROI Appraisal
File Number 20-086 52
jobs), government (-4,600 jobs), wholesale (-3,100 jobs), information (-2,500 jobs), financial
activities (-500 jobs) and manufacturing (-100 jobs). Jobs were added in construction (+3,200
jobs) and natural resources (+100 jobs).
According to Home Builders Research, 3,083 new homes sold in the first four months of 2020, a
2.65 percent decrease from the same period in 2019. The median price for new homes decreased,
year-over-year, by 3.2 percent in April 2020 to $377,500. The Greater Las Vegas Association of
Realtors reported that 9,482 existing homes sold in the first four months of 2020, a 2.2 percent
increase from the same period in 2019. The median price for existing homes increased, year-
over-year, by 3.3 percent in April 2020 to $310,000.
Hospitality statistics in Southern Nevada were profoundly impacted by the closure of the
Valley’s hotels, motels and resorts. Visitor volume in Southern Nevada was posted negative 97
percent year-over-year growth in April 2020, the most recent quarter for which data is available.
April 2020 saw 106,900 people come to Southern Nevada year-to-date, compared to 3.5 million
people visiting in April 2019.
Gaming revenue totaled $2.4 billion year-to-date in April 2020, a 31.7 percent decrease from
2019. Gaming revenue growth this year was negative 31.8 percent on the Las Vegas “Strip”,
negative 31.2 percent in Downtown Las Vegas and negative 29.5 percent on the Boulder Strip.
Commercial real estate investment sales volume in the first two quarters of 2020 was $885.4
million in 108 sales totaling 5.2 million square feet. The average price per square foot for
commercial property was $170.46, a 1.5 percent increase over the same period in 2019. The
overall cap rate for commercial space in 2020 was 6.3 percent, compared to 6.7 percent in 2019.
Sales volume decreased by 30.9 percent for industrial properties, 44.9 percent for office
properties, 50.8 percent for medical office, 59.9 percent for shopping centers and 87.4 percent
for single-tenant retail.
One can almost look at 2020 as a mad experiment in what happens to an economy when much of
it is closed for a few months. The results are quite convincing that business closures are bad for
business, with many data points so astoundingly dire as to be almost unbelievable. The closures
were made, of course, to slow the spread of COVID-19, and were successful in that. The
reopening of the economy was made to prevent a very serious economic recession. Whether the
reopening has been successful in that is as yet unknown. Economic data is not published as
quickly as one would like, especially in the current economy, but some data that has already been
released, and some anecdotal points, are encouraging. Job losses were expected to be much more
severe in May than they ultimately were. In addition, retail spending in the United States was
quite strong in May 2020. Anecdotally, we have seen more Southern Nevada resort re-openings
in June 2020 than was originally planned, presumably because demand for their services was
higher than expected. As the year proceeds, we will learn more about the nascent economic

Britton-Adamo Group/ROI Appraisal
File Number 20-086 53
recovery of 2020. In the meantime, there is little to do but get back to work.”
Overall, the current economic and market conditions warrant limited new speculative
development and new development should not be started at the present time, unless financial
commitments (i.e. long term lease, build-to-suit, etc.) can be obtained prior to construction.
Therefore, the highest and best use of the subject, assuming a vacant site, is to hold for
development, until economic conditions warrant construction. The timeframe for development is
uncertain.
Conclusion of Highest and Best Use “As If Vacant”
Based on the above analysis, the highest and best use of the site “as if vacant” is to hold for an
industrial development, when market conditions dictate.

Britton-Adamo Group/ROI Appraisal
File Number 20-086 54
HIGHEST AND BEST USE AS IMPROVED
The discussion that follows will examine the highest and best use of the subject given the
existing building improvements. The same factors used to analyze the highest and best use as if
vacant (i.e. physically possible, legally permissible, financially feasible, and maximally
productive are considered.
Physically Possible
The subject is an existing single-tenant industrial building built with 2,400 square feet of
building area. The building includes roughly 480 square feet of office space, which is generally
and open space, and a 2-fixture restroom. The public entrance to the building is situated at the
north side of the building structure via a single glass doorway. There is a grade level doorway
along the west side of the building providing access to the warehouse area from the enclosed
storage yard, and one additional grade level door along the north side of the building. The yard
area includes nearly 2,000 square feet.
In addition, the warehouse also includes roughly 400 square feet of open mezzanine storage
space above the office. The mezzanine is accessed via an interior stairwell in the warehouse.
Due to the quality of the space, it is not considered as part of the total building area is a
beneficial characteristic. The improvements were constructed in 2006 and are in an overall good
condition.
The indicated effective site coverage ratio based on the building foot print is 34% (2,400 SF ÷
7,000 SF) and floor area ratio is 34% (2,400 SF ÷ 7,000 SF) , and based on the design and layout
of the property, there is no excess land available for additional building structures or an
expansion of the existing building improvements. Overall, the improvements are a physically
possible use of the site.
Legally Permissible
The subject appears to satisfy the development restrictions imposed by the IL zoning ordinance
in regards to building setbacks, parking and landscaping requirements. Overall, the
improvements are a legally permissible use.
Financially Feasible/Maximally Productive
The subject improvements are designed for a single-tenant use that has a need for both office and
warehouse areas. The property includes an enclosed storage yard area. There are two grade-
level doorways, one of which accesses the yard directly. The property is occupied by an owner-
user, typical for the market area. Based on the characteristics of the building will likely continue
as a single-tenant building. There are a number of industrial buildings in the immediate market
area that have been generally designed in a similar fashion and are being utilized by a variety of

Britton-Adamo Group/ROI Appraisal
File Number 20-086 55
industrial users similar to the subject. The configuration of the building shell is considered to
maximize the site. The office area is functional for a variety of light industrial users.
Given the physically and legally possible uses, an industrial building is considered to generate
the greatest return to the land. This use is considered well suited to the location of the subject
and the local market. The size and layout of the improvements are well suited to a variety of
prospective end users. It is unlikely that any alternative use is more financially feasible.
Conclusion of Highest and Best Use “As Improved”
The subject’s highest and best use is for the continued use as an industrial building. This
program of utilization produces the greatest return to the land component, above and beyond
alternative physically possible, legally permissible, and financially feasible uses.

Britton-Adamo Group/ROI Appraisal
File Number 20-086 56
M E T H O D O F V A L U A T I O N
Valuation Approaches
There are three standard approaches to valuing properties. These are the cost approach, the sales
comparison approach, and the income capitalization approach. The type and age of the property
and the quantity and quality of data affect the applicability of each approach for a specific
appraisal problem.
The cost approach is based upon the principle that an informed purchaser would pay no more
than the cost to produce a substitute property with the same utility as the subject property. It is
particularly applicable when the property being appraised involves relatively new improvements
which represent the highest and best use of the land or when specialized improvements are
involved and limited comparable sale data is available.
The sales comparison approach utilizes prices paid in actual market transactions of similar
properties to estimate the value of the subject. This appraisal technique is dependent upon
analyzing truly comparable sales which have occurred recently enough to reflect market
conditions relative to the time period of the subject appraisal.
The income approach is widely applied in appraising income producing properties. Anticipated
net operating income is converted to a present worth through the capitalization process. The
income approach also relies upon market data to establish current market rents and expense
levels to arrive at an expected net operating income.
The resulting indications of value from the three approaches are correlated into a final estimate
of value for the subject property. It is not always possible or practicable to use all three
approaches to value. The nature of the property being appraised, and the amount, quality, and
type of data available dictates the use of each of the three approaches.
Subject Valuation Scenario
The purpose of this appraisal is to estimate the market value “as is” of the subject property. To
estimate the current market value, the sales and income comparison approaches are utilized in
the valuation. Following the approaches, the value conclusion is reconciled by the various
conclusions from the different of the various approaches to value.
The cost approach is not considered to provide a reasonable indication of value as the current
economic conditions are such that the value of a completed office building in the market area is
below the replacement costs. In addition, potential buyers would likely not rely on this method
to value this type of property. The exclusion of the cost approach does not diminish the
credibility of the value conclusion in this appraisal. Therefore, the cost approach is not
considered necessary to the assignment. The conclusions from the sales and income approaches
are reconciled to a final value conclusion at the end of the report.

Britton-Adamo Group/ROI Appraisal
File Number 20-086 57
S A L E S C O M P A R I S O N A P P R O A C H
The Sales Comparison Approach is based upon the principle of substitution. The principle of
substitution holds that the value of a property is relative to what can be paid to acquire a
substitute property that has a similar utility and desirability within a reasonable time period.
Since two properties are rarely identical, a comparative analysis of the sales and the subject must
be made.
The Sales Comparison Approach gives consideration to actual sales of similar properties with
consideration of adjustments as previously stated. The sales prices are analyzed in a common
unit of comparison and the resulting value after any adjustments can be applied to the subject
property to provide a market value indication.
The unit of comparison used in this analysis is the price per square foot of building area, which is
the purchase price of the property divided by the total building area (SF) of the improvements.
The sales utilized are considered the best available for comparison purposes and representative
of the market activity and conditions as of the valuation date. Unless otherwise indicated, the
sales involved arm's length transactions.
Sale data used in this approach has been gathered through a search of various sources, including
CoStar, subscription databases, public records, as well as information obtained from other
appraiser and real estate professionals in the marketplace. The sales used in this analysis are
believed to be the best available for comparison purposes to the subject. A summary of the
improved sales, and a map indicating their location in comparison to the subject, is located on the
following page, and further details of the transactions are on the pages that follow.

Britton-Adamo Group/ROI Appraisal
File Number 20-086 58
IMPROVED SALES MAP AND SUMMARY TABLE
SUBJECT SALE 1 SALE 2 SALE 3 SALE 4 SALE 5 SALE 6 SALE 7
Address
1961
Whitney
Mesa Dr
112 Cassia
Wy
1975
Whitney
Mesa Dr
6041
McLeod Dr
6676
Escondido St
169 N.
Gibson Rd
517 W.
Sunset Rd
98 Corporate
Park
City/Zip Henderson
89014
Henderson
89014
Henderson
89014
Las Vegas
89120
Las Vegas
89119
Henderson
89014
Henderson
89011
Henderson
89074
Submarket Henderson Henderson Henderson Airport Airport Henderson Henderson Henderson
Sale Date - 12/9/19 3/12/20 3/26/20 6/16/20 6/26/20 9/1/20 9/25/20
Sale Price - $818,000 $410,000 $1,050,000 $1,281,540 $875,000 $1,075,000 $1,345,000
Building Size (SF) 2,400 4,368 2,400 5,026 6,045 4,616 5,800 6,515
Year Built 2006 2007 2006 2004 2020 2005 2009 2007
Condition Good Good Good Good Excellent Good Good Good
Structure Masonry
CMU
Masonry
Tilt-Up
Masonry
CMU
Masonry
CMU
Masonry
Tilt-Up
Masonry
Tilt-Up
Masonry
Tilt-Up
Masonry
Tilt-Up
Building Height 18’ 22’ 18’ 21’ 22’ 20’ 24’ 25’
Office % 20%
(1-story)
15%
(1-story)
20%
(1-story)
22%
(1-story)
14%
(1-story)
19%
(1-story)
28%
(1-story)
35%
(2-story)
Net Land Size (SF) 7,000 12,197 5,633 10,019 Common 13,939 18,731 16,553
SCR 34% 36% 43% 49% Common 33% 31% 33%
Property Rights Fee Simple Fee Simple Fee Simple Fee Simple Fee Simple Fee Simple Fee Simple Fee Simple
Financing - Market Market Market Market Market Market Market
Price per SF - $187.27 $170.83 $208.91 $212.00 $189.56 $185.34 $206.45
Yard 2,000 sf
Enclosed No Yard
1,000 sf
Enclosed
4,000 sf
Enclosed
4,000 sf
Enclosed Open Yard No Yard Open Yard
Conditions of Sale - None None None None None None None
Intended Use - Owner-User Owner-User Owner-User Owner-User Owner-User Owner-User Owner-User

Britton-Adamo Group/ROI Appraisal
File Number 20-086 59
IMPROVED SALE #1
Project Name: Black Mountain Pointe
Address: 112 Cassia Wy
Henderson 89014
Assessor’s Parcel Number: 178-14-211-015
Sale Date: 12/9/19
Document Number: 20191209:03298
Buyer: James and Karen Ticken
Seller: McBeath Holdings, LLC
Verification/Source: Listing broker: Mike DeLew - RealComm
Advisors, CoStar Group & Public Records
Sale Price: $818,000
Financing: Market
Interest Transferred: Fee Simple
Price per Square Foot: $187.27
Overall Capitalization Rate: N/A
Physical Characteristics:
Zoning: IG, Henderson
Building Area: 4,368 square feet (Clark County)
Percent Office: 15% (638 sf+/-, 1-story)
Construction Date: 2007
Basic Construction Masonry
Building Height 22 feet
Condition: Good
Land Area: 12,197 square feet
Site Coverage Ratio: 36%
Parking: 11 spaces
Comments: The property was purchased by an owner-user. No
yard. 2 GL doors.
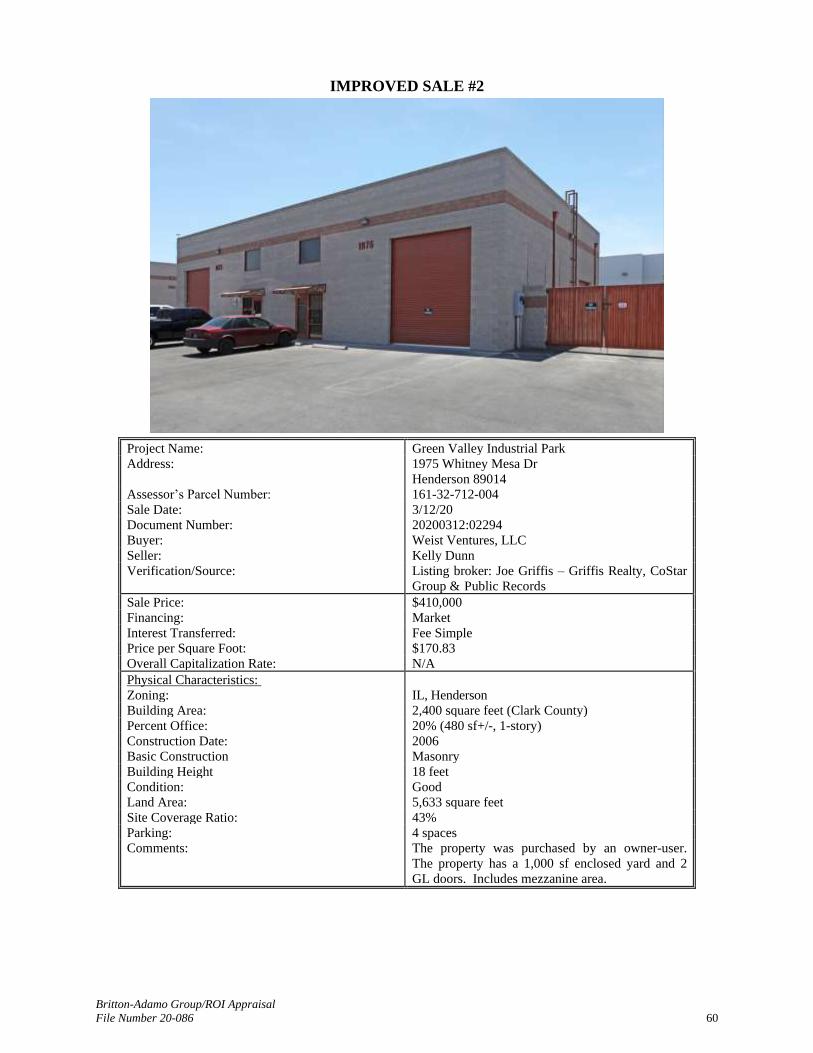
Britton-Adamo Group/ROI Appraisal
File Number 20-086 60
IMPROVED SALE #2
Project Name: Green Valley Industrial Park
Address: 1975 Whitney Mesa Dr
Henderson 89014
Assessor’s Parcel Number: 161-32-712-004
Sale Date: 3/12/20
Document Number: 20200312:02294
Buyer: Weist Ventures, LLC
Seller: Kelly Dunn
Verification/Source: Listing broker: Joe Griffis – Griffis Realty, CoStar
Group & Public Records
Sale Price: $410,000
Financing: Market
Interest Transferred: Fee Simple
Price per Square Foot: $170.83
Overall Capitalization Rate: N/A
Physical Characteristics:
Zoning: IL, Henderson
Building Area: 2,400 square feet (Clark County)
Percent Office: 20% (480 sf+/-, 1-story)
Construction Date: 2006
Basic Construction Masonry
Building Height 18 feet
Condition: Good
Land Area: 5,633 square feet
Site Coverage Ratio: 43%
Parking: 4 spaces
Comments: The property was purchased by an owner-user.
The property has a 1,000 sf enclosed yard and 2
GL doors. Includes mezzanine area.
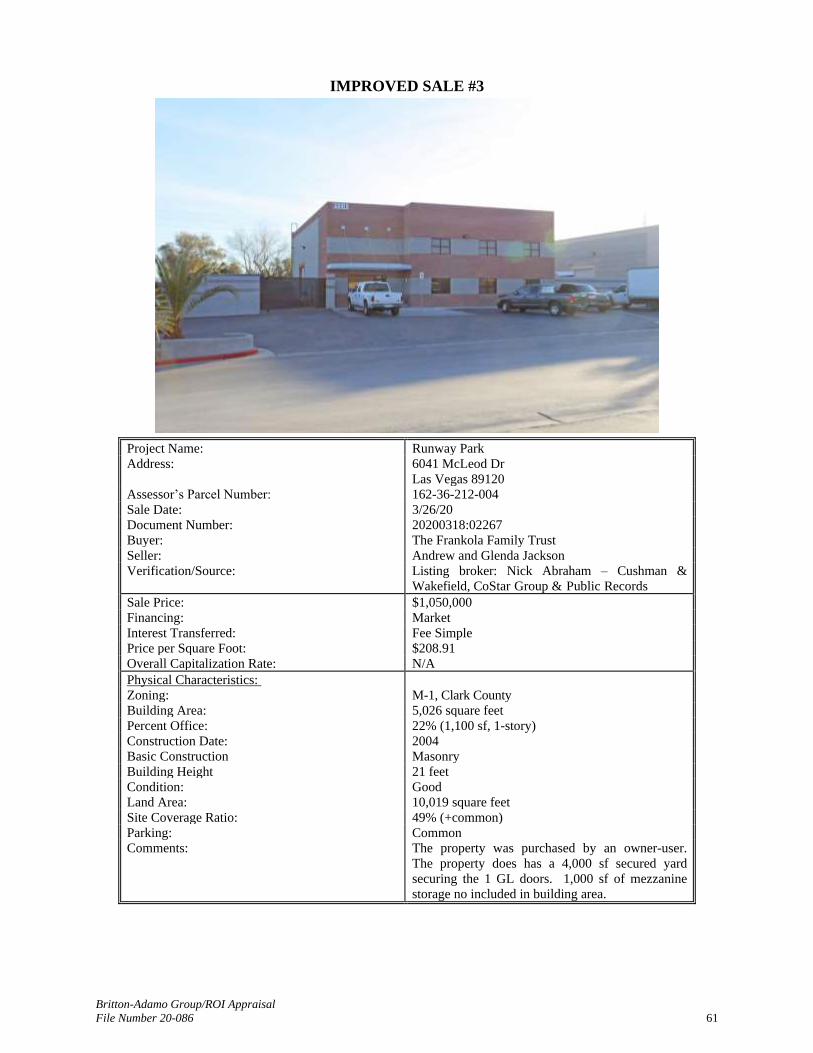
Britton-Adamo Group/ROI Appraisal
File Number 20-086 61
IMPROVED SALE #3
Project Name: Runway Park
Address: 6041 McLeod Dr
Las Vegas 89120
Assessor’s Parcel Number: 162-36-212-004
Sale Date: 3/26/20
Document Number: 20200318:02267
Buyer: The Frankola Family Trust
Seller: Andrew and Glenda Jackson
Verification/Source: Listing broker: Nick Abraham – Cushman &
Wakefield, CoStar Group & Public Records
Sale Price: $1,050,000
Financing: Market
Interest Transferred: Fee Simple
Price per Square Foot: $208.91
Overall Capitalization Rate: N/A
Physical Characteristics:
Zoning: M-1, Clark County
Building Area: 5,026 square feet
Percent Office: 22% (1,100 sf, 1-story)
Construction Date: 2004
Basic Construction Masonry
Building Height 21 feet
Condition: Good
Land Area: 10,019 square feet
Site Coverage Ratio: 49% (+common)
Parking: Common
Comments: The property was purchased by an owner-user.
The property does has a 4,000 sf secured yard
securing the 1 GL doors. 1,000 sf of mezzanine
storage no included in building area.

Britton-Adamo Group/ROI Appraisal
File Number 20-086 62
IMPROVED SALE #4
Project Name: Escondido Airport Park
Address: 6676 Escondido St
Las Vegas 89119
Assessor’s Parcel Number: 177-02-111-006
Sale Date: 6/16/20
Document Number: 20200624:01542
Buyer: Brian Robertson
Seller: Escondido Investments, LLC
Verification/Source: Listing broker: Brian Riffel – Colliers International,
CoStar Group & Public Records
Sale Price: $1,281,540
Financing: Market
Interest Transferred: Fee Simple
Price per Square Foot: $212.00
Overall Capitalization Rate: N/A
Physical Characteristics:
Zoning: M-D, Clark County
Building Area: 6,045 square feet (Clark County)
Percent Office: 14% (1-story)
Construction Date: 2020
Basic Construction Masonry
Building Height 22 feet
Condition: Excellent
Land Area: 23,522 square feet
Site Coverage Ratio: Common
Parking: Common
Comments: The property was purchased by an owner-user.
Attached building. The property has an enclosed
yard of roughly 4,000 sf and 1 GL door.
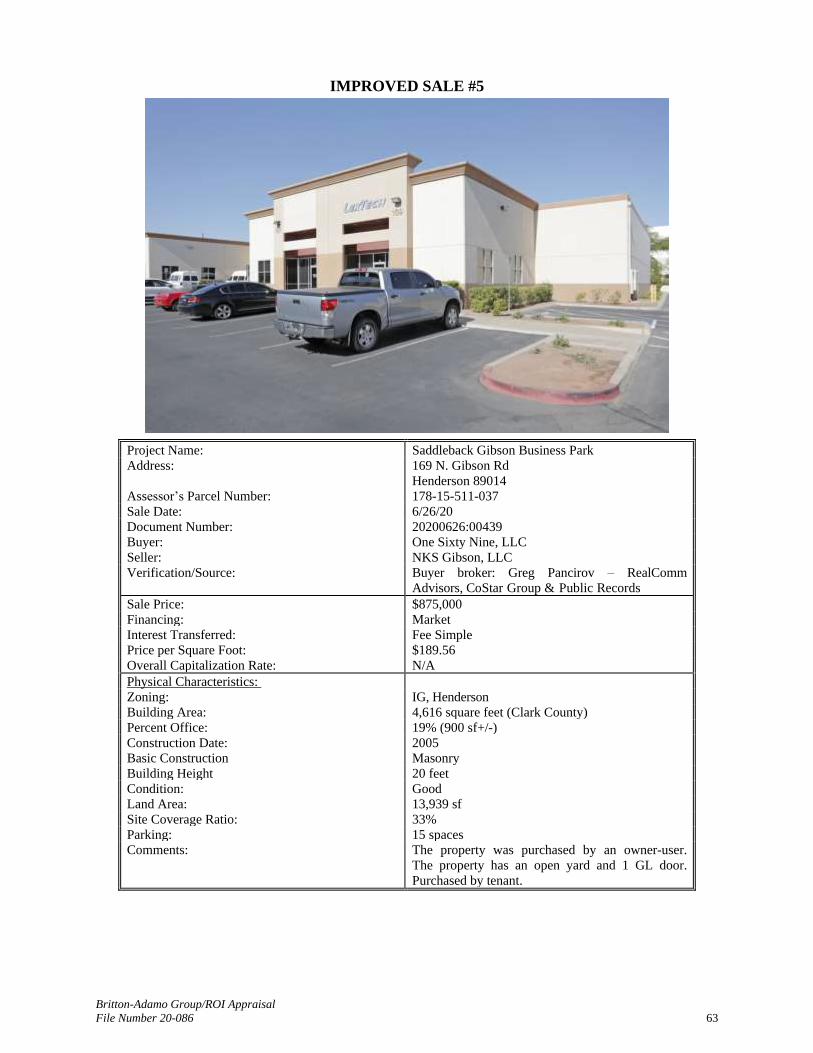
Britton-Adamo Group/ROI Appraisal
File Number 20-086 63
IMPROVED SALE #5
Project Name: Saddleback Gibson Business Park
Address: 169 N. Gibson Rd
Henderson 89014
Assessor’s Parcel Number: 178-15-511-037
Sale Date: 6/26/20
Document Number: 20200626:00439
Buyer: One Sixty Nine, LLC
Seller: NKS Gibson, LLC
Verification/Source: Buyer broker: Greg Pancirov – RealComm
Advisors, CoStar Group & Public Records
Sale Price: $875,000
Financing: Market
Interest Transferred: Fee Simple
Price per Square Foot: $189.56
Overall Capitalization Rate: N/A
Physical Characteristics:
Zoning: IG, Henderson
Building Area: 4,616 square feet (Clark County)
Percent Office: 19% (900 sf+/-)
Construction Date: 2005
Basic Construction Masonry
Building Height 20 feet
Condition: Good
Land Area: 13,939 sf
Site Coverage Ratio: 33%
Parking: 15 spaces
Comments: The property was purchased by an owner-user.
The property has an open yard and 1 GL door.
Purchased by tenant.
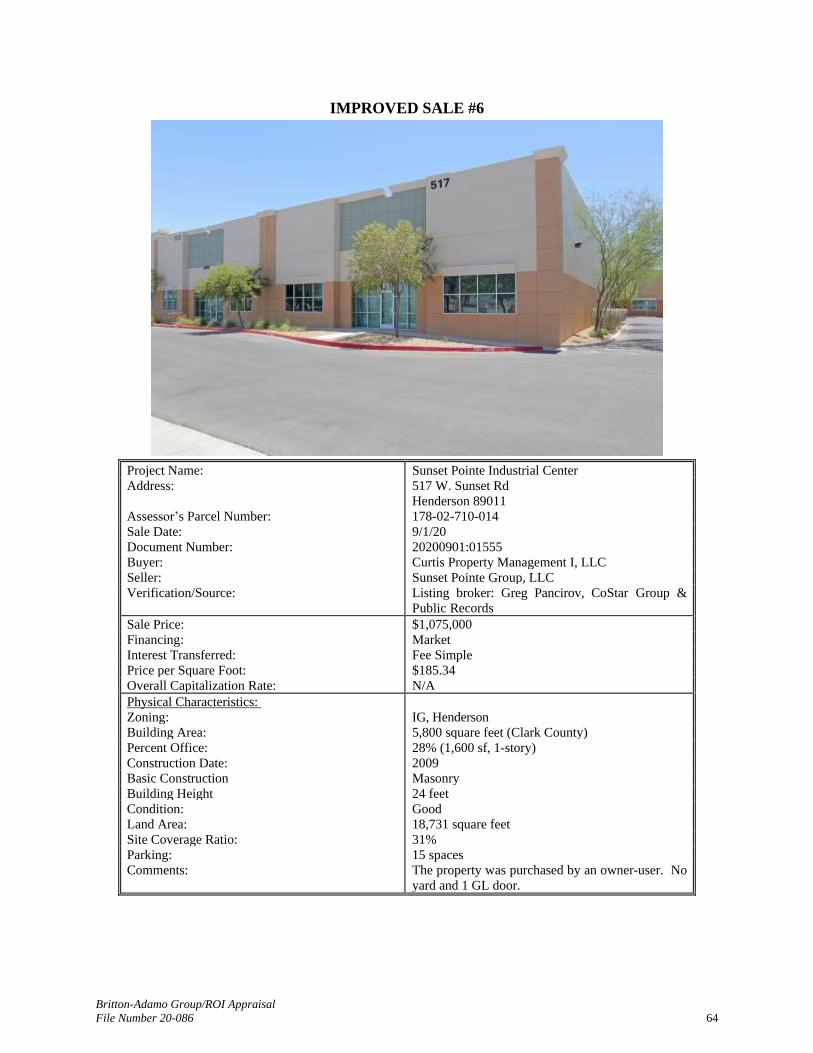
Britton-Adamo Group/ROI Appraisal
File Number 20-086 64
IMPROVED SALE #6
Project Name: Sunset Pointe Industrial Center
Address: 517 W. Sunset Rd
Henderson 89011
Assessor’s Parcel Number: 178-02-710-014
Sale Date: 9/1/20
Document Number: 20200901:01555
Buyer: Curtis Property Management I, LLC
Seller: Sunset Pointe Group, LLC
Verification/Source: Listing broker: Greg Pancirov, CoStar Group &
Public Records
Sale Price: $1,075,000
Financing: Market
Interest Transferred: Fee Simple
Price per Square Foot: $185.34
Overall Capitalization Rate: N/A
Physical Characteristics:
Zoning: IG, Henderson
Building Area: 5,800 square feet (Clark County)
Percent Office: 28% (1,600 sf, 1-story)
Construction Date: 2009
Basic Construction Masonry
Building Height 24 feet
Condition: Good
Land Area: 18,731 square feet
Site Coverage Ratio: 31%
Parking: 15 spaces
Comments: The property was purchased by an owner-user. No
yard and 1 GL door.

Britton-Adamo Group/ROI Appraisal
File Number 20-086 65
IMPROVED SALE #7
Project Name: Gibson Industrial Park
Address: 98 Corporate Park Dr
Henderson 89074
Assessor’s Parcel Number: 178-15-611-039
Sale Date: 9/25/20
Document Number: 20200925:01612
Buyer: G& Investments, LLC
Seller: Jack Close
Verification/Source: Buyer broker: Andrew Levy – ERA Brokers,
CoStar Group & Public Records
Sale Price: $1,345,000
Financing: Market
Interest Transferred: Fee Simple
Price per Square Foot: $206.45
Overall Capitalization Rate: N/A
Physical Characteristics:
Zoning: IG, Henderson
Building Area: 6,515 square feet (Clark County)
Percent Office: 35% (2-story good office)
Construction Date: 2007
Basic Construction Masonry
Building Height 25 feet
Condition: Good
Land Area: 16,553 sf
Site Coverage Ratio: 33% (5,548 sf)
Parking: 12 spaces
Comments: The property was purchased by an owner-user.
The property has an open yard and 1 GL door.
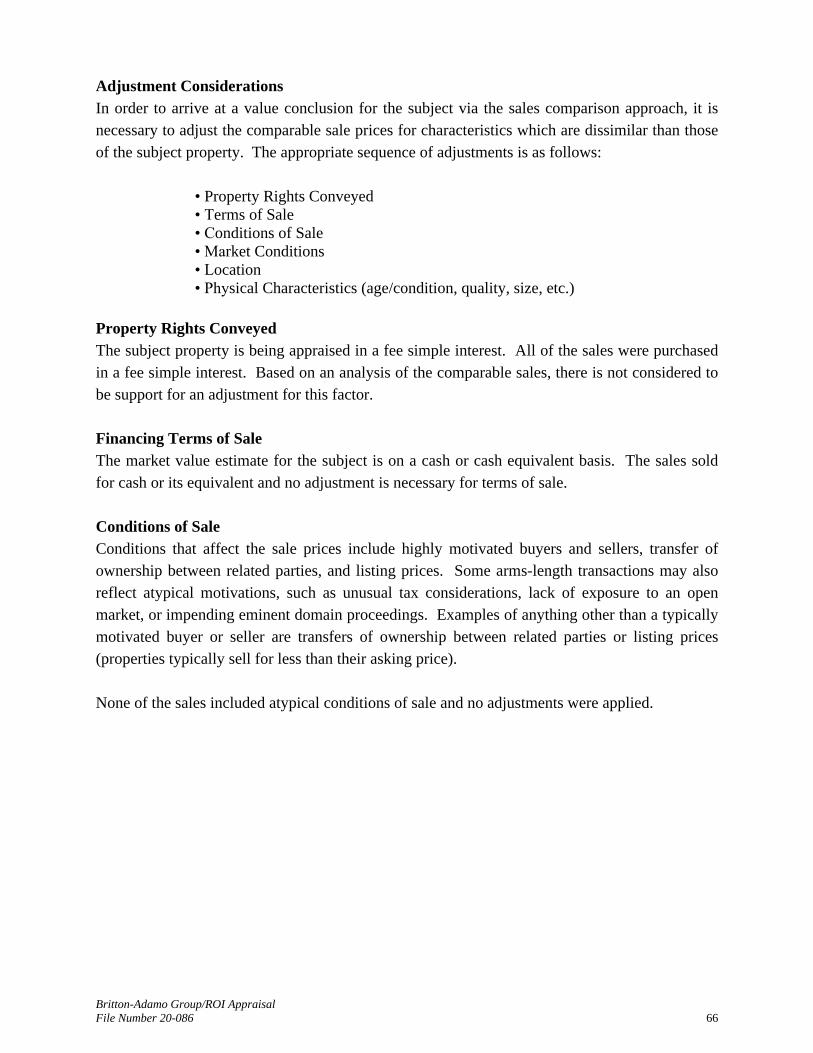
Britton-Adamo Group/ROI Appraisal
File Number 20-086 66
Adjustment Considerations
In order to arrive at a value conclusion for the subject via the sales comparison approach, it is
necessary to adjust the comparable sale prices for characteristics which are dissimilar than those
of the subject property. The appropriate sequence of adjustments is as follows:
• Property Rights Conveyed
• Terms of Sale
• Conditions of Sale
• Market Conditions
• Location
• Physical Characteristics (age/condition, quality, size, etc.)
Property Rights Conveyed
The subject property is being appraised in a fee simple interest. All of the sales were purchased
in a fee simple interest. Based on an analysis of the comparable sales, there is not considered to
be support for an adjustment for this factor.
Financing Terms of Sale
The market value estimate for the subject is on a cash or cash equivalent basis. The sales sold
for cash or its equivalent and no adjustment is necessary for terms of sale.
Conditions of Sale
Conditions that affect the sale prices include highly motivated buyers and sellers, transfer of
ownership between related parties, and listing prices. Some arms-length transactions may also
reflect atypical motivations, such as unusual tax considerations, lack of exposure to an open
market, or impending eminent domain proceedings. Examples of anything other than a typically
motivated buyer or seller are transfers of ownership between related parties or listing prices
(properties typically sell for less than their asking price).
None of the sales included atypical conditions of sale and no adjustments were applied.

Britton-Adamo Group/ROI Appraisal
File Number 20-086 67
Market Conditions
The sales discovered occurred since December of 2019, within one year from the effective date
of value. The average vacancy trends and average lease rate trends for industrial space since the
respective sale dates is provided in the following tables.
Recent Industrial Trends
The number of sales of industrial properties in Las Vegas has remained relatively stable in the
past few years with capitalization rates declining since 2016. This data is summarized in the
following table.
PwC Real Estate Investor Survey

Britton-Adamo Group/ROI Appraisal
File Number 20-086 68
Occupancy Trends
Market 2Q2019 2Q2020 Avg. 1 Year Trend
Henderson 96.4% 98.0% 2%
Total 96.5% 94.8% -2%
Average Lease Rate Trends
Market 2Q2019 2Q2020 Avg. 1 Year Trend
Henderson $0.77 $0.80 4%
Total $0.74 $0.71 -4%
Source: Colliers Real Estate Market Report
Based on the potential effects of current pandemic as well as recent market trends, there is
evidence of stagnation and potential decline in certain commercial industries. The above data is
primarily reflective of industrial investment property trends however, the subject includes an
owner-user type product, which is a higher demand product considering competitive SBA rates
and scarcity in the market. Although there were some varying trends over the previous year,
there is limited support for a specific adjustment for this factor.
Location
The subject property is located within a secondary industrial area of the Henderson submarket.
All of sales are located within the subject’s immediate area as identified in the following table.
SUBJECT SALE 1 SALE 2 SALE 3 SALE 4 SALE 5 SALE 6 SALE 7
Address 1961 Whitney
Mesa Dr
112 Cassia
Wy
1975 Whitney
Mesa Dr
6041 McLeod
Dr
6676
Escondido St
169 N. Gibson
Rd
517 W. Sunset
Rd
98 Corporate
Park
City/Zip Henderson
89014
Henderson
89014
Henderson
89014
Las Vegas
89120
Las Vegas
89119
Henderson
89014
Henderson
89011
Henderson
89074
Submarket Henderson Henderson Henderson Airport Airport Henderson Henderson Henderson
Avg Rent $0.80 $0.80 $0.80 $0.81 $0.81 $0.80 $0.80 $0.80
Comparability - Sl. Superior Similar Sl. Superior Sl. Superior Sl. Superior Sl. Superior Sl. Superior
Sales 1, 5, 6 and 7 are located within the City of Henderson however, are within the primary
industrial area with superior accessibility. Based on an analysis of the comparable sales, there is
support for some downward consideration. It is noted a slightly varying adjustment is applied to
Sale 6 based on its specific location characteristics.
Sale 2 is located in the subject’s development and no adjustment is applied.
Sales 3 and 4 are located in the Airport submarket. Based on an analysis of the comparable
sales, there is support for downward adjustments to be applied.

Britton-Adamo Group/ROI Appraisal
File Number 20-086 69
Physical Characteristics
Physical characteristics that are considered include size, access/exposure, improvement
age/condition, office build-out, quality and other factors.
Size
The subject property has a total building area of 2,400 square feet. Typically, larger buildings
sell for a lower price per square foot than smaller buildings, and vice versa. The following table
delineates the size and overall comparability to the subject.
SUBJECT SALE 1 SALE 2 SALE 3 SALE 4 SALE 5 SALE 6 SALE 7
Building Size (SF) 2,400 4,368 2,400 5,026 6,045 4,616 5,800 6,515
Comparability - Sl. Inferior Similar Sl. Inferior Sl. Inferior Sl. Inferior Sl. Inferior Sl. Inferior
Based on an analysis of the comparable sales, although there were noted differences in size, there
was support for a limited adjustment within this size range.
Age/Condition
The subject property was completed in 2006 and is considered to be in good condition. The
following table delineates the conditions and overall comparability to the subject.
SUBJECT SALE 1 SALE 2 SALE 3 SALE 4 SALE 5 SALE 6 SALE 7
Year Built 2006 2007 2006 2004 2020 2005 2009 2007
Condition Good Good Good Good Excellent Good Good Good
Comparability - Similar Similar Similar Superior Similar Similar Similar
Adjustments were applied based on their respective conditions.
Office Build-Out
The subject property includes 20% office space. The office area is functional for a variety of
light industrial users.
All of the other sales include between 14% and 35% office space. Upward adjustments at a base
of $60 per square foot for the tenant improvements is applied to the comparables up to 40%.
This figure is a portion of the cost derived from comparable cost information as well as Marshall
Valuation figures Interior Industrial Office (Section 14, Page 35).

Britton-Adamo Group/ROI Appraisal
File Number 20-086 70
The following table provides the calculation for these adjustments.
Subject Sale 1 Sale 2 Sale 3 Sale 4 Sale 5 Sale 6 Sale 7
Build Out 20% 15% 20% 22% 14% 19% 28% 35%
% ∆ - 5% 0% -2% 6% 1% -8% -15%
Office Cost/sf - $60 $60 $60 $60 $60 $60 $60
Adj. Cost/SF - $3.00 $0.00 ($1.20) $3.60 $0.60 ($4.80) ($9.00)
Price/SF - $187.27 $170.83 $208.91 $212.00 $189.56 $185.34 $206.45
% Adjustment - 2% 0% -1% 2% 0% -3% -4%
Based on the estimated adjustments, the calculation appears to be reasonable.
Quality
The subject property includes a free-standing, masonry construction with an 18-foot building
height and two grade-level doors. The subject includes a small enclosed yard along the west side
of the building. The following table delineates the quality of the construction of the sales and
overall comparability to the subject.
SUBJECT SALE 1 SALE 2 SALE 3 SALE 4 SALE 5 SALE 6 SALE 7
Construction Masonry
CMU
Masonry
Tilt-Up
Masonry
CMU
Masonry
CMU
Masonry
Tilt-Up
Masonry
Tilt-Up
Masonry
Tilt-Up
Masonry
Tilt-Up
Building Height 18’ 22’ 18’ 21’ 22’ 20’ 24’ 25’
Type Free Standing Inline
(Sl. Inferior) Free Standing Free Standing Attached Attached Attached Free Standing
Roll-up Doors GL Door GL Door GL Door GL Door GL Door GL Door GL Door GL Door
Yard 2,000 sf
Enclosed
No Yard
(Sl. Inferior)
1,000 sf
Enclosed
4,000 sf
Enclosed
(Superior)
4,000 sf
Enclosed
(Superior)
Open Yard No Yard
(Sl. Inferior) Open Yard
Comparability - Inferior Similar Superior Superior Similar Sl. Inferior Similar
Sale 1 includes an inline industrial condo unit and based on an analysis of the comparables, this
factor is rated as slightly inferior.
Slight adjustments were applied for variations in yard size.
There are additional slight additional variations noted between the properties, however, based on
an analysis of the comparable sales, there is not considered to be support for a specific
adjustment for this factor.
Site Coverage
The site coverage ratio of a property is the size of building footprint in relation to the size of the
parcel. A low site coverage ratio indicates that there is a greater amount of land available for
parking, landscaping, access or additional building improvements. Therefore, a property with a
lower site coverage ratio has a greater amount of land associated with each square foot of
building area which tends to increase the value per square foot.

Britton-Adamo Group/ROI Appraisal
File Number 20-086 71
The subject property has a site coverage ratio 34%. All of the sales vary in site coverage ratios
ranging from 31% to 49%. This factor is partially considered in the variations in yard size and
no additional adjustments were warranted.
Other
There were no other physical characteristics of the sales that warranted adjustments in
comparison to the subject property.
IMPROVED SALES ADJUSTMENT GRID
Element of Sale Sale Sale Sale Sale Sale Sale
Comparison 1 2 3 4 5 6 7
Sale Price 818,000$ 410,000$ 1,050,000$ 1,281,540$ 875,000$ 1,075,000$ 1,345,000$
Building 4,368 2,400 5,026 6,045 4,616 5,800 6,515
Price per Sq. Ft. 187.27$ 170.83$ 208.91$ 212.00$ 189.56$ 185.34$ 206.45$
Property Rights Adj. 0% 0% 0% 0% 0% 0% 0%
Adjusted Price 187.27$ 170.83$ 208.91$ 212.00$ 189.56$ 185.34$ 206.45$
Financing Terms Adj. 0% 0% 0% 0% 0% 0% 0%
Adjusted Price 187.27$ 170.83$ 208.91$ 212.00$ 189.56$ 185.34$ 206.45$
Conditions of Sale Adj. 0% 0% 0% 0% 0% 0% 0%
Adjusted Price 187.27$ 170.83$ 208.91$ 212.00$ 189.56$ 185.34$ 206.45$
Market Conditions Adj. 0.00% 0.00% 0.00% 0.00% 0.00% 0.00% 0.00%
Adjusted Price 187.27$ 170.83$ 208.91$ 212.00$ 189.56$ 185.34$ 206.45$
Location -5% 0% -5% -5% -5% -2.5% -5%
Physical Adjustments
Size 0% 0% 0% 0% 0% 0% 0%
Age/Condition 0% 0% 0% -5% 0% 0% 0%
Interior Office 2% 0% -1% 2% 0% -3% -4%
Quaility 5% 0% -5% -5% 0% 2.5% 0%
Site Coverage 0% 0% 0% 0% 0% 0% 0%
Overall Adjustment 2% 0% -11% -13% -5% -3% -9%
INDICATED PRICE/SF 191.02$ 170.83$ 185.93$ 184.44$ 180.08$ 179.78$ 187.87$
Britton-Adamo Group/ROI Appraisal
File Number 20-086 72
Listings
In addition to the comparable sales, properties that are available for sale were used to provide
additional information regarding the current market conditions for the subject. Typically, list
prices reflect a perceived maximum price that can be obtained for a property and will most often
be above the eventual sales price that a property commands in the marketplace. The listings
therefore tend to provide a value indication that lies towards the higher end of the range. In
addition, listed properties do not reflect closed transactions that have occurred at a price that was
agreed upon by a willing buyer and a willing seller, a criterion that is inherent in the definition of
market value. Although the listings do provide additional support for the value conclusions
herein, they should be given only secondary weight in the conclusion of value. The current
listings do provide an indication of the current market perception for a property type however,
they have been presented primarily for informational purposes and are used solely as additional
support for the conclusions rendered in this appraisal.
Improved Listings Summary Table
LISTING 1 2
Address 1963 Whitney
Mesa Dr 6560 Spencer St
City/Zip Henderson
89014
Las Vegas
89119
Submarket Henderson Airport
List Price $675,000 $975,000
Building Size (SF) 3,560 4,832
Year Built 2006 2008
Percent Office 12%
(360 sf mezz) 11%
Price per SF $189.61 $201.78
Comparability Similar Similar
Listings of vacant properties of below 5,000 square feet throughout the Henderson and Airport
submarkets were researched. Two primary listings were provided, ranging in asking prices of
$190 and $202 per square foot, one of which is located within the subject’s development. These
listings are provided as support for the value conclusion stated herein.
Britton-Adamo Group/ROI Appraisal
File Number 20-086 73
Conclusion – Sales Comparison Approach
Seven comparable sales have been presented in order to estimate the market value of the subject
property. After adjustments, the sales indicated a range in values from $170.83 to $191.02 per
square foot, with six of the seven sales ranging between $179.78 and $191.02 per square foot.
The adjusted sales indicate a mean and median at $183 and $184 per square foot, respectively.
Sale 2 is located within the subject’s development and is most comparable to the subject.
Although specific adjustments were not applied, it is noted the property includes a smaller yard
area, is an attached building and is not sprinklered. Considering these inferior factors, a
conclusion above the adjusted price at $170.83 per square foot is considered reasonable.
Conclusion
A number of brokers in the Las Vegas market area were consulted over the previous month in
regard to the impact of the current market conditions with consideration given to COVID-19.
Although there is limited comparable data to develop a specific adjustment, there is a generally
consensus of some negative impacts to commercial real estate, specifically investment products.
We are aware of transactions that have been renegotiated a slightly lower rates of 5%-10%, rate
reductions by property managers as a concession to existing tenants of 5%, and deferred rent
payments.
The subject, however, includes a single-tenant product, and the most probable buyer is an owner-
user. As previously discussed, owner-user products are at a higher demand due to competitive
SBA rates and scarcity in the market. Although a specific market conditions adjustment was not
applied, these positive trends are considered. In addition, the warehouse also includes roughly
400 square feet of an open mezzanine storage space. Due to the quality of the space, it is not
considered as part of the total building area however, is a beneficial characteristic.
Based upon the provided market data, with consideration given to the benefit of various
characteristics, there is considered support for a value conclusion at $180 per square foot.
The market value estimate through the sales comparison approach is indicated below.
Building Area: 2,400 square feet
Estimated Unit Value x $180/sf
Indicated Market Value $432,000
Rounded $430,000
Market Value “As Is” via Sales Capitalization Approach – Fee Simple $430,000

Britton-Adamo Group/ROI Appraisal
File Number 20-086 74
I N C O M E C A P I T A L I Z A T I O N A P P R O A C H
The income capitalization approach analyzes a property’s ability to generate net income. The
subject is analyzed using techniques similar to those a potential purchaser-investor might
employ. The income approach to value is based on the economic principle of anticipation, which
states that value is created by the expectation of benefits to be derived in the future. A typical
method of valuing income-producing property is known as capitalization which converts an
anticipated income stream into value. The real estate market has shown that there is a direct
relationship between income and value of a property.
There are two ways to convert the estimated annual net operating income into a value indication,
direct capitalization of the projected first year net income and discounted cash flow analysis of
net income over a holding period. The typical methodology used by buyers for properties of
similar in size and tenancy to the subject is the direct capitalization methodology. This analysis
converts the subject’s net operating income estimate into a value indication by applying an
overall capitalization rate derived from market transactions and investor expectations.
In the direct capitalization analysis, the potential gross income is first estimated. A deduction is
applied for vacancy and collection loss, which is based on market data and investor expectations,
and results in the effective gross income. Deductions are then recognized for various operating
expenses, if necessary, to indicate the net operating income. The net operating income is then
converted to an estimate of value for the subject using the market-derived overall capitalization
rate.
The subject property is owner-operated. Within this portion of the analysis, the potential gross
income of the subject is estimated via market rents from comparable properties. After projecting
the potential gross income, the vacancy and collection loss factor is deducted, and then the
projected annual expenses. The resulting annual net operating income is estimated. The
estimated market rent of the subject is estimated by an analysis of rents being achieved at similar
properties. Market rent, or economic rent, is the rental income that a property would most likely
command in the open market.
Comparable Rentals
The rents used in this analysis are of comparable industrial properties in the immediate market
area that are considered competitors to the subject property. The rent comparables are used to
estimate the market rent for the subject property. Included on the following pages are details of
the rent comparables and a map indicating their location in relation to the subject property. The
comparables provide indications of the current market conditions for rents of similar space in the
market area.

Britton-Adamo Group/ROI Appraisal
File Number 20-086 75
RENT COMPARABLES MAP AND SUMMARY TABLE
# Location/Name Size (SF) Rental Rate per SF
per Month Comments
1
Green Valley Industrial Park
1963 Whitney Mesa Dr
Henderson 89014
3,560 $0.83
NNN
Tenant: Confidential; Lease start 10/27/20; 1-yr term renewal; 12%
office; Built in 2006; 16’ Clear Ht; 2 GL Doors; Masonry; Est $0.15
CAM fee, Endcap w/yard
Paul Callister – Albright Callister & Assoc
2
Sandhill Airport Park
6320 S. Sandhill Rd, #8
Las Vegas 89120
2,160 $0.85
NNN
Tenant: Confidential; Leased 2/1/20; 32-mo lease; 3% annual incr;
~45% office; Built in 1997; 16’ Clear Ht; 1 GL Doors; Masonry;
$0.17 CAM fee, Inline; No yard
Alex Stanisic – Colliers International
Multiple units leased in previous year at $0.85-$0.95/sf
3
Patrick Airport Center
6045 Harrison Dr
Las Vegas 89120
2,866 $0.80
NNN
Tenant: Bryan Lindsey; Leased 10/7/20; 38-mo lease; 3% annual incr;
28% office; Built in 2000; 18’ Clear Ht; 1 GL Doors; Masonry; $0.20
CAM fee, Inline, No yard
Alex Stanisic – Colliers International
4
Whitney Mesa Business Park
1860 Whitney Mesa Dr
Henderson 89014
3,472 $0.80
NNN
Available space; 2+yr lease; 3% annual incr; N/A office; Built in
2006; 21’ Clear Ht; 1 GL Doors; Masonry; $0.26 CAM fee, Inline, No
yard
Karen Kohler – Executive Realty Services
5
Nu-West Business Park
5460 Desert Point Dr
Las Vegas 89118
7,504 $1.10
NNN
Tenant: Confidential; Leased 8/21/20; 2-yr lease; 3% annual incr;
47% office (High-end); Built in 1995; 16’ Clear Ht; 3 GL Doors;
Masonry; $0.10 CAM fee, Enclosed yard
Chip Madsen – Ivan Sher Group
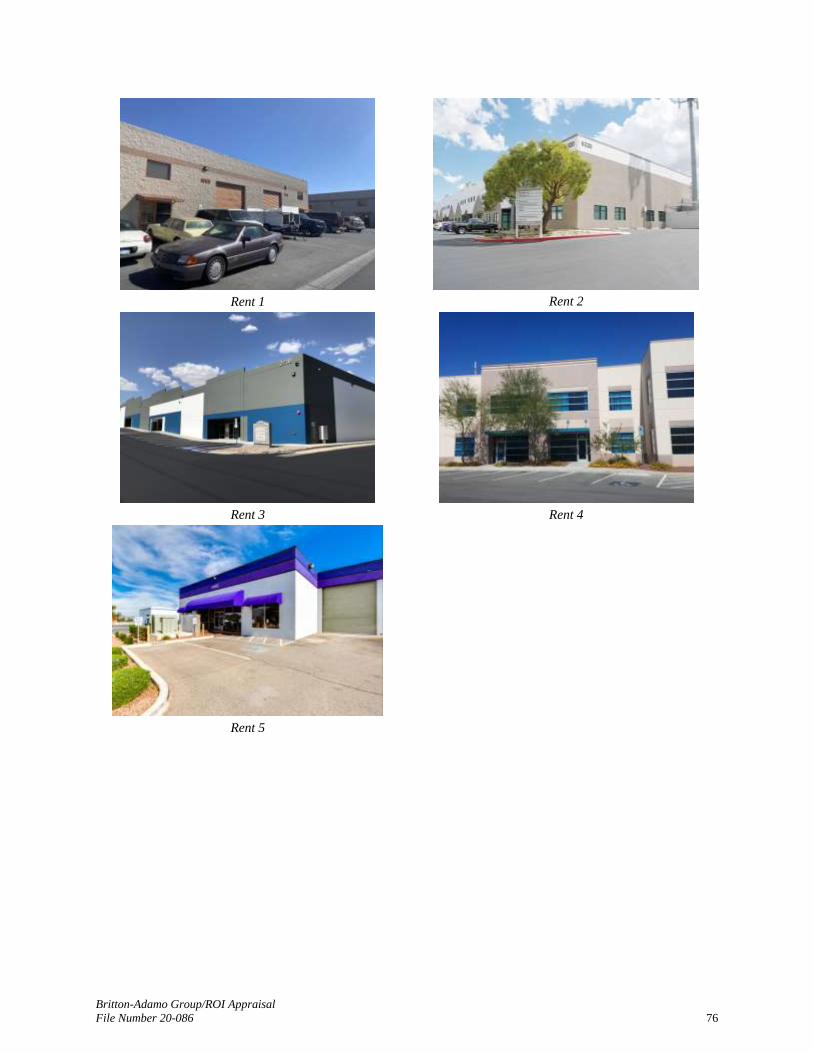
Britton-Adamo Group/ROI Appraisal
File Number 20-086 76
Rent 1
Rent 2
Rent 3
Rent 4
Rent 5

Britton-Adamo Group/ROI Appraisal
File Number 20-086 77
Analysis of Comparables
The rents used in this analysis are of similar quality industrial buildings that are considered
competitive to the subject property. They are comparable properties that have general similar
locations and physical characteristics to the subject. There are a number of variables between the
subject and the comparables which are analyzed and adjustments made to the lease rates.
The comparables were compared to the subject for a variety of factors including, expense basis
(i.e. triple net, gross etc.), lease terms, as well as a variety of location and physical characteristics
(quality and condition of tenant improvements, size, access, visibility, age/condition).
Consideration was given to each of these factors and based on a comparative analysis,
adjustments were applied where there were substantial differences. The following discussion
describes the adjustments made to the rent comparables.
Discussion of Rent Comparables
Location
A The subject property is located within a secondary industrial area of the Henderson submarket.
All of sales are located within the subject’s immediate area as identified in the following table.
SUBJECT RENT 1 RENT 2 RENT 3 RENT 4 RENT 5
City/Zip Henderson
89014
Henderson
89014
Las Vegas
89120
Las Vegas
89120
Henderson
89014
Las Vegas
89118
Submarket Henderson Henderson Airport Airport Henderson Southwest
Avg Rent $0.80 $0.80 $0.81 $0.81 $0.80 $0.86
Comparability - Similar Sl. Superior Sl. Superior Similar Superior
Rents 1 and 4 are located in the subject’s development or adjacent development and no
adjustment is applied.
Rents 2 and 3 are located in the Airport submarket. Based on an analysis of the comparable
sales, there is support for downward adjustments to be applied.
Rent 5 is located in the primary industrial area of the Southwest submarket, a superior submarket
area.
Size
The subject property has a total building area of 2,400 square feet. The following table
delineates the size and overall comparability to the subject.
SUBJECT RENT 1 RENT 2 RENT 3 RENT 4 RENT 5
Building Size (SF) 2,400 3,560 2,160 2,866 3,472 7,504
Comparability - Similar Similar Similar Similar Sl. Inferior
Based on an analysis of the comparables, nominal adjustments are applied.
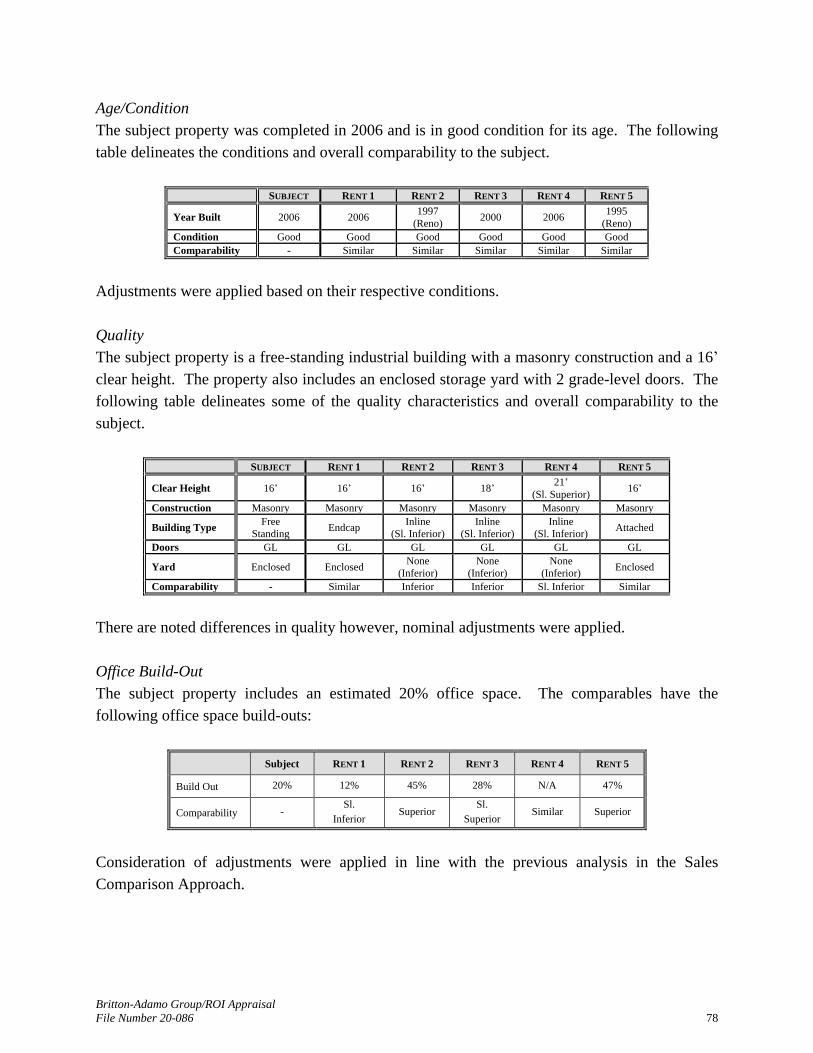
Britton-Adamo Group/ROI Appraisal
File Number 20-086 78
Age/Condition
The subject property was completed in 2006 and is in good condition for its age. The following
table delineates the conditions and overall comparability to the subject.
SUBJECT RENT 1 RENT 2 RENT 3 RENT 4 RENT 5
Year Built 2006 2006 1997
(Reno) 2000 2006
1995
(Reno)
Condition Good Good Good Good Good Good
Comparability - Similar Similar Similar Similar Similar
Adjustments were applied based on their respective conditions.
Quality
The subject property is a free-standing industrial building with a masonry construction and a 16’
clear height. The property also includes an enclosed storage yard with 2 grade-level doors. The
following table delineates some of the quality characteristics and overall comparability to the
subject.
SUBJECT RENT 1 RENT 2 RENT 3 RENT 4 RENT 5
Clear Height 16’ 16’ 16’ 18’ 21’
(Sl. Superior) 16’
Construction Masonry Masonry Masonry Masonry Masonry Masonry
Building Type Free
Standing Endcap
Inline
(Sl. Inferior)
Inline
(Sl. Inferior)
Inline
(Sl. Inferior) Attached
Doors GL GL GL GL GL GL
Yard Enclosed Enclosed None
(Inferior)
None
(Inferior)
None
(Inferior) Enclosed
Comparability - Similar Inferior Inferior Sl. Inferior Similar
There are noted differences in quality however, nominal adjustments were applied.
Office Build-Out
The subject property includes an estimated 20% office space. The comparables have the
following office space build-outs:
Subject RENT 1 RENT 2 RENT 3 RENT 4 RENT 5
Build Out 20% 12% 45% 28% N/A 47%
Comparability - Sl.
Inferior Superior
Sl.
Superior Similar Superior
Consideration of adjustments were applied in line with the previous analysis in the Sales
Comparison Approach.

Britton-Adamo Group/ROI Appraisal
File Number 20-086 79
Conclusion – Market Rent
To estimate the economic rent for the subject property, five rent comparables in the market area
were presented and compared to the subject property. The rent comparables utilized in this
analysis were of various light industrial facilities in the subject’s market area. A qualitative
analysis is summarized in the following table based on the previous discussion of comparables.
RENT COMPARABLES ADJUSTMENT GRID
Element of Rent Rent Rent Rent Rent
Comparison 1 2 3 4 5
Monthly Rent/SF $0.83 $0.85 $0.80 $0.80 $1.10
Market Conditions Adj. -$ -$ -$ -$ -$
Adjusted Annual Rent $0.83 $0.85 $0.80 $0.80 $1.10
Conditions of Lease Adj. -$ -$ -$ -$ -$
Adjusted Annual Rent $0.83 $0.85 $0.80 $0.80 $1.10
Lease Basis Adjustment -$ -$ -$ -$ -$
Adjusted Annual Rent $0.83 $0.85 $0.80 $0.80 $1.10
Location Similar Sl. Superior Sl. Superior Similar Superior
Physical Adjustments
Size Similar Similar Similar Similar Sl. Inferior
Age/Condition Similar Similar Similar Similar Similar
Quality Similar Inferior Inferior Sl. Inferior Similar
Office Build Out Sl. Inferior Superior Sl. Superior Similar Superior
Other Similar Similar Similar Similar Similar
Overall Adjustment Sl. Inferior Similar Sl. Inferior Sl. Inferior Superior
INDICATED ANNUAL RENT $0.83 $0.85 $0.80 $0.80 $1.10
After consideration of lease structure, the majority comparables indicate rates of near $0.85 to
$0.90 per square foot. Considering the subject’s office ratio, a conclusion toward the higher end
of the range is considered reasonable.
Market Rent Conclusion
Based on an analysis of the information provided and recent submarket rent trends, a market rate
at $0.875 per square foot is considered reasonable.
Vacancy and Collection Loss
The next step in the analysis is to estimate the loss in income due to vacancy and collection
losses. The estimated vacancy rate reflects what can be expected over the typical holding period
for a property. The Las Vegas industrial market has experienced a general rise in vacancy in
recent years with the most current estimate at 5.2% of total inventory. The subject is located in
the Henderson submarket, which had a vacancy of 2.0% in the 2nd Quarter 2020.

Britton-Adamo Group/ROI Appraisal
File Number 20-086 80
The following table identifies the trends for industrial uses in the market area derived from
CoStar:
Data published in the PwC 3rd Quarter 2020 Real Estate Investor Survey for National Warehouse
Market indicates underlying vacancy and credit loss by survey respondents ranging from 0 % to
10%. The following delineates the individual survey classes.
The following table indicates the occupancy trends in the industrial market in relation to the
increases in the office employment market from Colliers International 2nd Quarter Industrial
Market survey.
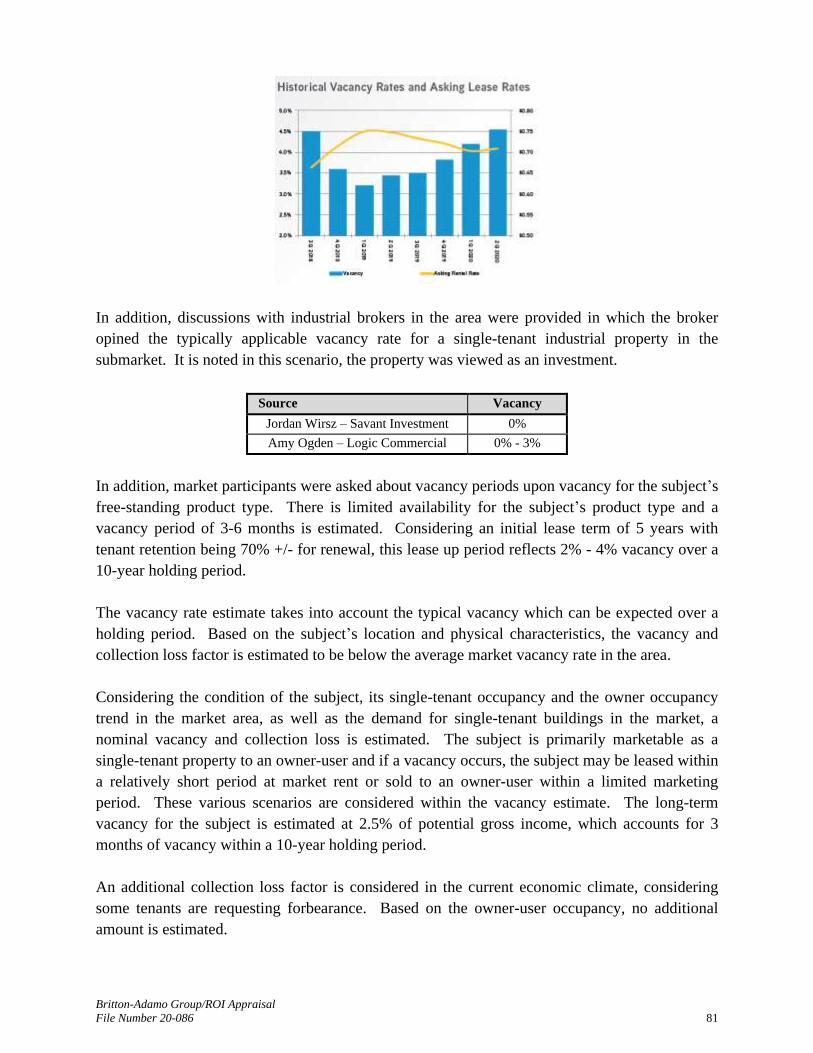
Britton-Adamo Group/ROI Appraisal
File Number 20-086 81
In addition, discussions with industrial brokers in the area were provided in which the broker
opined the typically applicable vacancy rate for a single-tenant industrial property in the
submarket. It is noted in this scenario, the property was viewed as an investment.
Source Vacancy
Jordan Wirsz – Savant Investment 0%
Amy Ogden – Logic Commercial 0% - 3%
In addition, market participants were asked about vacancy periods upon vacancy for the subject’s
free-standing product type. There is limited availability for the subject’s product type and a
vacancy period of 3-6 months is estimated. Considering an initial lease term of 5 years with
tenant retention being 70% +/- for renewal, this lease up period reflects 2% - 4% vacancy over a
10-year holding period.
The vacancy rate estimate takes into account the typical vacancy which can be expected over a
holding period. Based on the subject’s location and physical characteristics, the vacancy and
collection loss factor is estimated to be below the average market vacancy rate in the area.
Considering the condition of the subject, its single-tenant occupancy and the owner occupancy
trend in the market area, as well as the demand for single-tenant buildings in the market, a
nominal vacancy and collection loss is estimated. The subject is primarily marketable as a
single-tenant property to an owner-user and if a vacancy occurs, the subject may be leased within
a relatively short period at market rent or sold to an owner-user within a limited marketing
period. These various scenarios are considered within the vacancy estimate. The long-term
vacancy for the subject is estimated at 2.5% of potential gross income, which accounts for 3
months of vacancy within a 10-year holding period.
An additional collection loss factor is considered in the current economic climate, considering
some tenants are requesting forbearance. Based on the owner-user occupancy, no additional
amount is estimated.
Britton-Adamo Group/ROI Appraisal
File Number 20-086 82
Operating Expenses
The market rent for the subject is estimated on a triple net basis, wherein all operating expenses
are passed through to the tenants in the form of a monthly CAM expense. The property owner
will incur some expenses including legal, accounting, entity fees, and other miscellaneous items.
Consideration is also given for reserves for replacements of short lived items. Each of these is
discussed below.
Non-Reimbursable Expenses
Non-reimbursable expenses are typically expenses including legal, accounting, entity fees, and
other miscellaneous items. Total non-reimbursable expenses are estimated at 2.0% of effective
gross income.
Reserves for Replacements
The replacement reserve category is an annual allowance that typically provides a liquid reserve
account with the funds to be used in the replacement of those items whose useful life is shorter
than that of the building. These short-lived items deteriorate and will eventually need to be
replaced. For example, flooring typically is replaced after five to seven years, heating and air
conditioning units may need to be replaced every 7-12 years, driveway and parking areas may
need to be resurfaced every 3-5 years.
Reserves may or may not be a line item on a typical operating statement because different
owners/managers tend to handle this category in different ways. Some property owners may
actually set up a reserve account to handle a replacement of major items. Other owners pay for
the items as they need to be replaced. If an item is replaced as the need arises, the expense is
typically accounted for as a capital improvement in the repair and maintenance category.
Reserves for the subject property are estimated 1% of EGI.
Overall Rate Analysis
Capitalization is the process of converting a net income stream into an indication of value. There
are several types of capitalization methods that can be utilized to derive a value via the Income
Approach. The direct capitalization method converts a single year's net operating income
estimate into a value indication by applying an overall capitalization rate. Capitalization rates
can be derived from various techniques. These include deriving a rate from the comparable
improved sales, utilizing a band of investment with mortgage and equity components as well as
using a debt coverage formula, and rate surveys.
This portion of the income approach to value will estimate the value of the subject property by
applying a capitalization rate to the net operating income. This method may utilize an overall
rate based upon market extracted capitalization rates from sales comparable or it may use overall
rates reflecting the relationships between mortgage rates and equity investment rates. The

Britton-Adamo Group/ROI Appraisal
File Number 20-086 83
overall capitalization rate (OAR) is the ratio of net operating income as of the date of sale to the
cash equivalent sales price. The OAR is a reflection of the present value of anticipated future
benefits.
Capitalization rates can be derived from various techniques. These include deriving a rate from
the comparable improved sales, utilizing a band of investment with mortgage and equity
components as well as using a debt coverage formula, and rate surveys.
Sales Data
The most desirable way to estimate an overall capitalization rate is through market extraction
from sales of comparable properties. Sales of single-tenant industrial building in Las Vegas over
the previous 18 months, in a similar investment class of up to $5,000,000, which provided an
overall capitalization rate estimate were used in the analysis. The following table shows the
overall capitalization rates from all of the sales.
Capitalization Rates from Industrial Properties
Date Property Address Sales Price Building SF Cap Rate
3/22/2019 2545 W Cheyenne Ave $1,218,750 8,000 6.85%
3/29/2019 2821 E Alexander Rd $1,850,000 14,920 6.30%
4/1/2019 611 Cape Horn Dr $1,712,000 12,300 6.47%
4/10/2019 5875 Service Ct $1,292,000 8,078 6.00%
4/11/2019 4625 W Nevso Dr $1,825,000 16,926 6.89%
4/24/2019 4480-4500 Delancey Dr $1,600,000 15,400 5.75%
5/31/2019 2057 E Maule Ave $3,945,000 28,910 5.46%
6/7/2019 3720 W Oquendo Rd $4,000,000 19,690 5.50%
6/17/2019 420 Mark Leany Dr $830,000 5,400 7.50%
7/1/2019 2919 N Lamb Blvd $1,100,000 9,134 6.98%
8/7/2019 229 W Foster Ave $535,000 5,024 6.41%
11/7/2019 3852 E Post Rd $1,275,000 8,330 7.50%
11/19/2019 4530 Calimesa St $2,925,000 25,875 5.70%
12/13/2019 2008 Sunset Rd $715,000 4,960 6.70%
3/16/2020 6635 W Badura Ave $985,000 5,800 4.98%
3/23/2020 6210 Annie Oakley Dr $2,300,000 14,814 7.00%
6/22/2020 4210 N Lamb Blvd $490,000 4,342 6.27%
6/22/2020 4615 N Lamb Blvd $2,685,000 13,625 6.50%
The rates range from 4.98% to 7.50%, with a mean and median of 6.38% and 6.44%. There have
a limited number of truly comparable sales of industrial facilities in the market area over the
previous 2 years, which sold as investment properties with capitalization rates. Considering the
market data and the characteristics of the subject, a rate toward the lower end of the range near
6.0% - 6.5%, is considered reasonable.

Britton-Adamo Group/ROI Appraisal
File Number 20-086 84
Broker Interviews
Brokers were specifically interviewed about the potential capitalization rates for the subject with
the leasing scenario with the physical characteristics of similar industrial properties. The results
of the interviews are reported in the following table.
Source Cap Rate
Amy Ogden – Logic Commercial 5.75% - 6.5%
Elizabeth Moore – Real Comm Solutions 5.5%- 6.5%
Ben Millis – Avison Young 5.5%- 6.5%
Sean Zaher - CBRE 5.5% - 6.0%
Dean Willmore – Colliers International 5.5% - 6.0%
The subject includes a good quality industrial building. Based on all of the information, the
overall capitalization rate for the subject, based on the sales information, is estimated at the
center of the range at 6.0%.
National Survey
The PwC Real Estate Investor Survey, a leading national real estate survey published by
PriceWaterhouseCoopers, provides indications of the anticipated discount rates for a variety of
sectors of the real estate investment market. The survey is based on the anticipated market
conditions by active participants in this sector. The information from the most recent survey (3rd
Quarter 2020) is summarized below.
PWC Real Estate Investor Survey
Based on the characteristics of the subject, a market rate slightly above the national average near
5.0% - 6.0%, is considered reasonable.

Britton-Adamo Group/ROI Appraisal
File Number 20-086 85
CoStar Market Analytics
The following tables reflect current and forecast cap rate trends as of the date of value, for
general industrial spaces, derived from CoStar Analytics.
Industrial Market
Primary weight is placed on the overall Las Vegas submarket, which reflects an average cap rate
near or slightly above 5.6%.
CBRE Cap Rate Survey
The CBRE Cap Rate Survey was also provided from the 2nd Half of 2019. The following table
summarizes their result from the Las Vegas Market:
Capitalization Rate for Industrial Properties in Las Vegas
Period Type Class A Class B Class C
2nd Half 2019 Stabilized 4.75%-5.25% 5.25%-5.75% 6.5%-7.25%
Based on the characteristics of the subject and the characteristics of the subject property, a
capitalization rate at the high end of Class B properties at 5.75%, is considered reasonable for the
subject.

Britton-Adamo Group/ROI Appraisal
File Number 20-086 86
Colliers Cap Rate Survey
The Colliers Cap Rate Survey was also provided from the 2nd Quarter 2020. The following table
summarizes their result from the Las Vegas Market:
Based on the characteristics of the subject and the characteristics of the subject property, a
capitalization rate near the most recent full statistics year, 2019, average of 6.3%, is considered
reasonable for the subject.
Overall Capitalization Rate Conclusion
The overall capitalization rates derived from the various techniques were as follows:
Market Data 6.0% - 6.5%
Broker Interviews 6.0%
PwC Survey 5.0% - 6.0%
CoStar Market Analytics 5.6%
CBRE Survey 5.75%
Colliers Survey 6.3%
The subject includes a single-tenant, good quality industrial building. Considering the specific
characteristics of the subject and market rate, a market rate of 6.0% is utilized.

Britton-Adamo Group/ROI Appraisal
File Number 20-086 87
Conclusion of Income Capitalization Approach
A summary of the income capitalization approach for the subject property is located in the table
that follows.
INCOME APPROACH SUMMARY
DIRECT CAPITALIZATION
INCOME
Potential Gross Income (Annual)
1961 Whitney Mesa Dr 2,400 SF @ 0.875$ per Mo (Market) 25,200$
Total 25,200$
LESS: Vacancy & Collection Loss @ 2.5% 630$
Effective Gross Income 24,570$
EXPENSES
Non-Reimbursable Expenses 2.0% of EGI 491$
Reserves 1.0% of EGI 246$
Total Expenses 737$
NET OPERATING INCOME 23,833$
DIVIDED BY OVERALL RATE 6.00%
INDICATED MARKET VALUE 397,215$
FINAL CONCLUSION OF VALUE 400,000$
Market Value “As Is” via Income Capitalization Approach – Fee simple $400,000
Britton-Adamo Group/ROI Appraisal
File Number 20-086 88
R E C O N C I L I A T I O N
The market value “as is” indicated by the three separate valuation approaches, are as follows:
Market Value
Cost Approach N/A
Sales Comparison Approach $430,000
Income Approach $400,000
Sales Comparison Approach
In the sales comparison approach, seven sales of similar properties, which have sold recently,
were compared to the subject property. After consideration of all adjustments, there is good
support for a value conclusion near $180 per square foot. The adjustments utilized were
considered reasonable and the resulting value conclusion is considered well supported. The
industrial market includes primarily owner/user properties within the subject’s size range. A
typical buyer of the subject property would likely be an owner/user who would rely on sales of
comparable facilities in a purchase decision. This is considered to be the driving mechanism for
valuation. Considering the quality of the data, the conclusion from this approach is considered to
be a reliable indication of value. Therefore, the conclusion from the sales comparison approach
is considered the primary approach in the final conclusion.
Income Approach
The subject property is developed as a single-tenant industrial building, valued in the fee simple
interest. Based on discussions with the brokers in the immediate area, there has been
increased interest in leasing for the available properties in the market area. A buyer of this type
of property may potentially be an investor, however, would likely base a purchase decision on
sales in the market area. Considering the potential market for the subject, the income approach
method is believed to provide a reasonable indication of value although is given limited weight
in the final market value conclusion.
Reconciliation and Conclusion
Considering the strengths and weaknesses of each of the approaches, the sales comparison
approach is given primary weight with minimal weight given to the income capitalization
approach in the reconciliation.
Based on an analysis of the market data, a market value inline with the current sales price and the
conclusion via the sales comparison approach of $430,000 is considered to be reasonable. The
conclusion equates to a cap rate of 5.9%, based on the potential gross rent, without consideration
given to vacancy or expenses, which is also a reasonably utilized methodology in the
marketplace. This is considered to further support the value conclusion.

Britton-Adamo Group/ROI Appraisal
File Number 20-086 89
After considering all of the available facts and subject to the underlying assumptions and limiting
conditions contained herein, the “as is” market value of the fee simple interest in the subject
property, as of September 25, 2020 is:
FOUR HUNDRED THIRTY THOUSAND DOLLARS
$430,000

Britton-Adamo Group/ROI Appraisal
File Number 20-086 90
Exposure/Marketing Time
The definitions of exposure time and marketing time are included below.
Marketing Time “An opinion of the amount of time it might take to sell a real or personal property interest at the concluded
market value level during the period immediately after the effective date of an appraisal. Marketing time
differs from exposure time, which is always presumed to precede the effective date of an appraisal.”
Source: Appraisal Institute, The Dictionary of Real Estate Appraisal, 6th ed. (Chicago: Appraisal Institute, 2015)
Exposure Time “The estimated length of time that the property interest being appraised would have been offered on the
market prior to the hypothetical consummation of a sale at market value on the effective date of the appraisal.
Comment: Exposure time is a retrospective opinion based on an analysis of past events assuming a
competitive and open market.”
Source: Uniform Standards of Professional Appraisal Practice (USPAP)
Current appraisal guidelines require an estimate of the exposure time be included with an
estimate of market value, whereas an estimate of marketing time is not required unless required
for the specific appraisal assignment. Since exposure time is considered a “retrospective
marketing period”, and always precedes the date of value, it is necessary to examine past market
conditions, prior to the effective date of value. Support for this estimate is obtained by an
analysis of the exposure times associated with sales of comparable properties that have occurred
prior to the date of value of the appraisal. There are also a number of companies, organizations
and governmental agencies that provide marketing and sales information for different properties
and/or market segments. The sales data will typically include the time that was required to
market and close the sale of property, which is equivalent to the exposure time.
Published surveys of market participants regarding opinions of the perceived time necessary to
market and sell a property, as of the current date, are good sources for the estimate of marketing
time. These are estimates of time to sell a property from the date of value of the appraisal, and
looking into the future. Therefore, these opinions are considered indications as to the marketing
time of a property, from the current date until the sale of a property. In addition, discussions
with individual real estate professionals and property owners are used as the basis for an estimate
of the marketing time.
Based on an analysis of comparable sales, published statistics, and information and opinions
obtained from market participants, the appropriate exposure time that would have been
associated with the sale of the subject property at the concluded value on the date of value, is 12
months. Based on the current and projected trends in the market, the marketing time for the
subject is estimated at 12 months.

Britton-Adamo Group/ROI Appraisal
File Number 20-086 91
I N S U R A B L E V A L U E
In addition, the client requested the estimated insurable value of the subject. The Insurable
Value of the subject improvements is based on the estimated construction costs. The estimate
does not include site development costs or items such as contractor’s profit, contingency or
overhead. I have provided a brief analysis of the cost approach within the following section.
Marshall Cost Estimate
The Marshall and Swift Publication Company publish a nationally recognized cost manual. The
published costs include all direct costs for the base structure and interior finish, as well as
indirect costs of plans, specifications, and building permits, including engineer’s and architects
fees, normal fees and interest on construction funds during the construction period, sales tax on
materials, contractor’s overhead and profit, including workers compensation, fire and liability
insurance, and unemployment insurance.
The costs determined by the Marshall Valuation Service program include all direct construction
costs plus many indirect cost items. According to the Marshall Valuation Cost reference manual,
the subject improvements are classified as a good quality Class "C" Light Industrial/Warehouse
Shell Building, with average quality Industrial, Interior Office Space (Section 14, Page 35).
These costs were based on the estimates from the Marshall & Swift Cost Manual which includes
some indirect costs which would not be included within the insurable value. I have estimated
this figure to be approximately 10 percent of the total cost.
The following table outlines the estimated insurable value for the subject improvements.
Building Type Shell Building Interior Office
Class C N/A
Type Average Average
Section/Page 14/35 14/35
Estimated Base Cost/SF – Shell $53.50 $56.50
Sprinklers $5.00 N/A
Building Height (18’) 1.086 N/A
Current Cost Multiplier 1.04 1.04
Local Multiplier 1.15 1.15
Indicated Cost/SF $75.98 $67.57
Size (sf) 2,400 480
Indicated Cost: $182,359 $32,436
Total: $214,795
Insurable Value @ 90% $193,315
Rounded $195,000

Britton-Adamo Group/ROI Appraisal
File Number 20-086 92
V A L U A T I O N O F E Q U I P M E N T
Subject Identification
The subject business personal property consists of various crematory furniture, fixtures, and
equipment owned by County Funeral Services, LLC with a physical address of 1961 Whitney
Mesa Drive, Henderson, Nevada 89014. All the capital equipment is located at the above-
referenced address.
Ownership History and Title of Appraised Items
It is our understanding that the items appraised are owned and belong to County Funeral
Services, LLC, owner of the aforementioned industrial building. As of the effective date, the
owner operates at the subject property. We assume the items appraised are under said ownership
with a clear and marketable title as of the effective date of valuation.
Purpose of the Appraisal
The purpose of the valuation is to form of the Fair Market Value in Continued Use of the subject
business personal property. The interest valued is the fee simple interest. The Fair Market Value
estimate in this report is the value of the business personal property as if the business is in
operation and the earnings were in support the reported value, without verification.
Property Rights Appraised
The interest that is the subject of this valuation is the fee simple estate, defined below.
Fee Simple Estate “Absolute ownership unencumbered by any other interest or estate, subject only to the
limitations imposed by the governmental powers of taxation, eminent domain, police power, and escheat.”
Source: Appraisal Institute, The Dictionary of Real Estate Appraisal, 6th ed. (Chicago: Appraisal Institute, 2015)
Standard and Premise of Value
We have developed an opinion of the fair market value in continued use with assumed earnings
of the subject business personal property. With regard to the valuation of personal property, the
most widely recognized and accepted standard of value is fair market value. It is the standard
that applies to nearly all federal and state tax matters, such as estate taxes, gift taxes, inheritance
taxes, income taxes, and ad valorem taxes. It is also the legal standard of value in many other
valuation situations and is considered appropriate to use for the purpose of this valuation.
Fair Market Value Defined
Fair Market Value in Continued Use with Assumed Earnings is defined in Valuing Machinery
and Equipment; The Fundamentals of Appraising Machinery and Technical Assets, Third
Edition, issued by the American Society of Appraisers (ASA), as:
“is an opinion, expressed in terms of money, at which the property would change hands between
a willing buyer and a willing seller, neither being under any compulsion to buy or to sell and
both having reasonable knowledge of relevant facts, as of a specific date and assuming that the
business earnings support the value reported, without verification.”

Britton-Adamo Group/ROI Appraisal
File Number 20-086 93
We have developed this appraisal on a premise of fair market value in continued use with
assumed earnings, independent of earnings generated by the business. It is important to note the
appraiser has not verified the past, present, or hypothetical future income-generating
performance of the business to which the assets were a part. Such an analysis may yield varying
results and impact the amount a willing buyer would pay for the assets and/or business they
support.
The following additional definitions are relevant to this report:
Reproduction Cost New: The cost of reproducing a new replica of a property on the basis of
current prices with the same or closely similar materials.
Replacement Cost New: The current cost of a similar new property having the nearest equivalent
utility as the property being appraised.
Depreciation: A loss in value from all causes, including factors of physical deterioration,
functional or technical obsolescence, and external obsolescence.
We have also provided opinion of Orderly Liquidation Value. The definition of this type of value
is as follows:
Effective Date of Valuation/Inspection Date
The effective date of “as is” market value corresponds to the date of inspection and is September
25, 2020.
Date of Report
The date of this report is September 29, 2020.

Britton-Adamo Group/ROI Appraisal
File Number 20-086 94
Scope of the Appraisal
For an appraisal assignment, an appraiser must identify the problem to be solved, determine and
perform the scope of work necessary to develop credible assignment results; and disclose the
scope of work in the report. The scope of work for this appraisal included, but was not limited
to, the following:
• Communications and agreement with the client regarding the intended use and intended users of the
appraisal as outlined in this report
• A brief description of the personal property being appraised and its environment
• A personal visit to the location of the subject personal property being appraised and a visual inspection of
most items appraised.
• Research and analysis of reproduction, replacement costs and going market price of items based on
provided information and availability of data
• A search for and analysis of comparable personal property to the items appraised
• Consideration of the application of the cost and/or sales comparison approaches, and applying the relevant
valuation methods as deemed appropriate (A more detailed explanation of the methods and techniques used
in the individual approaches is in the body of this report)
• Reconciliation of the applied approach to value for the final value conclusion
• Preparation of an appraisal report based on our findings
The Extent to Which the Property is Identified
The subject personal property was identified during site visits by Luke J. Adamo on September 25,
2020. Most of the items appraised were visually inspected and, if available, identifying features
were noted which would prove pertinent to the valuation. A specific equipment list was not
provided; however, the appraiser has relied upon his personal inspection and property owner’s
description to identify the majority of the appraised items.
The Extent to Which Tangible Property is Inspected
A visual inspection was made to verify that the personal property items exist and to visually
estimate condition. Most of the items were observed and are assumed to be in good working order,
though a detailed mechanical inspection was not made. The various items being appraised are
photographed, when possible. When applicable, items appraised which were not present during the
site visits are identified via photographs and/or information provided by the client and/or
employees of the company. Any items that were not present for visual inspection are assumed to
be in good working condition.
Britton-Adamo Group/ROI Appraisal
File Number 20-086 95
The Type and Extent of Data Researched
We have relied on one or more of the following sources of information for the development of this
appraisal:
• National and regional economic data – Key Value Data, Site to do Business, editions of
the Appraisal Journal, and/or other information sources deemed to be reliable
• Industry data –Key Value Data, IBISWorld, and/or other information sources deemed to
be reliable
• Company information – provided by the client and/or employees or associates
• Valuation data sources – one or more of the following sources: the original equipment
manufacturer (if possible), dealers and brokers of like equipment, published catalogs and
guides of similar equipment, and/or various online sources of information.
We have described the characteristics of the subject items to the best of our ability. Some of the
subject items may be purchased and/or sold with a variety of peripheral attachments, support items,
and other amenities, which could affect value. It is not always possible to know of such factors
that may or may not exist. Therefore, it is assumed the subject items do in fact have basic qualities
needed for operation and may have associated peripheral amenities. All information provided to us
is believed to be accurate but not warranted or guaranteed.
Extent of Research into Physical or Economic Factors that Could Affect Value
National, regional, and industry-related economic factors have been researched using a variety of
sources. The value premise, Fair Market Value in Continued Use with assumed earnings is
independent of earnings generated as part of a going concern business enterprise. It is beyond the
scope of this assignment to analyze or comment on the profitability of the subject business. If the
client has concerns regarding the business, further research on the part of the client and/or intended
users is recommended.
The Type and Extent of Analyses Applied to Arrive at Opinions or Conclusions
Three standard approaches to value include the Cost Approach, Income Approach, and Sales
Comparison Approach. The Sales Comparison Approach is utilized in the valuation of most of the
various personal property items. When comparable sales and/or listings of similar personal
property is scarce or unavailable, the Cost Approach is relied upon. The Income Approach is
seldom developed in the valuation of personal property and was not used in the valuation process.

Britton-Adamo Group/ROI Appraisal
File Number 20-086 96
Level of Trade
The subject personal property has been appraised at the following level of trade: Fair Market
Value in Continued Use with assumed earnings.
The following values representing the most common levels of trade are defined in Valuing
Machinery and Equipment: The Fundamentals of Appraising Machinery & Technical Assets,
Third Edition, by the American Society of Appraisers.
Fair Market Value is an opinion, expressed in terms of money, at which the property would
change hands between a willing buyer and a willing seller, neither being under any compulsion to
buy or to sell and both having reasonable knowledge of relevant facts, as of a specific date.
Fair Market Value – Removed is an opinion, expressed in terms of money, at which the property
would change hands between a willing buyer and a willing seller, neither being under any
compulsion to buy or to sell and both having reasonable knowledge of relevant facts, considering
removal of the property to another location, as of a specific date.
Fair Market Value in Continued Use with Assumed Earnings is an opinion, expressed in
terms of money, at which the property would change hands between a willing buyer and a willing
seller, neither being under any compulsion to buy or to sell and both having reasonable knowledge
of relevant facts, as of a specific date and assuming that the business earnings support the value
reported, without verification.
Fair Market Value – Installed is an opinion, expressed in terms of money, at which the property
would change hands between a willing buyer and a willing seller, neither being under any
compulsion to buy or sell and both having reasonable knowledge of relevant facts, considering
market conditions for the asset being valued, independent of earnings generated by the business in
which the property is or will be installed, as of a specific date.
Orderly Liquidation Value is an opinion of the gross amount, expressed in terms of money, that
typically could be realized from a liquidation sale, given a reasonable period of time to find a
purchaser (or purchasers), with the seller being compelled to sell on an as-is, where-is basis, as of a
specific date.
Forced Liquidation Value is an opinion of the gross amount, expressed in terms of money, that
typically could be realized from a properly advertised and conducted public auction, with the seller
being compelled to sell with a sense of immediacy on an as-is, where-is basis as of a specific date.
Liquidation Value in Place is an opinion of the gross amount, expressed in terms of money, that
typically could be realized from a properly advertised transaction, with the seller being compelled

Britton-Adamo Group/ROI Appraisal
File Number 20-086 97
to sell, as of a specific date, for a failed, non-operating facility, assuming that the entire facility is
sold intact.
Salvage Value is an opinion of the amount, expressed in terms of money, that may be expected for
the whole property or a component of the whole property that is retired from service for possible
use, as of a specific date.
Scrap Value is an opinion of the amount, expressed in terms of money, that could be realized for
the property if it were sold for its material content, not for a productive use, as of a specific date.
Insurance Cost New is the replacement or reproduction cost new as defined in the insurance
policy less the cost new of the items specifically excluded in the policy, as of a specific date.
Insurable Value Depreciated is the insurance replacement or reproduction cost new less
accrued depreciation considered for insurance purposes, as defined in the insurance policy or
other agreements, as of a specific date.
Overall Condition of Items Appraised
It is understood that the subject items are in Good Condition and are used consistently. Overall,
the subject items visually appear to be in Good Condition.
For reference, we have provided the reader with the following definitions of condition.
Very Good (VG)
This term describes an item of equipment in excellent condition capable of being used to its fully
specified utilization for its designated purpose without being modified and not requiring any
repairs or abnormal maintenance at the time of inspection or within the foreseeable future.
Good Condition (G)
This term describes those items of equipment which have been modified or repaired and are
being used at or near their fully specified utilization but the effects of age and/or utilization
indicate that some minor repairs may have to be made or that the item may have to be used to
some slightly lesser degree than its fully specified utilization in the foreseeable future.
Fair Condition (F)
This term describes those items of equipment which are being used at some point below their
fully specified utilization because of the effects of age and/or application and which require
general repairs and some replacement of minor elements in the foreseeable future to raise their
level of utilization to or near their original specifications.
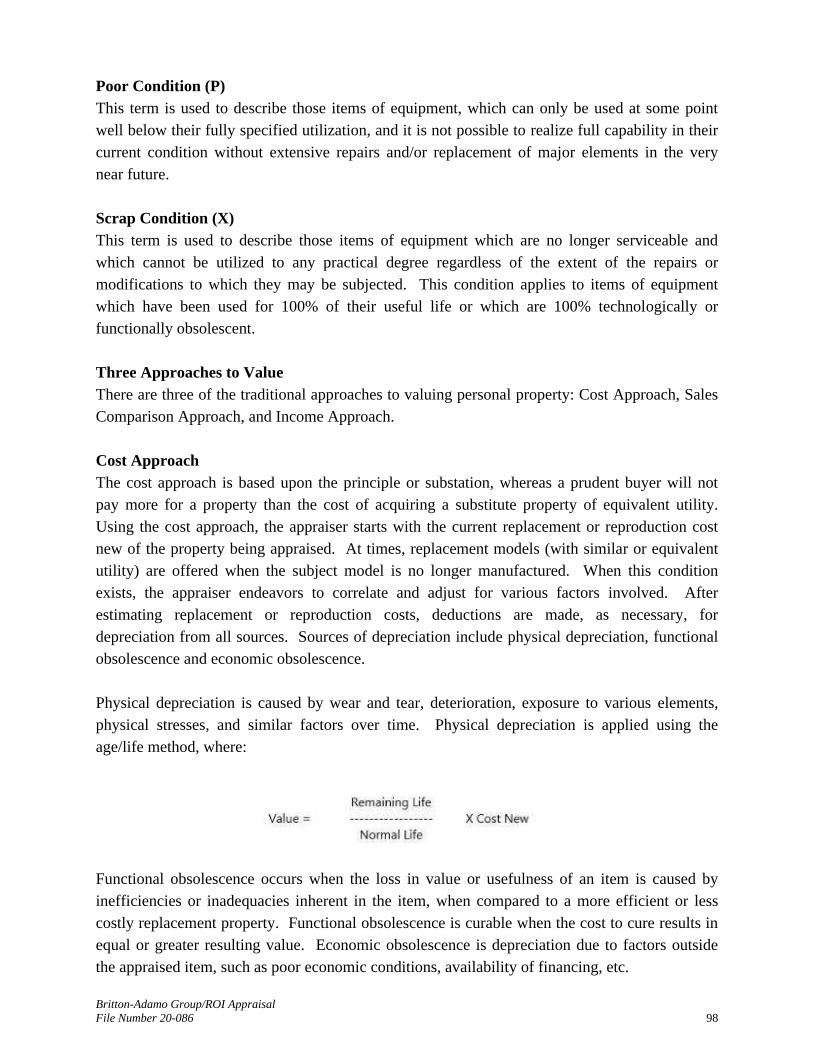
Britton-Adamo Group/ROI Appraisal
File Number 20-086 98
Poor Condition (P)
This term is used to describe those items of equipment, which can only be used at some point
well below their fully specified utilization, and it is not possible to realize full capability in their
current condition without extensive repairs and/or replacement of major elements in the very
near future.
Scrap Condition (X)
This term is used to describe those items of equipment which are no longer serviceable and
which cannot be utilized to any practical degree regardless of the extent of the repairs or
modifications to which they may be subjected. This condition applies to items of equipment
which have been used for 100% of their useful life or which are 100% technologically or
functionally obsolescent.
Three Approaches to Value
There are three of the traditional approaches to valuing personal property: Cost Approach, Sales
Comparison Approach, and Income Approach.
Cost Approach
The cost approach is based upon the principle or substation, whereas a prudent buyer will not
pay more for a property than the cost of acquiring a substitute property of equivalent utility.
Using the cost approach, the appraiser starts with the current replacement or reproduction cost
new of the property being appraised. At times, replacement models (with similar or equivalent
utility) are offered when the subject model is no longer manufactured. When this condition
exists, the appraiser endeavors to correlate and adjust for various factors involved. After
estimating replacement or reproduction costs, deductions are made, as necessary, for
depreciation from all sources. Sources of depreciation include physical depreciation, functional
obsolescence and economic obsolescence.
Physical depreciation is caused by wear and tear, deterioration, exposure to various elements,
physical stresses, and similar factors over time. Physical depreciation is applied using the
age/life method, where:
Functional obsolescence occurs when the loss in value or usefulness of an item is caused by
inefficiencies or inadequacies inherent in the item, when compared to a more efficient or less
costly replacement property. Functional obsolescence is curable when the cost to cure results in
equal or greater resulting value. Economic obsolescence is depreciation due to factors outside
the appraised item, such as poor economic conditions, availability of financing, etc.

Britton-Adamo Group/ROI Appraisal
File Number 20-086 99
Sales Comparison Approach
The sales comparison approach consists of analyzing sales and/or offering prices of similar items
to the subject items being appraised. To make the sold (or offered) items more comparable to the
subject items, a quantitative or qualitative analysis of differences that impact value is conducted.
The results of the analysis are applied to the subject items being appraised for an indication of
value. The process for the development of this approach is summarized as follows:
• Gather data on sales and/or offerings of similar items
• Determine their comparability to the subject item(s)
• Determine the appropriate units of comparison (if applicable)
• When necessary, conduct a quantitative or qualitative analysis with upward or downward consideration
based upon significant differences between the comparable and subject items
• Conclude to a value (or unit value) and apply the results to the subject item(s)
Income Approach
The income approach involves estimating the net present value of future benefits expected from
the subject items being appraised. If sufficient data is available to allocated income and
expenses to an appraised item, future benefits can be measured over a single period and
capitalized (direct capitalization) or they can be measured over multiple periods, discounted to a
present value using a discount rate (yield capitalization).
Method of Valuation for Subject Personal Property
The market approach was developed when an adequate number of comparable resale items could
be located. The cost approach was developed when similar new items could be located. When
the market approach yields no resale items, the cost approach is relied upon. The income
approach is infrequently used by appraisers of personal property and was not developed, due to
the lack of sufficient income and expense data that could be allocated to specific items appraised.

Britton-Adamo Group/ROI Appraisal
File Number 20-086 100
V A L U A T I O N A N A L Y S I S
The subject is currently being operated as a crematorium and includes specific built-in
equipment for the business operation. The primary components of the equipment include:
• Human cremator retort
• Cremains processing station
• 2 walk-in coolers
• Hydraulic lift table
• Mortuary freezer
Crematory Retort
The subject includes a human crematory retort, identified as American Crematory A-200-HT
with a 400 pound capacity. This is one of the company’s smaller units however, a market
participant indicated the cost new of the system can be upward of $120,000. According to
Marshall Section 11, Page 32 under Mortuaries/Funeral Homes, a crematory retort is identified
to have a cost range of $70,750 to $104,000. Based on the provided data, we have estimated a
cost new of $100,000 for the system. This figure is utilized in the following valuation.
As support for the conclusion, sales and listings of used crematory retorts were also researched.
American Crematory marketed two comparable systems at a cost of $50,000 to $69,000,
spending on the specific system. These units were marketed as refurbished with new
components and are in a slightly superior condition to the subject unit. We are also aware of
three listings derived from Bid-On-Equipment.com which were marketed for sale at a price range
of $50,000 to $77,000 for used systems. This data generally supports the deprecation estimate
and conclusion.
Walk-In Coolers
The subject includes two walk-in coolers with dimensions of roughly 8’x10’ and 9’x10’.
According to Marshall Section 58, Page 1 under Walk-In Boxes, these units generally range from
$14,300 to $20,500 for comparable systems of 32 to 60 degrees for 50 to 100-square-foot boxes.
These costs include 7.5’ high boxes with floors. Costs include refrigeration equipment and one
door, similar to the existing equipment at the subject.
As support for the conclusion, listings of walk-in cooler boxes were research with comparable
sizes ranging between $8,000 to $10,000. These figures do not generally include the
refrigeration or other necessary components. Therefore, the Marshall estimate is considered to
be a more accurate depiction of cost new. Based on this data, an estimated cost of $15,000 for
each of the units is utilized.

Britton-Adamo Group/ROI Appraisal
File Number 20-086 101
Other Equipment
The subject includes three additional major equipment items. Comparable items are publicly
marketed for sale and cost figures are retained within the appraiser’s workfile.
Age/Condition
The majority of the items were reportedly acquired during the previous business operations,
starting approximately in 2005. The estimated average actual age for the equipment is 10-15
years, however, the tools appear to be in working order and in relatively average to good
condition. Therefore, the effective age is estimated below the actual age at 5-15 years,
depending on the specific item.
According to B&L Cremation Systems, Inc, a specialist in the industry, “the average life of our
systems (crematory retort) exceeds 30 years.” This lifespan is reported to be achieved with
regular scheduled maintenance and periodic upgrades. Based on Marshall Valuation tables,
walk-in coolers have an economic life of 10-18 years (Section 97, Page 17). According to the
property owner, some of the smaller items have lower lifespans of roughly 10-15 years, which
may be prolonged with adequate maintenance. It is noted a slightly higher deprecation rate is
applied to the some of these items.
In the following pages are summary tables containing a brief description of the items appraised
and their cost new (by item).
Item Description Approach
Estimated
Cost New
Economic
Life
Economic
Age
Marshall
Depr. FMV
1 Crematory Retort Market/Cost $100,000 30 15 35% $65,000
2 Cremains processing station Market $7,500 15 10 57% $3,225
3 9x10 Walk-In Cooler Market/Cost $15,000 15 5 27% $10,950
4 8x10 Walk-In Cooler Market/Cost $15,000 15 5 27% $10,950
5 4-Man Mortuary Freezer Market $6,250 15 5 27% $4,563
6 Hydraulic Lift Table Market $5,500 10 5 42% $3,190
Total Cost New $97,878
Rounded $100,000
John Raggett, a sales representative with American Crematory Equipment, was provided with a
list of the stated equipment as well as photos of their current condition. The broker opined the
cost of all of the above equipment items would be near $100,000 in their estimated condition.
This figure is consistent with the analysis above.
Therefore, the fair market value is estimated at $100,000.
Exposure Time
The market value opinions have been predicated upon an exposure time of 0 to 6 months, based
upon available market data.
Britton-Adamo Group/ROI Appraisal
File Number 20-086 102
A S S U M P T I O N S A N D L I M I T I N G C O N D I T I O N S
In acceptance of this appraisal assignment and the completion of the appraisal report submitted
herewith, it has been assumed by the appraiser(s) that:
1. Limit of Liability:
The liability of the appraisal firm and its employees is limited to the client only and to the fee actually received by
appraiser(s). Further, there is no accountability, obligation, or liability to any third party. If this report is
disseminated to anyone other than client, the client shall make such party aware of all limiting conditions and
assumptions of the assignment and related discussions. The appraiser(s) is in no way to be responsible for any costs
incurred to discover or correct any deficiencies of any type present in the property; physically, financially, and/or
legally. In the case of limited partnerships or syndication offerings or stock offerings in real estate, client agrees that
if a legal action is initiated by any lender, partner, part owner in any form of ownership, tenant, or any other party,
the client will hold the appraiser(s) completely harmless in any such action from any and all awards or settlements of
any type, regardless of outcome.
2. Copies, Publication, Distribution, Use of Report:
Possession of this report or any copy thereof does not carry with it the right of publication, nor may it be used for
other than its intended use; the physical report(s) remain the property of the Appraiser(s) for the use of the client, the
fee being for the analytical services only.
Except as hereinafter provided, the client may distribute copies of this appraisal report in its entirety to such third
parties as he may select; however, selected portions of this appraisal report shall not be given to third parties without
the prior written consent of the signatories of this appraisal report. Neither all nor any part of this appraisal report
shall be disseminated to the general public by the use of advertising media, public relations, news, sales or other
media for public communication without the prior written consent of the appraiser. (See last item in following list
for client agreement/consent).
3. Information Used:
No responsibility is assumed for accuracy of information furnished by work of others, the client, and his designee or
public records. We are not liable for such information or the work of possible subcontractors. The comparable data
relied upon in this report has been confirmed with one or more parties familiar with the transaction or from affidavit
or other source thought reasonable; all are considered appropriate for inclusion to the best of our factual judgment
and knowledge. An impractical and uneconomic expenditure of time would be required in attempting to furnish
unimpeachable verification in all instances, particularly as to engineering and market related information. It is
suggested that the client consider independent verification as a prerequisite to any transaction involving sale, lease,
or other significant commitment of funds or subject property.
4. Testimony, Consultation, Completion Of Contract For Appraisal Service:
The contract for appraisal, consultation or analytical service is fulfilled and the total fee is payable upon completion
of the report. The Appraiser(s) or those assisting in preparation of the report will not be asked or required to give
testimony in court or hearing because of having made the appraisal, in full or in part, nor engage in post appraisal
consultation with client or third parties except under separate and special arrangement and at additional fee. If
testimony or deposition is required because of any subpoena, the client shall be responsible for any additional time,
fees, and charges regardless of issuing party.
5. Exhibits:
Any sketches, maps, and photographs in this report are included to assist the reader in visualizing the property and
are not necessarily to scale. Site plans are not surveys unless indicated as such.

Britton-Adamo Group/ROI Appraisal
File Number 20-086 103
6. Legal, Engineering, Financial, Structural, and Mechanical Components; Soil Quality:
No responsibility is assumed for matters, legal in character or nature, nor of any architectural, structural, mechanical,
or engineering nature. No opinion is rendered as to the title, which is presumed to be good and marketable. The
property is appraised as if free and clear, unless otherwise stated in the appraisal report. The legal description is
assumed to be correct as used in this report as furnished by the client, their designee, or as derived by the
Appraiser(s).
Please note that no advice is given regarding mechanical equipment or structural integrity or adequacy, soils and
potential for settlement or drainage, matters concerning liens, title status, and legal marketability, and similar
matters. The client should seek assistance from qualified architectural, engineering or legal professionals regarding
such matters. The lender and owner may wish to require mechanical or structural inspections by a qualified and
licensed contractor, civil or structural engineer, architect, or other expert.
The Appraiser has inspected, as far as possible, by observation, the land and the improvements; however, it was not
possible to personally observe conditions beneath the soil or hidden structural or other components. We have not
critically inspected mechanical components within the improvements and no representations are made herein as to
these matters unless specifically stated and considered in the report. The value estimate considers there being no
such conditions that would cause a loss of value. The land or the soil of the area being appraised appears firm;
however, subsidence in the area is unknown. The Appraisers do not warrant against this condition or occurrence of
problems arising from soil conditions. Unless otherwise stated, it is assumed that there are no drainage problems
relating to the land or the improvements.
The appraisal is based on there being no hidden, unapparent, or apparent conditions of the property site, sub-soil, or
structures or toxic materials that would render it more or less valuable. No responsibility is assumed for any such
conditions or for any expertise or engineering to discover them. All mechanical components are assumed to be in
operable condition and status standard for properties of the subject type. Conditions of heating, cooling, ventilating,
electrical and plumbing equipment is considered to be commensurate with the condition of the balance of the
improvements unless otherwise stated. No judgment was made by the appraiser(s) as to adequacy of insulation, type
of insulation, or energy efficiency of the improvements or equipment; which is assumed standard for the subject
property's age and type.
If the appraiser(s) were not supplied with a termite inspection, survey or occupancy permit, no responsibility or
representation is assumed or made for any costs associated with obtaining same or for any deficiencies discovered
before or after they are obtained. No representations or warranties are made concerning the above-mentioned items.
The appraiser(s) assumes no responsibility for any costs or consequences arising due to the need, or the lack of need
for flood hazard insurance. An Agent for the Federal Flood Insurance Program should be contacted to determine the
actual need for Flood Hazard Insurance.
7. Insulation and Toxic Materials:
Unless otherwise stated in this report, the appraiser(s) signing this report have no knowledge concerning the
presence or absence of toxic materials and/or urea-formaldehyde foam insulation in existing improvements. If such
is present, the value of the property may be adversely affected, and re-appraisal at additional cost will be necessary
to estimate the effects of such.
8. Hazardous Substances of Materials:
Unless otherwise stated in this report, the existence of hazardous substances, including without limitation asbestos,
polychlorinated biphenyls, petroleum leakage or agricultural chemicals which may or may not be present on the
property, or other environmental conditions, were not called to the attention of, nor did the appraisers become aware
of such during the appraiser's inspection. The appraiser has no knowledge of the existence of such materials on or in
the property unless otherwise stated. The appraiser, however, is not qualified to test such substances or conditions. If
the presence of such substances, such as asbestos, urea-formaldehyde, foam insulation, or other hazardous
substances of environmental conditions, may affect the value of the property, the value estimated is predicated on
the assumption that there is no such condition on or in the property or in such proximity thereto that it would cause a
loss in value. No responsibility is assumed for any such conditions, or for any expertise or engineering knowledge
required to discover them. The client is urged to retain an expert in the field of environmental impact upon real
estate if so desired.

Britton-Adamo Group/ROI Appraisal
File Number 20-086 104
9. Legality of Use:
The appraisal is based on the premise that there is full compliance with all applicable federal, state, and local
environmental regulations and laws unless otherwise stated in the report, and that all applicable zoning, building, use
regulations and restrictions of all types have been complied with unless otherwise stated in the report. It is further
assumed that all required licenses, consents, permits, or other legislative or administrative approvals from all
applicable local, state, federal and/or private authorities have been or can be obtained or renewed for any use
considered in the value estimate.
10. Component Values:
The allocation of the total valuation in this report between land and improvements, if included in this report, applies
only under the use of the property, which is assumed in this report. The separate valuations for land and building
must not be used in conjunction with any other appraisal and are invalid if so used.
11. Auxiliary and Related Studies:
No environmental or impact studies, special market study or analysis, special highest and best use study or
feasibility study has been requested or made unless otherwise specified in an agreement for services or so stated in
the report.
12. Dollar Values, Purchasing Power:
The market value estimated and the costs used are as of the date of the estimate of value. All dollar amounts are
based on the purchasing power and value of the dollar as of the date of the value estimate.
13. Value Change, Dynamic Market, Influences, Alteration of Estimate By Appraisers:
The estimated market value, which is defined in the report, is subject to change with market changes over time.
Value is highly related to exposure, time, promotional effort, terms, motivation, and conditions. The value estimate
considers the productivity and relative attractiveness of the property physically on the date of condition and
economically in the marketplace as of the date of value.
In cases of appraisals involving the capitalization of income benefits, the estimate of market value or investment
value or value in use is a reflection of such benefits and Appraiser's interpretation of income and yields and other
factors derived from general and specific client and market information. Such estimates are as of the date of the
estimate of value, and they are thus subject to change as the market changes.
The "Estimate of Market Value" in the appraisal report is not based in whole or in part upon the race, color or
national origin of the present owners or occupants of the properties in the vicinity of the property appraised.
14. Inclusions:
Except as specifically indicated and typically considered as a part of the real estate, furnishings, equipment, other
personal property, or business operations have been disregarded with only the real estate being considered in the
value estimate. In some property types, business and real estate interests and values are combined but only if so
stated within this report.
15. Proposed Improvements, Conditioned Value:
Improvements proposed, if any, on-site or off-site, as well as any repairs required are considered, for purposes of
this appraisal, to be completed in good and workmanlike manner according to information submitted and/or
considered by the appraisers. In cases of proposed construction, the appraisal is subject to change upon inspection of
the property after construction is completed.
16. Management of the Property:
It is assumed that the property that is the subject of this report will be under typically prudent and competent
management, neither inefficient nor super-efficient.
17. Fee:
The appraisers certify that, our compensation is not contingent upon the report of a predetermined value that favors
the cause of the client, the amount of the value estimate, the attainment of a stipulated result, or the occurrence of a
subsequent event, or that the appraisal assignment was not based on a requested minimum valuation, a specific
valuation or the approval of a loan.

Britton-Adamo Group/ROI Appraisal
File Number 20-086 105
18. Americans With Disabilities Act:
The Americans with Disabilities Act became effective February 11, 1992. Unless otherwise stated in this report, this
appraisal firm did not conduct a compliance survey or audit, nor was one provided to determine whether or not the
subject property is in conformity with the numerous requirements of the Americans with Disabilities Act. If the
subject property is found to not be in compliance with Americans with Disabilities Act, the cost to cure the lack of
compliance may have a negative or adverse impact on the value of the subject property. No responsibility is
assumed for any such conditions, or for any expertise or knowledge required to discover them. The client is urged
to retain an expert in this field to ascertain the subject property's compliance with the Americans with Disabilities
Act.
19. Changes, Modifications:
The appraiser(s) reserves the right to alter statements, analyses, conclusions or any value estimate in the appraisal if
any new facts pertinent to the appraisal process are discovered which were unknown when the appraisal report was
prepared.
20. Confidentiality:
Appraisers, along with all providers of personal financial services, are required by federal law to inform their clients
of the policies of the firm with regard to the privacy of client nonpublic personal information. As professionals, we
understand that your privacy is very important to you and are pleased to provide you with this information.
Types of Nonpublic Personal Information We Collect: In the course of performing appraisals, we may collect what is
known as “nonpublic personal information’ about you. This information is used to facilitate the services that we
provide to you and may include the information provided to us by you directly or received by us from others with
your authorization.
Parties to Whom We Disclose Information: We do not disclose any nonpublic personal information obtained in the
course of our engagement with our clients to nonaffiliated third parties except as necessary or as required by law.
By way of example, a necessary disclosure would be to our employees, and in certain situations, to unrelated third
party consultants who need to know that information to assist us in providing appraisal services to you. All of our
employees and any third party consultants we employ are informed that any information they see as part of an
appraisal assignment is to be maintained in strict confidence within the firm. A disclosure required by law would be
a disclosure by us that is ordered by a court of competent jurisdiction with regard to a legal action to which you are a
party.
21. Third Party Liability:
ACCEPTANCE OR USE OF THIS APPRAISAL REPORT BY THE CLIENT OR ANY THIRD PARTY
CONSTITUTES ACCEPTANCE OF THE ABOVE CONDITIONS. APPRAISER LIABILITY EXTENDS ONLY
TO THE STATED CLIENT AND NOT TO SUBSEQUENT PARTIES OR USERS, AND THE LIABILITY IS
LIMITED TO THE AMOUNT OF FEE RECEIVED BY THE APPRAISER (S).

Britton-Adamo Group/ROI Appraisal
File Number 20-086 106
This report is subject to the following specific assumptions and limiting conditions:
1. It is assumed that the subject property is free and clear of liens and encumbrances.
2. The soils and sub-soils conditions are assumed by visual observation and are not
warranted by expert opinion. No Phase I environmental assessment was supplied to the
appraiser.
3. It is assumed that fee title to the subject property is vested as indicated in this report.
4. The subject legal descriptions were assumed current and accurate as provide by the Clark
County Assessor and/or surveyors.
5. It is assumed that the land area and site dimensions contained within this report are
accurate in accordance with the Clark County Assessor's plat map.
6. The subject building dimensions and sizes were assumed accurate as provide by the Clark
County Assessor.
7. The subject unit sizes were assumed accurate as provided by the property owner
according to the brochure distributed to prospective tenants.
8. The subject property is assumed free of a Mojave Desert Tortoise habitat, an Army Corps
of Engineers wetlands area and hazardous waste materials. The site was not known to
contain such conditions.
9. It has been assumed that market conditions will not significantly deteriorate due to acts of
war, or unforeseen downturns in the national or local economy. Significant downward
trends in the national or local economy would require a review and possibly a revision of
the conclusions reached in this report.
10. The appraisers used aerial photographs, fences, maps and other markers and methods to
estimate property boundaries.
11. As detailed in this report, the specific location of easements, if any, could not be
established without a title report and an ALTA survey.
12. Special Assumptions: It is noted if there are delinquent taxes on the real estate, the value
conclusion in this appraisal assumes that the delinquent taxes have been paid in full, and
there are no outstanding taxes due.
THE ACCEPTANCE AND/OR USE OF THE APPRAISAL REPORT BY THE CLIENT OR ANY
THIRD PARTY CONSTITUTES ACCEPTANCE OF THE ASSUMPTIONS AND LIMITING
CONDITIONS SET FORTH IN THE PRECEDING PARAGRAPHS. THE APPRAISER'S LIABILITY
EXTENDS ONLY TO THE SPECIFIED CLIENT, NOT TO SUBSEQUENT PARTIES OR USERS.
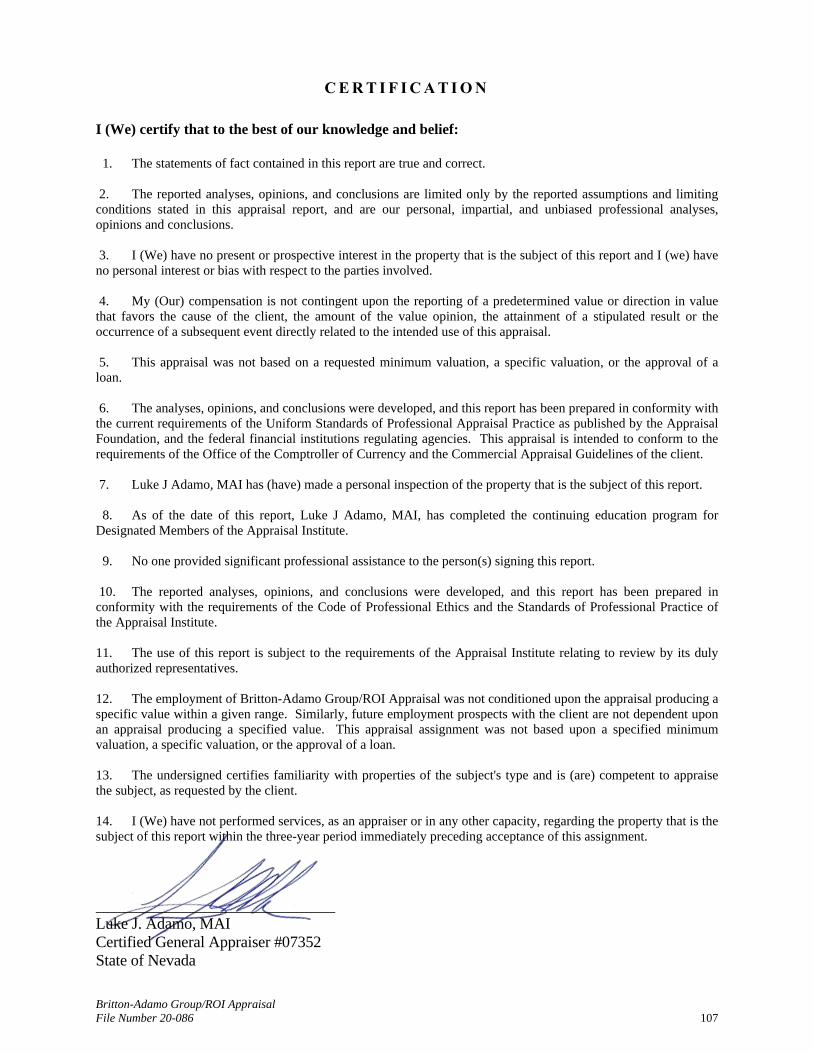
Britton-Adamo Group/ROI Appraisal
File Number 20-086 107
C E R T I F I C A T I O N
I (We) certify that to the best of our knowledge and belief:
1. The statements of fact contained in this report are true and correct.
2. The reported analyses, opinions, and conclusions are limited only by the reported assumptions and limiting
conditions stated in this appraisal report, and are our personal, impartial, and unbiased professional analyses,
opinions and conclusions.
3. I (We) have no present or prospective interest in the property that is the subject of this report and I (we) have
no personal interest or bias with respect to the parties involved.
4. My (Our) compensation is not contingent upon the reporting of a predetermined value or direction in value
that favors the cause of the client, the amount of the value opinion, the attainment of a stipulated result or the
occurrence of a subsequent event directly related to the intended use of this appraisal.
5. This appraisal was not based on a requested minimum valuation, a specific valuation, or the approval of a
loan.
6. The analyses, opinions, and conclusions were developed, and this report has been prepared in conformity with
the current requirements of the Uniform Standards of Professional Appraisal Practice as published by the Appraisal
Foundation, and the federal financial institutions regulating agencies. This appraisal is intended to conform to the
requirements of the Office of the Comptroller of Currency and the Commercial Appraisal Guidelines of the client.
7. Luke J Adamo, MAI has (have) made a personal inspection of the property that is the subject of this report.
8. As of the date of this report, Luke J Adamo, MAI, has completed the continuing education program for
Designated Members of the Appraisal Institute.
9. No one provided significant professional assistance to the person(s) signing this report.
10. The reported analyses, opinions, and conclusions were developed, and this report has been prepared in
conformity with the requirements of the Code of Professional Ethics and the Standards of Professional Practice of
the Appraisal Institute.
11. The use of this report is subject to the requirements of the Appraisal Institute relating to review by its duly
authorized representatives.
12. The employment of Britton-Adamo Group/ROI Appraisal was not conditioned upon the appraisal producing a
specific value within a given range. Similarly, future employment prospects with the client are not dependent upon
an appraisal producing a specified value. This appraisal assignment was not based upon a specified minimum
valuation, a specific valuation, or the approval of a loan.
13. The undersigned certifies familiarity with properties of the subject's type and is (are) competent to appraise
the subject, as requested by the client.
14. I (We) have not performed services, as an appraiser or in any other capacity, regarding the property that is the
subject of this report within the three-year period immediately preceding acceptance of this assignment.
Luke J. Adamo, MAI
Certified General Appraiser #07352
State of Nevada

Britton-Adamo Group/ROI Appraisal File Number 20-089
ADDENDA
1. ENGAGEMENT LETTER
2. SUBJECT PROPERTY INFORMATION
3. COSTAR ANALYTICS
4. DEFINITIONS
5. QUALIFICATIONS OF THE APPRAISER

Britton-Adamo Group/ROI Appraisal File Number 20-089
ENGAGEMENT LETTER
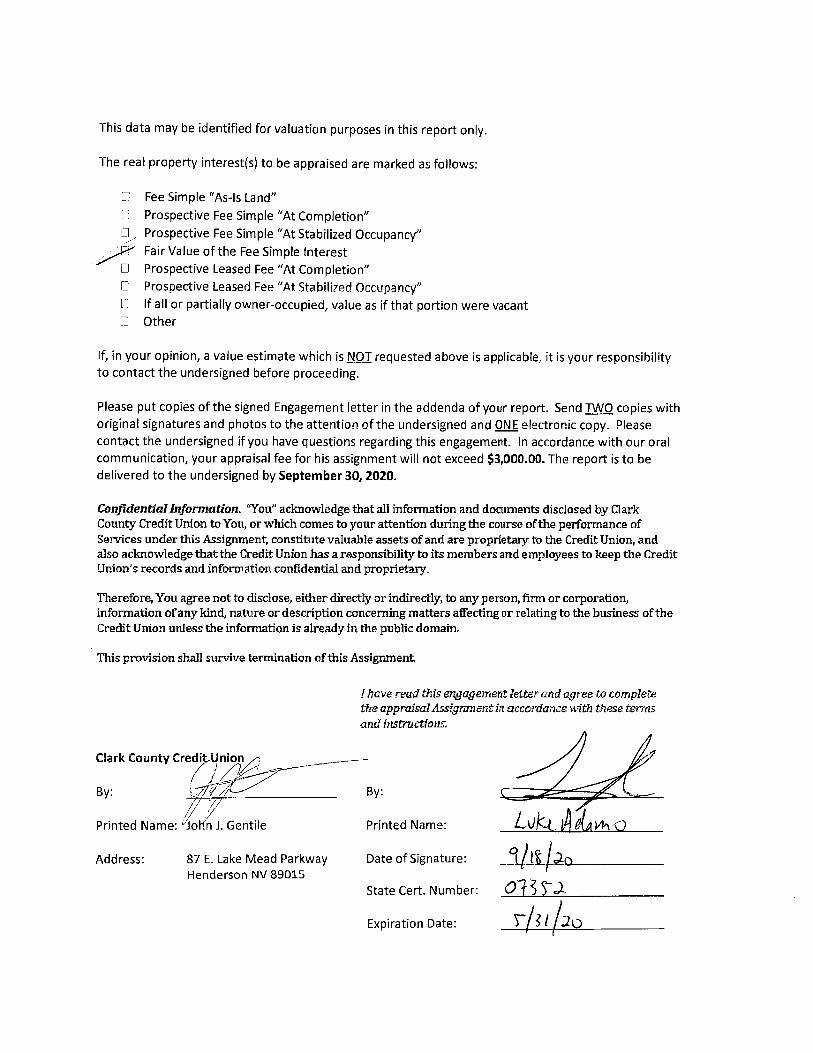


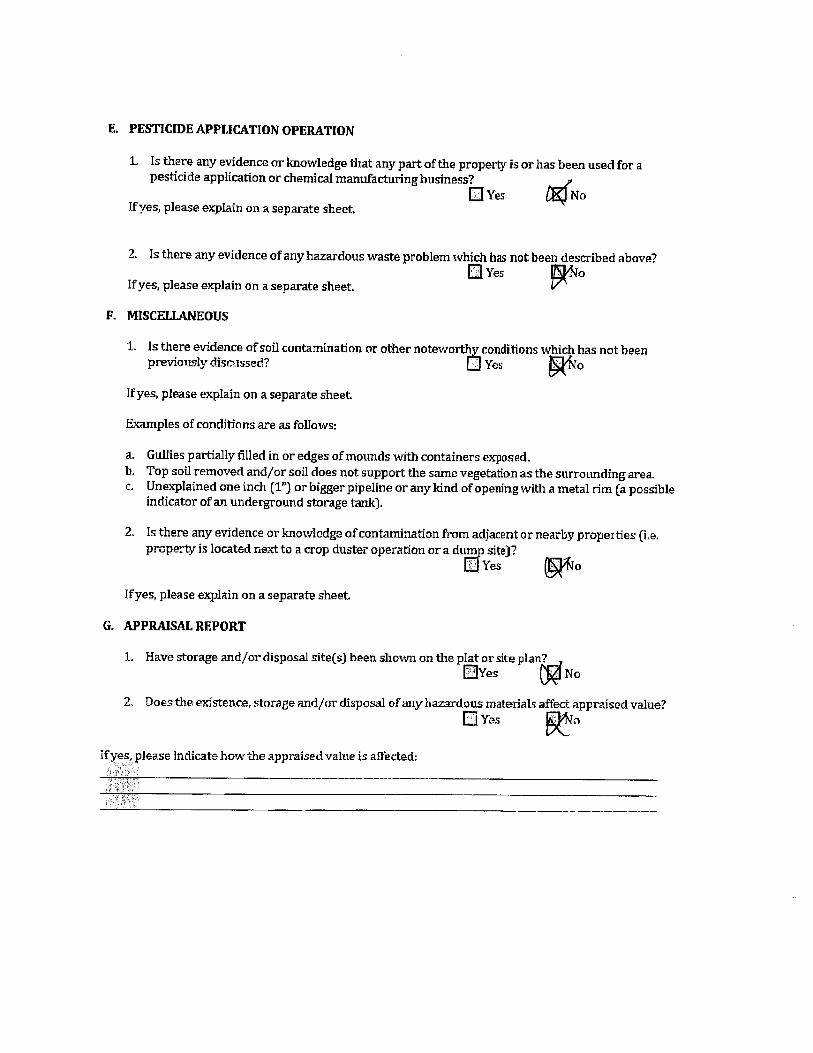


Britton-Adamo Group/ROI Appraisal File Number 20-089
SUBJECT PROPERTY INFORMATION


Britton-Adamo Group/ROI Appraisal File Number 20-089
COSTAR ANALYTICS

SE LV/Henderson
PREPARED BY
Luke Adamo
Broker
Industrial Submarket Report
Las Vegas - NV
INDUSTRIAL SUBMARKET REPORT
Submarket Key Statistics 2
Leasing 3
Rent 6
Construction 7
Sales 11
Sales Past 12 Months 12
Supply & Demand Trends 14
Rent & Vacancy 16
Sale Trends 18
SE LV/Henderson Industrial
9/27/2020Copyrighted report licensed to ROI Appraisal Britton Group - 103161

OverviewSE LV/Henderson Industrial
424 K 357 K 4.1% 4.6%12 Mo Deliveries in SF 12 Mo Net Absorption in SF Vacancy Rate 12 Mo Rent Growth
The Southeast Las Vegas/Henderson Submarket is thethird largest in Las Vegas, with approximately 18 millionSF of industrial space (around 12.9 million of which isdevoted to logistics). The area is serviced by I-215 andI-515 along with the Union Pacific Railroad, which runsalong the southern portion of the submarket. As is thecase in other Las Vegas submarkets, a large portion ofthe outlying land consists of desert areas, so mostlogistics facilities are located along the I-515 Las VegasExpressway. The tenant base there is similar to that ofSouthwest Las Vegas—most occupants service the localeconomy, and national retail distribution centers aremostly absent.
Logistics deliveries flooded the submarket in 2017 anddrove up the vacancy rate, but healthy absorption, evenwith the further addition of new supply, compressedvacancies to around 4.1%, well below the submarket'shistorical average. Over 1 million SF delivered over thepast year—triple the submarket's four-quarter historicalaverage and almost matched by strong demand. Rentgrowth continues to be solid at around 4.6% continuingthe robust gains from recent years, yet rent levels still lagbehind their historical peak. New development remainshealthy with a handful of sizable projects underway,including two buildings near the Henderson ExecutiveAirport, the 750,000-SF Google Data Center and a616,000-SF Amazon distribution building.
KEY INDICATORS
Market RentVacancy RateRBACurrent Quarter Availability RateNet Absorption
SFDeliveries SF
UnderConstruction
$0.765.0%12,896,595Logistics 7.5% 122,929 0 932,710
$0.950.4%4,209,494Specialized Industrial 0.7% 0 0 750,000
$0.858.1%1,178,917Flex 9.9% 24,198 0 0
$0.814.1%18,285,006Submarket 6.0% 147,127 0 1,682,710
ForecastAverage
HistoricalAverage
12 MonthAnnual Trends Peak When Trough When
7.1%7.8%0.3%Vacancy Change (YOY) 14.2% 2009 Q3 3.3% 2019 Q1
763,472422,743357 KNet Absorption SF 1,798,865 2018 Q2 (196,809) 2011 Q1
977,116432,747424 KDeliveries SF 1,325,187 2018 Q2 0 2016 Q1
2.2%1.0%4.6%Rent Growth 10.3% 2006 Q3 -13.9% 2010 Q1
N/A$76.8M$155 MSales Volume $308.5M 2019 Q4 $6.7M 2009 Q3
9/27/2020Copyrighted report licensed to ROI Appraisal Britton Group - 103161
Page 2

LeasingSE LV/Henderson Industrial
NET ABSORPTION, NET DELIVERIES & VACANCY
VACANCY RATE
9/27/2020Copyrighted report licensed to ROI Appraisal Britton Group - 103161
Page 3

LeasingSE LV/Henderson Industrial
AVAILABILITY RATE
4 & 5 STAR MOST ACTIVE BUILDINGS IN SUBMARKET - PAST 12 MONTHS
Property Name/Address Rating RBA Deals Leased SF 12 Mo Vacancy 12 Mo Net Absorp SF
31,9411710 Raiders Way
AirParc Industrial74,347 1 48.3% 42,254
40,0001070 Mary Crest Rd
111,213 1 52.8% 39,422
13,3351550 Raiders Way
106,680 1 12.5% 26,818
8,1761395 Raiders Way
Building 230,602 3 45.7% 19,157
100,6921387 Raiders Way
Building 4100,692 1 75.0% 0
7,146900 W Warm Springs Rd
Bldg C86,950 1 1.6% (79)
66,700140 Cassia Way
133,378 2 38.3% (67,007)
9/27/2020Copyrighted report licensed to ROI Appraisal Britton Group - 103161
Page 4

LeasingSE LV/Henderson Industrial
3 STAR MOST ACTIVE BUILDINGS IN SUBMARKET - PAST 12 MONTHS
Property Name/Address Rating RBA Deals Leased SF 12 Mo Vacancy 12 Mo Net Absorp SF
32,2231371 Raiders Way
Building 132,941 8 80.2% 21,283
6,2223 Sunset Way
Bldg A10,868 4 66.1% 6,132
15,1361000 N Stephanie Pl
60,000 3 2.0% 6,042
36,4381125 American Pacific Dr
37,482 5 34.0% 5,605
6,7506672 Boulder Hwy
Bldg. B20,250 3 15.6% 4,500
8,640175 Cassia Way
44,560 3 1.9% 4,296
10,649401-429 Max Ct
Max Court Business Center26,875 6 25.1% 3,495
3,4891600 Raiders Way
10,800 2 96.7% 360
28,8501051 Mary Crest Rd
Suncrest Commerce Center156,514 2 4.6% 133
20,2247355 Commercial Way
Bldg U62,000 3 4.9% 56
12,880931 American Pacific Dr
14,132 2 0% 0
6,26150 N Gibson Rd
26,133 2 0% 0
5,649921 American Pacific Dr
17,570 3 0% 0
11,4081065 American Pacific Dr
Bldg 11 Phase IV44,338 2 5.1% (63)
24,1917715 Commercial Way
41,306 5 4.9% (89)
17,0887585 Commercial Way
Phase 1 - Bldg. 163,580 3 5.4% (126)
6,680911 American Pacific Dr
AmPac Business Park I & II16,780 3 2.0% (1,604)
13,1137375 Commercial Way
Bldg V62,000 4 8.8% (8,364)
10,480980 American Pacific Dr
61,460 2 10.2% (10,367)
29,1397685 Commercial Way
Phase 2 - Bldg. 258,435 3 11.6% (11,550)
9/27/2020Copyrighted report licensed to ROI Appraisal Britton Group - 103161
Page 5
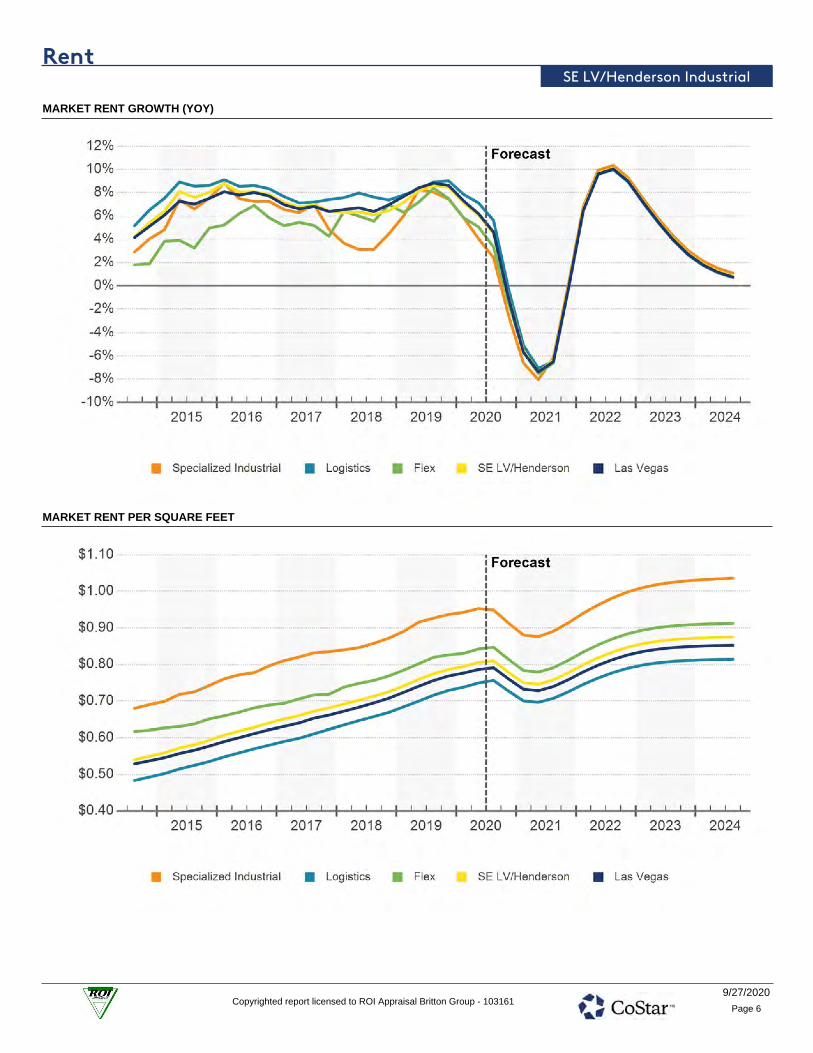
RentSE LV/Henderson Industrial
MARKET RENT GROWTH (YOY)
MARKET RENT PER SQUARE FEET
9/27/2020Copyrighted report licensed to ROI Appraisal Britton Group - 103161
Page 6

ConstructionSE LV/Henderson Industrial
DELIVERIES & DEMOLITIONS
9/27/2020Copyrighted report licensed to ROI Appraisal Britton Group - 103161
Page 7

ConstructionSE LV/Henderson Industrial
441,564 763,804 1,682,710 1,734,927All-Time Annual Avg. Square Feet Delivered Square Feet Past 8 Qtrs Delivered Square Feet Next 8 Qtrs Proposed Square Feet Next 8 Qtrs
PAST 8 QUARTERS DELIVERIES, UNDER CONSTRUCTION, & PROPOSED
PAST & FUTURE DELIVERIES IN SQUARE FEET
9/27/2020Copyrighted report licensed to ROI Appraisal Britton Group - 103161
Page 8
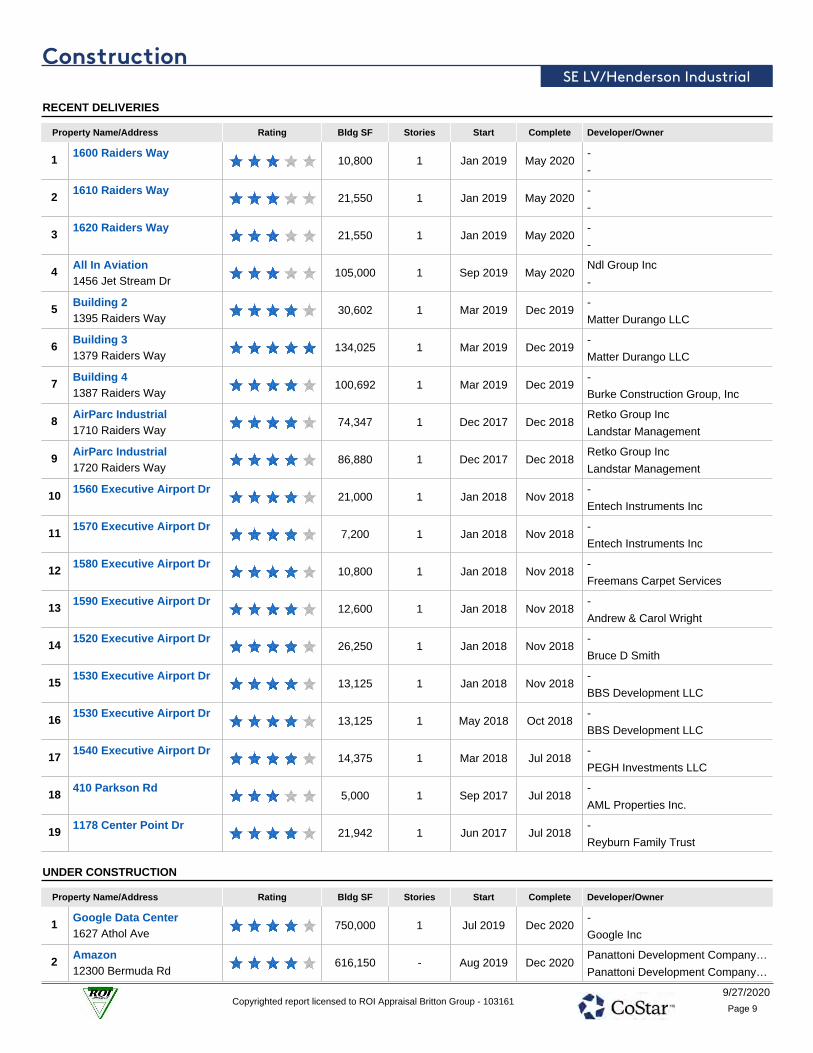
ConstructionSE LV/Henderson Industrial
RECENT DELIVERIES
Property Name/Address Rating Bldg SF Stories Start Complete Developer/Owner
Jan 20191600 Raiders Way
10,800 1 May 2020-
-1
Jan 20191610 Raiders Way
21,550 1 May 2020-
-2
Jan 20191620 Raiders Way
21,550 1 May 2020-
-3
Sep 20191456 Jet Stream Dr
All In Aviation105,000 1 May 2020
Ndl Group Inc
-4
Mar 20191395 Raiders Way
Building 230,602 1 Dec 2019
-
Matter Durango LLC5
Mar 20191379 Raiders Way
Building 3134,025 1 Dec 2019
-
Matter Durango LLC6
Mar 20191387 Raiders Way
Building 4100,692 1 Dec 2019
-
Burke Construction Group, Inc7
Dec 20171710 Raiders Way
AirParc Industrial74,347 1 Dec 2018
Retko Group Inc
Landstar Management8
Dec 20171720 Raiders Way
AirParc Industrial86,880 1 Dec 2018
Retko Group Inc
Landstar Management9
Jan 20181560 Executive Airport Dr
21,000 1 Nov 2018-
Entech Instruments Inc10
Jan 20181570 Executive Airport Dr
7,200 1 Nov 2018-
Entech Instruments Inc11
Jan 20181580 Executive Airport Dr
10,800 1 Nov 2018-
Freemans Carpet Services12
Jan 20181590 Executive Airport Dr
12,600 1 Nov 2018-
Andrew & Carol Wright13
Jan 20181520 Executive Airport Dr
26,250 1 Nov 2018-
Bruce D Smith14
Jan 20181530 Executive Airport Dr
13,125 1 Nov 2018-
BBS Development LLC15
May 20181530 Executive Airport Dr
13,125 1 Oct 2018-
BBS Development LLC16
Mar 20181540 Executive Airport Dr
14,375 1 Jul 2018-
PEGH Investments LLC17
Sep 2017410 Parkson Rd
5,000 1 Jul 2018-
AML Properties Inc.18
Jun 20171178 Center Point Dr
21,942 1 Jul 2018-
Reyburn Family Trust19
UNDER CONSTRUCTION
Property Name/Address Rating Bldg SF Stories Start Complete Developer/Owner
Jul 20191627 Athol Ave
Google Data Center750,000 1 Dec 2020
-
Google Inc1
Aug 201912300 Bermuda Rd
Amazon616,150 - Dec 2020
Panattoni Development Company…
Panattoni Development Company…2
9/27/2020Copyrighted report licensed to ROI Appraisal Britton Group - 103161
Page 9

ConstructionSE LV/Henderson Industrial
UNDER CONSTRUCTION
Property Name/Address Rating Bldg SF Stories Start Complete Developer/Owner
Nov 20191720 Chaparral Rd
Bldg C183,560 1 Oct 2020
-
Panattoni Development Company3
Nov 20191725 Chaparral Rd
Bldg D83,000 1 Oct 2020
-
Panattoni Development Company4
Jan 20202201 Moser Dr
50,000 1 Oct 2020-
City of Henderson Public Works5
PROPOSED
Property Name/Address Rating Bldg SF Stories Start Complete Developer/Owner
Dec 2020Amigo & Bruner Avenue
Building F614,520 1 Jun 2021
-
-1
Mar 20211300 Wigwam Pky
Building One260,448 1 Jan 2022
-
-2
Oct 2020Executive Airport Dr
Building E200,000 1 Jun 2022
-
-3
Dec 2020Amigo & Bruner Avenue
Building H123,760 1 Jun 2021
-
-4
Dec 2020Amigo & Bruner Avenue
Building G123,760 1 Jun 2021
-
-5
Sep 2021425 E Bruner Ave
100,000 1 Sep 2022Brass Cap Development
-6
Sep 2020425 E Bruner Ave
100,000 1 Dec 2021-
Brass Cap Development7
Mar 20211350 Wigwam Pky
Building Two77,600 1 Jan 2022
-
-8
Sep 2020Volunteer Blvd & Via Insp
Odyssey Tier Industrial…65,590 1 Apr 2021
-
-9
Nov 2020905 E Dale St
A40,180 1 Feb 2021
-
-10
Nov 2020915 E Dale St
B29,069 1 Feb 2021
-
Larry L Monkarsh11
9/27/2020Copyrighted report licensed to ROI Appraisal Britton Group - 103161
Page 10

SalesSE LV/Henderson Industrial
Sales volume in Southeast Las Vegas is typically moremodest than in some of the area's larger submarkets,such as North Las Vegas and Airport/East Las Vegas.Properties in this submarket generally trade for less than$10 million.
Sales in the third quarter have picked up slightly from theprevious quarter but remain modest at under $10 million.Deal volume in the first half of 2020 was under $30million, with trades dropping sharply in the secondquarter as the coronavirus pandemic affected the market.One of the sizable deals was the February sale of a
130,842-SF warehouse building in the HendersonInterchange Center by Juliet Companies for $19 million($145/SF). The property, built in 2017, was acquired byCooper & Brain Oil and was 100% leased at the time ofsale.
Investment activity in 2019 received a boost due to aportfolio trade. In July BKM Capital Partners acquired a13-property portfolio from Northwestern Mutual LifeInsurance Company for $111.2 million ($125/SF). Theproperties totaled 887,910 SF and are located in thePacific Business Center in Henderson.
SALES VOLUME & MARKET SALE PRICE PER SF
9/27/2020Copyrighted report licensed to ROI Appraisal Britton Group - 103161
Page 11

Sales Past 12 MonthsSE LV/Henderson Industrial
45 5.5% $147 3.2%Sale Comparables Avg. Cap Rate Avg. Price/SF Avg. Vacancy At Sale
SALE COMPARABLE LOCATIONS
SALE COMPARABLES SUMMARY STATISTICS
Sales Attributes Low Average Median High
Sale Price $215,000 $5,631,030 $1,345,000 $31,329,278
Price/SF $84 $147 $156 $200
Cap Rate 4.3% 5.5% 5.5% 6.7%
Time Since Sale in Months 0.1 7.1 7.1 11.9
Property Attributes Low Average Median High
Building SF 2,400 27,747 8,919 200,450
Ceiling Height 12' 19'10" 18' 32'
Docks 0 3 0 26
Vacancy Rate At Sale 0% 3.2% 0% 100%
Year Built 1955 2001 2003 2018
Star Rating 2.5
9/27/2020Copyrighted report licensed to ROI Appraisal Britton Group - 103161
Page 12

Sales Past 12 MonthsSE LV/Henderson Industrial
Property Name - Address Rating Yr Built Bldg SF Vacancy Price Price/SF
Property
Sale Date
Sale
Cap Rate
RECENT SIGNIFICANT SALES
-1 Bldg B2017 200,450 0% $31,329,278 $156
8385 Eastgate Rd12/10/2019 -
-2 Bldg A2016 163,000 0% $25,476,040 $156
8390 Eastgate Rd12/10/2019 -
-3 140 Cassia Way1997 133,378 0% $20,846,278 $15612/10/2019 -
-4 Henderson Interchange…2017 130,842 0% $19,000,000 $145
860 Wigwam Pky2/14/2020 -
-5 1550 Raiders Way2018 106,680 12.5% $14,905,987 $14010/16/2019 4.3%
-6 150 Cassia Way1997 72,000 0% $11,253,220 $15612/10/2019 -
-7 Pacific Business Center1996 55,974 13.5% $5,250,000 $94
975 American Pacific Dr11/26/2019 -
-8 91 Corporate Park Dr2002 21,000 0% $3,250,000 $15510/8/2019 -
-9 1941 Ramrod Ave1982 29,430 0% $2,908,821 $997/21/2020 -
-10 102 Cassia Way2007 14,600 0% $2,375,000 $1633/6/2020 -
-11 1937 Ramrod Ave1982 19,134 0% $1,891,179 $997/21/2020 -
-12 340-342 Sunpac Ct1998 10,560 0% $1,525,000 $1442/24/2020 -
-13 680 Professional Ave1991 10,096 79.2% $1,479,000 $1469/30/2019 -
-14 Bldg. 82007 6,715 0% $1,345,000 $200
98 Corporate Park Dr9/25/2020 -
-15 141 Cassia Way1998 11,944 0% $1,300,000 $1097/6/2020 -
-16 517 W Sunset Rd2009 5,800 0% $1,075,000 $1859/1/2020 -
-17 181 N Gibson Rd2006 5,464 0% $1,030,000 $1899/30/2019 -
-18 549 W Sunset Rd2009 5,510 0% $990,000 $1804/9/2020 -
-19 529 W Sunset Rd2009 5,750 0% $960,000 $1673/19/2020 -
-20 Bldg 52006 4,869 0% $945,000 $194
161 N Gibson Rd12/10/2019 -
9/27/2020Copyrighted report licensed to ROI Appraisal Britton Group - 103161
Page 13

Supply & Demand TrendsSE LV/Henderson Industrial
OVERALL SUPPLY & DEMAND
Net AbsorptionInventory
% of Inv Construction RatioSF SF Growth % Growth SFYear
2024 689,814 3.1% 2.7%626,283 1.122,900,855
2023 812,712 3.8% 3.0%655,782 1.222,211,041
2022 852,181 4.1% 2.7%579,127 1.521,398,329
2021 1,944,582 10.5% 7.2%1,480,215 1.320,546,148
2020 475,460 2.6% 1.9%347,695 1.418,601,566
YTD 158,900 0.9% 1.0%181,125 0.918,285,006
2019 298,260 1.7% 0.8%141,038 2.118,126,106
2018 1,231,974 7.4% 9.0%1,611,946 0.817,827,846
2017 878,867 5.6% 4.7%776,380 1.116,595,872
2016 649,460 4.3% 1.7%274,103 2.415,717,005
2015 0 0% 0.9%139,233 015,067,545
2014 368,845 2.5% 6.2%928,074 0.415,067,545
2013 0 0% 1.3%187,308 014,698,700
2012 (43,000) -0.3% 0.8%114,479 -14,698,700
2011 (27,641) -0.2% 2.5%363,373 -14,741,700
2010 38,547 0.3% 0.1%13,574 2.814,769,341
2009 128,628 0.9% -0.8%(111,196) -14,730,794
2008 1,263,648 9.5% 3.9%564,820 2.214,602,166
SPECIALIZED INDUSTRIAL SUPPLY & DEMAND
Net AbsorptionInventory
% of Inv Construction RatioSF SF Growth % Growth SFYear
2024 200,932 3.6% 3.1%178,072 1.15,813,938
2023 236,743 4.4% 3.1%174,430 1.45,613,006
2022 248,247 4.8% 2.4%127,599 1.95,376,263
2021 918,522 21.8% 14.7%751,670 1.25,128,016
2020 0 0% 1.2%52,501 04,209,494
YTD 0 0% 1.8%75,000 04,209,494
2019 0 0% -1.7%(71,255) -4,209,494
2018 140,692 3.5% 3.5%148,194 0.94,209,494
2017 0 0% 0%418 04,068,802
2016 0 0% 1.3%51,940 04,068,802
2015 0 0% -1.4%(57,055) -4,068,802
2014 0 0% 8.4%342,664 04,068,802
2013 0 0% 0.1%3,645 04,068,802
2012 (43,000) -1.0% -8.0%(324,859) -4,068,802
2011 (13,000) -0.3% 0.4%16,398 -4,111,802
2010 0 0% 0.3%14,299 04,124,802
2009 26,033 0.6% 4.3%178,345 0.14,124,802
2008 322,381 8.5% 2.8%114,340 2.84,098,769
9/27/2020Copyrighted report licensed to ROI Appraisal Britton Group - 103161
Page 14

Supply & Demand TrendsSE LV/Henderson Industrial
LOGISTICS SUPPLY & DEMAND
Net AbsorptionInventory
% of Inv Construction RatioSF SF Growth % Growth SFYear
2024 488,882 3.2% 2.9%455,743 1.115,908,000
2023 575,969 3.9% 3.2%488,885 1.215,419,118
2022 603,934 4.2% 3.1%459,063 1.314,843,149
2021 1,026,060 7.8% 5.2%738,369 1.414,239,215
2020 475,460 3.7% 2.4%312,453 1.513,213,155
YTD 158,900 1.2% 0.9%120,861 1.312,896,595
2019 298,260 2.4% 1.7%222,074 1.312,737,695
2018 1,091,282 9.6% 11.9%1,483,862 0.712,439,435
2017 878,867 8.4% 6.4%726,163 1.211,348,153
2016 649,460 6.6% 2.3%244,739 2.710,469,286
2015 0 0% 1.6%161,565 09,819,826
2014 368,845 3.9% 5.7%556,761 0.79,819,826
2013 0 0% 1.9%179,184 09,450,981
2012 0 0% 4.1%392,112 09,450,981
2011 (14,641) -0.2% 3.0%280,847 -9,450,981
2010 38,547 0.4% 0.2%22,775 1.79,465,622
2009 102,595 1.1% -3.4%(316,742) -9,427,075
2008 737,651 8.6% 3.9%368,259 2.09,324,480
FLEX SUPPLY & DEMAND
Net AbsorptionInventory
% of Inv Construction RatioSF SF Growth % Growth SFYear
2024 0 0% -0.6%(7,532) -1,178,917
2023 0 0% -0.6%(7,533) -1,178,917
2022 0 0% -0.6%(7,535) -1,178,917
2021 0 0% -0.8%(9,824) -1,178,917
2020 0 0% -1.5%(17,259) -1,178,917
YTD 0 0% -1.2%(14,736) -1,178,917
2019 0 0% -0.8%(9,781) -1,178,917
2018 0 0% -1.7%(20,110) -1,178,917
2017 0 0% 4.2%49,799 01,178,917
2016 0 0% -1.9%(22,576) -1,178,917
2015 0 0% 2.9%34,723 01,178,917
2014 0 0% 2.4%28,649 01,178,917
2013 0 0% 0.4%4,479 01,178,917
2012 0 0% 4.0%47,226 01,178,917
2011 0 0% 5.6%66,128 01,178,917
2010 0 0% -2.0%(23,500) -1,178,917
2009 0 0% 2.3%27,201 01,178,917
2008 203,616 20.9% 7.0%82,221 2.51,178,917
9/27/2020Copyrighted report licensed to ROI Appraisal Britton Group - 103161
Page 15

Rent & VacancySE LV/Henderson Industrial
OVERALL RENT & VACANCY
Market Rent
Per SF Index % Growth Vs Hist PeakYear
Vacancy
SF Percent Ppts Chg
2024 119 0.6% 10.4%$0.88 1,859,080 8.1% 0%
2023 119 2.8% 9.8%$0.87 1,796,439 8.1% 0.4%
2022 116 9.0% 6.8%$0.85 1,640,416 7.7% 1.0%
2021 106 -0.2% -2.0%$0.78 1,368,265 6.7% 1.8%
2020 106 -1.0% -1.9%$0.78 904,385 4.9% 0.6%
YTD 110 3.0% 2.1%$0.81 754,395 4.1% -0.2%
2019 107 8.4% -0.9%$0.79 776,620 4.3% 0.6%
2018 99 6.5% -8.6%$0.72 652,339 3.7% -2.6%
2017 93 6.4% -14.1%$0.68 1,032,311 6.2% 0.3%
2016 87 7.8% -19.3%$0.64 929,824 5.9% 2.2%
2015 81 8.0% -25.2%$0.59 554,467 3.7% -0.9%
2014 75 5.4% -30.7%$0.55 693,700 4.6% -3.9%
2013 71 1.1% -34.3%$0.52 1,252,929 8.5% -1.3%
2012 70 -3.4% -35.0%$0.52 1,440,237 9.8% -1.0%
2011 73 -5.8% -32.7%$0.53 1,597,716 10.8% -2.6%
2010 77 -10.6% -28.5%$0.57 1,988,730 13.5% 0.1%
2009 87 -13.5% -20.0%$0.63 1,963,757 13.3% 1.5%
2008 100 -7.6% -7.6%$0.73 1,723,933 11.8% 4.1%
SPECIALIZED INDUSTRIAL RENT & VACANCY
Market Rent
Per SF Index % Growth Vs Hist PeakYear
Vacancy
SF Percent Ppts Chg
2024 110 0.8% 0.6%$1.04 409,946 7.1% 0.2%
2023 109 3.0% -0.2%$1.03 387,220 6.9% 0.9%
2022 106 9.3% -3.2%$1.00 325,055 6.0% 2.1%
2021 97 0.1% -11.4%$0.91 204,554 4.0% 3.1%
2020 97 -2.5% -11.4%$0.91 37,793 0.9% -1.2%
YTD 101 1.4% -7.9%$0.95 15,294 0.4% -1.8%
2019 99 7.4% -9.2%$0.94 90,294 2.1% 1.7%
2018 92 4.5% -15.4%$0.87 19,039 0.5% -0.2%
2017 88 4.8% -19.0%$0.83 26,541 0.7% 0%
2016 84 7.2% -22.8%$0.80 26,959 0.7% -1.3%
2015 79 7.5% -28.0%$0.74 78,899 1.9% 1.4%
2014 73 4.0% -33.0%$0.69 21,844 0.5% -8.4%
2013 70 1.8% -35.6%$0.66 364,508 9.0% -0.1%
2012 69 -2.3% -36.8%$0.65 368,153 9.0% 6.9%
2011 71 -7.1% -35.3%$0.67 86,294 2.1% -0.7%
2010 76 -11.1% -30.3%$0.72 115,692 2.8% -0.3%
2009 86 -14.3% -21.6%$0.81 129,991 3.2% -3.7%
2008 100 -8.5% -8.5%$0.94 282,303 6.9% 4.9%
9/27/2020Copyrighted report licensed to ROI Appraisal Britton Group - 103161
Page 16

Rent & VacancySE LV/Henderson Industrial
LOGISTICS RENT & VACANCY
Market Rent
Per SF Index % Growth Vs Hist PeakYear
Vacancy
SF Percent Ppts Chg
2024 125 0.4% 11.7%$0.81 1,318,321 8.3% -0.1%
2023 125 2.7% 11.2%$0.81 1,285,938 8.3% 0.3%
2022 122 8.9% 8.3%$0.79 1,199,613 8.1% 0.7%
2021 112 -0.3% -0.5%$0.73 1,055,498 7.4% 1.6%
2020 112 -0.3% -0.3%$0.73 768,203 5.8% 1.1%
YTD 116 3.7% 3.7%$0.76 643,235 5.0% 0.2%
2019 112 9.0% 0%$0.73 605,196 4.8% 0.2%
2018 103 7.4% -8.3%$0.67 561,951 4.5% -3.9%
2017 96 7.4% -14.6%$0.62 954,531 8.4% 0.8%
2016 89 8.3% -20.5%$0.58 801,827 7.7% 3.6%
2015 82 8.6% -26.6%$0.54 397,106 4.0% -1.6%
2014 76 6.5% -32.4%$0.49 558,671 5.7% -2.2%
2013 71 0.5% -36.5%$0.46 746,587 7.9% -1.9%
2012 71 -3.9% -36.9%$0.46 925,771 9.8% -4.1%
2011 74 -5.1% -34.3%$0.48 1,317,883 13.9% -3.1%
2010 78 -10.4% -30.8%$0.50 1,613,371 17.0% 0.1%
2009 87 -13.3% -22.7%$0.56 1,597,599 16.9% 4.3%
2008 100 -7.2% -10.9%$0.65 1,178,262 12.6% 3.2%
FLEX RENT & VACANCY
Market Rent
Per SF Index % Growth Vs Hist PeakYear
Vacancy
SF Percent Ppts Chg
2024 110 0.4% 3.4%$0.91 130,813 11.1% 0.6%
2023 110 2.7% 3.0%$0.91 123,281 10.5% 0.6%
2022 107 9.0% 0.3%$0.88 115,748 9.8% 0.6%
2021 98 -0.3% -8.0%$0.81 108,213 9.2% 0.8%
2020 98 -1.5% -7.7%$0.81 98,389 8.3% 1.5%
YTD 102 2.5% -4.0%$0.85 95,866 8.1% 1.2%
2019 100 7.5% -6.3%$0.83 81,130 6.9% 0.8%
2018 93 7.0% -12.9%$0.77 71,349 6.1% 1.7%
2017 87 4.2% -18.6%$0.72 51,239 4.3% -4.2%
2016 83 5.8% -21.9%$0.69 101,038 8.6% 1.9%
2015 79 5.0% -26.2%$0.65 78,462 6.7% -2.9%
2014 75 1.9% -29.7%$0.62 113,185 9.6% -2.4%
2013 73 2.8% -31.0%$0.61 141,834 12.0% -0.4%
2012 72 -4.5% -32.8%$0.59 146,313 12.4% -4.0%
2011 75 -6.8% -29.7%$0.62 193,539 16.4% -5.6%
2010 80 -9.3% -24.5%$0.67 259,667 22.0% 2.0%
2009 89 -11.4% -16.7%$0.73 236,167 20.0% -2.3%
2008 100 -6.1% -6.1%$0.83 263,368 22.3% 7.8%
9/27/2020Copyrighted report licensed to ROI Appraisal Britton Group - 103161
Page 17

Sale TrendsSE LV/Henderson Industrial
OVERALL SALES
Completed Transactions (1)
Turnover Avg Price/SFDeals VolumeYear
Market Pricing Trends (2)
Avg Price Price IndexAvg Cap Rate Price/SF Cap Rate
2024 -- - -- 188- $155.54 4.9%
2023 -- - -- 187- $154.25 4.9%
2022 -- - -- 178- $146.60 4.9%
2021 -- - -- 146- $120.75 5.4%
2020 -- - -- 151- $124.30 5.7%
YTD $38M27 1.9% $137.56$2,159,706 165- $136.34 5.3%
2019 $308.5M69 13.8% $129.06$6,130,205 1577.2% $129.72 5.4%
2018 $227M61 12.5% $115.66$4,244,716 1466.5% $120.56 5.4%
2017 $49.4M57 4.0% $115.53$1,788,270 1287.2% $105.65 5.7%
2016 $90.1M28 5.9% $97.34$3,573,510 1176.0% $96.55 5.8%
2015 $23.2M38 2.1% $94.00$721,880 102- $84.03 6.2%
2014 $73.7M31 5.1% $99.47$3,293,818 907.8% $74.10 6.6%
2013 $53.1M49 7.9% $72.78$1,696,071 827.7% $67.52 6.8%
2012 $11.5M32 1.7% $61.58$527,408 8311.1% $68.20 6.8%
2011 $20.2M39 3.4% $53.72$912,366 818.9% $66.52 6.9%
2010 $27.7M37 4.9% $67.12$793,595 819.3% $66.45 7.0%
2009 $13M8 1.3% $66.55$2,161,825 83- $68.55 7.0%
(1) Completed transaction data is based on actual arms-length sales transactions and levels are dependent on the mix of what happened to sell in the period.
(2) Market price trends data is based on the estimated price movement of all properties in the market, informed by actual transactions that have occurred.
SPECIALIZED INDUSTRIAL SALES
Completed Transactions (1)
Turnover Avg Price/SFDeals VolumeYear
Market Pricing Trends (2)
Avg Price Price IndexAvg Cap Rate Price/SF Cap Rate
2024 -- - -- 193- $159.22 4.8%
2023 -- - -- 191- $157.52 4.7%
2022 -- - -- 181- $149.29 4.8%
2021 -- - -- 148- $122.26 5.3%
2020 -- - -- 152- $125.66 5.6%
YTD -- - -- 167- $138.31 5.2%
2019 $19.2M3 4.7% $98.86$19,150,000 159- $131.59 5.3%
2018 $3M3 0.5% $139.54$1,002,333 149- $123.06 5.3%
2017 $1.5M5 1.9% $67.01$1,501,000 129- $106.29 5.6%
2016 $2.9M4 0.7% $101.02$735,313 118- $97.73 5.7%
2015 $2.5M2 0.7% $84.78$1,253,436 104- $86.07 6.0%
2014 $5.8M5 1.4% $114.04$1,456,000 92- $76.37 6.4%
2013 $2.6M6 9.4% $86.02$871,667 84- $69.78 6.6%
2012 -- - -- 86- $71.08 6.6%
2011 $855K2 0.4% $54.39$427,500 81- $67.09 6.8%
2010 $299.1K2 7.6% $52.01$299,050 81- $67.09 6.9%
2009 $10.5M3 4.2% $60.84$4,812,500 84- $69.56 6.9%
(1) Completed transaction data is based on actual arms-length sales transactions and levels are dependent on the mix of what happened to sell in the period.
(2) Market price trends data is based on the estimated price movement of all properties in the market, informed by actual transactions that have occurred.
9/27/2020Copyrighted report licensed to ROI Appraisal Britton Group - 103161
Page 18
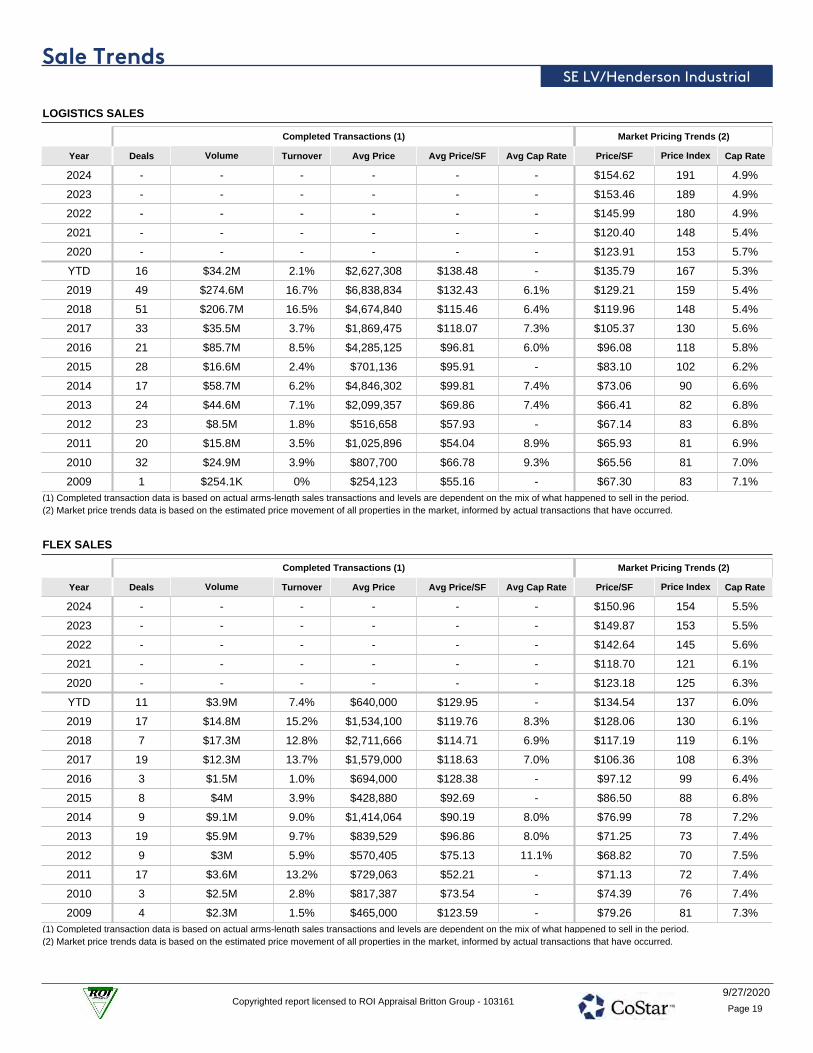
Sale TrendsSE LV/Henderson Industrial
LOGISTICS SALES
Completed Transactions (1)
Turnover Avg Price/SFDeals VolumeYear
Market Pricing Trends (2)
Avg Price Price IndexAvg Cap Rate Price/SF Cap Rate
2024 -- - -- 191- $154.62 4.9%
2023 -- - -- 189- $153.46 4.9%
2022 -- - -- 180- $145.99 4.9%
2021 -- - -- 148- $120.40 5.4%
2020 -- - -- 153- $123.91 5.7%
YTD $34.2M16 2.1% $138.48$2,627,308 167- $135.79 5.3%
2019 $274.6M49 16.7% $132.43$6,838,834 1596.1% $129.21 5.4%
2018 $206.7M51 16.5% $115.46$4,674,840 1486.4% $119.96 5.4%
2017 $35.5M33 3.7% $118.07$1,869,475 1307.3% $105.37 5.6%
2016 $85.7M21 8.5% $96.81$4,285,125 1186.0% $96.08 5.8%
2015 $16.6M28 2.4% $95.91$701,136 102- $83.10 6.2%
2014 $58.7M17 6.2% $99.81$4,846,302 907.4% $73.06 6.6%
2013 $44.6M24 7.1% $69.86$2,099,357 827.4% $66.41 6.8%
2012 $8.5M23 1.8% $57.93$516,658 83- $67.14 6.8%
2011 $15.8M20 3.5% $54.04$1,025,896 818.9% $65.93 6.9%
2010 $24.9M32 3.9% $66.78$807,700 819.3% $65.56 7.0%
2009 $254.1K1 0% $55.16$254,123 83- $67.30 7.1%
(1) Completed transaction data is based on actual arms-length sales transactions and levels are dependent on the mix of what happened to sell in the period.
(2) Market price trends data is based on the estimated price movement of all properties in the market, informed by actual transactions that have occurred.
FLEX SALES
Completed Transactions (1)
Turnover Avg Price/SFDeals VolumeYear
Market Pricing Trends (2)
Avg Price Price IndexAvg Cap Rate Price/SF Cap Rate
2024 -- - -- 154- $150.96 5.5%
2023 -- - -- 153- $149.87 5.5%
2022 -- - -- 145- $142.64 5.6%
2021 -- - -- 121- $118.70 6.1%
2020 -- - -- 125- $123.18 6.3%
YTD $3.9M11 7.4% $129.95$640,000 137- $134.54 6.0%
2019 $14.8M17 15.2% $119.76$1,534,100 1308.3% $128.06 6.1%
2018 $17.3M7 12.8% $114.71$2,711,666 1196.9% $117.19 6.1%
2017 $12.3M19 13.7% $118.63$1,579,000 1087.0% $106.36 6.3%
2016 $1.5M3 1.0% $128.38$694,000 99- $97.12 6.4%
2015 $4M8 3.9% $92.69$428,880 88- $86.50 6.8%
2014 $9.1M9 9.0% $90.19$1,414,064 788.0% $76.99 7.2%
2013 $5.9M19 9.7% $96.86$839,529 738.0% $71.25 7.4%
2012 $3M9 5.9% $75.13$570,405 7011.1% $68.82 7.5%
2011 $3.6M17 13.2% $52.21$729,063 72- $71.13 7.4%
2010 $2.5M3 2.8% $73.54$817,387 76- $74.39 7.4%
2009 $2.3M4 1.5% $123.59$465,000 81- $79.26 7.3%
(1) Completed transaction data is based on actual arms-length sales transactions and levels are dependent on the mix of what happened to sell in the period.
(2) Market price trends data is based on the estimated price movement of all properties in the market, informed by actual transactions that have occurred.
9/27/2020Copyrighted report licensed to ROI Appraisal Britton Group - 103161
Page 19

Las Vegas - NV
PREPARED BY
Luke Adamo
Broker
Industrial Market Report
INDUSTRIAL MARKET REPORT
Market Key Statistics 2
Leasing 3
Rent 7
Construction 9
Under Construction Properties 11
Sales 13
Sales Past 12 Months 14
Economy 16
Market Submarkets 19
Supply & Demand Trends 21
Rent & Vacancy 23
Sale Trends 25
Las Vegas Industrial
9/21/2020Copyrighted report licensed to ROI Appraisal Britton Group - 103161

OverviewLas Vegas Industrial
4.3 M 1.7 M 6.3% 4.4%12 Mo Deliveries in SF 12 Mo Net Absorption in SF Vacancy Rate 12 Mo Rent Growth
The Las Vegas industrial market is looking to capitalizeon its favorable location, being within a day's drive toSouthern California and large portions of Arizona. Thecity of Las Vegas is promoting the metro as a “majorWest Coast logistics hub” through infrastructureimprovements and by leveraging existing rail lines andairfreight facilities.
This is part of an ongoing effort to diversify the localeconomy, and government officials in North Las Vegasare looking to lure new companies with quick permittingand financial incentives. The past several years haveseen numerous national tenants locate or expand theirpresence in Las Vegas. Companies including Amazon,Sephora, FedEx and Bed Bath & Beyond have all takenspace in the market in last few years.
Las Vegas has seen a number of infrastructureimprovements over the past few years aimed atimproving traffic flow. The Nevada Department of
Transportation began a multiyear, multiphase, $200million-plus upgrade of U.S. 95 in 2010. Another projectcompleted in 2019 is the $1.5 billion Project Neon, whichwidened 3.7 miles of I-15 and provides a directconnection between U.S. 95 and I-15 while improvingthe Spaghetti Bowl interchange.
Construction levels remain elevated after developershave already inundated the metro, particularly the NorthLas Vegas Submarket. Rent growth was strong over thepast several years but started to slow recently as thecoronavirus pandemic impacts the economy. Vacanciesare also forecast to rise as demand falters and themillions of SF in the pipeline deliver.
Investment volume slowed in the third quarter after asolid start to the year, where volume received a boostfrom a sizable trade. This follows 2019 which saw salessurpass $1 billion for the second straight year and sawthe highest sales volume over the past decade.
KEY INDICATORS
Market RentVacancy RateRBACurrent Quarter Availability RateNet Absorption
SFDeliveries SF
UnderConstruction
$0.737.1%105,996,344Logistics 8.7% 56,519 798,672 3,366,809
$0.853.0%18,451,483Specialized Industrial 7.7% 125,914 0 1,684,230
$1.015.4%22,244,896Flex 6.3% (121,738) 0 15,960
$0.796.3%146,692,723Market 8.2% 60,695 798,672 5,066,999
ForecastAverage
HistoricalAverage
12 MonthAnnual Trends Peak When Trough When
8.9%8.3%1.7%Vacancy Change (YOY) 14.3% 2010 Q1 4.0% 2006 Q2
3,376,8543,109,8081.7 MNet Absorption SF 8,585,293 2018 Q2 (4,087,791) 2010 Q1
5,297,3913,456,3454.3 MDeliveries SF 8,626,361 2007 Q2 63,108 2012 Q3
2.1%0.9%4.4%Rent Growth 8.7% 2019 Q3 -13.5% 2010 Q1
N/A$563.4M$1.8 BSales Volume $2B 2020 Q2 $74.4M 2010 Q2
9/21/2020Copyrighted report licensed to ROI Appraisal Britton Group - 103161
Page 2
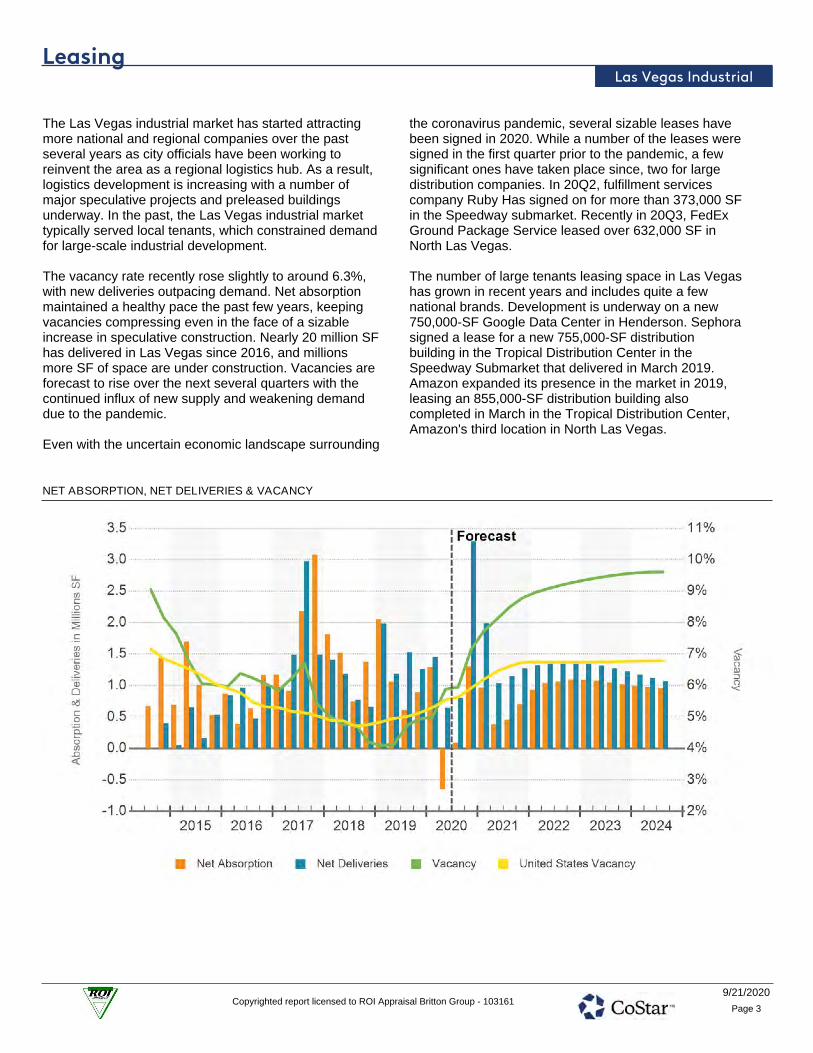
LeasingLas Vegas Industrial
The Las Vegas industrial market has started attractingmore national and regional companies over the pastseveral years as city officials have been working toreinvent the area as a regional logistics hub. As a result,logistics development is increasing with a number ofmajor speculative projects and preleased buildingsunderway. In the past, the Las Vegas industrial markettypically served local tenants, which constrained demandfor large-scale industrial development.
The vacancy rate recently rose slightly to around 6.3%,with new deliveries outpacing demand. Net absorptionmaintained a healthy pace the past few years, keepingvacancies compressing even in the face of a sizableincrease in speculative construction. Nearly 20 million SFhas delivered in Las Vegas since 2016, and millionsmore SF of space are under construction. Vacancies areforecast to rise over the next several quarters with thecontinued influx of new supply and weakening demanddue to the pandemic.
Even with the uncertain economic landscape surrounding
the coronavirus pandemic, several sizable leases havebeen signed in 2020. While a number of the leases weresigned in the first quarter prior to the pandemic, a fewsignificant ones have taken place since, two for largedistribution companies. In 20Q2, fulfillment servicescompany Ruby Has signed on for more than 373,000 SFin the Speedway submarket. Recently in 20Q3, FedExGround Package Service leased over 632,000 SF inNorth Las Vegas.
The number of large tenants leasing space in Las Vegashas grown in recent years and includes quite a fewnational brands. Development is underway on a new750,000-SF Google Data Center in Henderson. Sephorasigned a lease for a new 755,000-SF distributionbuilding in the Tropical Distribution Center in theSpeedway Submarket that delivered in March 2019.Amazon expanded its presence in the market in 2019,leasing an 855,000-SF distribution building alsocompleted in March in the Tropical Distribution Center,Amazon's third location in North Las Vegas.
NET ABSORPTION, NET DELIVERIES & VACANCY
9/21/2020Copyrighted report licensed to ROI Appraisal Britton Group - 103161
Page 3
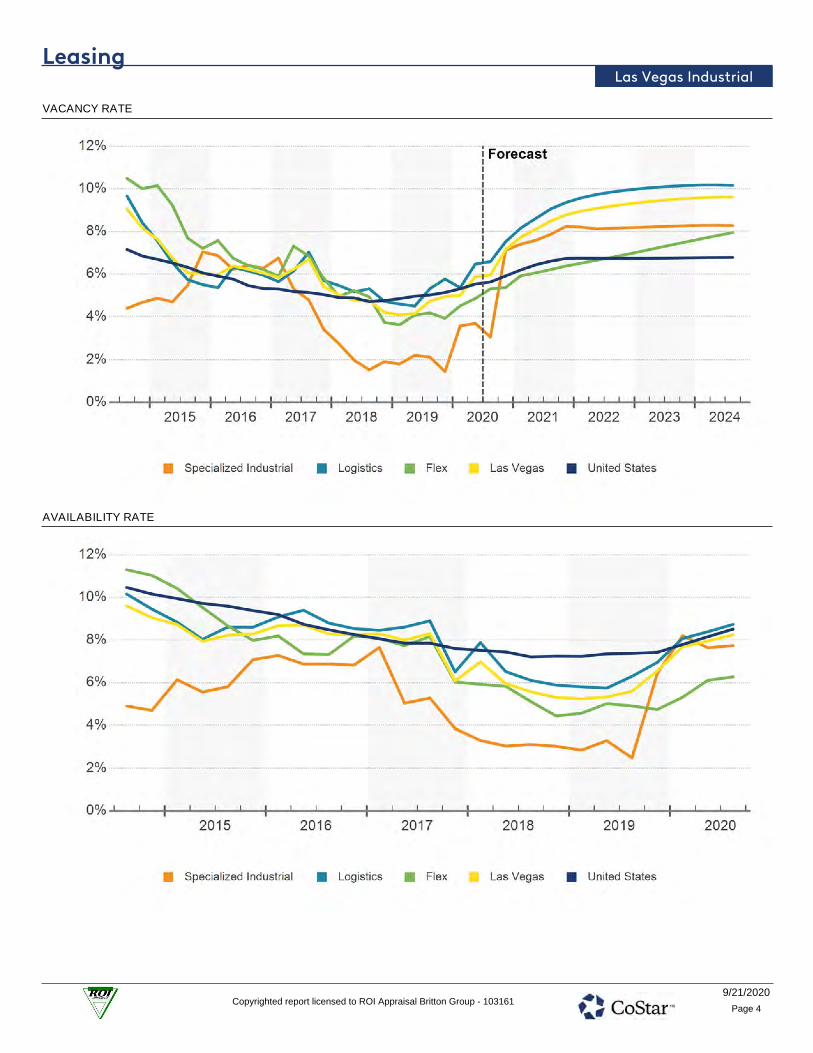
LeasingLas Vegas Industrial
VACANCY RATE
AVAILABILITY RATE
9/21/2020Copyrighted report licensed to ROI Appraisal Britton Group - 103161
Page 4

LeasingLas Vegas Industrial
12 MONTH NET ABSORPTION SF IN SELECTED BUILDINGS
3rd QtrBuilding Name/Address Submarket Bldg SF Vacant SF
1st Qtr 2nd Qtr 4th Qtr 12 Month
Net Absorption SF
North Las Vegas Ind 322,560 0 322,560 0 0 0 322,5604800 E Tropical Pky
North Las Vegas Ind 254,548 0 254,548 (10,000) 10,000 0 254,548Sunpoint Crossing (1)
Speedway Ind 213,818 0 213,818 0 0 0 213,818Centennial Commerce Center
North Las Vegas Ind 731,561 213,989 0 0 203,884 0 203,884Northgate Distribution Center
North Las Vegas Ind 169,628 0 169,628 0 0 0 169,628Bldg 2
Speedway Ind 168,000 0 54,212 68,333 45,455 0 168,000Speedway Commerce Center IV
North Las Vegas Ind 207,689 43,884 0 163,805 0 0 163,805Sunpoint Crossing (2)
Speedway Ind 333,704 0 90,163 0 0 0 126,387Harsch Speedway Commerce C…
North Las Vegas Ind 271,616 0 0 (67,584) 67,584 0 124,546Sunrise Industrial Park
SE LV/Henderson Ind 105,000 0 0 105,000 0 0 105,000All In Aviation
North Las Vegas Ind 102,948 0 102,948 0 0 0 92,8771840 Aerojet Way
North Las Vegas Ind 80,278 0 78,518 0 0 0 78,690Bldg 1
SW Las Vegas Ind 83,899 6,380 30,755 21,886 12,878 0 77,519Matter Business Park at Warm S…
Speedway Ind 251,800 176,600 0 75,200 0 0 75,200LogistiCenter at Speedway
SE LV/Henderson Ind 75,000 0 75,000 0 0 0 75,000VSR Industries
SE LV/Henderson Ind 74,347 0 73,840 0 0 0 73,840AirParc Industrial
SW Las Vegas Ind 71,093 0 71,093 0 0 0 71,093Southwest Commerce Center
3,517,489 440,853 1,537,083 356,640 339,801 0 2,396,395Subtotal Primary Competitors
143,175,234 8,863,120 (246,204) (1,008,669) (279,106) 0 (744,610)Remaining Las Vegas Market
146,692,723 9,303,973 1,290,879 (652,029) 60,695 0 1,651,785Total Las Vegas Market
9/21/2020Copyrighted report licensed to ROI Appraisal Britton Group - 103161
Page 5

LeasingLas Vegas Industrial
TOP INDUSTRIAL LEASES PAST 12 MONTHS
Building Name/Address Submarket Leased SF Tenant Name Tenant Rep Company Leasing Rep CompanyQtr
5265 N Sloan Ln North Las Vegas 632,324 FedEx Ground Package S… - CBREQ3 20
6710 E North Belt Rd Speedway 373,363 Ruby Has Berkshire Hathaway… CBREQ2 20
3049 E Washburn Rd North Las Vegas 350,528 Whitebox Technologies, L… - CBRE;Cushman & Wa…Q3 20
5605 N Hollywood Blvd Speedway 285,547 Lowe's Home Center - Colliers InternationalQ1 20
5430 Donovan Way North Las Vegas 203,884 Camco Manufacturing, Inc. Cushman & Wakefield CBREQ1 20
6335 N Hollywood Blvd Speedway 190,362 Lucky Top - Cushman & WakefieldQ3 20
5801 N Nicco Way Speedway 170,272 - Logic Commercial R… CBREQ2 20
4390 Flossmoor St * North Las Vegas 135,250 TemperPack - CBREQ4 19
3732 N Las Vegas Blvd North Las Vegas 115,243 Updike Distribution Logistics Colliers International CBREQ4 19
3450 N Lamb Blvd North Las Vegas 103,000 The Distribution Point Colliers International CBREQ2 20
1387 Raiders Way SE LV/Henderson 100,692 Creative Technology JLL Colliers InternationalQ2 20
3702 N Las Vegas Blvd North Las Vegas 94,686 - - CBREQ3 20
74 W Craig Rd North Las Vegas 89,032 One Stop Mailing NAI Vegas JLLQ3 19
6565 Nascar St Speedway 75,800 Dialog Direct JLL CBREQ1 20
3125-3135 Marco St North Las Vegas 75,000 All American Convention… NAI Vegas JLLQ4 19
2821 Marion Dr North Las Vegas 67,584 Amazon - Logic Commercial Real…Q3 20
4025 E Cheyenne Ave North Las Vegas 66,000 Bekins Commercial Install… - NAI VegasQ2 20
6565 Nascar St Speedway 64,400 - Cushman & Wakefield CBREQ2 20
6565 Nascar St Speedway 63,600 May Manufacturing, LLC - CBREQ3 20
3450 N Lamb Blvd North Las Vegas 60,794 The Distribution Point - CBREQ4 19
3702 N Las Vegas Blvd North Las Vegas 55,552 - - CBREQ2 20
2020 Mendenhall Dr North Las Vegas 53,200 Filmwerks Char Luxury Real Es… Colliers InternationalQ4 19
4208 W Cheyenne Ave North Las Vegas 50,670 Botanic Beauty Products,… Colliers International Colliers InternationalQ2 20
8035 Dean Martin Dr SW Las Vegas 50,000 - - Colliers InternationalQ3 20
3920 W Sunset Rd * SW Las Vegas 50,000 Codale Electric Supply - Majestic Realty Co.Q2 20
4151 Industrial Center Dr North Las Vegas 49,392 Ship Hero LLC - JLLQ2 20
70 W Craig Rd North Las Vegas 48,122 D'Andrea Visual Commun… - JLLQ4 19
2951 Marion Dr North Las Vegas 47,520 Amazon - Logic Commercial Real…Q3 20
4550 Engineers Way North Las Vegas 47,060 - - NAI VegasQ1 20
470 Mirror Ct * SE LV/Henderson 46,649 GT Ventures, LLC - -Q3 19
3101 N Marion Dr North Las Vegas 46,080 Corporate Design Concepts NAI Vegas Colliers InternationalQ4 19
7350 Prairie Falcon Rd Northwest Las Vegas 45,000 Las Vegas Basketball Ce… Albright Callister & A… MDL GroupQ4 19
6335 N Hollywood Blvd Speedway 43,916 RumbleOn - Harsch Investment Pro…Q4 19
4750 W Sunset Rd SW Las Vegas 42,000 - - Sun Commercial Real…Q3 20
5607 Edmond St SW Las Vegas 41,455 - - Colliers InternationalQ4 19
6255 N Hollywood Dr Speedway 40,803 Wholesome Goods - Harsch Investment Pro…Q4 19
3702 N Las Vegas Blvd North Las Vegas 40,222 Golden Star Inc. NAI Vegas CBREQ3 20
1070 Mary Crest Rd SE LV/Henderson 40,000 Apex Plastics, LLC Wardley Real Estate CBREQ1 20
6770 Bermuda Rd * Airport/E Las Vegas 39,995 Hajoca - NAI VegasQ4 19
6425 Santa Margarita St SW Las Vegas 38,972 - - RealComm AdvisorsQ3 20
*Renewal
9/21/2020Copyrighted report licensed to ROI Appraisal Britton Group - 103161
Page 6

RentLas Vegas Industrial
Industrial rents in Las Vegas have just recovered fromlosses sustained during the last recession before beingforecast to decrease in the near-term as the market isaffected by the coronavirus pandemic. Average askingrents are nearly $9.40/SF, on par with their peak in2007, following sustained positive rent growth over thepast decade.
Rent growth in Las Vegas has slowed this year as thecoronavirus pandemic impacts the market. Year-over-year rent gains are around 4.4%, down from 8.7% fourquarters ago. Las Vegas industrial rent growth in 2019ran counter to CoStar's National Index, which saw gainsdecline each quarter. Las Vegas experienced a laterrecovery than most industrial markets, following fiveconsecutive years of rent losses. Rent growth reallypicked up in starting in 2014 and averaged nearly 7.5%annually from 2015 to 2019.
Logistics properties have the lowest average asking rentsof the industrial property types in Las Vegas. However,logistics is seeing the highest year-over-year rent gainsof around 6%, down from approximately 9% in late 2019.Average asking rents for logistics buildings are around7% lower than the market average, despite seeingaverage annual rent growth of more than 8% from 2015to 2019. While logistics properties have the lowest askingrents, the strong rent growth over the past several yearshas boosted asking rent to nearly 5% above their peak
from 2007. By contrast, asking rents for specializedindustrial and flex properties have still not fullyrecovered.
The coronavirus pandemic and the continued influx ofnew supply is weighing on rent growth in North LasVegas. Rent growth has recently slowed to around 5.5%,down from around 9.5% in late 2019 when thesubmarket saw some of the highest rent gains in themarket. North Las Vegas is the metro's largestsubmarket in terms of inventory and continues to be thetarget of the majority of the past decade's newdevelopment. Nearly all the new construction in NorthLas Vegas over the past several years has been logisticsproperties, as well as the majority of new development inthe metro as a whole. Logistics continues to see the topgains in the submarket, well above those for flex andspecialized industrial properties.
The Northwest Submarket, though one of the smallestsubmarkets by inventory, has the highest average askingrents in the metro at around $12.40/SF. This is due tothe relatively high proportion of flex inventory in thesubmarket compared to logistics and specializedindustrial. While flex has seen more moderate rentgrowth the past several years, average asking rents forflex are close to 30% above the metro and over 35%more than logistics average asking rents.
9/21/2020Copyrighted report licensed to ROI Appraisal Britton Group - 103161
Page 7

RentLas Vegas Industrial
MARKET RENT GROWTH (YOY)
MARKET RENT PER SQUARE FEET
9/21/2020Copyrighted report licensed to ROI Appraisal Britton Group - 103161
Page 8

ConstructionLas Vegas Industrial
Industrial construction in Las Vegas remains elevatedeven with the uncertainty surrounding the coronaviruspandemic. Approximately 5.1 million SF of industrialspace is underway, in addition to the nearly 20 million SFdelivered since the start of 2016. New development wasboosted by solid demand with positive net absorptionexceeding 3% of inventory in four of the past five years,which boosted confidence for new development. Withdemand anticipated to slow due to the pandemic, thepace of construction may slow as well as developerspostpone new groundbreakings.
Logistics-oriented warehouse and distribution spacecontinues to dominate new development, atapproximately 70% of the metro's total industrialconstruction. Logistics has been the top industrialproperty type for new construction over the past several
years as ecommerce gains in popularity and Las Vegasworks to become a regional distribution hub.
However, for the first time in several yeas the amount ofspecialized industrial space in development is rising. Thelargest property underway in the metro is the build-to-suit that broke ground in summer 2019 in the SE LasVegas/Henderson Submarket: the 750,000-SF GoogleData Center.
North Las Vegas continues to be the top submarket fornew development, with several sizable buildings underconstruction. One of the largest projects underway is a652,000-SF building in the Golden Triangle LogisticsCenter. The majority of space under way in North LasVegas is speculative, with only around 25% of the SFunder construction preleased.
DELIVERIES & DEMOLITIONS
9/21/2020Copyrighted report licensed to ROI Appraisal Britton Group - 103161
Page 9

ConstructionLas Vegas Industrial
SUBMARKET CONSTRUCTION
Average Building Size
RankUnder Constr
Under Construction Inventory
All ExistingSF (000) Pre-Leased SF (000)SubmarketNo. RankBldgs Pre-Leased %
1 North Las Vegas 11 2,312 210,14318.8% 4 40,318435 2
2 SE LV/Henderson 5 1,683 336,54284.2% 2 32,1351,416 1
3 SW Las Vegas 5 526 105,10747.0% 3 30,568247 4
4 Speedway 2 297 148,6290% 5 110,4020 3
5 Airport/E Las Vegas 9 238 26,4420% 5 30,6740 5
6 Outlying NE Clark Cty 1 12 11,950100% 1 15,88212 6
7 Central Las Vegas 0 - -- - 27,004- -
8 Northwest Las Vegas 0 - -- - 22,241- -
9 Outlying S Clark Cnty 0 - -- - 7,176- -
10 West Las Vegas 0 - -- - 22,982- -
Totals 33 5,067 153,54541.6% 32,7372,109
9/21/2020Copyrighted report licensed to ROI Appraisal Britton Group - 103161
Page 10

Under Construction PropertiesLas Vegas Industrial
33 5,066,999 4.1% 41.6%Properties Square Feet Percent of Inventory Preleased
UNDER CONSTRUCTION PROPERTIES
UNDER CONSTRUCTION
Property Name/Address Rating Bldg SF Stories Start Complete Developer/Owner
Jul 20191627 Athol Ave
Google Data Center750,000 1 Dec 2020
-
Google Inc1
Oct 20193195 E Washburn Rd
Bldg 2652,010 1 Oct 2020
-
Golden Triangle Development Inc2
Aug 201912300 Bermuda Rd
Amazon616,150 - Dec 2020
Panattoni Development Company…
Panattoni Development Company…3
Aug 20194004 W Cheyenne Ave
E479,579 1 Oct 2020
-
Matter Durango LLC4
Oct 20193049 E Washburn Rd
Bldg 1350,528 1 Oct 2020
-
Earth Day Texas, Inc5
Oct 20193777 Marion Dr
282,220 1 Oct 2020-
Becknell6
Jan 20208050 W Valley View Blvd
Building 3241,920 1 Oct 2020
-
-7
9/21/2020Copyrighted report licensed to ROI Appraisal Britton Group - 103161
Page 11

Under Construction PropertiesLas Vegas Industrial
UNDER CONSTRUCTION
Property Name/Address Rating Bldg SF Stories Start Complete Developer/Owner
Feb 20206250 Howdy Wells Ave
North Las Vegas Busine…190,553 1 Oct 2020
-
Becknell Industrial8
Nov 20191720 Chaparral Rd
Bldg C183,560 1 Oct 2020
-
Panattoni Development Company9
Jan 20208015 Dean Martin Dr
Building 1174,313 1 Oct 2020
-
Juliet Companies, LLC10
Jun 20202081 E Sunset Rd
LogistiCenter at Sunset151,200 1 Apr 2021
-
-11
Feb 20203679 N Civic Center Dr
Civic Center at Gowan118,021 1 Dec 2020
-
Cecil J & Richard J Hallinan12
Feb 20205360 N Beesley Dr
106,705 1 Oct 2020-
Becknell Industrial13
Mar 2020Lone Mountain Rd & Berg S
Lone Mountain Logistics93,995 1 Nov 2020
-
Pycior Romuald14
Aug 2019W Cheyenne Ave. & Sim…
86,920 1 Oct 2020-
Odyssey Real Estate Capital15
Nov 20191725 Chaparral Rd
Bldg D83,000 1 Oct 2020
-
Panattoni Development Company16
Aug 20193774 W Cheyenne Ave
D72,349 1 Oct 2020
-
Matter Durango LLC17
Aug 20194204 W Cheyenne Ave
B66,484 1 Oct 2020
-
Matter Durango LLC18
Aug 20193778 W Cheyenne Ave
C58,794 1 Oct 2020
-
Burke Construction Group, Inc19
Jan 20208035 Dean Martin Dr
Building 255,000 1 Oct 2020
-
-20
Aug 20194208 W Cheyenne Ave
A50,670 1 Oct 2020
-
Matter Durango LLC21
Jan 20202201 Moser Dr
50,000 1 Oct 2020-
City of Henderson Public Works22
Feb 202013850 S Decatur Blvd
36,810 1 Jan 2021-
Petersen Management23
Mar 20197090 W Arby Ave
17,494 1 Dec 2020-
County of Clark, Dept of Aviation24
Jun 20204000 E Patrick Ln
15,960 2 Dec 2020-
-25
Apr 20205456 Stephanie St
Building 612,002 2 Feb 2021
-
-26
Mar 2020800 Agave Rd
11,950 1 Oct 2020-
-27
Apr 20205456 Stephanie St
Building 211,548 2 Feb 2021
-
-28
9/21/2020Copyrighted report licensed to ROI Appraisal Britton Group - 103161
Page 12

SalesLas Vegas Industrial
Investment has slowed in the third quarter following solidsales in the first half of the year, which was bolstered bya significant trade. Transactions in 2019 surpassed $1billion for the second year in a row and made it a banneryear for sales over the past decade. Sales volumetotaled just over $1 billion in 2018, up from around $715million in 2017 and significantly higher than the metro'shistorical average of about $520 million. Investors appearto be more cautious in the current economic environmentand sales are unlikely to reach the peak levels of thepast couple of years.
One of the notable transactions of 2020 was the Maysale of an Amazon distribution building by developerVanTrust Real Estate for $110 million ($129/SF).Preylock Holdings acquired the 855,000-SF building inthe Tropical Distribution Center, built in 2019, and 100%leased to Amazon.
More recently in July, the Moulton Company acquired a322,560-SF distribution building in North Las Vegas for$45.2 million ($140/SF). The property was built in 2020and was sold by developer VanTrust Real Estate 100%leased to a single tenant.
Logistics continues to see the highest share of dealvolume in 2020, after making up approximately 75% ofthe total sales volume in the metro in 2018 and 2019.Along with sales volume, Las Vegas' average price perSF is rising, now approximately 20% higher than thenation's. Cap rates have compressed by around 150basis points over the past decade to around 5.5%.
Developers have been some of the top sellers in themarket recently as they sell newly completed properties,many to REITs, private equity, and institutional investors,which have been some of the top buyers over the pastfew years.
SALES VOLUME & MARKET SALE PRICE PER SF
9/21/2020Copyrighted report licensed to ROI Appraisal Britton Group - 103161
Page 13

Sales Past 12 MonthsLas Vegas Industrial
284 6.6% $134 18.8%Sale Comparables Avg. Cap Rate Avg. Price/SF Avg. Vacancy At Sale
SALE COMPARABLE LOCATIONS
SALE COMPARABLES SUMMARY STATISTICS
Sales Attributes Low Average Median High
Sale Price $215,000 $9,605,996 $2,678,174 $110,000,000
Price/SF $20 $134 $144 $1,061
Cap Rate 4.3% 6.6% 6.6% 9.2%
Time Since Sale in Months 0.1 7.4 7.9 12.0
Property Attributes Low Average Median High
Building SF 1,650 54,533 11,373 855,000
Ceiling Height 8' 21'5" 20' 41'
Docks 0 7 0 124
Vacancy Rate At Sale 0% 18.8% 0% 100%
Year Built 1952 1998 1999 2020
Star Rating 2.4
9/21/2020Copyrighted report licensed to ROI Appraisal Britton Group - 103161
Page 14

Sales Past 12 MonthsLas Vegas Industrial
Property Name - Address Rating Yr Built Bldg SF Vacancy Price Price/SF
Property
Sale Date
Sale
Cap Rate
RECENT SIGNIFICANT SALES
-1 Amazon2019 855,000 0% $110,000,000 $129
6001 E Tropical Pky5/11/2020 -
-2 Bldg. 92018 731,561 57.1% $90,204,236 $123
5430 Donovan Way9/26/2019 -
-3 Northgate Distribution C…2017 558,286 0% $73,660,498 $132
4490 Nexus Way9/26/2019 -
-4 The Honest Co2017 570,810 0% $70,383,030 $123
5550 Donovan Way9/26/2019 -
-5 Bldg 162007 513,240 0% $67,717,110 $132
3837 Bay Lake Trail9/26/2019 -
-6 5605 N Hollywood Blvd2019 670,798 100% $62,384,214 $931/7/2020 5.3%
-7 7000 Placid St1994 309,208 0% $54,010,407 $1759/26/2019 -
-8 4800 E Tropical Pky2020 322,560 0% $45,226,000 $1407/22/2020 -
-9 SunPoint Business Center2016 311,501 0% $42,925,787 $138
2695 N Lamb Blvd12/10/2019 -
-10 Building 22019 290,147 100% $39,983,141 $138
3702 N Las Vegas Blvd12/10/2019 -
-11 4025 E Cheyenne Ave2015 381,804 0% $38,123,738 $1001/8/2020 -
-12 Northern Beltway Indust…2007 234,836 0% $36,200,753 $154
5406 E El Campo Grande…12/10/2019 -
-13 Bldg 12003 266,800 0% $35,201,708 $132
3200 E Gowan Rd9/26/2019 -
-14 3717 Bay Lake Trail2005 266,160 0% $35,117,267 $1329/26/2019 -
-15 Building 32019 254,548 100% $35,077,490 $138
3732 N Las Vegas Blvd12/10/2019 -
-16 Bldg B2017 200,450 0% $31,329,278 $156
8385 Eastgate Rd12/10/2019 -
-17 Building 12019 207,689 100% $28,620,177 $138
3450 N Lamb Blvd12/10/2019 -
-18 National Indoor RV Cent…2018 215,804 0% $28,473,274 $132
4640 Nexus Way9/26/2019 -
-19 Bldg A2008 181,431 0% $27,968,194 $154
5402 E El Campo Grande…12/10/2019 -
-20 Bldg A2016 163,000 0% $25,476,040 $156
8390 Eastgate Rd12/10/2019 -
9/21/2020Copyrighted report licensed to ROI Appraisal Britton Group - 103161
Page 15

EconomyLas Vegas Industrial
Las Vegas' recovery came to a standstill with the spreadof the coronavirus but that is ending as businesses beginto reopen. The Las Vegas Strip shuttered all casinos forthe first time in more than 50 years, and in a market sodependent on tourism, it had ripple effects through thelocal economy. Numerous casinos have reopened withnew guidelines, bringing both a portion of leisure andhospitality employees back to work and tourists back tothe metro, but unemployment remained elevated in Julyat around 16.5% according to the Bureau of LaborStatistics.
Prior to the impact of the coronavirus, Las Vegas wassteadily recovering from the recession, bolstered bypositive job and population growth. Annual job growth inthe Las Vegas metro averaged around 3% over the pastfive years, based on numbers from the U.S. Bureau ofLabor Statistics. The Las Vegas metro saw steadygrowth in the number of people moving to the area overthe past decade, and approximately two-thirds of thepopulation growth has come from in-migration fromother states, with a significant portion from southernCalifornia metros.
While state and local officials are working to diversify theeconomy, the leisure and hospitality sector remains LasVegas' primary economic driver. The metro's economicsuccess is inherently tied to tourism, with nearly one inthree jobs based in the sector. The metro attracted morethan 40 million visitors from 2014 to 2019, an all-timerecord, but the decrease in tourism due to thecoronavirus will break that streak. Visitor volume in Maywas down 95% compared to the same month theprevious year according to the Las Vegas Conventionand Visitors Authority. While visitor volume has started torecover with the reopening of many casinos and hotels,visitor volume in July was still down approximately 60%from the same month last year.
With coronavirus dampening travel and large groupgatherings, numerous events were canceled in LasVegas, including all conventions. Hotel occupancy in Julywas down by nearly 50% compared to the previous yearand McCarran International Airport saw passenger trafficdecline by around 65%.
The construction industry's recovery was halted by thecoronavirus after being hit hard by the collapse of thehousing market during the recession. Annualemployment growth in the construction sector over thepast five years averaged around 10%. However, thenumber of workers still remains at only approximately65% of prerecession levels. The metro employed morethan 110,000 construction workers in 2006 and around77,000 workers in March prior to pandemic. The sectorshed about 7,000 jobs, with layoffs not as severe asother sectors with construction allowed to continue.
Construction recently completed on one of the mostsignificant projects in the metro: the new 65,000-seatAllegiant Stadium for the Las Vegas Raiders. TheRaiders and the Las Vegas Stadium Authority partneredto build the stadium, which has held the first practicegames already. While the stadium will go ahead and hostNFL games in 2020, it will be closed to fans due to thepandemic.
The state-backed economic impact report on thestadium is estimating a total economic output of $620million, as well as $35 million new tax dollars each year.Those projections are based on the stadium hosting 46events per year and drawing approximately 450,000 newvisitors. The report also estimates that the stadium wouldcreate an additional around 5,900 permanent jobsthroughout the region.
9/21/2020Copyrighted report licensed to ROI Appraisal Britton Group - 103161
Page 16

EconomyLas Vegas Industrial
LAS VEGAS EMPLOYMENT BY INDUSTRY IN THOUSANDS
NAICS Industry Jobs LQ MarketUS USMarketUSMarket
Current Level 12 Month Change 10 Year Change 5 Year Forecast
0.84%0.96%0.38%2.78%-6.61%-2.09%0.325Manufacturing
1.54%3.60%0.37%0.59%-7.88%-15.29%1.0156Trade, Transportation and Utilities
1.89%4.05%-0.23%-0.23%-9.49%-17.75%1.090 Retail Trade
0.70%1.61%1.19%2.93%-1.30%-1.31%1.054Financial Activities
0.64%1.41%-0.25%0.64%-3.28%-2.99%0.7102Government
1.43%1.36%2.27%5.13%-5.43%3.36%1.573Natural Resources, Mining and Construction
2.30%3.80%1.41%3.29%-5.20%-8.86%0.796Education and Health Services
2.30%5.51%1.64%2.16%-7.39%-19.01%1.0124Professional and Business Services
1.45%4.19%0.22%0.94%-3.52%-12.38%0.610Information
8.71%8.49%-1.80%-2.73%-34.15%-35.21%2.8191Leisure and Hospitality
3.20%5.11%-0.67%0.77%-15.66%-20.21%0.826Other Services
Total Employment 858 1.0 -17.38% -9.17% 0.68% 0.51% 4.51% 2.23%
Source: Oxford Economics
LQ = Location Quotient
Source: Oxford Economics
YEAR OVER YEAR JOB GROWTH
9/21/2020Copyrighted report licensed to ROI Appraisal Britton Group - 103161
Page 17

EconomyLas Vegas Industrial
DEMOGRAPHIC TRENDS
12 Month ChangeCurrent Level
Metro U.S.Metro U.S.Demographic Category
10 Year Change
Metro U.S. Metro U.S.
5 Year Forecast
Population 329,991,4692,302,068 1.5% 0.5% 1.7% 0.6% 1.6% 0.5%
Households 122,505,133834,709 1.5% 0.4% 1.8% 0.7% 1.5% 0.4%
Median Household Income $64,503$56,713 -3.1% 1.3% 0.9% 2.6% 2.9% 2.8%
Labor Force 159,209,6411,051,895 -7.7% -2.7% 0.7% 0.3% 2.6% 1.0%
Unemployment 13.4%24.4% 20.4% 9.8% 1.0% 0.4% - -
Source: Oxford Economics
POPULATION GROWTH
Source: Oxford Economics
LABOR FORCE GROWTH INCOME GROWTH
9/21/2020Copyrighted report licensed to ROI Appraisal Britton Group - 103161
Page 18
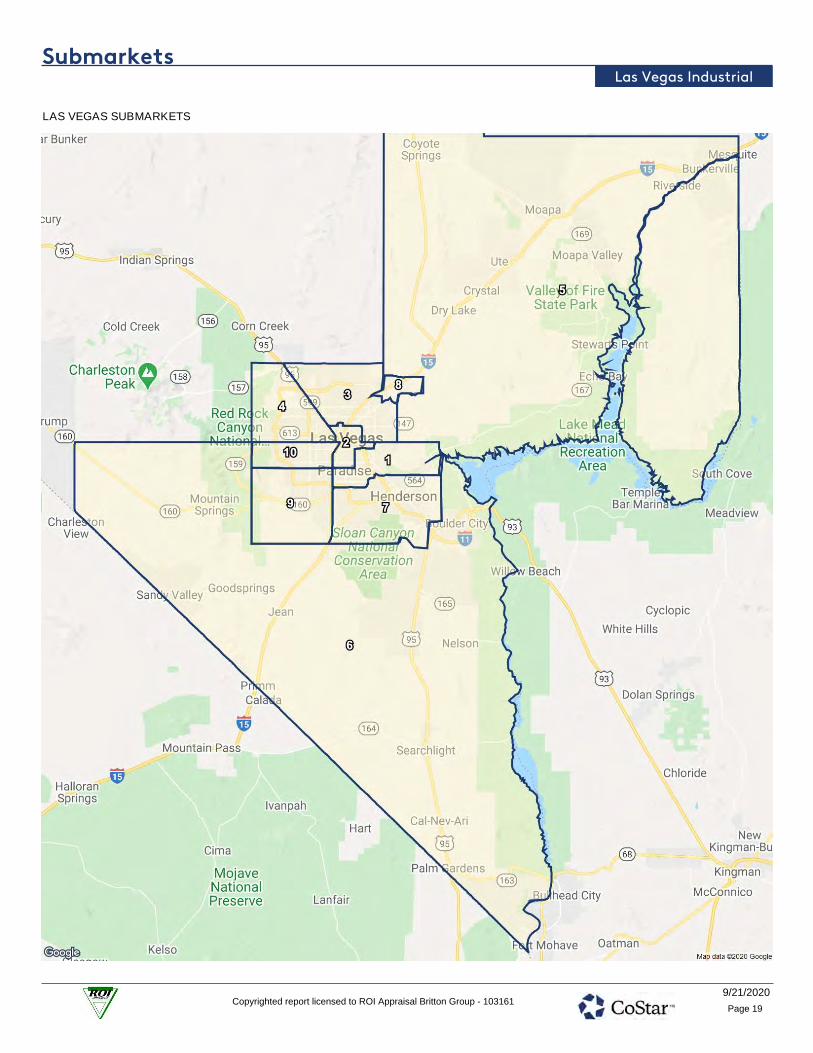
SubmarketsLas Vegas Industrial
LAS VEGAS SUBMARKETS
9/21/2020Copyrighted report licensed to ROI Appraisal Britton Group - 103161
Page 19

SubmarketsLas Vegas Industrial
SUBMARKET INVENTORY
12 Month Deliveries Under Construction as % of Inventory
Bldgs SF (000) Percent Rank
Inventory
Bldgs SF (000) Percent RankBldgs SF (000) % Market RankSubmarketNo.
1 Airport/E Las Vegas 15,981 10.9% 4 9 238 1.5% 5521 2 40 0.3% 5
2 Central Las Vegas 13,637 9.3% 5 0 - - -505 0 0 0% -
3 North Las Vegas 45,116 30.8% 1 11 2,312 5.1% 11,119 5 1,153 2.6% 2
4 Northwest Las Vegas 867 0.6% 8 0 - - -39 0 0 0% -
5 Outlying NE Clark Cty 524 0.4% 10 1 12 2.3% 633 0 0 0% -
6 Outlying S Clark Cnty 689 0.5% 9 0 - - -96 0 0 0% -
7 SE LV/Henderson 18,285 12.5% 3 5 1,683 9.2% 2569 7 424 2.3% 4
8 Speedway 8,611 5.9% 7 2 297 3.5% 478 8 2,097 24.3% 1
9 SW Las Vegas 32,341 22.0% 2 5 526 1.6% 31,058 13 587 1.8% 3
10 West Las Vegas 10,640 7.3% 6 0 - - -463 0 0 0% -
SUBMARKET RENT
Growth
Market Rent
Per SFSubmarketNo.
12 Month Market Rent QTD Annualized Market Rent
RankRank GrowthRank
1 Airport/E Las Vegas 3.1%6 4.5% 6$0.89 3
2 Central Las Vegas 3.0%3 3.9% 9$0.94 4
3 North Las Vegas 2.3%9 4.6% 5$0.64 8
4 Northwest Las Vegas 1.8%1 2.9% 10$1.03 10
5 Outlying NE Clark Cty 3.7%4 4.7% 3$0.92 2
6 Outlying S Clark Cnty 4.5%2 5.3% 1$1.01 1
7 SE LV/Henderson 2.5%8 4.3% 8$0.80 7
8 Speedway 2.1%10 4.9% 2$0.58 9
9 SW Las Vegas 2.7%5 4.6% 4$0.89 6
10 West Las Vegas 2.8%7 4.3% 7$0.88 5
SUBMARKET VACANCY & NET ABSORPTION
12 Month Absorption
Rank Construc. Ratio
Vacancy
SF % of InvSF PercentSubmarketNo. Rank
1 Airport/E Las Vegas 772,168 4.8% -(355,747) -2.2% 107
2 Central Las Vegas 277,366 2.0% -(65,272) -0.5% 92
3 North Las Vegas 3,346,398 7.4% 1.1957,627 2.1% 18
4 Northwest Las Vegas 82,343 9.5% -(9,704) -1.1% 89
5 Outlying NE Clark Cty 9,000 1.7% -4,440 0.8% 71
6 Outlying S Clark Cnty 29,500 4.3% -13,225 1.9% 55
7 SE LV/Henderson 754,559 4.1% 1.2363,586 2.0% 34
8 Speedway 2,289,159 26.6% 4.2504,810 5.9% 210
9 SW Las Vegas 1,255,384 3.9% 2.5227,095 0.7% 43
10 West Las Vegas 488,096 4.6% -11,725 0.1% 66
9/21/2020Copyrighted report licensed to ROI Appraisal Britton Group - 103161
Page 20
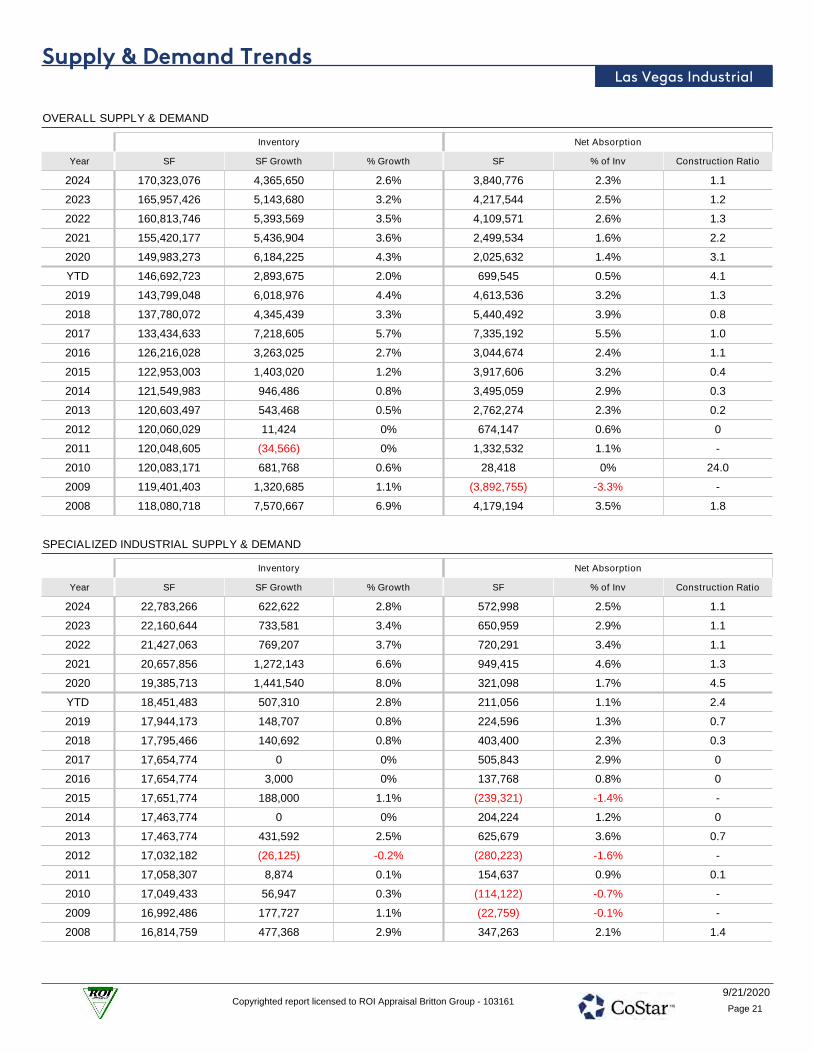
Supply & Demand TrendsLas Vegas Industrial
OVERALL SUPPLY & DEMAND
Net AbsorptionInventory
% of Inv Construction RatioSF SF Growth % Growth SFYear
2024 4,365,650 2.6% 2.3%3,840,776 1.1170,323,076
2023 5,143,680 3.2% 2.5%4,217,544 1.2165,957,426
2022 5,393,569 3.5% 2.6%4,109,571 1.3160,813,746
2021 5,436,904 3.6% 1.6%2,499,534 2.2155,420,177
2020 6,184,225 4.3% 1.4%2,025,632 3.1149,983,273
YTD 2,893,675 2.0% 0.5%699,545 4.1146,692,723
2019 6,018,976 4.4% 3.2%4,613,536 1.3143,799,048
2018 4,345,439 3.3% 3.9%5,440,492 0.8137,780,072
2017 7,218,605 5.7% 5.5%7,335,192 1.0133,434,633
2016 3,263,025 2.7% 2.4%3,044,674 1.1126,216,028
2015 1,403,020 1.2% 3.2%3,917,606 0.4122,953,003
2014 946,486 0.8% 2.9%3,495,059 0.3121,549,983
2013 543,468 0.5% 2.3%2,762,274 0.2120,603,497
2012 11,424 0% 0.6%674,147 0120,060,029
2011 (34,566) 0% 1.1%1,332,532 -120,048,605
2010 681,768 0.6% 0%28,418 24.0120,083,171
2009 1,320,685 1.1% -3.3%(3,892,755) -119,401,403
2008 7,570,667 6.9% 3.5%4,179,194 1.8118,080,718
SPECIALIZED INDUSTRIAL SUPPLY & DEMAND
Net AbsorptionInventory
% of Inv Construction RatioSF SF Growth % Growth SFYear
2024 622,622 2.8% 2.5%572,998 1.122,783,266
2023 733,581 3.4% 2.9%650,959 1.122,160,644
2022 769,207 3.7% 3.4%720,291 1.121,427,063
2021 1,272,143 6.6% 4.6%949,415 1.320,657,856
2020 1,441,540 8.0% 1.7%321,098 4.519,385,713
YTD 507,310 2.8% 1.1%211,056 2.418,451,483
2019 148,707 0.8% 1.3%224,596 0.717,944,173
2018 140,692 0.8% 2.3%403,400 0.317,795,466
2017 0 0% 2.9%505,843 017,654,774
2016 3,000 0% 0.8%137,768 017,654,774
2015 188,000 1.1% -1.4%(239,321) -17,651,774
2014 0 0% 1.2%204,224 017,463,774
2013 431,592 2.5% 3.6%625,679 0.717,463,774
2012 (26,125) -0.2% -1.6%(280,223) -17,032,182
2011 8,874 0.1% 0.9%154,637 0.117,058,307
2010 56,947 0.3% -0.7%(114,122) -17,049,433
2009 177,727 1.1% -0.1%(22,759) -16,992,486
2008 477,368 2.9% 2.1%347,263 1.416,814,759
9/21/2020Copyrighted report licensed to ROI Appraisal Britton Group - 103161
Page 21

Supply & Demand TrendsLas Vegas Industrial
LOGISTICS SUPPLY & DEMAND
Net AbsorptionInventory
% of Inv Construction RatioSF SF Growth % Growth SFYear
2024 3,680,942 3.0% 2.7%3,338,771 1.1125,015,216
2023 4,336,952 3.7% 3.0%3,634,036 1.2121,334,274
2022 4,547,645 4.0% 2.9%3,439,889 1.3116,997,322
2021 4,097,013 3.8% 1.5%1,712,658 2.4112,449,677
2020 4,677,685 4.5% 1.8%1,903,848 2.5108,352,664
YTD 2,321,365 2.2% 0.7%754,512 3.1105,996,344
2019 5,714,469 5.8% 4.1%4,278,210 1.3103,674,979
2018 4,204,747 4.5% 4.7%4,586,027 0.997,960,510
2017 6,931,205 8.0% 6.9%6,467,656 1.193,755,763
2016 3,260,025 3.9% 3.1%2,691,929 1.286,824,558
2015 1,215,020 1.5% 4.2%3,548,544 0.383,564,533
2014 946,486 1.2% 3.5%2,894,241 0.382,349,513
2013 (17,246) 0% 2.3%1,883,492 -81,403,027
2012 37,549 0% 0.7%556,255 0.181,420,273
2011 18,794 0% 1.4%1,172,463 081,382,724
2010 676,862 0.8% 0.6%460,384 1.581,363,930
2009 1,136,497 1.4% -4.1%(3,336,663) -80,687,068
2008 4,257,743 5.7% 2.6%2,028,765 2.179,550,571
FLEX SUPPLY & DEMAND
Net AbsorptionInventory
% of Inv Construction RatioSF SF Growth % Growth SFYear
2024 62,086 0.3% -0.3%(70,993) -22,524,594
2023 73,147 0.3% -0.3%(67,451) -22,462,508
2022 76,717 0.3% -0.2%(50,609) -22,389,361
2021 67,748 0.3% -0.7%(162,539) -22,312,644
2020 65,000 0.3% -0.9%(199,314) -22,244,896
YTD 65,000 0.3% -1.2%(266,023) -22,244,896
2019 155,800 0.7% 0.5%110,730 1.422,179,896
2018 0 0% 2.0%451,065 022,024,096
2017 287,400 1.3% 1.6%361,693 0.822,024,096
2016 0 0% 1.0%214,977 021,736,696
2015 0 0% 2.8%608,383 021,736,696
2014 0 0% 1.8%396,594 021,736,696
2013 129,122 0.6% 1.2%253,103 0.521,736,696
2012 0 0% 1.8%398,115 021,607,574
2011 (62,234) -0.3% 0%5,432 -21,607,574
2010 (52,041) -0.2% -1.5%(317,844) -21,669,808
2009 6,461 0% -2.5%(533,333) -21,721,849
2008 2,835,556 15.0% 8.3%1,803,166 1.621,715,388
9/21/2020Copyrighted report licensed to ROI Appraisal Britton Group - 103161
Page 22
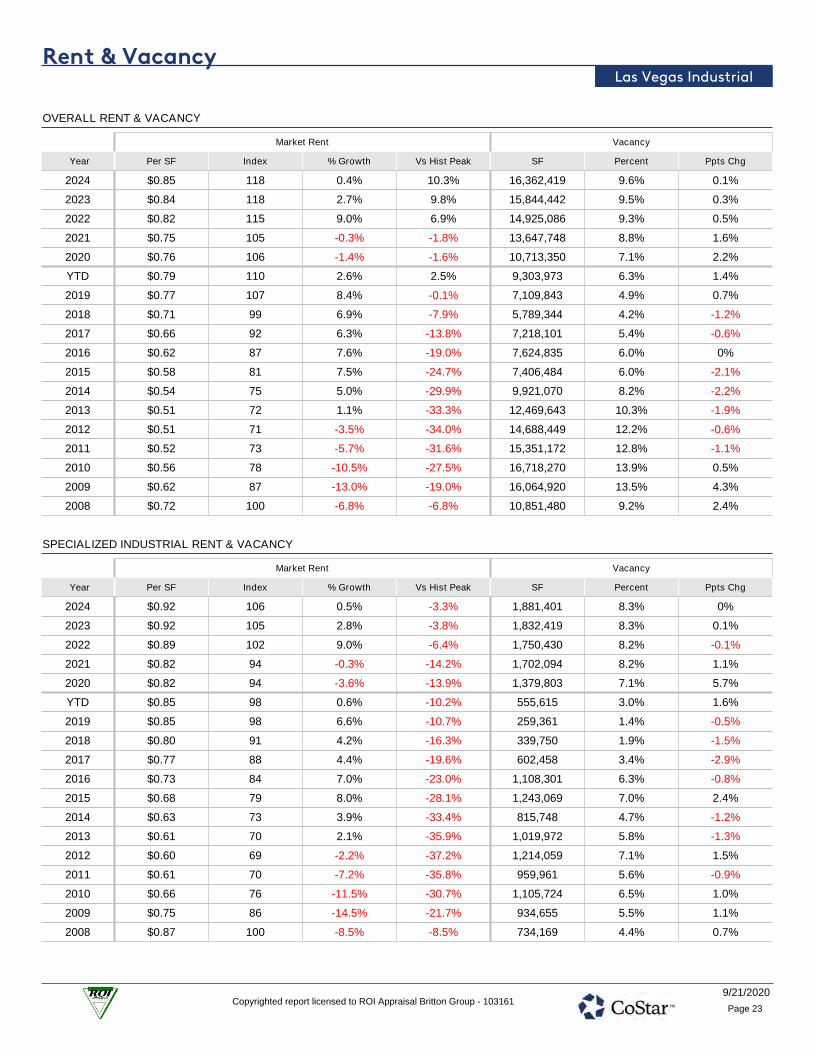
Rent & VacancyLas Vegas Industrial
OVERALL RENT & VACANCY
Market Rent
Per SF Index % Growth Vs Hist PeakYear
Vacancy
SF Percent Ppts Chg
2024 118 0.4% 10.3%$0.85 16,362,419 9.6% 0.1%
2023 118 2.7% 9.8%$0.84 15,844,442 9.5% 0.3%
2022 115 9.0% 6.9%$0.82 14,925,086 9.3% 0.5%
2021 105 -0.3% -1.8%$0.75 13,647,748 8.8% 1.6%
2020 106 -1.4% -1.6%$0.76 10,713,350 7.1% 2.2%
YTD 110 2.6% 2.5%$0.79 9,303,973 6.3% 1.4%
2019 107 8.4% -0.1%$0.77 7,109,843 4.9% 0.7%
2018 99 6.9% -7.9%$0.71 5,789,344 4.2% -1.2%
2017 92 6.3% -13.8%$0.66 7,218,101 5.4% -0.6%
2016 87 7.6% -19.0%$0.62 7,624,835 6.0% 0%
2015 81 7.5% -24.7%$0.58 7,406,484 6.0% -2.1%
2014 75 5.0% -29.9%$0.54 9,921,070 8.2% -2.2%
2013 72 1.1% -33.3%$0.51 12,469,643 10.3% -1.9%
2012 71 -3.5% -34.0%$0.51 14,688,449 12.2% -0.6%
2011 73 -5.7% -31.6%$0.52 15,351,172 12.8% -1.1%
2010 78 -10.5% -27.5%$0.56 16,718,270 13.9% 0.5%
2009 87 -13.0% -19.0%$0.62 16,064,920 13.5% 4.3%
2008 100 -6.8% -6.8%$0.72 10,851,480 9.2% 2.4%
SPECIALIZED INDUSTRIAL RENT & VACANCY
Market Rent
Per SF Index % Growth Vs Hist PeakYear
Vacancy
SF Percent Ppts Chg
2024 106 0.5% -3.3%$0.92 1,881,401 8.3% 0%
2023 105 2.8% -3.8%$0.92 1,832,419 8.3% 0.1%
2022 102 9.0% -6.4%$0.89 1,750,430 8.2% -0.1%
2021 94 -0.3% -14.2%$0.82 1,702,094 8.2% 1.1%
2020 94 -3.6% -13.9%$0.82 1,379,803 7.1% 5.7%
YTD 98 0.6% -10.2%$0.85 555,615 3.0% 1.6%
2019 98 6.6% -10.7%$0.85 259,361 1.4% -0.5%
2018 91 4.2% -16.3%$0.80 339,750 1.9% -1.5%
2017 88 4.4% -19.6%$0.77 602,458 3.4% -2.9%
2016 84 7.0% -23.0%$0.73 1,108,301 6.3% -0.8%
2015 79 8.0% -28.1%$0.68 1,243,069 7.0% 2.4%
2014 73 3.9% -33.4%$0.63 815,748 4.7% -1.2%
2013 70 2.1% -35.9%$0.61 1,019,972 5.8% -1.3%
2012 69 -2.2% -37.2%$0.60 1,214,059 7.1% 1.5%
2011 70 -7.2% -35.8%$0.61 959,961 5.6% -0.9%
2010 76 -11.5% -30.7%$0.66 1,105,724 6.5% 1.0%
2009 86 -14.5% -21.7%$0.75 934,655 5.5% 1.1%
2008 100 -8.5% -8.5%$0.87 734,169 4.4% 0.7%
9/21/2020Copyrighted report licensed to ROI Appraisal Britton Group - 103161
Page 23

Rent & VacancyLas Vegas Industrial
LOGISTICS RENT & VACANCY
Market Rent
Per SF Index % Growth Vs Hist PeakYear
Vacancy
SF Percent Ppts Chg
2024 123 0.4% 11.0%$0.78 12,660,052 10.1% 0%
2023 123 2.6% 10.6%$0.78 12,322,916 10.2% 0.2%
2022 120 8.9% 7.8%$0.76 11,624,973 9.9% 0.6%
2021 110 -0.3% -1.0%$0.70 10,522,189 9.4% 1.8%
2020 110 -0.6% -0.6%$0.70 8,139,780 7.5% 1.7%
YTD 115 3.4% 3.4%$0.73 7,546,682 7.1% 1.4%
2019 111 8.9% 0%$0.70 5,979,829 5.8% 1.0%
2018 102 7.8% -8.2%$0.65 4,624,011 4.7% -1.0%
2017 95 7.2% -14.8%$0.60 5,338,995 5.7% -0.3%
2016 88 8.5% -20.6%$0.56 5,165,593 5.9% 0.4%
2015 81 8.3% -26.8%$0.52 4,597,497 5.5% -2.9%
2014 75 6.3% -32.4%$0.48 6,931,021 8.4% -2.5%
2013 71 0.6% -36.4%$0.45 8,878,776 10.9% -2.3%
2012 70 -4.0% -36.8%$0.45 10,779,514 13.2% -0.6%
2011 73 -5.2% -34.2%$0.46 11,298,220 13.9% -1.4%
2010 77 -10.9% -30.6%$0.49 12,451,889 15.3% 0.1%
2009 86 -13.6% -22.1%$0.55 12,235,411 15.2% 5.4%
2008 100 -7.3% -9.9%$0.63 7,762,251 9.8% 2.4%
FLEX RENT & VACANCY
Market Rent
Per SF Index % Growth Vs Hist PeakYear
Vacancy
SF Percent Ppts Chg
2024 113 0.6% 8.9%$1.10 1,820,966 8.1% 0.6%
2023 112 2.9% 8.2%$1.09 1,689,107 7.5% 0.6%
2022 109 9.2% 5.1%$1.06 1,549,683 6.9% 0.5%
2021 100 -0.1% -3.8%$0.97 1,423,465 6.4% 1.0%
2020 100 -2.5% -3.7%$0.97 1,193,767 5.4% 1.4%
YTD 104 1.5% 0.2%$1.01 1,201,676 5.4% 1.5%
2019 103 8.0% -1.2%$1.00 870,653 3.9% 0.2%
2018 95 5.9% -8.6%$0.92 825,583 3.7% -2.0%
2017 90 4.9% -13.7%$0.87 1,276,648 5.8% -0.4%
2016 86 5.3% -17.7%$0.83 1,350,941 6.2% -1.0%
2015 81 4.6% -21.9%$0.79 1,565,918 7.2% -2.8%
2014 78 2.1% -25.3%$0.75 2,174,301 10.0% -1.8%
2013 76 1.8% -26.9%$0.74 2,570,895 11.8% -0.6%
2012 75 -3.0% -28.2%$0.72 2,694,876 12.5% -1.8%
2011 77 -6.2% -25.9%$0.75 3,092,991 14.3% -0.3%
2010 82 -8.7% -21.1%$0.80 3,160,657 14.6% 1.3%
2009 90 -10.1% -13.5%$0.87 2,894,854 13.3% 2.5%
2008 100 -3.8% -3.8%$0.97 2,355,060 10.8% 3.8%
9/21/2020Copyrighted report licensed to ROI Appraisal Britton Group - 103161
Page 24

Sale TrendsLas Vegas Industrial
OVERALL SALES
Completed Transactions (1)
Turnover Avg Price/SFDeals VolumeYear
Market Pricing Trends (2)
Avg Price Price IndexAvg Cap Rate Price/SF Cap Rate
2024 -- - -- 180- $147.80 5.1%
2023 -- - -- 179- $146.70 5.1%
2022 -- - -- 170- $139.55 5.2%
2021 -- - -- 141- $115.32 5.7%
2020 -- - -- 145- $119.15 5.9%
YTD $565.5M152 3.5% $123.86$6,134,295 1606.2% $131.66 5.5%
2019 $1.9B364 10.6% $133.44$7,256,745 1536.9% $125.68 5.6%
2018 $1.1B354 7.6% $117.25$4,267,417 1416.6% $115.60 5.7%
2017 $712.8M345 9.8% $100.95$3,223,031 1267.1% $103.22 5.8%
2016 $547.3M308 5.3% $93.21$2,603,882 1156.6% $94.25 6.0%
2015 $339.9M296 7.1% $87.87$2,026,568 1017.0% $82.82 6.3%
2014 $440.3M280 4.6% $87.09$1,934,507 877.0% $71.37 6.8%
2013 $332.3M255 6.4% $59.34$1,749,897 797.6% $64.82 7.1%
2012 $214.1M242 3.4% $62.68$1,194,209 788.8% $64.33 7.1%
2011 $275.7M244 8.5% $65.92$1,877,007 799.5% $64.49 7.1%
2010 $123.9M139 2.3% $73.42$1,110,020 799.3% $65.21 7.2%
2009 $105.4M68 1.0% $92.87$1,829,346 838.4% $68.12 7.2%
(1) Completed transaction data is based on actual arms-length sales transactions and levels are dependent on the mix of what happened to sell in the period.
(2) Market price trends data is based on the estimated price movement of all properties in the market, informed by actual transactions that have occurred.
SPECIALIZED INDUSTRIAL SALES
Completed Transactions (1)
Turnover Avg Price/SFDeals VolumeYear
Market Pricing Trends (2)
Avg Price Price IndexAvg Cap Rate Price/SF Cap Rate
2024 -- - -- 176- $157.62 5.1%
2023 -- - -- 175- $156.26 5.1%
2022 -- - -- 166- $148.44 5.2%
2021 -- - -- 137- $122.52 5.7%
2020 -- - -- 142- $126.55 5.9%
YTD $61.1M17 2.9% $123.88$4,388,290 157- $140.08 5.5%
2019 $84.1M27 3.6% $160.33$5,235,982 150- $134.57 5.6%
2018 $80.2M40 4.2% $122.51$3,270,965 1397.2% $124.55 5.6%
2017 $49.7M40 3.9% $100.07$2,450,848 123- $110.40 5.8%
2016 $30.7M37 2.2% $100.29$1,334,675 1147.8% $101.56 5.9%
2015 $94M34 6.6% $85.12$4,192,416 1016.7% $89.92 6.3%
2014 $42M26 2.2% $121.76$2,098,538 87- $78.17 6.7%
2013 $25.1M29 5.3% $51.73$1,471,997 798.5% $70.64 7.0%
2012 $38.2M16 3.1% $110.91$4,222,749 79- $70.31 7.0%
2011 $16.2M18 1.2% $82.40$1,015,438 78- $69.74 7.1%
2010 $11.9M10 4.1% $62.26$1,702,324 79- $70.75 7.2%
2009 $30.4M12 2.3% $78.18$3,198,794 837.6% $74.01 7.1%
(1) Completed transaction data is based on actual arms-length sales transactions and levels are dependent on the mix of what happened to sell in the period.
(2) Market price trends data is based on the estimated price movement of all properties in the market, informed by actual transactions that have occurred.
9/21/2020Copyrighted report licensed to ROI Appraisal Britton Group - 103161
Page 25

Sale TrendsLas Vegas Industrial
LOGISTICS SALES
Completed Transactions (1)
Turnover Avg Price/SFDeals VolumeYear
Market Pricing Trends (2)
Avg Price Price IndexAvg Cap Rate Price/SF Cap Rate
2024 -- - -- 185- $143.31 5.1%
2023 -- - -- 183- $142.32 5.1%
2022 -- - -- 175- $135.47 5.1%
2021 -- - -- 144- $111.93 5.6%
2020 -- - -- 149- $115.63 5.9%
YTD $481.3M110 4.0% $123.75$7,037,401 1656.2% $127.81 5.5%
2019 $1.7B255 12.8% $131.39$8,585,753 1576.6% $121.59 5.5%
2018 $803.4M247 8.4% $111.35$4,633,573 1446.6% $111.59 5.6%
2017 $567.6M219 6.8% $100.12$3,836,133 1287.1% $99.49 5.8%
2016 $440M213 6.1% $92.08$2,944,318 1176.4% $90.72 5.9%
2015 $204.1M189 7.5% $90.82$1,802,809 1027.0% $79.46 6.3%
2014 $310M184 4.7% $86.67$2,039,915 887.0% $67.93 6.8%
2013 $273.6M177 7.5% $59.23$1,923,956 795.9% $61.62 7.1%
2012 $116.3M141 2.8% $55.21$1,029,881 797.9% $61.15 7.1%
2011 $231.9M161 5.3% $65.28$2,296,577 799.5% $61.32 7.1%
2010 $96M96 2.2% $73.07$1,168,919 809.3% $61.73 7.2%
2009 $51.6M42 0.6% $100.27$1,397,164 839.6% $64.42 7.2%
(1) Completed transaction data is based on actual arms-length sales transactions and levels are dependent on the mix of what happened to sell in the period.
(2) Market price trends data is based on the estimated price movement of all properties in the market, informed by actual transactions that have occurred.
FLEX SALES
Completed Transactions (1)
Turnover Avg Price/SFDeals VolumeYear
Market Pricing Trends (2)
Avg Price Price IndexAvg Cap Rate Price/SF Cap Rate
2024 -- - -- 165- $161.19 5.4%
2023 -- - -- 164- $159.77 5.4%
2022 -- - -- 155- $151.75 5.4%
2021 -- - -- 129- $125.67 6.0%
2020 -- - -- 133- $129.96 6.2%
YTD $23.1M25 1.5% $125.99$2,178,694 147- $143.15 5.8%
2019 $173.1M82 6.0% $143.35$3,130,126 1417.4% $137.97 5.8%
2018 $180M67 6.9% $149.79$3,508,638 1306.4% $127.45 5.9%
2017 $95.5M86 27.8% $106.63$1,741,647 1187.0% $115.25 6.0%
2016 $76.6M58 4.6% $97.37$2,024,405 108- $105.21 6.2%
2015 $41.8M73 6.0% $80.94$1,289,224 957.9% $93.10 6.5%
2014 $88.4M70 6.3% $77.88$1,587,382 847.0% $82.30 6.9%
2013 $33.6M49 3.0% $67.75$1,095,102 779.7% $75.49 7.2%
2012 $59.6M85 5.8% $61.79$1,027,376 779.5% $74.75 7.2%
2011 $27.6M65 26.4% $63.67$885,854 77- $75.50 7.2%
2010 $16M33 1.2% $87.69$696,623 79- $77.47 7.2%
2009 $23.4M14 1.1% $101.05$2,152,700 837.9% $81.15 7.2%
(1) Completed transaction data is based on actual arms-length sales transactions and levels are dependent on the mix of what happened to sell in the period.
(2) Market price trends data is based on the estimated price movement of all properties in the market, informed by actual transactions that have occurred.
9/21/2020Copyrighted report licensed to ROI Appraisal Britton Group - 103161
Page 26
Las Vegas - NV
PREPARED BY
Luke Adamo
Broker
Industrial Capital Markets Report

INDUSTRIAL CAPITAL MARKETS REPORT - MARKET
Capital Markets Overview 2
Market Pricing 7
Buying & Selling By Owner Type 9
Investment Trends By Buyer & Seller Origin 10
Submarket Sales Trends 11
Recent Significant Sales 12
Players 16
Las Vegas Industrial
9/21/2020Copyrighted report licensed to ROI Appraisal Britton Group - 103161

Capital Markets OverviewLas Vegas Industrial
$20.1B $1.8B 5.5% 6.7%Asset Value 12 Mo Sales Volume Market Cap Rate 12 Mo Mkt Sale Price/SF Chg
12 MO SALES PRICE Average Lowest Highest Market
Cap Rate 6.4% 4.3% 8.7% 5.5%
Sale Price/SF $134 $20 $1.1K $132
Sale Price $8.8M $215K $110M -
Sale vs Asking Price -6.4% -41.7% 4.5% -
% Leased at Sale 92.7% 0% 100% -
12 MO SALES VOLUME Total Lowest Highest
Transactions 279 - -
Sales Volume $1.8B $215K $110M
Properties Sold 243 - -
Transacted SF 13.8M 1.7K 855K
Average SF 49.4K 1.7K 855K
KEY PERFORMANCE INDICATORS
SUMMARY
Investment has slowed in the third quarter following solidsales in the first half of the year, which was bolstered bya significant trade. Transactions in 2019 surpassed $1billion for the second year in a row and made it a banneryear for sales over the past decade. Sales volumetotaled just over $1 billion in 2018, up from around $715million in 2017 and significantly higher than the metro'shistorical average of about $520 million. Investors appearto be more cautious in the current economic environmentand sales are unlikely to reach the peak levels of the
past couple of years.
One of the notable transactions of 2020 was the Maysale of an Amazon distribution building by developerVanTrust Real Estate for $110 million ($129/SF).Preylock Holdings acquired the 855,000-SF building inthe Tropical Distribution Center, built in 2019, and 100%leased to Amazon.
More recently in July, the Moulton Company acquired a
9/21/2020Copyrighted report licensed to ROI Appraisal Britton Group - 103161
Page 2

Capital Markets OverviewLas Vegas Industrial
322,560-SF distribution building in North Las Vegas for$45.2 million ($140/SF). The property was built in 2020and was sold by developer VanTrust Real Estate 100%leased to a single tenant.
Logistics continues to see the highest share of dealvolume in 2020, after making up approximately 75% ofthe total sales volume in the metro in 2018 and 2019.Along with sales volume, Las Vegas' average price per
SF is rising, now approximately 20% higher than thenation's. Cap rates have compressed by around 150basis points over the past decade to around 5.5%.
Developers have been some of the top sellers in themarket recently as they sell newly completed properties,many to REITs, private equity, and institutional investors,which have been some of the top buyers over the pastfew years.
9/21/2020Copyrighted report licensed to ROI Appraisal Britton Group - 103161
Page 3

Capital Markets OverviewLas Vegas Industrial
MARKET SALE PRICE & TRANSACTION SALE PRICE PER SF
MARKET CAP RATE & TRANSACTION CAP RATE
SALES VOLUME BY TRANSACTION TYPE
9/21/2020Copyrighted report licensed to ROI Appraisal Britton Group - 103161
Page 4

Capital Markets OverviewLas Vegas Industrial
CAP RATE DISTRIBUTION PAST 12 MONTHSSALE PRICE PER SF DISTRIBUTION PAST 12 MONTHS
CAP RATE BY TRANSACTION TYPESALE PRICE PER SF BY TRANSACTION TYPE
SOLD SF AS % OF TOTAL SFCUMULATIVE SALES VOLUME BY YEAR
9/21/2020Copyrighted report licensed to ROI Appraisal Britton Group - 103161
Page 5

Capital Markets OverviewLas Vegas Industrial
ASSET VALUE BY OWNER TYPESALES VOLUME BY BUYER TYPE PAST 12 MONTHS
OCCUPANCY AT SALESALE TO ASKING PRICE DIFFERENTIAL
PROBABILITY OF SELLING IN MONTHSMONTHS TO SALE
9/21/2020Copyrighted report licensed to ROI Appraisal Britton Group - 103161
Page 6
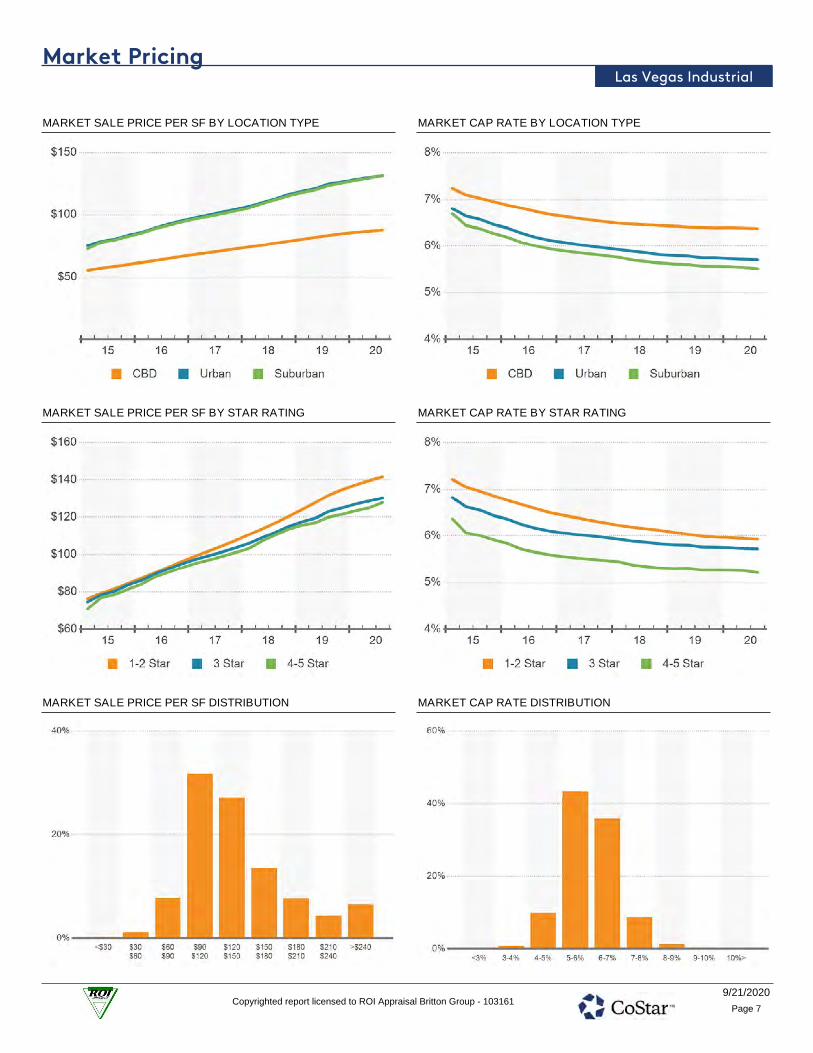
Market PricingLas Vegas Industrial
MARKET CAP RATE BY LOCATION TYPEMARKET SALE PRICE PER SF BY LOCATION TYPE
MARKET CAP RATE BY STAR RATINGMARKET SALE PRICE PER SF BY STAR RATING
MARKET CAP RATE DISTRIBUTIONMARKET SALE PRICE PER SF DISTRIBUTION
9/21/2020Copyrighted report licensed to ROI Appraisal Britton Group - 103161
Page 7

Market PricingLas Vegas Industrial
4-5 STAR MARKET CAP RATE DISTRIBUTION4-5 STAR MARKET SALE PRICE PER SF DISTRIBUTION
3 STAR MARKET CAP RATE DISTRIBUTION3 STAR MARKET SALE PRICE PER SF DISTRIBUTION
1-2 STAR MARKET CAP RATE DISTRIBUTION1-2 STAR MARKET SALE PRICE PER SF DISTRIBUTION
9/21/2020Copyrighted report licensed to ROI Appraisal Britton Group - 103161
Page 8
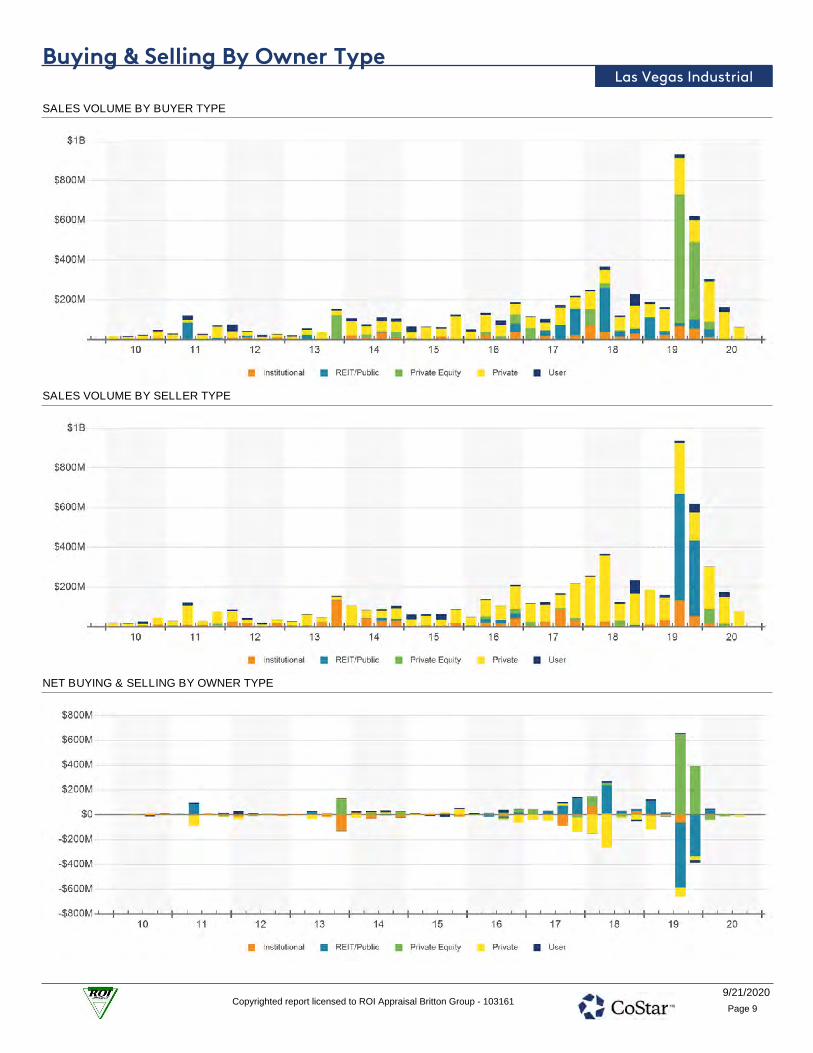
Buying & Selling By Owner TypeLas Vegas Industrial
SALES VOLUME BY BUYER TYPE
SALES VOLUME BY SELLER TYPE
NET BUYING & SELLING BY OWNER TYPE
9/21/2020Copyrighted report licensed to ROI Appraisal Britton Group - 103161
Page 9

Investment Trends By Buyer & Seller OriginLas Vegas Industrial
ASSET VALUE BY OWNER ORIGINSALES VOLUME BY BUYER ORIGIN PAST 12 MONTHS
SALES VOLUME BY OWNER ORIGIN
Year Sales Volume Bought Sold Net Trans Bought Sold Net Trans Bought Sold Net Trans
Total Local National Foreign
YTD $565.5M $38.1M $114.8M ($76.6M) $497.2M $368.6M $128.6M $2.7M $72M ($69.3M)
2019 $1.9B $193.3M $298.4M ($105.1M) $1.7B $1B $659M $42.6M $601M ($558.4M)
2018 $1.1B $262.3M $242.9M $19.4M $542.4M $775.8M ($233.4M) $205.8M $9.5M $196.3M
2017 $712.8M $137.2M $153.2M ($15.9M) $348M $504.8M ($156.7M) $174.6M $5.6M $168.9M
2016 $547.3M $132.3M $130.8M $1.5M $384.7M $402.8M ($18.1M) $796.7K $597K $199.7K
2015 $339.9M $107.9M $109.1M ($1.2M) $210.1M $173.9M $36.1M $2M $47.4M ($45.4M)
2014 $440.3M $121M $179.2M ($58.2M) $286.7M $235.5M $51.2M $8.8M $8.7M $156.7K
2013 $332.3M $60.8M $70.9M ($10.1M) $215.8M $227.8M ($11.9M) $1.2M $5.3M ($4.2M)
2012 $214.1M $94.1M $62.5M $31.6M $79.9M $128.8M ($48.9M) $2.7M $3.2M ($545.3K)
2011 $275.7M $51.3M $53M ($1.7M) $202.4M $207.6M ($5.2M) $1.6M $3.7M ($2M)
2010 $123.9M $47.1M $40.6M $6.5M $65.7M $75.9M ($10.2M) $98.3K $2.3M ($2.2M)
CAP RATE BY BUYER ORIGINSALE PRICE PER SF BY BUYER ORIGIN
9/21/2020Copyrighted report licensed to ROI Appraisal Britton Group - 103161
Page 10

Submarket Sales TrendsLas Vegas Industrial
SUBMARKET SALES TRANSACTIONS PAST 12 MONTHS
Submarket Name Sales Volume Transactions Transacted SF Avg SF Mkt Cap Rate Mkt Sale Price/SF
North Las Vegas $897,848,837 85 7,171,399 84,369 5.5% $118
Speedway $267,386,227 6 2,025,868 337,645 5.3% $121
Airport/E Las Vegas $235,058,028 36 1,497,238 41,590 5.7% $141
SE LV/Henderson $173,117,803 45 1,374,642 30,548 5.4% $135
SW Las Vegas $116,436,663 68 1,156,400 17,006 5.6% $150
West Las Vegas $40,933,871 15 357,098 23,807 5.8% $135
Central Las Vegas $16,211,647 16 162,579 10,161 5.7% $122
Outlying S Clark Cnty $2,396,500 5 16,790 3,358 5.7% $138
Outlying NE Clark Cty $700,000 3 27,174 9,058 5.6% $152
9/21/2020Copyrighted report licensed to ROI Appraisal Britton Group - 103161
Page 11

Recent Significant SalesLas Vegas Industrial
6001 E Tropical Pky • Amazon
Tropical Distribution Center • Speedway Submarket • North Las Vegas, NV 89115
Buyer Preylock Holdings, LLC (USA)
Broker JLL
Seller VanTrust Real Estate LLC (USA)
Broker CBRE
Sale Type Investment
Sale Date May 2020
Sale Price $110M ($129/SF)
Leased 100%
Hold Period 16 Months
RBA 855,000 SF
Year Built 2019
5430 Donovan Way • Bldg. 9
Northgate Distribution Center • North Las Vegas Submarket • North Las Vegas, NV 89081
Buyer Blackstone Real Estate In… (USA)
Seller Global Logistic Properties… (USA)
Broker Eastdil Secured, LLC
Sale Type Investment
Sale Cond Bulk/Portfolio Sale, Entity Buy/Member…
Sale Date Sep 2019
Sale Price $90.2M ($123/SF)
Leased 43%
Hold Period 15 Months
RBA 731,561 SF
Year Built 2018
4490 Nexus Way • Northgate Distribution Center Bldg 2
Northgate Distribution Center • North Las Vegas Submarket • Las Vegas, NV 89115
Buyer The Blackstone Group L.P. (USA)
Seller Global Logistic Properties… (USA)
Broker Eastdil Secured, LLC
Sale Type Investment
Sale Cond Bulk/Portfolio Sale, Entity Buy/Member…
Sale Date Sep 2019
Sale Price $73.7M ($132/SF)
Leased 100%
Hold Period 17 Months
RBA 558,286 SF
Year Built 2017
5550 Donovan Way • The Honest Co
Northgate Distribution Center • North Las Vegas Submarket • Las Vegas, NV 89101
Buyer Blackstone Real Estate In… (USA)
Seller Global Logistic Properties… (USA)
Broker Eastdil Secured, LLC
Sale Type Investment
Sale Cond Bulk/Portfolio Sale, Entity Buy/Member…
Sale Date Sep 2019
Sale Price $70.4M ($123/SF)
Leased 100%
Hold Period 21 Months
RBA 570,810 SF
Year Built 2017
3837 Bay Lake Trail • Bldg 16
Prologis Park North • North Las Vegas Submarket • North Las Vegas, NV 89030
Buyer The Blackstone Group L.P. (USA)
Seller Global Logistic Properties… (USA)
Broker Eastdil Secured, LLC
Sale Type Investment
Sale Cond Bulk/Portfolio Sale, Entity Buy/Member…
Sale Date Sep 2019
Sale Price $67.7M ($132/SF)
Leased 100%
Hold Period 55 Months
RBA 513,240 SF
Year Built 2007
9/21/2020Copyrighted report licensed to ROI Appraisal Britton Group - 103161
Page 12

Recent Significant SalesLas Vegas Industrial
5605 N Hollywood Blvd
Raceway Industrial Park • Speedway Submarket • Las Vegas, NV 89115
Buyer Black Creek Group (USA)
Seller Hines (USA)
Broker Colliers International
Sale Type Investment
Sale Cond Building in Shell Condition
Sale Date Jan 2020
Sale Price $62.4M ($93/SF)
Cap Rate 5.3% (Pro Forma)
Leased 0%
Hold Period 12 Months
RBA 670,798 SF
Year Built 2019
7000 Placid St
Airport/E Las Vegas Submarket • Las Vegas, NV 89119
Buyer The Blackstone Group L.P. (USA)
Seller Global Logistic Properties… (USA)
Broker Eastdil Secured, LLC
Sale Type Investment
Sale Cond Bulk/Portfolio Sale, Entity Buy/Member…
Sale Date Sep 2019
Sale Price $54M ($175/SF)
Leased 100%
Hold Period 47 Months
RBA 309,208 SF
Year Built 1994
4800 E Tropical Pky
North Las Vegas Submarket • Las Vegas, NV 89115
Buyer The Moulton Company (USA)
Seller VanTrust Real Estate LLC (USA)
Sale Type Investment
Sale Date Jul 2020
Sale Price $45.2M ($140/SF)
Leased 100%
Hold Period 3 Months
RBA 322,560 SF
Year Built 2020
2695 N Lamb Blvd • SunPoint Business Center
Sunpoint Business Center • North Las Vegas Submarket • Las Vegas, NV 89115
Buyer The Blackstone Group L.P. (USA)
Seller Colony Capital, Inc. (USA)
Broker CBRE
Sale Type Investment
Sale Cond Bulk/Portfolio Sale
Sale Date Dec 2019
Sale Price $42.9M ($138/SF)
Leased 100%
Hold Period 30 Months
RBA 311,501 SF
Year Built 2016
3702 N Las Vegas Blvd • Building 2
Sunpoint Crossing • North Las Vegas Submarket • Las Vegas, NV 89115
Buyer The Blackstone Group L.P. (USA)
Seller Colony Capital, Inc. (USA)
Broker CBRE
Sale Type Investment
Sale Cond Bulk/Portfolio Sale
Sale Date Dec 2019
Sale Price $40M ($138/SF)
Leased 0%
Hold Period 11 Months
RBA 290,147 SF
Year Built 2019
9/21/2020Copyrighted report licensed to ROI Appraisal Britton Group - 103161
Page 13

Recent Significant SalesLas Vegas Industrial
4025 E Cheyenne Ave
Cheyenne Distribution Center • North Las Vegas Submarket • Las Vegas, NV 89115
Buyer Prologis, Inc. (USA)
Seller Black Creek Group (USA) +1
Broker Eastdil Secured, LLC
Sale Type Investment
Sale Cond Bulk/Portfolio Sale, Entity Buy/Member…
Sale Date Jan 2020
Sale Price $38.1M ($100/SF)
Leased 100%
Hold Period 44 Months
RBA 381,804 SF
Year Built 2015
5406 E El Campo Grande Ave • Northern Beltway Indus…
Northern Beltway Industrial Center • Speedway Submarket • Las Vegas, NV 89115
Buyer The Blackstone Group L.P. (USA)
Seller Colony Capital, Inc. (USA)
Broker CBRE
Sale Type Investment
Sale Cond Bulk/Portfolio Sale
Sale Date Dec 2019
Sale Price $36.2M ($154/SF)
Leased 100%
Hold Period 11 Months
RBA 234,836 SF
Year Built 2007
3200 E Gowan Rd • Bldg 1
Prologis Park North • North Las Vegas Submarket • North Las Vegas, NV 89030
Buyer The Blackstone Group L.P. (USA)
Seller Global Logistic Properties… (USA)
Broker Eastdil Secured, LLC
Sale Type Investment
Sale Cond Bulk/Portfolio Sale, Entity Buy/Member…
Sale Date Sep 2019
Sale Price $35.2M ($132/SF)
Leased 100%
Hold Period 55 Months
RBA 266,800 SF
Year Built 2003
3717 Bay Lake Trail
North Las Vegas Submarket • North Las Vegas, NV 89030
Buyer The Blackstone Group L.P. (USA)
Seller Global Logistic Properties… (USA)
Broker Eastdil Secured, LLC
Sale Type Investment
Sale Cond Bulk/Portfolio Sale, Entity Buy/Member…
Sale Date Sep 2019
Sale Price $35.1M ($132/SF)
Leased 100%
Hold Period 55 Months
RBA 266,160 SF
Year Built 2005
3732 N Las Vegas Blvd • Building 3
Sunpoint Crossing • North Las Vegas Submarket • Las Vegas, NV 89115
Buyer The Blackstone Group L.P. (USA)
Seller Colony Capital, Inc. (USA)
Broker CBRE
Sale Type Investment
Sale Cond Bulk/Portfolio Sale
Sale Date Dec 2019
Sale Price $35.1M ($138/SF)
Leased 81%
Hold Period 11 Months
RBA 254,548 SF
Year Built 2019
9/21/2020Copyrighted report licensed to ROI Appraisal Britton Group - 103161
Page 14

Recent Significant SalesLas Vegas Industrial
8385 Eastgate Rd • Bldg B
Henderson Freeways Crossing • SE LV/Henderson Submarket • Henderson, NV 89015
Buyer The Blackstone Group L.P. (USA)
Seller Colony Capital, Inc. (USA)
Broker CBRE
Sale Type Investment
Sale Cond Bulk/Portfolio Sale
Sale Date Dec 2019
Sale Price $31.3M ($156/SF)
Leased 100%
Hold Period 20 Months
RBA 200,450 SF
Year Built 2017
3450 N Lamb Blvd • Building 1
Sunpoint Crossing • North Las Vegas Submarket • Las Vegas, NV 89115
Buyer The Blackstone Group L.P. (USA)
Seller Colony Capital, Inc. (USA)
Broker CBRE
Sale Type Investment
Sale Cond Bulk/Portfolio Sale
Sale Date Dec 2019
Sale Price $28.6M ($138/SF)
Leased 29%
Hold Period 11 Months
RBA 207,689 SF
Year Built 2019
4640 Nexus Way • National Indoor RV Centers Bldg # 4
Northgate Distribution Center • North Las Vegas Submarket • North Las Vegas, NV 89081
Buyer The Blackstone Group L.P. (USA)
Seller Global Logistic Properties… (USA)
Broker Eastdil Secured, LLC
Sale Type Investment
Sale Cond Bulk/Portfolio Sale, Entity Buy/Member…
Sale Date Sep 2019
Sale Price $28.5M ($132/SF)
Leased 100%
Hold Period 9 Months
RBA 215,804 SF
Year Built 2018
5402 E El Campo Grande Ave • Bldg A
Northern Beltway Industrial Center • Speedway Submarket • Las Vegas, NV 89115
Buyer The Blackstone Group L.P. (USA)
Seller Colony Capital, Inc. (USA)
Broker CBRE
Sale Type Investment
Sale Cond Bulk/Portfolio Sale
Sale Date Dec 2019
Sale Price $28M ($154/SF)
Leased 100%
Hold Period 11 Months
RBA 181,431 SF
Year Built 2008
8390 Eastgate Rd • Bldg A
Henderson Freeways Crossing • SE LV/Henderson Submarket • Henderson, NV 89015
Buyer The Blackstone Group L.P. (USA)
Seller Colony Capital, Inc. (USA)
Broker CBRE
Sale Type Investment
Sale Cond Bulk/Portfolio Sale
Sale Date Dec 2019
Sale Price $25.5M ($156/SF)
Leased 100%
Hold Period 20 Months
RBA 163,000 SF
Year Built 2016
9/21/2020Copyrighted report licensed to ROI Appraisal Britton Group - 103161
Page 15

PlayersLas Vegas Industrial
TOP OWNERS
Company Name Owned SF Owned Props Avg SF 12 Mo Bought 12 Mo Sold 12 Mo Net Trans
Prologis, Inc. 11,149,823 67 166,415 $58,178,544 $22,100,000 $36,078,544
The Blackstone Group L.P. 9,932,935 40 248,323 $932,640,044 - $932,640,044
Harsch Investment Properties 9,708,512 197 49,282 - - -
Clark County 4,885,914 39 125,280 - - -
BKM Capital Partners 1,856,161 38 48,846 - $15,199,999 ($15,199,999)
Majestic Realty Co. 1,852,277 9 205,809 - - -
Norwegian Government Pension Fun… 1,675,815 23 72,862 - $22,100,000 ($22,100,000)
Black Creek Group 1,609,300 6 268,217 $62,384,214 $38,123,738 $24,260,476
Fireside Investments 1,600,000 1 1,600,000 - - -
Clarion Partners 1,587,633 8 198,454 $12,100,000 - $12,100,000
City Of Las Vegas 1,367,095 6 227,849 - - -
Modern Logistics Properties 1,138,391 3 379,464 - - -
The TJX Companies, Inc. 1,113,000 2 556,500 - - -
MCA Realty, Inc. 901,483 41 21,987 $3,064,000 $7,850,000 ($4,786,000)
EJM Development Co. 873,953 9 97,106 - - -
Preylock Holdings, LLC 855,000 1 855,000 $110,000,000 - $110,000,000
Harvest Properties 813,120 1 813,120 - - -
Red Rock Resorts, Inc 805,860 51 15,801 - - -
Skadden, Arps, Slate, Meagher & Flo… 779,400 2 389,700 - - -
EastGroup Properties, Inc. 754,368 7 107,767 $25,473,110 - $25,473,110
York Nevada Management South LLC 747,515 20 37,376 - - -
Operating Engineers Local Union No. 3 729,318 3 243,106 - - -
Titanium Metals Corporation 722,688 2 361,344 - - -
VanTrust Real Estate LLC 715,460 1 715,460 - $155,226,000 ($155,226,000)
County of Clark Aviation 693,603 6 115,601 - - -
Bixby Land Company 670,883 4 167,721 - - -
Invesco Ltd. 648,596 4 162,149 - - -
Levi Strauss & Co. 638,365 1 638,365 - - -
Dermody Properties, Inc. 636,123 4 159,031 $35,450,000 - $35,450,000
CapRock Partners 619,223 4 154,806 $7,850,000 $40,050,001 ($32,200,001)
Clark County School District 585,716 4 146,429 - - -
Colony Capital, Inc. 546,480 1 546,480 - $369,498,686 ($369,498,686)
J.A. Kennedy Real Estate Co. 524,283 6 87,381 - - -
CDW Corporation 513,240 1 513,240 - - -
Southern Wine & Spirits America 467,583 1 467,583 - - -
Dale Roesener 463,641 4 115,910 - - -
Clearwater Paper Corporation 450,898 1 450,898 - - -
Tronox 433,731 1 433,731 - - -
Angelo, Gordon & Co. 429,808 5 85,962 - - -
Lincoln Property Company 425,752 6 70,959 $72,000,000 - $72,000,000
MassMutual 421,093 1 421,093 - - -
Landstar Management 419,679 5 83,936 $14,905,987 - $14,905,987
9/21/2020Copyrighted report licensed to ROI Appraisal Britton Group - 103161
Page 16

PlayersLas Vegas Industrial
TOP BUYERS PAST 12 MONTHS
Company Name Sales Volume Transactions Transacted SF Avg SF Cap Rate Sale Price/SF
The Blackstone Group L.P. $939,975,001 32 6,861,661 214,427 - $137
Preylock Holdings, LLC $110,000,000 1 855,000 855,000 - $129
Lincoln Property Company $72,000,000 6 425,752 70,959 - $169
Black Creek Group $62,384,214 1 670,798 670,798 5.3% $93
Prologis, Inc. $58,178,544 2 400,824 200,412 - $145
The Moulton Company $45,226,000 1 322,560 322,560 - $140
Dermody Properties, Inc. $35,450,000 3 384,323 128,108 - $92
EastGroup Properties, Inc. $25,473,110 3 195,938 65,313 - $130
Nicola Crosby Real Estate Asset Managemen… $20,024,997 10 138,219 13,822 - $145
Nicola Wealth Management $20,024,997 10 138,219 13,822 - $145
Linden Capital Partners LP $20,000,000 1 18,847 18,847 - $1,061
Wells Enterprises $19,150,000 1 193,700 193,700 - $99
Cooper & Brain Oil Inc $19,000,000 1 130,842 130,842 - $145
Eric A Knudsen Trust $15,750,000 1 85,943 85,943 7.8% $183
Madaluxe Group $15,199,999 4 103,613 25,903 - $147
Landstar Management $14,905,987 1 106,680 106,680 4.3% $140
Clarion Partners $12,100,000 1 83,125 83,125 5.3% $146
Dairy Farmers of America $10,778,260 1 64,783 64,783 - $166
The Krausz Companies, Inc. $10,500,000 1 86,515 86,515 8.7% $121
Arcadia Inc $10,449,765 3 88,915 29,638 - $118
Dillon, Julie $10,281,250 2 61,375 30,688 - $168
NFI $9,650,000 1 82,900 82,900 - $116
CapRock Partners $7,850,000 2 92,223 46,112 - $85
Alon Pinchassi $7,595,466 3 115,922 38,641 - $66
Wyandotte, Inc. $6,800,000 1 39,975 39,975 - $170
John & Debra Hansen $6,250,000 1 44,000 44,000 - $142
Titan Solar Power $5,600,000 2 28,204 14,102 - $199
Caliber Collision Centers $5,250,000 1 55,974 55,974 - $94
Wright, Leo & Cristina $4,800,000 2 48,564 24,282 - $99
Borris L Shekhter $4,450,000 1 27,799 27,799 - $160
Tiberti Company $3,800,000 1 28,450 28,450 - $134
Nordis Direct, Inc. $3,589,304 1 21,886 21,886 - $164
Community Ambulance $3,250,000 1 21,000 21,000 - $155
MCA Realty, Inc. $3,064,000 1 27,195 27,195 - $113
Benjamin P Millis $2,925,000 1 25,875 25,875 5.7% $113
GUNSALLUS, DANNY $2,880,000 1 20,038 20,038 - $144
Marc Evan Badain $2,708,401 2 17,457 8,729 - $155
David A Bialis $2,685,000 1 13,625 13,625 6.5% $197
Brookfield Asset Management, Inc. $2,680,000 1 12,000 12,000 - $223
Daniel J. Thistle $2,350,000 1 21,137 21,137 - $111
El-Ariss, Samer $2,300,000 1 10,136 10,136 - $227
Susan Ackerman $2,300,000 1 14,814 14,814 7.0% $155
9/21/2020Copyrighted report licensed to ROI Appraisal Britton Group - 103161
Page 17
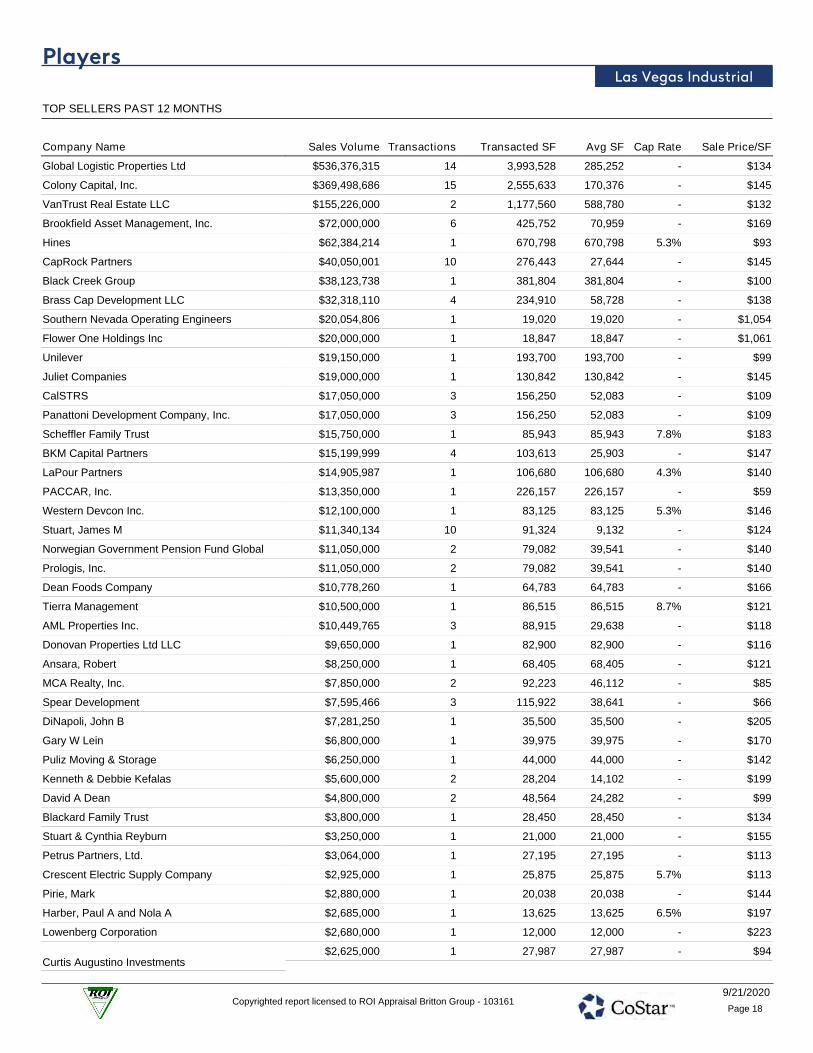
PlayersLas Vegas Industrial
TOP SELLERS PAST 12 MONTHS
Company Name Sales Volume Transactions Transacted SF Avg SF Cap Rate Sale Price/SF
Global Logistic Properties Ltd $536,376,315 14 3,993,528 285,252 - $134
Colony Capital, Inc. $369,498,686 15 2,555,633 170,376 - $145
VanTrust Real Estate LLC $155,226,000 2 1,177,560 588,780 - $132
Brookfield Asset Management, Inc. $72,000,000 6 425,752 70,959 - $169
Hines $62,384,214 1 670,798 670,798 5.3% $93
CapRock Partners $40,050,001 10 276,443 27,644 - $145
Black Creek Group $38,123,738 1 381,804 381,804 - $100
Brass Cap Development LLC $32,318,110 4 234,910 58,728 - $138
Southern Nevada Operating Engineers $20,054,806 1 19,020 19,020 - $1,054
Flower One Holdings Inc $20,000,000 1 18,847 18,847 - $1,061
Unilever $19,150,000 1 193,700 193,700 - $99
Juliet Companies $19,000,000 1 130,842 130,842 - $145
CalSTRS $17,050,000 3 156,250 52,083 - $109
Panattoni Development Company, Inc. $17,050,000 3 156,250 52,083 - $109
Scheffler Family Trust $15,750,000 1 85,943 85,943 7.8% $183
BKM Capital Partners $15,199,999 4 103,613 25,903 - $147
LaPour Partners $14,905,987 1 106,680 106,680 4.3% $140
PACCAR, Inc. $13,350,000 1 226,157 226,157 - $59
Western Devcon Inc. $12,100,000 1 83,125 83,125 5.3% $146
Stuart, James M $11,340,134 10 91,324 9,132 - $124
Norwegian Government Pension Fund Global $11,050,000 2 79,082 39,541 - $140
Prologis, Inc. $11,050,000 2 79,082 39,541 - $140
Dean Foods Company $10,778,260 1 64,783 64,783 - $166
Tierra Management $10,500,000 1 86,515 86,515 8.7% $121
AML Properties Inc. $10,449,765 3 88,915 29,638 - $118
Donovan Properties Ltd LLC $9,650,000 1 82,900 82,900 - $116
Ansara, Robert $8,250,000 1 68,405 68,405 - $121
MCA Realty, Inc. $7,850,000 2 92,223 46,112 - $85
Spear Development $7,595,466 3 115,922 38,641 - $66
DiNapoli, John B $7,281,250 1 35,500 35,500 - $205
Gary W Lein $6,800,000 1 39,975 39,975 - $170
Puliz Moving & Storage $6,250,000 1 44,000 44,000 - $142
Kenneth & Debbie Kefalas $5,600,000 2 28,204 14,102 - $199
David A Dean $4,800,000 2 48,564 24,282 - $99
Blackard Family Trust $3,800,000 1 28,450 28,450 - $134
Stuart & Cynthia Reyburn $3,250,000 1 21,000 21,000 - $155
Petrus Partners, Ltd. $3,064,000 1 27,195 27,195 - $113
Crescent Electric Supply Company $2,925,000 1 25,875 25,875 5.7% $113
Pirie, Mark $2,880,000 1 20,038 20,038 - $144
Harber, Paul A and Nola A $2,685,000 1 13,625 13,625 6.5% $197
Lowenberg Corporation $2,680,000 1 12,000 12,000 - $223
Curtis Augustino Investments$2,625,000 1 27,987 27,987 - $94
9/21/2020Copyrighted report licensed to ROI Appraisal Britton Group - 103161
Page 18
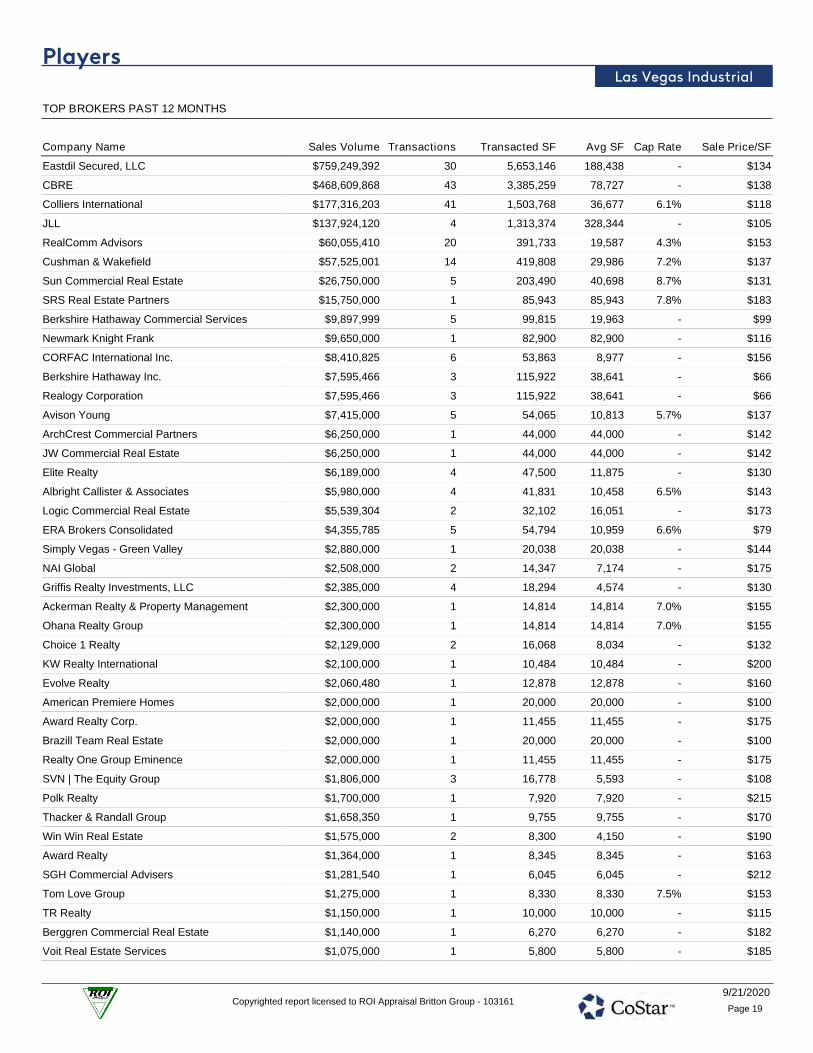
PlayersLas Vegas Industrial
TOP BROKERS PAST 12 MONTHS
Company Name Sales Volume Transactions Transacted SF Avg SF Cap Rate Sale Price/SF
Eastdil Secured, LLC $759,249,392 30 5,653,146 188,438 - $134
CBRE $468,609,868 43 3,385,259 78,727 - $138
Colliers International $177,316,203 41 1,503,768 36,677 6.1% $118
JLL $137,924,120 4 1,313,374 328,344 - $105
RealComm Advisors $60,055,410 20 391,733 19,587 4.3% $153
Cushman & Wakefield $57,525,001 14 419,808 29,986 7.2% $137
Sun Commercial Real Estate $26,750,000 5 203,490 40,698 8.7% $131
SRS Real Estate Partners $15,750,000 1 85,943 85,943 7.8% $183
Berkshire Hathaway Commercial Services $9,897,999 5 99,815 19,963 - $99
Newmark Knight Frank $9,650,000 1 82,900 82,900 - $116
CORFAC International Inc. $8,410,825 6 53,863 8,977 - $156
Berkshire Hathaway Inc. $7,595,466 3 115,922 38,641 - $66
Realogy Corporation $7,595,466 3 115,922 38,641 - $66
Avison Young $7,415,000 5 54,065 10,813 5.7% $137
ArchCrest Commercial Partners $6,250,000 1 44,000 44,000 - $142
JW Commercial Real Estate $6,250,000 1 44,000 44,000 - $142
Elite Realty $6,189,000 4 47,500 11,875 - $130
Albright Callister & Associates $5,980,000 4 41,831 10,458 6.5% $143
Logic Commercial Real Estate $5,539,304 2 32,102 16,051 - $173
ERA Brokers Consolidated $4,355,785 5 54,794 10,959 6.6% $79
Simply Vegas - Green Valley $2,880,000 1 20,038 20,038 - $144
NAI Global $2,508,000 2 14,347 7,174 - $175
Griffis Realty Investments, LLC $2,385,000 4 18,294 4,574 - $130
Ackerman Realty & Property Management $2,300,000 1 14,814 14,814 7.0% $155
Ohana Realty Group $2,300,000 1 14,814 14,814 7.0% $155
Choice 1 Realty $2,129,000 2 16,068 8,034 - $132
KW Realty International $2,100,000 1 10,484 10,484 - $200
Evolve Realty $2,060,480 1 12,878 12,878 - $160
American Premiere Homes $2,000,000 1 20,000 20,000 - $100
Award Realty Corp. $2,000,000 1 11,455 11,455 - $175
Brazill Team Real Estate $2,000,000 1 20,000 20,000 - $100
Realty One Group Eminence $2,000,000 1 11,455 11,455 - $175
SVN | The Equity Group $1,806,000 3 16,778 5,593 - $108
Polk Realty $1,700,000 1 7,920 7,920 - $215
Thacker & Randall Group $1,658,350 1 9,755 9,755 - $170
Win Win Real Estate $1,575,000 2 8,300 4,150 - $190
Award Realty $1,364,000 1 8,345 8,345 - $163
SGH Commercial Advisers $1,281,540 1 6,045 6,045 - $212
Tom Love Group $1,275,000 1 8,330 8,330 7.5% $153
TR Realty $1,150,000 1 10,000 10,000 - $115
Berggren Commercial Real Estate $1,140,000 1 6,270 6,270 - $182
Voit Real Estate Services $1,075,000 1 5,800 5,800 - $185
9/21/2020Copyrighted report licensed to ROI Appraisal Britton Group - 103161
Page 19

Britton-Adamo Group/ROI Appraisal File Number 20-089
DEFINITIONS

Britton-Adamo Group/ROI Appraisal File Number 20-089
DEFINITIONS FEE SIMPLE ESTATE
“Absolute ownership unencumbered by any other interest or estate, subject only to the limitations imposed by the governmental powers of taxation, eminent domain, police power, and escheat.”
Source: Appraisal Institute, The Dictionary of Real Estate Appraisal, 6th ed. (Chicago: Appraisal Institute, 2015)
LEASED FEE ESTATE “The ownership interest held by the lessor, which includes the right to receive the contract rent specified in the lease plus the reversionary right when the lease expires"
Source: Appraisal Institute, The Dictionary of Real Estate Appraisal, 6th ed. (Chicago: Appraisal Institute, 2015)
LEASEHOLD ESTATE “The right held by the lessee to use and occupy real estate for a stated term and under the conditions specified in the lease”
Source: Appraisal Institute, The Dictionary of Real Estate Appraisal, 6th ed. (Chicago: Appraisal Institute, 2015)
HIGHEST AND BEST USE “The reasonably probable use of property that results in the highest value. The four criteria that the highest and best use must meet are legal permissibility, physical possibility, financial feasibility, and maximum productivity.”
Source: Appraisal Institute, The Dictionary of Real Estate Appraisal, 6th ed. (Chicago: Appraisal Institute, 2015)
MARKETING TIME “An opinion of the amount of time it might take to sell a real or personal property interest at the concluded market value level during the period immediately after the effective date of an appraisal. Marketing time differs from exposure time, which is always presumed to precede the effective date of an appraisal.”
Source: Appraisal Institute, The Dictionary of Real Estate Appraisal, 6th ed. (Chicago: Appraisal Institute, 2015)
EXPOSURE TIME “The estimated length of time that the property interest being appraised would have been offered on the market prior to the hypothetical consummation of a sale at market value on the effective date of the appraisal. Comment: Exposure time is a retrospective opinion based on an analysis of past events assuming a competitive and open market.”
Source: Uniform Standards of Professional Appraisal Practice (USPAP)
MARKET VALUE “A type of value that is the major focus of most real property appraisal assignments. Both economic and legal definitions of market value have been developed and refined, such as the following. 1. The most widely accepted components of market value are incorporated in the following definition: The most probable price that the specified property interest should sell for in a competitive market after a reasonable exposure time, as of a specified date, in cash, or in terms equivalent to cash, under all conditions requisite to a fair sale, with the buyer and seller each acting prudently, knowledgeably, for self-interest, and assuming that neither is under duress. 2. Market value is described, not defined, in the Uniform Standards of Professional Appraisal Practice (USPAP) as follows: A type of value, stated as an opinion, that presumes the transfer of a property (i.e., a right of ownership or a bundle of such rights), as of a certain date, under specific conditions set forth in the definition of the term identified by the appraiser as applicable in an appraisal. Comment: Forming an opinion of market value is the purpose of many real property appraisal assignments particularly when the client’s
Britton-Adamo Group/ROI Appraisal File Number 20-089
intended use includes more than one intended user. The conditions included in market value definitions establish market perspectives for development of the opinion. These conditions may vary from definition to definition but generally fall into three categories: (1) the relationship, knowledge, and motivation of the parties (i.e., seller and buyer); (2) the terms of sale (e.g., cash, cash equivalent, or other terms); and (3) the conditions of sale (e.g., exposure in a competitive market for a reasonable time prior to sale). USPAP also requires that certain items be included in every appraisal report. Among these items, the following are directly related to the definition of market value:
• Identification of the specific property rights to be appraised. • Statement of the effective date of the value opinion. • Specification as to whether cash, terms equivalent to cash, or other precisely described financing terms are assumed as the basis of the appraisal. • If the appraisal is conditioned upon financing or other terms, specification as to whether the financing or terms are at, below, or above market interest rates and/or contain unusual conditions or incentives. The terms of above- or below-market interest rates and/or other special incentives must be clearly set forth; their contribution to, or negative influence on, value must be described and estimated; and the market data supporting the opinion of value must be described and explained.
3. The following definition of market value is used by agencies that regulate federally insured financial institutions in the United States: The most probable price that a property should bring in a competitive and open market under all conditions requisite to a fair sale, the buyer and seller each acting prudently and knowledgeably, and assuming the price is not affected by undue stimulus. Implicit in this definition is the consummation of a sale as of a specified date and the passing of title from seller to buyer under conditions whereby:
• Buyer and seller are typically motivated; • Both parties are well informed or well advised, and acting in what they consider their best interests; • A reasonable time is allowed for exposure in the open market; • Payment is made in terms of cash in U.S. dollars or in terms of financial arrangements comparable thereto; and • The price represents the normal consideration for the property sold unaffected by special or creative financing or sales concessions granted by anyone associated with the sale. (12 C.F.R. Part 34.42(g); 55 Federal Register 34696, August 24, 1990, as amended at 57 Federal Register 12202, April 9, 1992; 59 Federal Register 29499, June 7, 1994)
4. The International Valuation Standards (IVS) Council defines market value for the purpose of international standards as follows: The estimated amount for which a property should exchange on the valuation date between a willing buyer and a willing seller in an arm’s-length transaction, after proper marketing and where the parties had each acted knowledgeably, prudently, and without compulsion. 5. The Uniform Standards for Federal Land Acquisitions defines market value as follows: Market value is the amount in cash, or on terms reasonably equivalent to cash, for which in all probability the property would have sold on the effective date of the appraisal, after a reasonable exposure time on the open competitive market, from a willing and reasonably knowledgeable buyer, with neither acting under any compulsion to buy or sell, giving due consideration to all available economic uses of the property at the time of the appraisal.”
Source: Appraisal Institute, The Dictionary of Real Estate Appraisal, 6th ed. (Chicago: Appraisal Institute, 2015)
“AS IS” MARKET VALUE “The estimate of the market value of real property in its current physical condition, use, and zoning as of the appraisal date.”
Source: Appraisal Institute, The Dictionary of Real Estate Appraisal, 6th ed. (Chicago: Appraisal Institute, 2015)
PROSPECTIVE OPINION OF VALUE “A value opinion effective as of a specified future date. The term does not define a type of value. Instead, it identifies a value opinion as being effective at some specific future date. An opinion of value as of a prospective date is frequently sought in connection with projects that are proposed, under construction, or under conversion to a new use, or those that have not yet achieved sellout or a stabilized level of long-term occupancy.”
Source: Appraisal Institute, The Dictionary of Real Estate Appraisal, 6th ed. (Chicago: Appraisal Institute, 2015)

Britton-Adamo Group/ROI Appraisal File Number 20-089
AGGREGATE OF RETAIL VALUE (ARV)
“The sum of the separate and distinct market value opinions for each of the units in a condominium, subdivision development, or portfolio of properties, as of the date of valuation. The aggregate of retail values does not represent an opinion of value of all the units as though sold together in a single transaction;; it is simply the total of multiple market value conclusions.”
Source: Appraisal Institute, The Dictionary of Real Estate Appraisal, 6th ed. (Chicago: Appraisal Institute, 2015)
EXTRAORDINARY ASSUMPTION
“An assignment-specific assumption as of the effective date regarding uncertain information used in an analysis which, if found to be false, could alter the appraiser’s opinions or conclusions. Comment: Uncertain information might include physical, legal, or economic characteristics of the subject property; or conditions external to the property, such as market conditions or trends; or about the integrity of data used in an analysis.”
Source: Uniform Standards of Professional Appraisal Practice (USPAP), 2020-2021 ed., Appraisal Standards Board of The Appraisal Foundation
HYPOTHETICAL CONDITION
“A condition, directly related to a specific assignment, which is contrary to what is known by the appraiser to exist on the effective date of the assignment results, but is used for the purpose of analysis. Comment: Hypothetical conditions are contrary to known facts about physical, legal, or economic characteristics of the subject property; or about conditions external to the property, such as market conditions or trends; or about the integrity of data used in an analysis.”
Source: Uniform Standards of Professional Appraisal Practice (USPAP), 2020-2021 ed., Appraisal Standards Board of The Appraisal Foundation
SALES COMPARISON APPROACH
“The process of deriving a value indication for the subject property by comparing sales of similar properties to the property being appraised, identifying appropriate units of comparison, and making adjustments to the sale prices (or unit prices, as appropriate) of the comparable properties based on relevant, market-derived elements of comparison. The sales comparison approach may be used to value improved properties, vacant land, or land being considered as though vacant when an adequate supply of comparable sales is available.”
Source: Appraisal Institute, The Dictionary of Real Estate Appraisal, 6th ed. (Chicago: Appraisal Institute, 2015)
RETROSPECTIVE VALUE OPINION
“A value opinion effective as of a specified historical date. The term retrospective does not define a type of value. Instead, it identifies a value opinion as being effective at some specific prior date. Value as of a historical date is frequently sought in connection with property tax appeals, damage models, lease renegotiation, deficiency judgments, estate tax, and condemnation. Inclusion of the type of value with this term is appropriate, e.g., “retrospective market value opinion.”
Source: Appraisal Institute, The Dictionary of Real Estate Appraisal, 6th ed. (Chicago: Appraisal Institute, 2015)

Britton-Adamo Group/ROI Appraisal File Number 20-089
QUALIFICATIONS OF THE APPRAISER

Britton-Adamo Group/ROI Appraisal File Number 20-089
Qualifications of LUKE J. ADAMO, MAI
AFFILIATIONS/LICENSES Member, Appraisal Institute, #476072 Certified General Appraiser, State of Nevada (License #07352 expires 5/31/21) EMPLOYMENT: Britton-Adamo Group/ROI Appraisal, Henderson, NV Appraiser 2002 to present
REAL ESTATE EXPERIENCE: Residential Sales, Highest and Best Use Analysis; Real Estate
Market and Submarket Analysis; Data Research and Analysis; Site and Project Feasibility Studies; Financial Cash Flow Analysis
APPRAISAL EXPERIENCE: Federal Litigation Support and Testimony, Apartment Complexes, Car Dealerships, Automotive Service Centers, Residential Condominium Projects, Gas/Convenience Stores, Industrial and Manufacturing Facilities, Master Planned Communities, Medical and Professional Office Buildings, Bar/Taverns and Restaurants, Retail Shopping Centers, Self Storage Facilities, Residential Subdivisions, Residential Lots, Vacant Land
GENERAL EDUCATION: University of Nevada, Las Vegas
AFFILIATIONS: President – Las Vegas Chapter of the Appraisal Institute Vice Chair – Nevada State High School Governing Body Clark County Board of Equalization Las Vegas Metro Chamber of Commerce – Leadership Las Vegas Class of 2016 MAI Designation – 2015 NAIOP Member Litigation Professional Development Certification
HOBBIES: Community Volunteering, Outdoor Physical Activity, and World
Traveling REFERENCES: Available Upon Request

Britton-Adamo Group/ROI Appraisal File Number 20-089