SUMMARY APPRAISAL REPORT
50
1 SUMMARY APPRAISAL REPORT Starn Building and Excess Land 2909 Arctic Boulevard in Anchorage, Alaska FOR Date of Appraisal Municipal Light and Power, MOA December 15, 2010 12000 East 1st Ave. Anchorage, AK Attn. Mr. James Posey, General Manager Date of Valuation December 8, 2010 BBC FILE No. Date of Inspection 10-135 December 8, 2010 BY Brian Bethard, MAI General Real Estate Appraiser (Cert. #281) BLACK-SMITH, BETHARD & CARLSON, LLC 1199 E. Dimond Blvd., Ste. 200 Anchorage, Alaska 99515
Transcript of SUMMARY APPRAISAL REPORT

1
SUMMARY APPRAISAL REPORT
Starn Building and Excess Land
2909 Arctic Boulevard in Anchorage, Alaska
FOR Date of Appraisal
Municipal Light and Power, MOA December 15, 2010
12000 East 1st Ave.
Anchorage, AK
Attn. Mr. James Posey, General Manager
Date of Valuation
December 8, 2010
BBC FILE No. Date of Inspection
10-135 December 8, 2010
BY
Brian Bethard, MAI
General Real Estate Appraiser (Cert. #281)
BLACK-SMITH, BETHARD & CARLSON, LLC
1199 E. Dimond Blvd., Ste. 200
Anchorage, Alaska 99515

Black-Smith, Bethard and Carlson LLC. 2
December 15, 2010
Municipal Light and Power, MOA
12000 East 1st Ave.
Anchorage, AK
Attn. Mr. James Posey, General Manager
RE: SUMMARY APPRAISAL REPORT
Starn Building and Excess Land
2909 Arctic Boulevard
Anchorage, Alaska
Dear Mr. Posey:
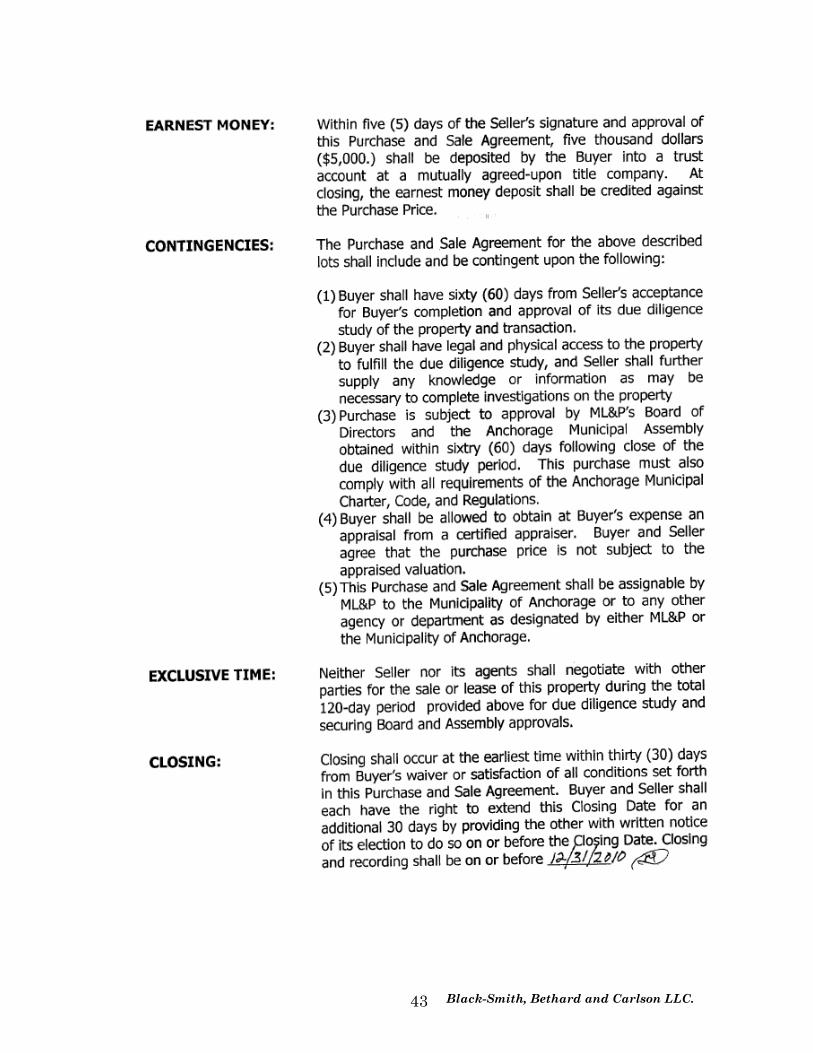
In fulfillment of our agreement dated November 24, 2010, we are pleased to transmit
our Summary Appraisal Report of the estimated Market Value in the referenced
property. As a result of our analysis, we have formed an opinion that the market value
of the fee simple interest (as defined in the report), subject to the definitions,
certifications, and limiting conditions set forth in the attached report, as of December 8,
2010 is:
Lot 5A, Block 5 (Starn Building): $1,200,000 Lot 4, Block 5 (Excess Land): $184,000
The value opinion is stated in terms of cash. The market exposure period (looking
backward) and the marketing time (looking forward) are both estimated at one year.
The value opinions reported are qualified by certain definitions, assumptions, limiting
conditions, and certifications. We particularly call your attention to the Assumptions
and Limiting Conditions on page 16.
The narrative appraisal report that follows sets forth the identification of the property,
the assumptions and limiting conditions, pertinent facts about the area and the subject
property, comparable data, the results of the investigation and analyses, and the
reasoning leading to the conclusions reached. This report was prepared in accordance
with the standards and regulations as set forth in USPAP and FIRREA.
The report was prepared for and our professional fee was billed to the Municipality of
Anchorage (MOA). It is intended for use by your internal management, municipal
departments, your auditor and appropriate regulatory authorities.
Sincerely, BLACK-SMITH, BETHARD & CARLSON, LLC
Brian Z. Bethard, MAI
BLACK-SMITH, BETHARD & CARLSON, LLC
Appraisers 1199 E. Dimond, Ste. 200
Anchorage, Alaska 99515
Phone 907-274-4654
Fax: 907-274-0889
E-mail: [email protected]
Black-Smith, Bethard and Carlson LLC. 3
TABLE OF CONTENTS
CERTIFICATION ...................................................................................................... 4
EXECUTIVE SUMMARY ......................................................................................... 5
SUBJECT PHOTOGRAPHS .................................................................................... 7
IDENTIFICATION OF THE PROPERTY ................................................................ 9
NATURE OF THE ASSIGNMENT ........................................................................... 10
SCOPE OF WORK ..................................................................................................... 12
ASSUMPTIONS AND LIMITING CONDITIONS ................................................... 13
AREA DATA .............................................................................................................. 14
NEIGHBORHOOD DESCRIPTION ......................................................................... 16
SITE DESCRIPTION ................................................................................................ 18
IMPROVEMENTS DESCRIPTION .......................................................................... 20
MARKET ANALYSIS ................................................................................................ 23
HIGHEST AND BEST USE ...................................................................................... 26
INCOME APPROACH ............................................................................................... 33
ADDENDA
Engagement Letter
Qualifications of Appraisers
Underlying Assumptions and Limiting Conditions
Black-Smith, Bethard and Carlson LLC. 4
CERTIFICATION
We certify that, to the best of our knowledge and belief...
The statements of fact contained in this report are true and correct.
The reported analyses, opinions, and conclusions are limited only by the reported assumptions
and limiting conditions and are my personal, impartial, and unbiased professional analyses,
opinions, and conclusions.
We have no present or prospective interest in the property that is the subject of this report, and
no personal interest with respect to the parties involved.
We have no bias with respect to the property that is the subject of this report or to the parties
involved with this assignment.
Our engagement in this assignment was not contingent upon developing or reporting
predetermined results.
Our compensation for completing this assignment is not contingent upon the development or
reporting of a predetermined value or direction in value that favors the cause of the client, the
amount of the value opinion, the attainment of a stipulated result, or the occurrence of a
subsequent event directly related to the intended use of this appraisal.
Our analyses, opinions, and conclusions were developed, and this report has been prepared, in
conformity with the Uniform Standards of Professional Appraisal Practice as well as the
requirements of the Code of Professional Ethics and the Standards of Professional Practice of the
Appraisal Institute. The use of this report is subject to the requirements of the Appraisal
Institute relating to review by its duly authorized representatives.
Brian Z. Bethard, MAI made a personal inspection of the property that is the subject of this
report.
No one provided significant real property appraisal assistance to the persons signing this
certification.
As of the date of this report I, Brian Z. Bethard, MAI have completed the continuing education
program of the Appraisal Institute.
Brian Z. Bethard, MAI is certified by the State of Alaska as a General Real Estate Appraiser
(Certificate No. 281).
Brian Z. Bethard, MAI has the appropriate knowledge and experience necessary to complete this
appraisal assignment competently.
Dated this 15th day of December 2010.
Brian Z. Bethard, MAI
General Real Estate Appraiser Cert. # 281
Black-Smith, Bethard and Carlson LLC. 5
EXECUTIVE SUMMARY
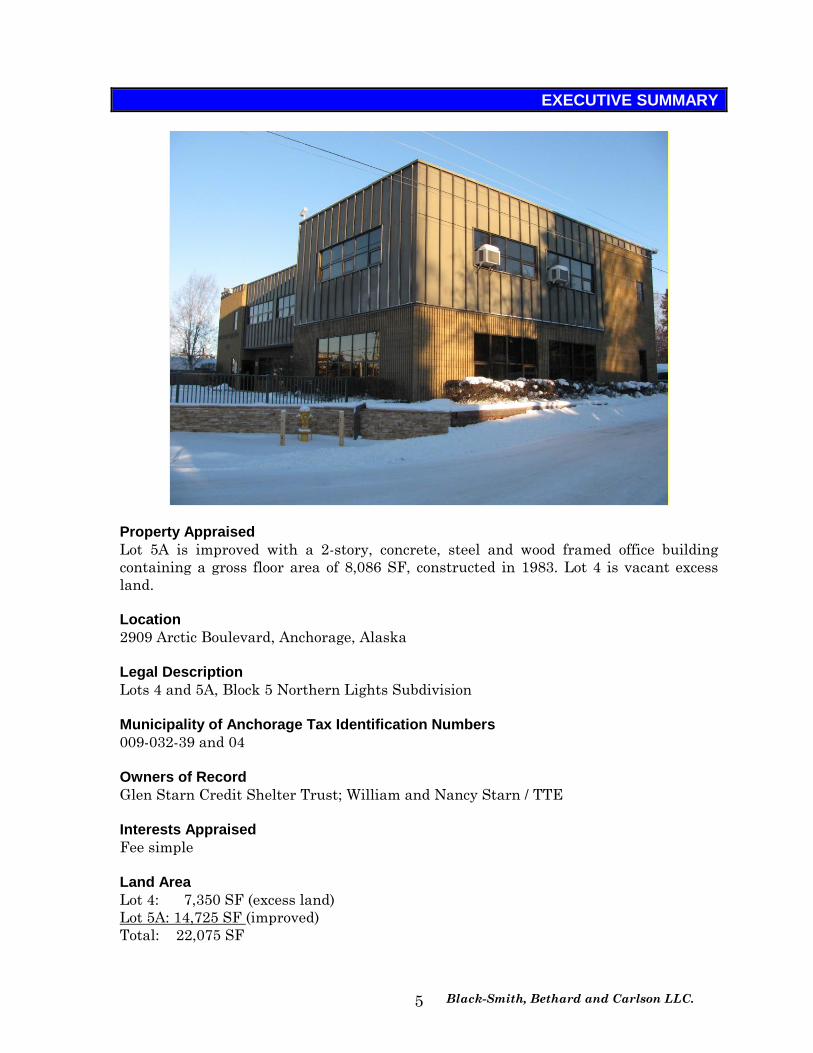
Property Appraised
Lot 5A is improved with a 2-story, concrete, steel and wood framed office building
containing a gross floor area of 8,086 SF, constructed in 1983. Lot 4 is vacant excess
land.
Location
2909 Arctic Boulevard, Anchorage, Alaska
Legal Description
Lots 4 and 5A, Block 5 Northern Lights Subdivision
Municipality of Anchorage Tax Identification Numbers
009-032-39 and 04
Owners of Record
Glen Starn Credit Shelter Trust; William and Nancy Starn / TTE
Interests Appraised
Fee simple
Land Area
Lot 4: 7,350 SF (excess land)
Lot 5A: 14,725 SF (improved)
Total: 22,075 SF
Black-Smith, Bethard and Carlson LLC. 6
Improvements
Lot 5A is improved with a 2-story, concrete, steel, and wood framed office building
containing a gross floor area of 8,086 SF, constructed in 1983. Lot 4 is vacant excess
land.
Appraisal Date
December 15, 2010
Date of Inspection and Valuation
December 8, 2010
Zoning
B-3 (General Business District)
Highest and Best Use "As Vacant"
Owner/user commercial development
Highest and Best Use “As Improved”
As is
Estimated Market Value Allocation: Lot 4 (excess land): $184,000 Lo 5A (improved): $1,200,000
*The subject property is encumbered by three short term leases. Lease documents were
not provided and information was inadequate to render an opinion of value of the
leased fee estate. If lease documents are made available we retain the right to amend
this report.
Black-Smith, Bethard and Carlson LLC. 7
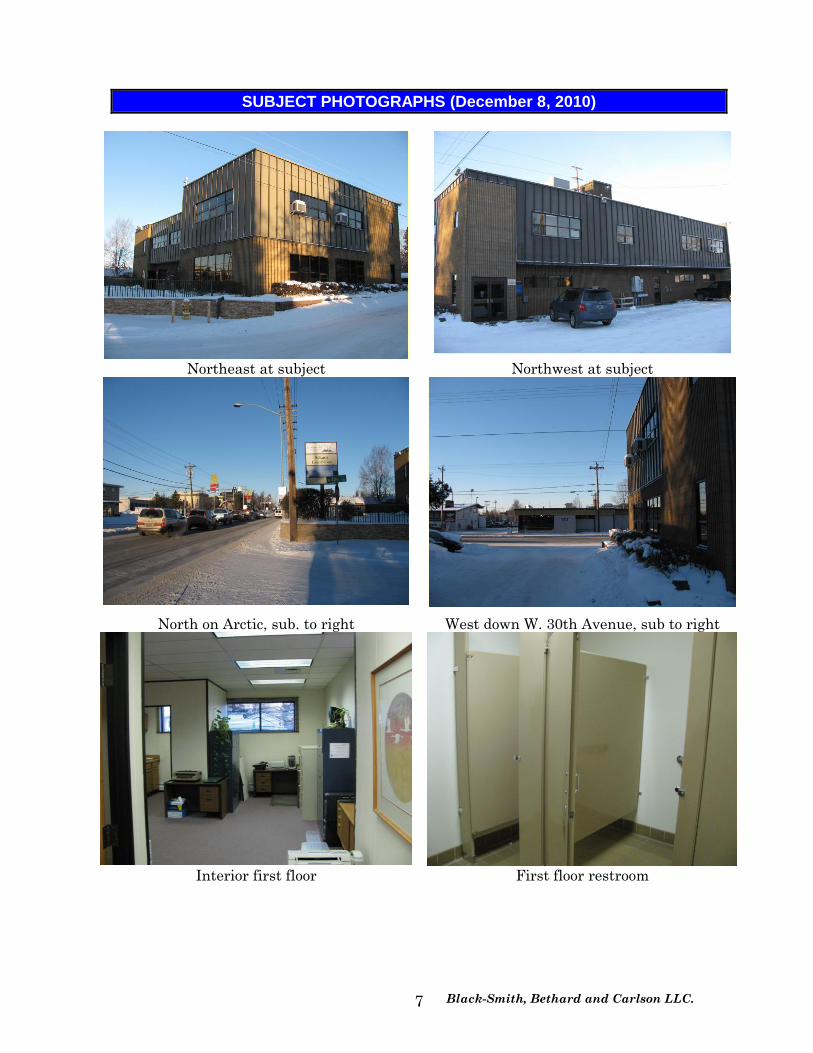
SUBJECT PHOTOGRAPHS (December 8, 2010)
Northeast at subject Northwest at subject
North on Arctic, sub. to right West down W. 30th Avenue, sub to right
Interior first floor First floor restroom
Black-Smith, Bethard and Carlson LLC. 8
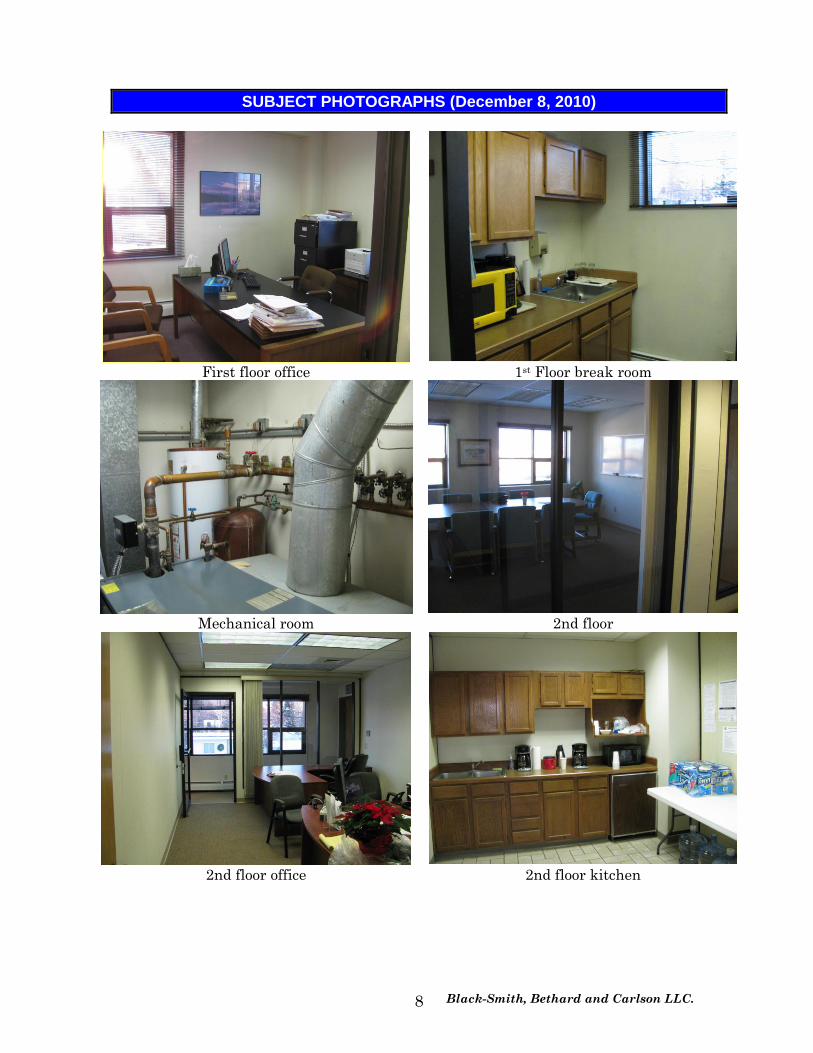
SUBJECT PHOTOGRAPHS (December 8, 2010)
First floor office 1st Floor break room
Mechanical room 2nd floor
2nd floor office 2nd floor kitchen

Black-Smith, Bethard and Carlson LLC. 9
IDENTIFICATION OF THE PROPERTY
Lot 5A is improved with a 2-story, concrete, steel and wood framed office building
containing a gross floor area of 8,086 SF, constructed in 1983. Lot 4 is vacant excess
land.
The property is legally described as Lots 4 and 5A, Block 5 Northern Lights
Subdivision. The property contains an area of 22,075 SF.
The Municipality of Anchorage tax identification numbers are 009-32-39 and 04.
Owners of Record
Glen Starn Credit Shelter Trust; William and Nancy Starn / TTE
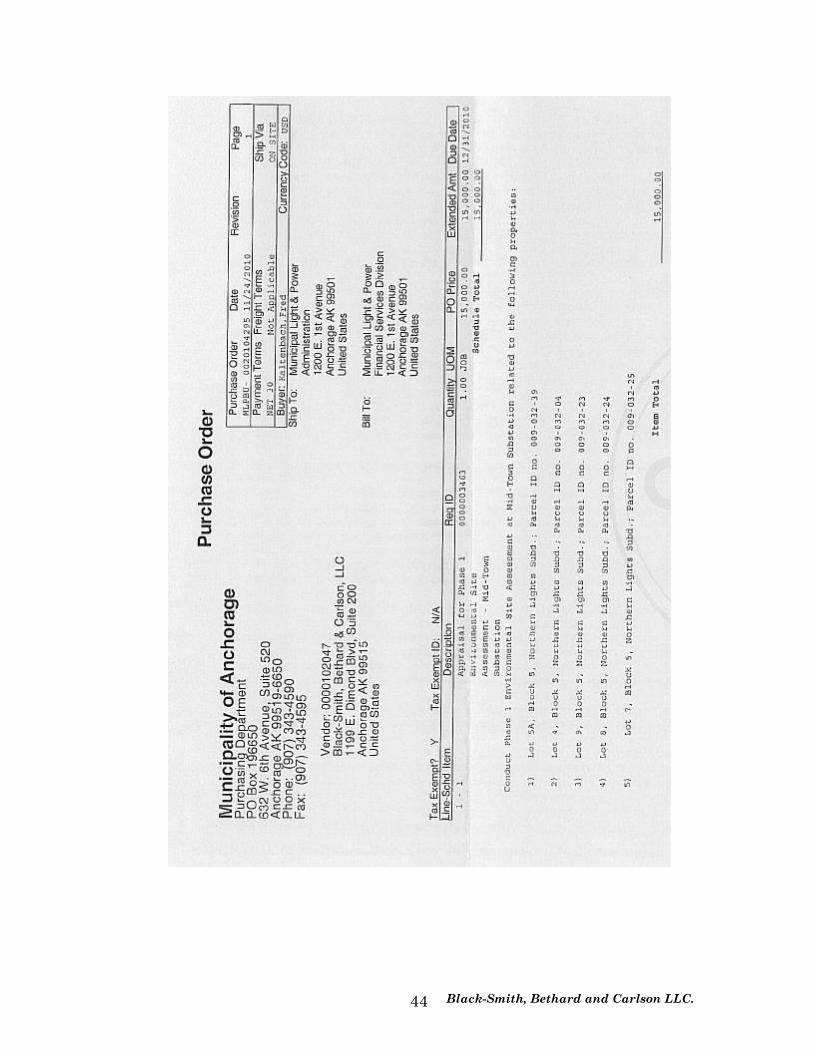
Property History
There have been no known sales of the subject during the past three years. There is a
pending sales agreement for $3.5 to MOA, Municipal Light and Power. (see addenda)
The sale price includes the subject and three single family residences with no break
down provided. The owner wants to lease but will sell for the stipulated price. The
property was not marketed and the buyer is motivated.
Lot 5A
Lot 4
Black-Smith, Bethard and Carlson LLC. 10
NATURE OF THE ASSIGNMENT
Client
Municipal Light and Power, MOA
12000 East 1st Ave.
Anchorage, AK
Attn. Mr. James Posey, General Manager
Cc. Mio Johnson, Chief Engineer
Purpose of the Appraisal and Property Rights Appraised
The purpose of the appraisal is to estimate the market value of the fee simple1 interest
as of December 8, 2010.
Market Value2 is defined as:
"The most probable price, which a property should bring in a competitive and open
market under all conditions requisite to a fair sale, the buyer and seller, each acting
prudently, and knowledgeably, and assuming the price is not affected by undue
stimulus. Implicit in this definition is the consummation of a sale as of a specified date
and the passing of title from seller to buyer under conditions whereby:
1) Buyer and seller are typically motivated;
2) Both parties are well informed or well advised, and both acting in what they
consider their own best interest;
3) A reasonable time is allowed for exposure in the open market;
4) Payment is made in terms of cash in U.S. dollars or in terms of
financial arrangements comparable thereto; and
5) The price represents the normal consideration for the property sold unaffected by
special or creative financing or sales concessions granted by anyone associated
with the sale.
Date of Inspection and Valuation
December 8, 2010
Date of Appraisal
December 15, 2010
Intended Use/Users of the Appraisal
The intended use of this appraisal is for the client, MOA and Municipal Light and
Power (ML&P), to use for asset evaluation for the possible purchase of the subject
parcels. In addition, the intended users of the appraisal include the appropriate
1 "Absolute ownership unencumbered by any other interest or estate, subject only to the limitations
imposed by the governmental powers of taxation, eminent domain, police power, and escheat." The
Dictionary of Real Estate Appraisal, Fourth Edition, Appraisal Institute, page 113.
2 Office of the Comptroller of the Currency under 12 CFR, Part 34, Subpart C-Appraisals, 34.43
Definitions [f].

Black-Smith, Bethard and Carlson LLC. 11
municipal departments and regulatory agencies that may be involved in the purchase of
the property.
Black-Smith, Bethard and Carlson LLC. 12
SCOPE OF WORK
Data sources and the steps in the appraisal development process are summarized:
Property Data
Brian Bethard conducted an exterior and interior inspection and photographed the
property on December 8, 2010. Brian Z. Bethard, MAI.
We examined Municipality of Anchorage (MOA) records on the subject
that included platted dimensions, easements, zoning ordinances,
assessed valuations, public utilities and transportation routes.
Area Data
State and local demographics have been examined, including population and
employment trends and overall economic growth patterns. Sources for much of the data
was the Anchorage Economic Development Corporation, economic and business
journals, newspapers, labor statistics published by the U.S. Government and the State
of Alaska.
Market Data
Alaska is a non-disclosure state. Comparable data was obtained by searching the local
multiple listing service (MLS) records, surveying real estate agents/brokers, property
managers and other appraisers. Market data was confirmed with the property owners,
managers or agents.
Valuation Process
All three traditional approaches to value have been considered. The subject was
constructed in 1983 and the cost approach is not applicable. As required by USPAP its
omission is explained. The subject is valued based on a reconciliation of the income and
sales comparison approaches.
The subject consists of two stand alone sites (lots 5A and Lot 4). The improvements are
located on Lot 5A, and the site has adequate parking. Lot 4 is valued as marketable
excess land.
*The subject property is encumbered by three short term leases. Lease documents were
not provided and information was inadequate to render an opinion of value of the
leased fee estate. If lease documents are made available we retain the right to amend
this report.
Black-Smith, Bethard and Carlson LLC. 13
ASSUMPTIONS AND LIMITING CONDITIONS
General assumptions and limiting conditions are contained in the addenda of the
report. Extraordinary assumptions,3 hypothetical conditions,4 and limiting conditions
are summarized as follows:
o We have not been provided with a Phase 1 Environmental Report. The
appraisers have assumed that the property is environmentally clean
and reserve the right to amend this report should facts prove otherwise.
o The appraisal is made according to the extraordinary assumption that
the information provided is reliable.
o It is assumed that the roof, structure and mechanical systems are in
good working order as indicated by the property contact. A building
inspection report was not provided.
o Lease documents were not provided and no survey of rentable area has
been provided. We have assumed that the lease information is as
reported and reserve the right to amend this report if actual leases or
building survey are provided.
o The subject property is encumbered by three short term leases. Lease
documents were not provided and information was inadequate to render an
opinion of value of the leased fee estate. If lease documents are made available
we retain the right to amend this report.
3 "An assumption, directly related to a specific assignment, which, if found to be false, could alter the
appraiser's opinions or conclusions." Uniform Standards of Professional Practice.
4 "That which is contrary to what exists, but is supposed for the purpose of analysis." Uniform Standards of
Professional Practice.
Black-Smith, Bethard and Carlson LLC. 14
AREA DATA
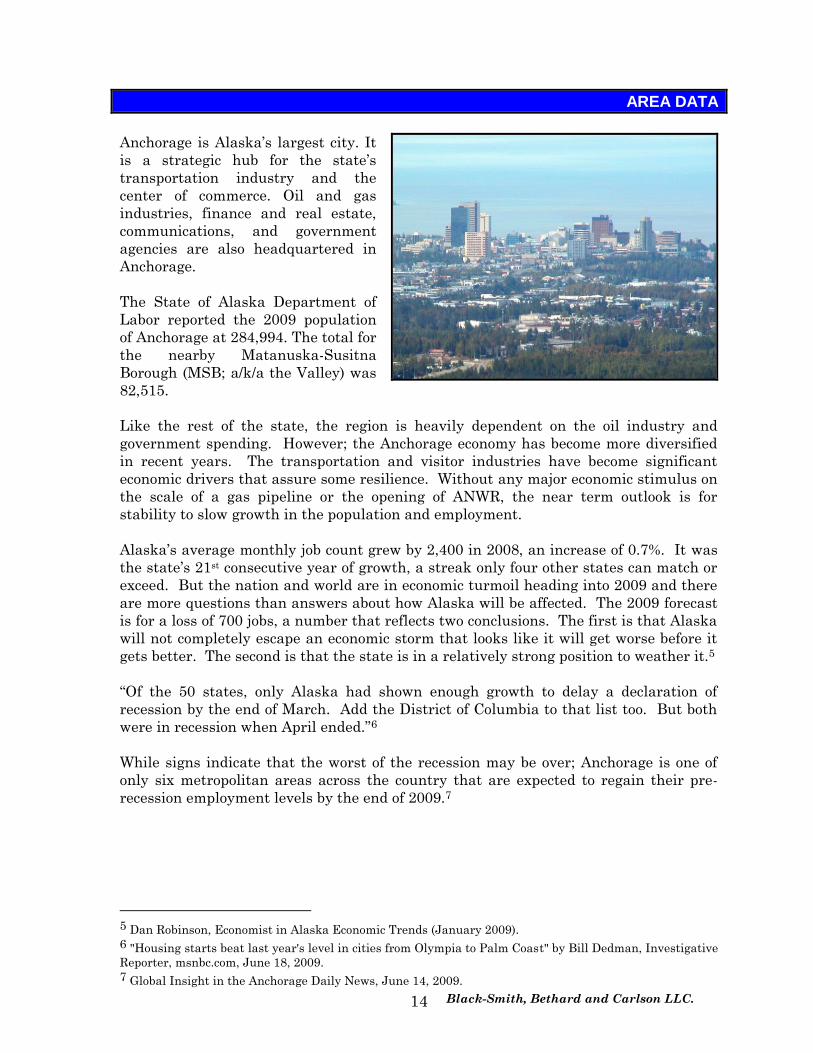
Anchorage is Alaska’s largest city. It
is a strategic hub for the state’s
transportation industry and the
center of commerce. Oil and gas
industries, finance and real estate,
communications, and government
agencies are also headquartered in
Anchorage.
The State of Alaska Department of
Labor reported the 2009 population
of Anchorage at 284,994. The total for
the nearby Matanuska-Susitna
Borough (MSB; a/k/a the Valley) was
82,515.
Like the rest of the state, the region is heavily dependent on the oil industry and
government spending. However; the Anchorage economy has become more diversified
in recent years. The transportation and visitor industries have become significant
economic drivers that assure some resilience. Without any major economic stimulus on
the scale of a gas pipeline or the opening of ANWR, the near term outlook is for
stability to slow growth in the population and employment.
Alaska’s average monthly job count grew by 2,400 in 2008, an increase of 0.7%. It was
the state’s 21st consecutive year of growth, a streak only four other states can match or
exceed. But the nation and world are in economic turmoil heading into 2009 and there
are more questions than answers about how Alaska will be affected. The 2009 forecast
is for a loss of 700 jobs, a number that reflects two conclusions. The first is that Alaska
will not completely escape an economic storm that looks like it will get worse before it
gets better. The second is that the state is in a relatively strong position to weather it.5
“Of the 50 states, only Alaska had shown enough growth to delay a declaration of
recession by the end of March. Add the District of Columbia to that list too. But both
were in recession when April ended.”6
While signs indicate that the worst of the recession may be over; Anchorage is one of
only six metropolitan areas across the country that are expected to regain their pre-
recession employment levels by the end of 2009.7
5 Dan Robinson, Economist in Alaska Economic Trends (January 2009).
6 "Housing starts beat last year's level in cities from Olympia to Palm Coast" by Bill Dedman, Investigative
Reporter, msnbc.com, June 18, 2009.
7 Global Insight in the Anchorage Daily News, June 14, 2009.

Black-Smith, Bethard and Carlson LLC. 15
Anchorage Economy 2009 Year End Report 8
The end of the year report for 2009 indicated slight job losses for 2009 as Anchorage
was dragged into the national recession. All speakers agreed that Anchorage was
better off than most of the country, but the forecast for 2010 is a 1% decline in
employment, which is the benchmark for economic stability.
Excerpts from Alaska Economic Trends January 2010
Alaska’s 21-year streak of job growth ended in 2009. But the recession that
began in late 2007 and probably ended sometime in the fall of 2009 has been
especially severe and none of the 50 states escaped the downturn – including the
four other Western states that also had growth streaks of at least 21 years:
Montana, New Mexico, North Dakota and Wyoming.
Looking forward, there’s considerably less economic uncertainty than there was
a year ago, at least on the national and international scenes. The turmoil that
began in the United States and spread throughout much of the world in the last
two years has calmed considerably, though not completely. Largely as a result,
the 2010 forecast for Alaska is for a loss of 1,400 jobs, a slightly smaller number
than the 2,100 jobs the state lost in 2009. The smaller decline in 2010 is based
on the paired conclusions that broad national and global influences were
primarily responsible for the state’s job losses in 2009 and that improving
economic conditions for the U.S. and world economies will also improve Alaska’s
job situation in 2010.
Aside from those broad conclusions, though, it’s important to acknowledge that
this forecast is based on the somewhat precarious assumption that no large
changes will occur to either employment or prices in Alaska’s all-important oil
and gas industry in 2010.
8 BOMA Annual Economic Forecast Luncheon, 1-8-10
Black-Smith, Bethard and Carlson LLC. 16
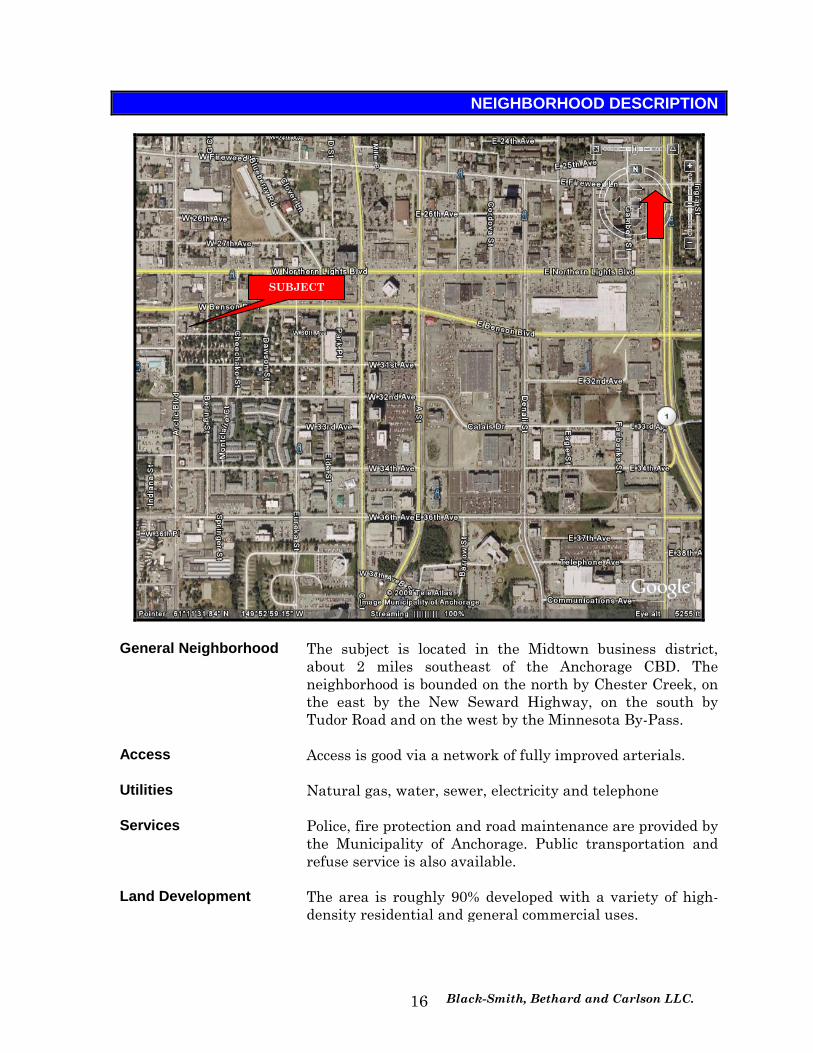
NEIGHBORHOOD DESCRIPTION
General Neighborhood The subject is located in the Midtown business district,
about 2 miles southeast of the Anchorage CBD. The
neighborhood is bounded on the north by Chester Creek, on
the east by the New Seward Highway, on the south by
Tudor Road and on the west by the Minnesota By-Pass.
Access Access is good via a network of fully improved arterials.
Utilities Natural gas, water, sewer, electricity and telephone
Services Police, fire protection and road maintenance are provided by
the Municipality of Anchorage. Public transportation and
refuse service is also available.
Land Development The area is roughly 90% developed with a variety of high-
density residential and general commercial uses.
SUBJECT

Black-Smith, Bethard and Carlson LLC. 17
Life Cycle Stable to slight growth
Proximity The area is near schools, shopping and employment.
Positive/Negative Externalities
The area is centrally located with good access to the
Anchorage Bowl. The area includes commercial, high-
density residential and single-family uses originally
developed in the 1960s and 1970s.
Northern Lights and Benson Boulevards and “A” and “C” Street provide primary access
to the immediate neighborhood. The subject fronts Arctic Boulevard and the following
and most recent traffic map9 (2009) indicates an average daily traffic (ADT) volume of
12,417 in the vicinity of the subject.
Summary
In summary, the neighborhood has all public utilities available, good access, and is
approximately 90% to 95% built-up. The Midtown business district is an active and
desirable area for users and investors.
9 State of Alaska, Department of Transportation and Public Facilities.
SUBJECT

Black-Smith, Bethard and Carlson LLC. 18
SITE DESCRIPTION
Location
The sites are located at the NEC of 30th Avenue and Arctic Boulevard in midtown. The
street address is 2909 Arctic Boulevard, Anchorage, AK.
Shape and Area
The sites are rectangular with the following dimensions and area:
Legal Dimensions Area
Lot 4, Block 5 Northern Lights +/- 147' x 59' 7,350 SF Lot 5A, Block 5 Northern Lights +/- 147' x 100' 14,725 SF
Total 22,075 SF
Topography and Soils
The sites are fairly level and near the grade of the bordering streets. No soils data was
available. The site is improved with a two story office building and the soils appear to
be adequate for the existing use
SUBJECT
Black-Smith, Bethard and Carlson LLC. 19
Access
Lot 5a has access from Arctic Boulevard (2 lane, 2 way, fully improved arterial) and
30th Avenue (two way paved connector street). Lot 4 has access from Arctic Boulevard.
Access is adequate.
Utilities
The sites are served by all public utilities including water, sewer, electricity, natural
gas and telephone.
Flood Hazard Information
Flood Insurance Rate Map Panel 235B of 625 of the Federal Emergency Management
Agency, indicates the property is not situated in a flood plain.
Wetlands Information
According to the Municipality of Anchorage Wetlands Atlas, Map No. 31, the subject is
located outside areas of designated wetlands.
Seismic Information
According to the Harding-Lawson Associates 1979 "Geotechnical Hazard Assessment
Study" the subject is described as having “moderate ground failure susceptibility”. The
location in this seismic zone does not appear to have had an adverse affect on the
subject or general neighborhood based on the surrounding developments.
Environmental Issues
No evidence of possible environmental problems was noted during our inspection. We
are not experts in this field and have assumed that there is no impact on value due to
environmental contaminates.
Easements
As noted on the plat map, easements are generally confined to the perimeter of the sites
with limited impact on value. Zoning
The subject is zoned B-3 (General Business District). The B-3 district is “intended for
general commercial uses in areas exposed to heavy automobile traffic. This district
specifically is intended for areas at or surrounding major arterial intersections where
personal and administrative services, convenience and shopping goods, and automobile-
related services are desirable and appropriate land uses.” The existing use conforms to
the regulations of the B-3 district. Suitability of the Site
The sites are well suited for general commercial uses.
Black-Smith, Bethard and Carlson LLC. 20
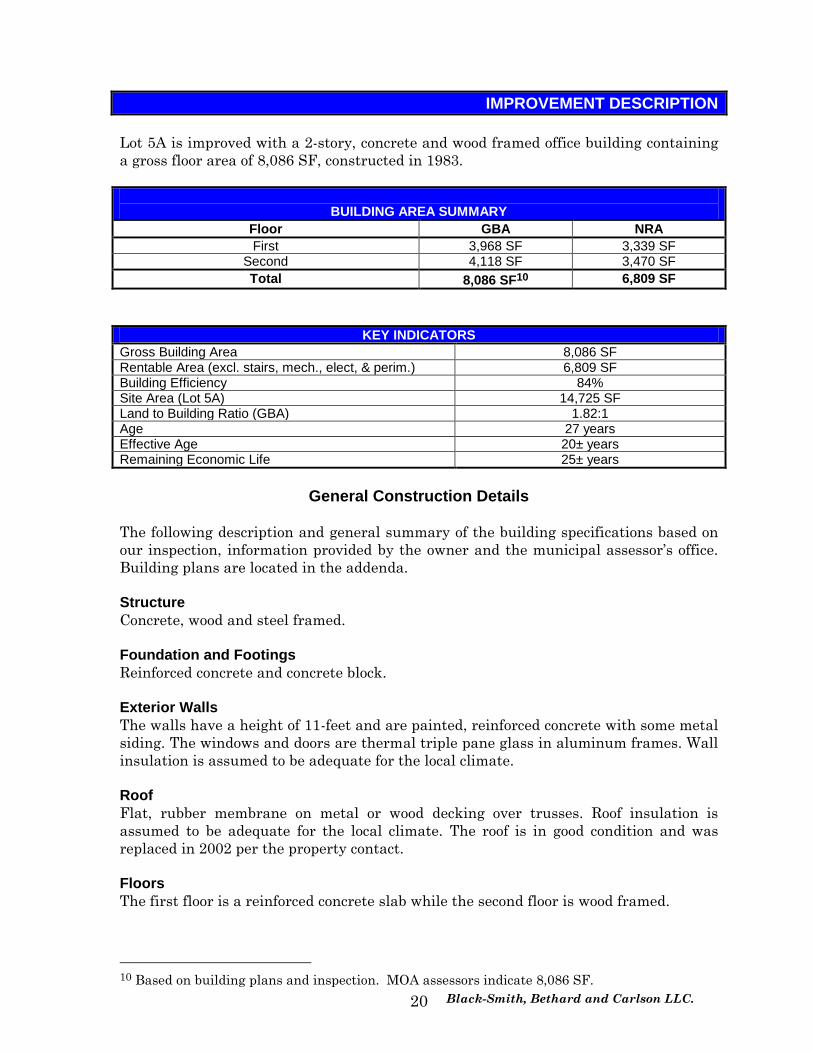
IMPROVEMENT DESCRIPTION
Lot 5A is improved with a 2-story, concrete and wood framed office building containing
a gross floor area of 8,086 SF, constructed in 1983.
BUILDING AREA SUMMARY
Floor GBA NRA
First 3,968 SF 3,339 SF Second 4,118 SF 3,470 SF
Total 8,086 SF10 6,809 SF
KEY INDICATORS
Gross Building Area 8,086 SF Rentable Area (excl. stairs, mech., elect, & perim.) 6,809 SF Building Efficiency 84% Site Area (Lot 5A) 14,725 SF Land to Building Ratio (GBA) 1.82:1 Age 27 years Effective Age 20± years Remaining Economic Life 25± years
General Construction Details
The following description and general summary of the building specifications based on
our inspection, information provided by the owner and the municipal assessor’s office.
Building plans are located in the addenda.
Structure
Concrete, wood and steel framed.
Foundation and Footings
Reinforced concrete and concrete block.
Exterior Walls
The walls have a height of 11-feet and are painted, reinforced concrete with some metal
siding. The windows and doors are thermal triple pane glass in aluminum frames. Wall
insulation is assumed to be adequate for the local climate.
Roof
Flat, rubber membrane on metal or wood decking over trusses. Roof insulation is
assumed to be adequate for the local climate. The roof is in good condition and was
replaced in 2002 per the property contact.
Floors
The first floor is a reinforced concrete slab while the second floor is wood framed.
10 Based on building plans and inspection. MOA assessors indicate 8,086 SF.

Black-Smith, Bethard and Carlson LLC. 21
Interior Finish
The interior walls and partitions are taped, textured and painted sheetrock with wall
paper accents. The ceilings are suspended acoustic tile. The floor covering is a mix of
carpet and tile. The building has been well maintained and the condition is good for the
age.
Mechanical
Heating is provided by a gas-fired, furnace (replaced 1998) and boiler with baseboard
heating. There is also a roof mounted air exchange system. Several window mounted
air conditioning units are noted. Lighting is typical and adequate, with ceiling mounted
florescent fixtures throughout. There are security cameras and a back up roof mounted
generator for emergency lighting. Each suite is individually metered for electricity.
The each floor contains two 3-fixture, restrooms. Janitor's closets have utility sinks
and double sinks are located in the break rooms. The building is not sprinklered.
There is a no elevator.
Suitability
The improvements are well suited for continued office use.
Compliance with Americans with Disabilities Act (ADA)
The Americans with Disabilities Act (ADA) became effective on January 26, 1992 and
the subject was constructed in 1983. Regardless, a determination of compliance is
outside our area of expertise. The value estimate reflects no financial impact on value
due to any ADA non-compliance.
Parking
The subject is required to have 27 parking spaces for its office use.11 A parking plan
was not provided, but there appears to be adequate parking on Lot 5A as a stand alone
site. The parking is paved and landscaping is typical. There is a pole sign located along
Arctic Boulevard and West 30th Avenue. Lot 4 is paved and used for parking, but it is
not required.
11 Based on MOA reported GBA of 8,086, only 25 spaces are required.
Black-Smith, Bethard and Carlson LLC. 22
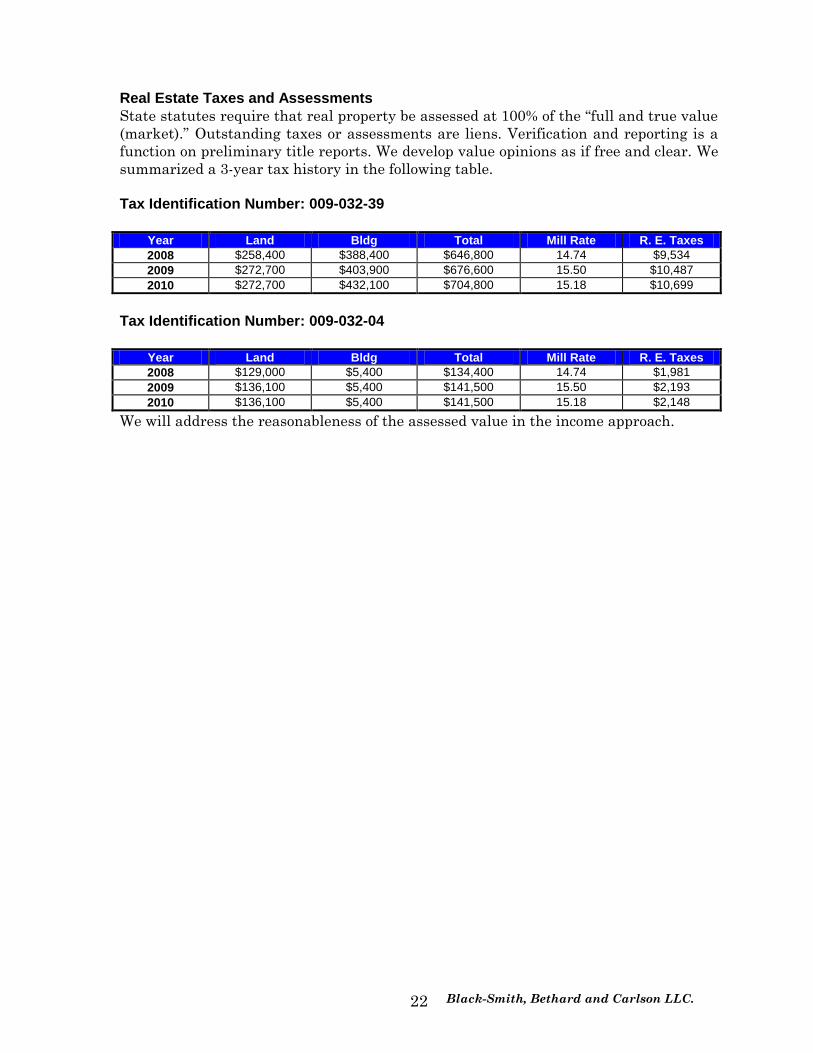
Real Estate Taxes and Assessments
State statutes require that real property be assessed at 100% of the “full and true value
(market).” Outstanding taxes or assessments are liens. Verification and reporting is a
function on preliminary title reports. We develop value opinions as if free and clear. We
summarized a 3-year tax history in the following table.
Tax Identification Number: 009-032-39
Year Land Bldg Total Mill Rate R. E. Taxes
2008 $258,400 $388,400 $646,800 14.74 $9,534
2009 $272,700 $403,900 $676,600 15.50 $10,487
2010 $272,700 $432,100 $704,800 15.18 $10,699
Tax Identification Number: 009-032-04
Year Land Bldg Total Mill Rate R. E. Taxes
2008 $129,000 $5,400 $134,400 14.74 $1,981
2009 $136,100 $5,400 $141,500 15.50 $2,193
2010 $136,100 $5,400 $141,500 15.18 $2,148
We will address the reasonableness of the assessed value in the income approach.
Black-Smith, Bethard and Carlson LLC. 23
MARKET ANALYSIS
The Appraisal Institute recognizes two categories of market analysis: inferred and
fundamental. Because the subject is an existing, conventional property type in a stable
market, a lower level of analysis is appropriate. In the following overview demand is
inferred from general market conditions and the available data.
Commercial Land
For more than a decade, local market conditions have not supported speculative
development of most commercial property types. Nearly all of the activity has been
attributable to users. An expansion by regional and national chains continues to
generate demand for strategic sites, both pad sites and stand-alone locations.12
Numerous special purpose facilities have been recently completed, are currently under
construction, or proposed. The available data indicates that:
The market recognizes a price-per-square-foot unit of comparison;
Prices have been trending upward;
Sites containing less than two acres have a market advantage;
Anchored out-lots command a premium over stand-alone sites; and,
Terms are typically cash and a market exposure period of one year is not
unreasonable Summary
Demand for commercial land is down over the last several years, but there is a limited
supply of high exposure sites and prices are stable. Recent sales typically reflect cash
transactions or seller-financed transactions equivalent to cash. The historic data
indicates that market exposure periods typically average less than one year. Given
current market conditions, a marketing period of up to one year is not an unreasonable
expectation for properties professionally marketed at supportable prices.
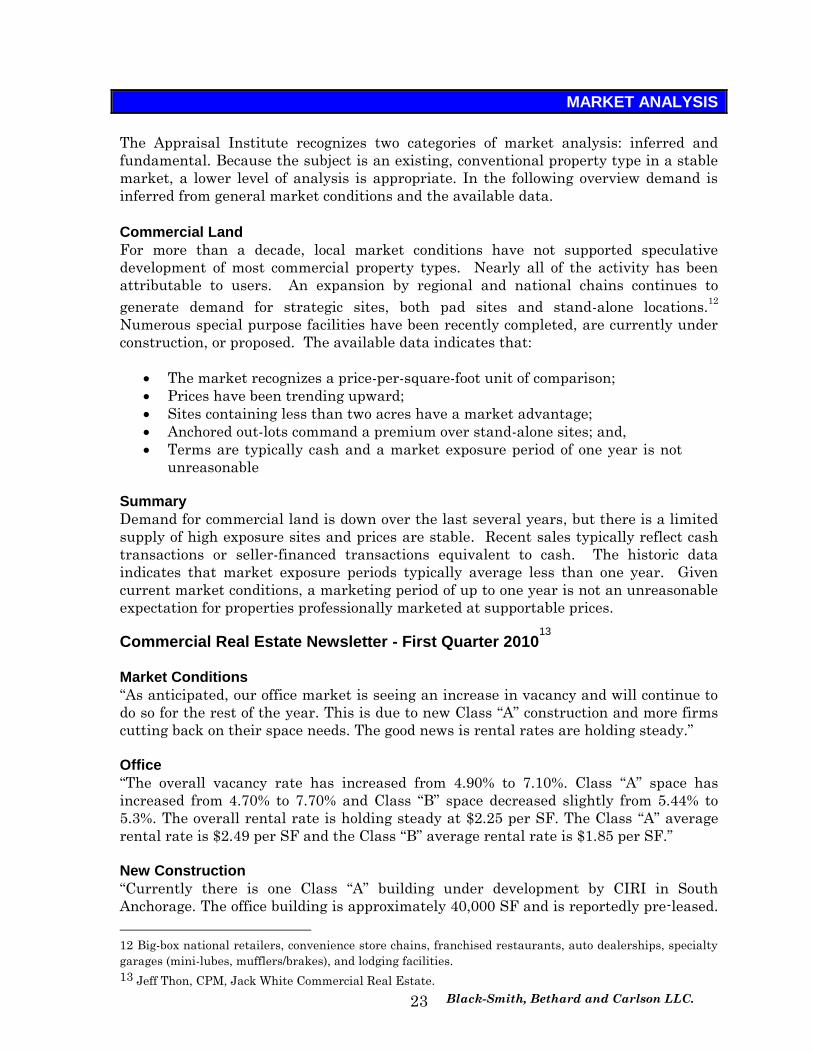
Commercial Real Estate Newsletter - First Quarter 201013
Market Conditions
“As anticipated, our office market is seeing an increase in vacancy and will continue to
do so for the rest of the year. This is due to new Class “A” construction and more firms
cutting back on their space needs. The good news is rental rates are holding steady.”
Office
“The overall vacancy rate has increased from 4.90% to 7.10%. Class “A” space has
increased from 4.70% to 7.70% and Class “B” space decreased slightly from 5.44% to
5.3%. The overall rental rate is holding steady at $2.25 per SF. The Class “A” average
rental rate is $2.49 per SF and the Class “B” average rental rate is $1.85 per SF.”
New Construction
“Currently there is one Class “A” building under development by CIRI in South
Anchorage. The office building is approximately 40,000 SF and is reportedly pre-leased.
12 Big-box national retailers, convenience store chains, franchised restaurants, auto dealerships, specialty
garages (mini-lubes, mufflers/brakes), and lodging facilities.
13 Jeff Thon, CPM, Jack White Commercial Real Estate.
Black-Smith, Bethard and Carlson LLC. 24
Delivery is scheduled for early 2011. At this time there are no new speculative
buildings being considered for construction in 2010. Since the 2009 year end survey, JL
Properties completed and opened Centerpoint West, a 200,000 SF office building in
Midtown. Roughly 50% of the building is available for lease at this time.”
Commercial Real Estate Newsletter - Second Quarter 201014
Market Conditions
“As anticipated, our office market continues to see an increase in vacancy and will
continue to do so for the rest of the year. This is due to new Class “A” construction and
more firms cutting back on their space needs. The good news is rental rates are holding
steady.”
Office
“The overall vacancy rate has increased from 7.10% to 7.76%. Class “A” space has
increased from 7.70% to 8.12% and Class “B” space increased from 5.30% to 6.61%. The
overall rental rate is holding steady at $2.29 per SF. The Class “A” average rental rate
is $2.55 per SF and the Class “B” average rental rate is $1.88 per SF.”
New Construction
“At this time the only proposed new construction (non-medical) is the 100,000 SF
addition to the Anchorage Native Tribal Health Consortium at Tudor Centre. This will
add to vacancy rates as they consolidate from different locations.”
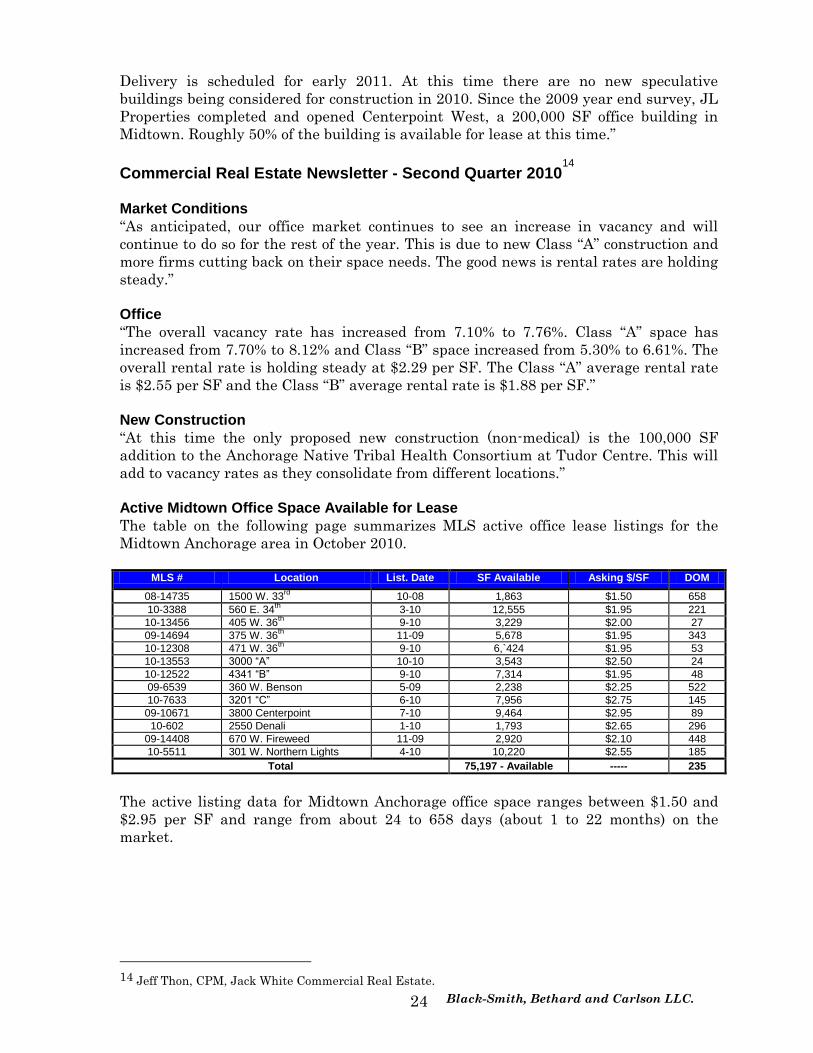
Active Midtown Office Space Available for Lease
The table on the following page summarizes MLS active office lease listings for the
Midtown Anchorage area in October 2010.
MLS # Location List. Date SF Available Asking $/SF DOM
08-14735 1500 W. 33rd
10-08 1,863 $1.50 658
10-3388 560 E. 34th
3-10 12,555 $1.95 221
10-13456 405 W. 36th
9-10 3,229 $2.00 27
09-14694 375 W. 36th
11-09 5,678 $1.95 343
10-12308 471 W. 36th
9-10 6,`424 $1.95 53
10-13553 3000 “A” 10-10 3,543 $2.50 24
10-12522 4341 “B” 9-10 7,314 $1.95 48
09-6539 360 W. Benson 5-09 2,238 $2.25 522
10-7633 3201 “C” 6-10 7,956 $2.75 145
09-10671 3800 Centerpoint 7-10 9,464 $2.95 89
10-602 2550 Denali 1-10 1,793 $2.65 296
09-14408 670 W. Fireweed 11-09 2,920 $2.10 448
10-5511 301 W. Northern Lights 4-10 10,220 $2.55 185
Total 75,197 - Available ----- 235
The active listing data for Midtown Anchorage office space ranges between $1.50 and
$2.95 per SF and range from about 24 to 658 days (about 1 to 22 months) on the
market.
14 Jeff Thon, CPM, Jack White Commercial Real Estate.
Black-Smith, Bethard and Carlson LLC. 25
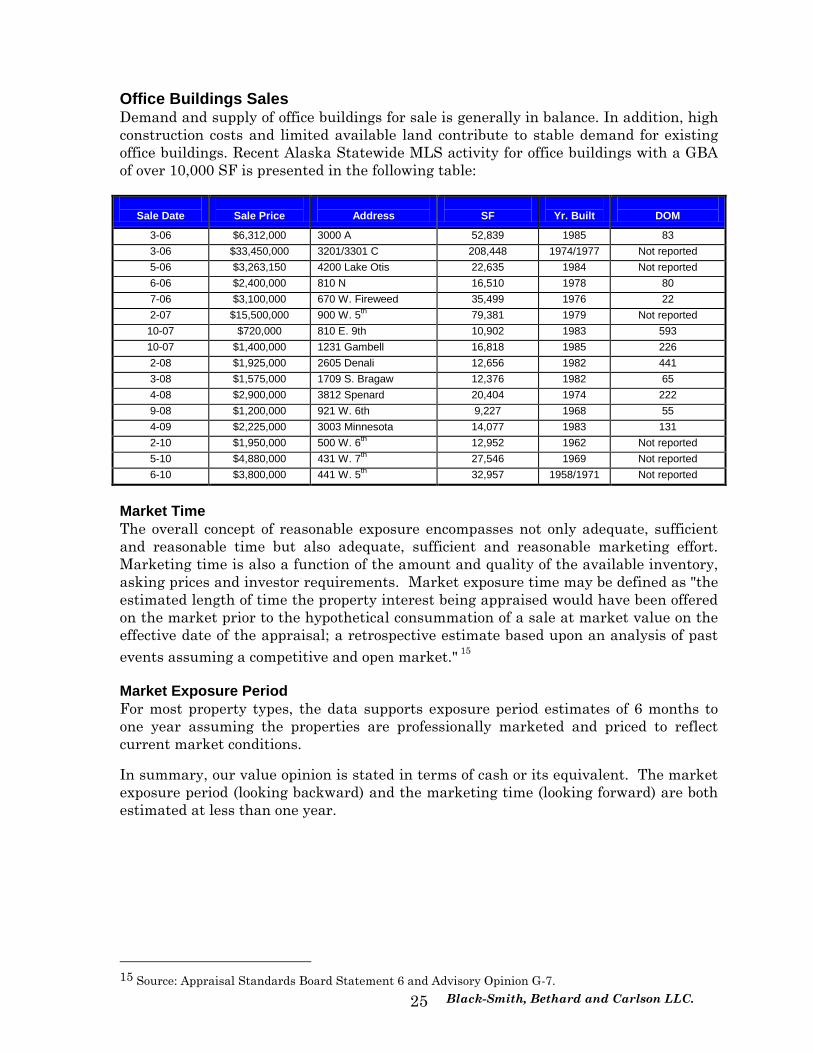
Office Buildings Sales
Demand and supply of office buildings for sale is generally in balance. In addition, high
construction costs and limited available land contribute to stable demand for existing
office buildings. Recent Alaska Statewide MLS activity for office buildings with a GBA
of over 10,000 SF is presented in the following table:
Sale Date
Sale Price
Address
SF
Yr. Built
DOM
3-06 $6,312,000 3000 A 52,839 1985 83
3-06 $33,450,000 3201/3301 C 208,448 1974/1977 Not reported
5-06 $3,263,150 4200 Lake Otis 22,635 1984 Not reported
6-06 $2,400,000 810 N 16,510 1978 80
7-06 $3,100,000 670 W. Fireweed 35,499 1976 22
2-07 $15,500,000 900 W. 5th
79,381 1979 Not reported
10-07 $720,000 810 E. 9th 10,902 1983 593
10-07 $1,400,000 1231 Gambell 16,818 1985 226
2-08 $1,925,000 2605 Denali 12,656 1982 441
3-08 $1,575,000 1709 S. Bragaw 12,376 1982 65
4-08 $2,900,000 3812 Spenard 20,404 1974 222
9-08 $1,200,000 921 W. 6th 9,227 1968 55
4-09 $2,225,000 3003 Minnesota 14,077 1983 131
2-10 $1,950,000 500 W. 6th
12,952 1962 Not reported
5-10 $4,880,000 431 W. 7th
27,546 1969 Not reported
6-10 $3,800,000 441 W. 5th
32,957 1958/1971 Not reported
Market Time
The overall concept of reasonable exposure encompasses not only adequate, sufficient
and reasonable time but also adequate, sufficient and reasonable marketing effort.
Marketing time is also a function of the amount and quality of the available inventory,
asking prices and investor requirements. Market exposure time may be defined as "the
estimated length of time the property interest being appraised would have been offered
on the market prior to the hypothetical consummation of a sale at market value on the
effective date of the appraisal; a retrospective estimate based upon an analysis of past
events assuming a competitive and open market." 15
Market Exposure Period
For most property types, the data supports exposure period estimates of 6 months to
one year assuming the properties are professionally marketed and priced to reflect
current market conditions.
In summary, our value opinion is stated in terms of cash or its equivalent. The market
exposure period (looking backward) and the marketing time (looking forward) are both
estimated at less than one year.
15 Source: Appraisal Standards Board Statement 6 and Advisory Opinion G-7.

Black-Smith, Bethard and Carlson LLC. 26
HIGHEST AND BEST USE
Highest and Best Use is defined in the Twelfth Edition of the Appraisal of Real Estate,
Appraisal Institute, as:
"The reasonably probable and legal use of vacant land or improved property,
which is physically possible, appropriately supported, financially feasible, and
that results in the highest value."
Highest and Best Use "As Vacant"
Possible Use
The sites are located in midtown Anchorage, contain 22,075 SF, are level and are
served by all public utilities. Access is adequate and the soils appear suitable for
construction. The sites could be developed with almost any legal use permitted under
the B-3 zoning classifications.
Permissible Use [Legal]
Legal restrictions, as they apply to the subject, include easements and the public
restrictions of zoning, as included in Title 21 of the Anchorage Municipal Code "Land
Use Regulations." The subject is zoned B-3 (General Business District) The B-3 district
is “intended for general commercial uses in areas exposed to heavy automobile traffic.
This district specifically is intended for areas at or surrounding major arterial
intersections where personal and administrative services, convenience and shopping
goods, and automobile-related services are desirable and appropriate land uses.” The
existing use conforms to the regulations of the current zoning classifications.
Financially Feasible Uses
The subject is well-suited for commercial development. The high-traffic location with
adequate road frontage and neighborhood characteristics suggests office type uses. The
market is driven by user specific developments but speculative projects have proven
feasible in high exposure locations. Given current market conditions and the national
economy, speculative development is not likely at this time. As of the date of valuation,
the highest and use is speculation.
Maximally Productive Use
The market for suitable sites is driven by a number of uses with a variety of
requirements. As such, the maximally productive use cannot be determined. In
summary, the highest and best use as-vacant, is for speculation or owner/user
commercial.
Highest and Best Use "As Vacant"
The subject's highest and best use as-vacant, is for speculation or owner/user
commercial.
Highest and Best Use “As Improved”
Lot 5A is developed with an average quality office constructed in 1983. The building has
a long term remaining life and provides a positive return to the property. The highest
and best use “as improved” is as developed. Lot 4 is not required for parking and is
marketable excess.

Black-Smith, Bethard and Carlson LLC. 27
LAND VALUTAION
“Sales comparison is the most common technique for valuing land and it is the
preferred method when comparable sales are available”.16 Sales of similar properties
are correlated to the subject by adjusting for various inequalities on an item-by-item
basis. Elements of comparison include:
real property rights
financing terms
conditions of sale (motivation)
expenditures immediately after sale
non-realty components
market conditions (sale date)
physical characteristics
- location
- access
- soils and topography
- size
- shape
SUMMARY OF COMPARABLE LAND SALES
Properties selected for comparison are contained in the following table:
COMPARISON LAND DATA
No. Location Zoning SF Sale Date Sale Price $/SF
1 1001 W. 29th Ave. B-3 18,750 5-07 $460,000 $24.53
2 NWC Old Seward HW & E. Int. Airport Rd. B-3 30,000 10-07 $750,000 $25.00
3 2905 Arctic Boulevard B-3 17,893 6-10 $530,000 $29.62
4 1975 Abbott Rd. B-3 24,998 7-09 $677,246 $27.09
SUBJECT (Lo4, Block 5 Northern Lights Sub) B-3 7,375 n/a n/a n/a
16 Appraisal Institute, The Appraisal of Real Estate, Eleventh Edition
Black-Smith, Bethard and Carlson LLC. 28
DESCRIPTION OF COMPARABLES
The comparables are identified in the previous table and on the map. The sales selected
for comparison are considered to be the best data available. This is a summary report;
details are contained our work file. We are aware of the dated Carl's Jr. sale that is
proximate to the subject at $27/SF in 2003. The sale was excluded due to date. We are
also aware of the car wash sale at 2301 5th Avenue for $30/SF. This 2008 sale was
influenced by a motivated purchaser.
CORRELATION
All of the comparables reflect arm’s length transactions of the fee simple interest. No
undue stimulus was reported. The indicated unit prices are already adjusted to a cash
equivalent value (if required) and/or expenditures immediately after sale (e.g.,
demolition, curable defects/deficiencies).
Quantitative Adjustments Market Conditions
While a general upward trend in market prices is evident, a universal appreciation rate
is not applicable to all submarkets. More importantly, the market softened and prices
stabilized. We did not apply a quantitative adjustment for time. The impact of market
conditions is recognized in the final reconciliation.
Size
There is no quantifiable relationship between size and price in the comparable data
analyzed. Generally, smaller sites sell for higher unit values.
Soils
The subject and comparison properties reportedly have adequate soils and no
adjustment is required. Factors such as location, access and exposure outweigh slight
differences in soils for developable sites.
Qualitative Adjustments A sufficient number of paired-sales are not available from which to extract reliable
adjustments for other inequalities. We correlated physical inequalities with qualitative
adjustments (superior, inferior, approximately equal).
Comparative Analysis
We have correlated the comparables to the subject in a qualitative analysis described
by the Appraisal of Real Estate, 12th Edition, as a “Relative Comparison Analysis.” In
this analysis, various features and characteristics are perceived as comparable /
approximately equal, superior of inferior. An overall net adjustment based on the
appraiser’s perception is indicated in terms of “positive” or “negative”. This technique
illustrates the relative market position of the subject.
The relative comparison analysis grid is presented on the following page.

Black-Smith, Bethard and Carlson LLC. 29
Relative Comparison Analysis
Comp. No. SUBJECT No. 1 No. 2 No. 3 No. 4
$/SF ---- $24.53 $25.00 $29.62 $27.09
Sale Date (market conditions)
----- 5-07
No adj.
10-07
No adj.
6-10 7-09
No adj.
Adj. $/SF NA $24.53 $25.00 $29.62 $27.09
Location/ Use
Arctic Blvd. Comm.
29th Ave Comm.
(inferior)
Old Seward & International/
Comm. (approx.=)
Arctic/Benson Comm.
(approx.=)
Abbott Rd. Comm.
(approx.=)
Utilities All available
All available
(approx.=)
All available (approx.=)
All available (approx.=)
All available
(approx.=)
Corner No No (equal)
Yes/Major (superior)
Yes/Major (superior)
Yes/Minor (superior)
Zoning B-3 B-3 (approx.=)
B-3 (approx.=)
B-3 (approx.=)
B-3 (approx.=)
SF 7,350 18,750 (larger)
30,000 (larger)
17,893 (larger)
24,998 (larger)
Topography Level at grade
Level at grade
(approx=)
Level at grade
(approx.=)
Level at grade
(approx.=)
Level at grade
(approx.=)
Soils Average Average (approx.=)
Average (approx.=)
Average (approx.=)
Average (approx.=)
Other Typical Typical (approx.=)
Typical (approx.=)
Bisecting Esmt. (inferior)
Typical (approx.=)
Access/Exposure ADT
Arctic, 1-way 12,417- Arctic
29th Ave. N/A
(inferior)
Old Seward & International
1-way in & out 20,146
(superior)
Benson, 1-way; Arctic, 1-way
22,702- Benson 12,417- Arctic
(superior)
Abbott Rd. shared drive with credit
union 21,219 - Abbott
(superior)
Ind. $/SF ---- >$24.53 <$25.00 <$29.62 <$27.09
Reconciliation
The following table reflects the relative market position of the subject:
Conclusion The analysis generates an overall range of adjusted unit values from $24.53 to $29.62 per
SF. The subject’s market position is bracketed by Comparables No. 1 ($24.53) and
Comparable 2 ($25.00).
Considering the subject's small size, a unit value of $25/SF is considered reasonable.
Market value is calculated as follows:
7,350 SF x $25.00 per SF = $184,000
Estimated Current Land Value, rounded: $184,000
No.
Adj. $/SF
Adjustment
Reconciliation
3 $29.62 Negative Not marketed, purchased by lessee, seller paid closing costs, sup. corner.
4 $27.09 Negative Recent sale in developing retail area, superior traffic count and corner.
2 $25.00 Negative Larger parcel, dated sale, but superior traffic count and corner.
Sub. ---- ----- Small, interior lot on Arctic Boulevard
1 $24.53 Positive Dated sale of larger parcel with inferior exposure.

Black-Smith, Bethard and Carlson LLC. 30
SALES COMPARISION APPROACH
In the sales comparison approach, an opinion of market value is developed by analyzing
similar properties that have recently sold, are listed for sale, or are under contract and
comparing them with the subject property. A major premise of the sales comparison
approach is that the market value of a property is related to the prices of comparable,
competitive properties.17 The properties are typically evaluated in terms of a physical unit
of comparison (e.g., "price per square foot", "price per unit”) and correlated by adjusting for
various inequalities.
For this property type, the market recognizes a price-per-square-foot of gross building area
(GBA), including the land.
The sales selected for comparison are summarized in the following table.
No. Address Date of
Sale Sale Price
Building Area
$/SF GBA
1 610 E. 5th Avenue 12-08 $800,000* 6,000 SF $133
2 1015 E. 6th Avenue 7-10 $1,000,000 8,736 SF $114
3 4111 Minnesota Drive 2010 list $989,000 7,414 SF $133
4 3003 Minnesota Drive 4-09 $2,225,000 14,077 SF $158
Sub. 2909 Arctic Boulevard ----- ----- 8,086 SF ---- *Purchaser intends total renovation and demolition of one structure.
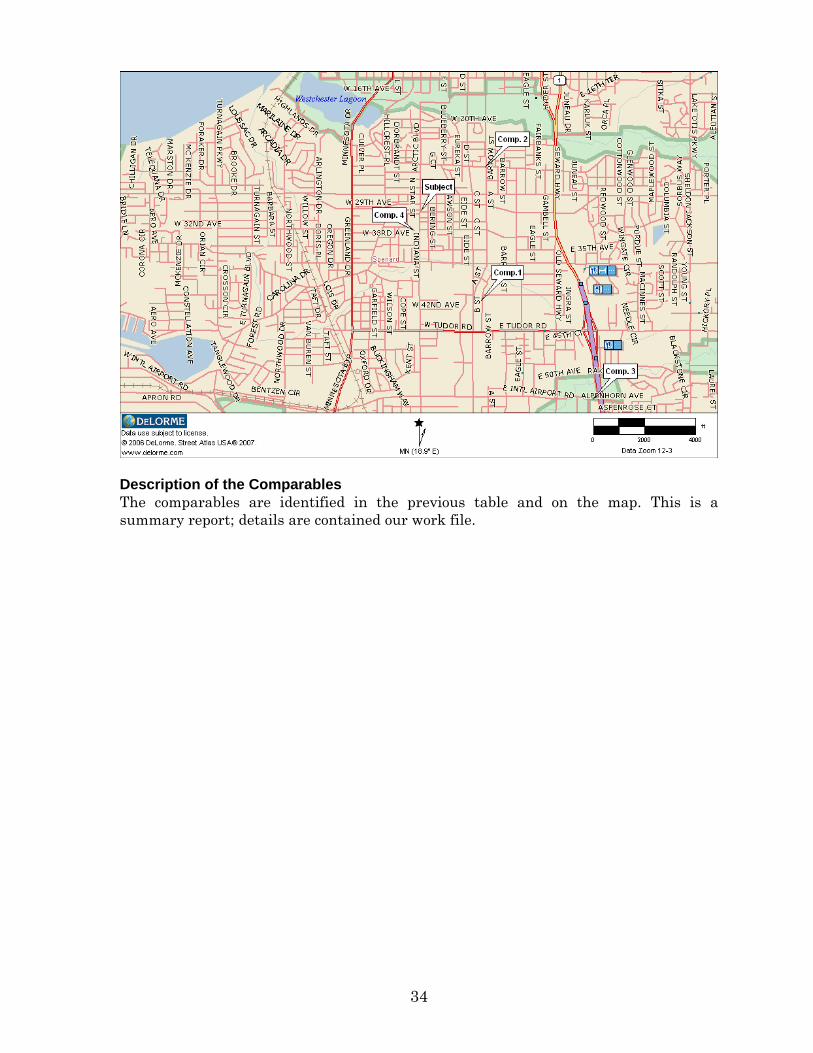
COMPARABLE SALES MAP
17 The Appraisal of Real Estate, 12th Edition, Appraisal Institute (2001) p. 417
Black-Smith, Bethard and Carlson LLC. 31
DESCRIPTION OF THE COMPARABLES
The comparables are identified in the previous table and on the map. The property
characteristics are summarized in the following comparison grid. This is a summary
report; details are retained in the appraiser’s files.
CORRELATION
All of the comparables reflect arm’s length sales/acquisitions of the fee simple or leased fee
interest. No undue stimulus was reported. The indicated unit values are already adjusted
to a cash equivalent value (if required) and/or expenditures immediately after sale (e.g.,
demolition, curable defects/deficiencies).
Adjustments
Market Conditions
The comparables and the date of value bracket a period of just 2 years. A sufficient number
of paired-sales are not available from which to extract a reliable time adjustment. The
market has been relatively flat over the past two years and no adjustment is required.
Sale date is considered in the final reconciliation.
Physical Characteristics
Physical characteristics include location, access, quality, and effective age. However, the
quantity of data is not sufficient to isolate reliable percentage or dollar adjustments. On
that basis, other physical characteristics are correlated with qualitative adjustments (e.g.,
approximately equal, superior, or inferior).

32
Reconciliation
The analysis generates a range from $114 to $158/SF. The relative market position of
the subject is situated between Sales 1 ($133/SF) and 4 ($158/SF). The subject is a well
maintained, average quality, smaller building in midtown. Market value is concluded
towards the upper end of the bracketing range as indicated by Comparable 4, which is
superior for location and overall quality, but larger than the subject. Giving most
weight to Comparable 4, while recognizing that it is slightly superior, market value is
concluded at $155/SF of GBA.
Market value by the sales comparison approach is calculated as follows:
8,086 SF x $155/SF = $1,253,000 (rnd)
Property Subject
2909 Arctic Blvd.
Comp #1 610 E 5th
Ave.
Comp #2 1015 E. 6th
Ave
Comp #3 4111
Minnesota
Comp #4 3003
Minnesota
Sale Price ----- $800,000 $1,000,000 $989,000 $2,225,000
Date of Sale 12-10 10-08 7-10 2010 listing 4-09
Market Cond Adj. None n/a n/a n/a n/a
Adj. Sale Price ----- $800,000 $1,000,000 $989,000 $2,225,000
GBA 8,086 SF 2-story
6,000 SF 2-story
8,736 SF 2-story
7,414 SF 2-story
14,077 SF 2-story, cvrd
prkg
Adjusted $/SF ----- $133 $114 $133 $158
Location Midtown /
Arctic Blvd.
CBD fringe, 5th
slightly inf.
CBD fringe, 6th
slightly inf.
Midtown / Minnesota
slightly sup.
Midtown / Minnesota
slightly sup.
Quality/Type avg concrete, wood & steel
avg cc blk
approx.=
avg stucco / wd frame approx.=
avg cc blk / wd frame
approx.=
avg + steel frame
superior
Age/Condition 1983/good 1976/avg
inferior 1983/avg inferior
1974/avg slightly inferior
1983/good approx. =
Land: Building Ratio
1.82 to 1
1.25 to 1
inferior
1.60 to 1
approx.=
1.79 to 1
approx.=
1.50 to 1, adtl. cov. prkg approx.=
AC no / some
window units no
inferior no
inferior yes
superior yes
superior
Elevator yes no
inferior no
inferior no
inferior yes
approx. =
Sprinkler no
no approx. =
no approx. =
no approx. =
no approx =
Adj. $/SF/GBA ----- >$133 >$114 >$133 <$158

33
INCOME APPROACH
The income capitalization approach to value consists of methods, techniques, and
mathematical procedures that an appraiser uses to analyze a property’s capacity to
generate benefits and convert them into an indication of present value.18 The basis for
this approach is the property operating data (potential income less vacancy and
expenses).
For the purpose of our analysis, NOI is defined as:
"income remaining after deduction of all property expenses including replacement
reserves (if any) and before consideration of leasing commissions and tenant
improvements"19
Contract Rents The following table summarizes the current occupancy of the subject:
SUMMARY OF CONTRACT RENTS
Suite
Floor
Tenant
Date/Term
Current Rent/Mo.
RSF
$/SF/Mo.±
Tenant Exp.
Options / Escalation
101 First CareNet +/- 2009 / 3 yr $1,650 Unk. $1.17 Elec & J n/a
102/3 First Schadt L. Mo/Mo $2,250 Unk. $1.17 Elec & J n/a 200 Second DNH +/- 2009 / 3 yr $4,700 3,470 $1.35 Elec & J n/a Total 2 Story ---- ------ $8,600 6,809 $1.26 Elec & J n/a
The subject's leases were not professionally marketed and were not based on a price per
square foot basis. The rents are below market. Therefore, market rent will be based on
comparable leases.
Market Rent
The subject is Class B/B- office space for the local market. Market rent is adjusted to
reflect a similar expense structure as the subject with tenants responsible for electric
and janitorial.
SUMMARY OF RENTAL COMPARISONS
No.
Location
Date
NRA -SF
Rent/SF/Mo
.
Tenant Exp.
Adj. $/SF.
1 4141 B Street #210 11-10 1,297 $1.75 E & J
--- $1.75
2 121 W Fireweed 8-10 2,261 $1.85 None - $.18
$1.67
3 1225 E International Airport Rd. 7-10 2,100 $1.65 None -$.18
$1.47
4 3330 Arctic Blvd. 2010 list 9,916 $1.60 J
-$.10 $1.50
E= Elec ($.08), J= Janitorial ($.10)20
18 The Appraisal of Real Estate, 12th Edition, Appraisal Institute (2001) p. 472
19 Korpacz Real Estate Investor Survey 20 BBC 09-117
34
Description of the Comparables
The comparables are identified in the previous table and on the map. This is a
summary report; details are contained our work file.

Black-Smith, Bethard and Carlson LLC. 35
SUMMARY OF RENTAL COMPARISONS
Comp. Subject No. 1 No. 2 No. 3 No. 4
Address 2909 Arctic Blvd. 4141 B Street #210 121 W Fireweed
1225 E International Airport Rd.
3330 Arctic Blvd.
Lease Date
Various below market leases
11-10 8-10 7-10 2010 list
Lease Rate (Rentable)
---- $1.75 $1.67 $1.47 $1.50
Tenant Expenses
E & J E & J adj. abv.
None adj. abv.
None adj. abv.
J adj. abv.
Year Built 1983 1984 (approx.=)
1967 (inferior)
1982 (approx.=)
1979 (inferior)
Quality/ Condition
Avg./Good Avg/Good (approx.=)
Avg/Good (approx.=)
Avg./ Avg. (inferior)
Avg./ Avg. (inferior)
Constr. concrete block, steel and wood
Steel & wood frame
(approx. =)
Wood frame
(inferior)
Wood frame
(inferior)
Wood frame
(inferior)
SF Area (Rentable)
6,809 SF
1,297 SF 2,261 SF 2,100 SF 9,916 SF
Elevator No Yes (superior)
No (approx. =)
No (approx. =)
No (approx. =)
AC No / some window units
Yes (superior)
Yes (superior)
Yes (superior)
No (approx. =)
Location Midtown North of Midtown (approx. =)
Midtown (approx. =)
Midtown (approx. =)
Midtown (approx. =)
On-site parking
Adequate Adequate (approx. =)
Adequate (approx. =)
Adequate (approx. =)
Adequate (approx. =)
Adjusted Rent/SF
----- $1.75 $1.67 $1.47 $1.50
Conclusion Market Rent
The following table reflects the relative market position of the subject:
The subject’s relative market position is situated towards the top of the comparable
range between Comp 2 ($1.67/SF) and Comp. 1 ($1.75/SF). Giving most weight to these
comparables market rent is concluded at $1.70/SF, plus electric and janitorial.
6,809 SF @ $1.70/SF x 12 = $138,904
Projected Gross Annual Rental Income: $138,904
No. Adj. $/SF Adjustment Reconciliation
1 $1.75 Approx. = Similar age quality/condition, slightly superior AC/Elv
Subject --- ------ Good condition midtown building
2 $1.67 Approx. = Inferior for age and construction type, off set by AC/Elv
4 $1.50 Positive Inferior quality condition
3 $1.47 Positive Inferior for quality/condition and age
Black-Smith, Bethard and Carlson LLC. 36
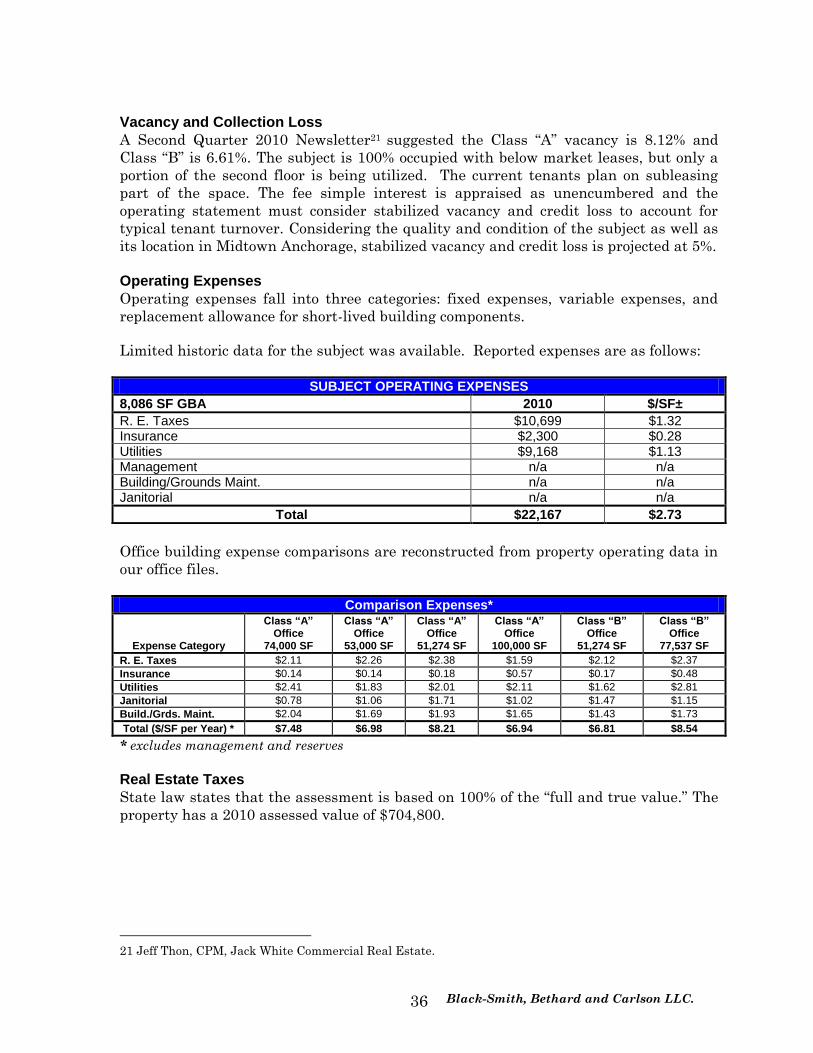
Vacancy and Collection Loss
A Second Quarter 2010 Newsletter21 suggested the Class “A” vacancy is 8.12% and
Class “B” is 6.61%. The subject is 100% occupied with below market leases, but only a
portion of the second floor is being utilized. The current tenants plan on subleasing
part of the space. The fee simple interest is appraised as unencumbered and the
operating statement must consider stabilized vacancy and credit loss to account for
typical tenant turnover. Considering the quality and condition of the subject as well as
its location in Midtown Anchorage, stabilized vacancy and credit loss is projected at 5%.
Operating Expenses
Operating expenses fall into three categories: fixed expenses, variable expenses, and
replacement allowance for short-lived building components.
Limited historic data for the subject was available. Reported expenses are as follows:
SUBJECT OPERATING EXPENSES
8,086 SF GBA 2010 $/SF±
R. E. Taxes $10,699 $1.32 Insurance $2,300 $0.28 Utilities $9,168 $1.13 Management n/a n/a Building/Grounds Maint. n/a n/a Janitorial n/a n/a
Total $22,167 $2.73
Office building expense comparisons are reconstructed from property operating data in
our office files.
Comparison Expenses*
Expense Category
Class “A” Office
74,000 SF
Class “A” Office
53,000 SF
Class “A” Office
51,274 SF
Class “A” Office
100,000 SF
Class “B” Office
51,274 SF
Class “B” Office
77,537 SF
R. E. Taxes $2.11 $2.26 $2.38 $1.59 $2.12 $2.37
Insurance $0.14 $0.14 $0.18 $0.57 $0.17 $0.48
Utilities $2.41 $1.83 $2.01 $2.11 $1.62 $2.81
Janitorial $0.78 $1.06 $1.71 $1.02 $1.47 $1.15
Build./Grds. Maint. $2.04 $1.69 $1.93 $1.65 $1.43 $1.73
Total ($/SF per Year) * $7.48 $6.98 $8.21 $6.94 $6.81 $8.54
* excludes management and reserves
Real Estate Taxes
State law states that the assessment is based on 100% of the “full and true value.” The
property has a 2010 assessed value of $704,800.
21 Jeff Thon, CPM, Jack White Commercial Real Estate.

Black-Smith, Bethard and Carlson LLC. 37
The following table contains a summary of the 2010 building assessed values for several
Midtown Anchorage office properties:
Location 2010 Assessed Value GBA Year Built $/SF of GBA
3003 Minnesota $2,257,100 14,077 1983 $160
1015 E 6th Ave $790,600 8,736 1983 $90
3380 “C” St. $2,190,400 17,900 SF 1972 $122
Subject $704,800 8,086 SF 1983 $95
The office properties reflect a range of assessed values from about $90 to $160/SF. The
subject assessed value is about $95/SF of GBA and is at the low end of the range, but
supported by the data. The projected annual taxes, based on the assessed value of
$704,800 and a mill rate of 15.18, are $10,699.
Insurance
The subject insurance premium averaged $0.28/SF. The comparables range from
$.14/SF to $.57/SF. The subject is a concrete block, steel and wood building with no
sprinkler system. The subject’s historic data is within the range and is given most
weight. Insurance expenses are projected at $.30/SF.
Utilities
The subject utility expense were reported at $1.13/SF. Recognizing that local utility
costs have increased over the past few years and water / waste water utilities are
projecting increases over the next five years, a slightly higher estimate is appropriate.
The comparables range from $1.62 to over $2.00/SF, but include electric expenses.
Considering the subject expense structure, with tenant paid electric, we have estimated
utility expenses at $1.25/SF to recognize projected increases.
Janitorial
Janitorial expenses are projected as a tenant expense. Any minor common area
janitorial is assumed to be covered with typical maintenance.
Management/General Administration, legal and professional Fees
Management fees vary with a project size and number of tenants. Rates for
management fees typically vary from 3% to 7% of effective gross annual income,
depending on the size of a project and amount of work required. Considering the small
size of the subject, we have estimated total management fees, inclusive of
administration expenses, towards the low end of the range, or 3% of effective gross
income.
Building and Grounds Maintenance
Maintenance is difficult to estimate with any degree of precision as this expense item
varies widely from property to property and year-to-year, which is attributable to
differing ownership/management philosophies and accounting methods. In addition,
this expense category is often a 'catch all' for items, which could be funded within the
scope of a reserve account or tenant improvements. The expense comparison data
reflected maintenance and repair costs ranging from $1.43 to $3.66 per SF per year of
GBA. Excluding capital expenditures, we have given most weight to the low end of the
comparable range and this expense is projected at $1.50/SF.

Black-Smith, Bethard and Carlson LLC. 38
Replacement Reserves
The 3rd Quarter 2010 issue of Korpacz Real Estate Investor Survey indicates
replacement reserves for suburban office properties range from $0.15 to $0.50 per SF
with an average of $0.28 per SF. Replacement costs are higher in Anchorage than most
other locales. Using the average indicator for office use and adjusting it upward by a
local cost multiplier; we project replacement reserves at $0.36 per SF ($0.28 per SF x
1.27, rounded)22 of the GBA.
The projected operating statement is presented as follows:
PROJECTED OPERATING STATEMENT -FEE SIMPLE
GBA 8,086 $/SF± PGAI/Mo.± PGAI/Yr
NRA 6,809 $1.70 $11,575.30 $138,904
Projected Gross Annual Rental Income $138,904
Less: Vacancy & Collection Loss 5% ($6,945.18)
Effective Gross Income $131,958
Expenses $/SF GBA± $/Year
R. E. Taxes $1.32 $10,699
Insurance $0.30 $2,426
Utilities $1.25 $10,108
Janitorial $0.00 $0
Management 3% $3,959
Building/Grounds Maintenance $1.50 $12,129
Reserves $0.36 $2,911
Total Estimated Operating Expenses $5.22 $/SF of GBA ($42,231)
32% of EGI
Projected Stabilized NOI $89,727
Income Capitalization
The value of the subject at stabilized occupancy is derived by direct capitalization.
With this technique, the net operating income (NOI) is divided by a market-supported
overall capitalization rate (OAR) to indicate a value.
22 The Marshall Valuation local cost multiplier for Anchorage, October 2010.
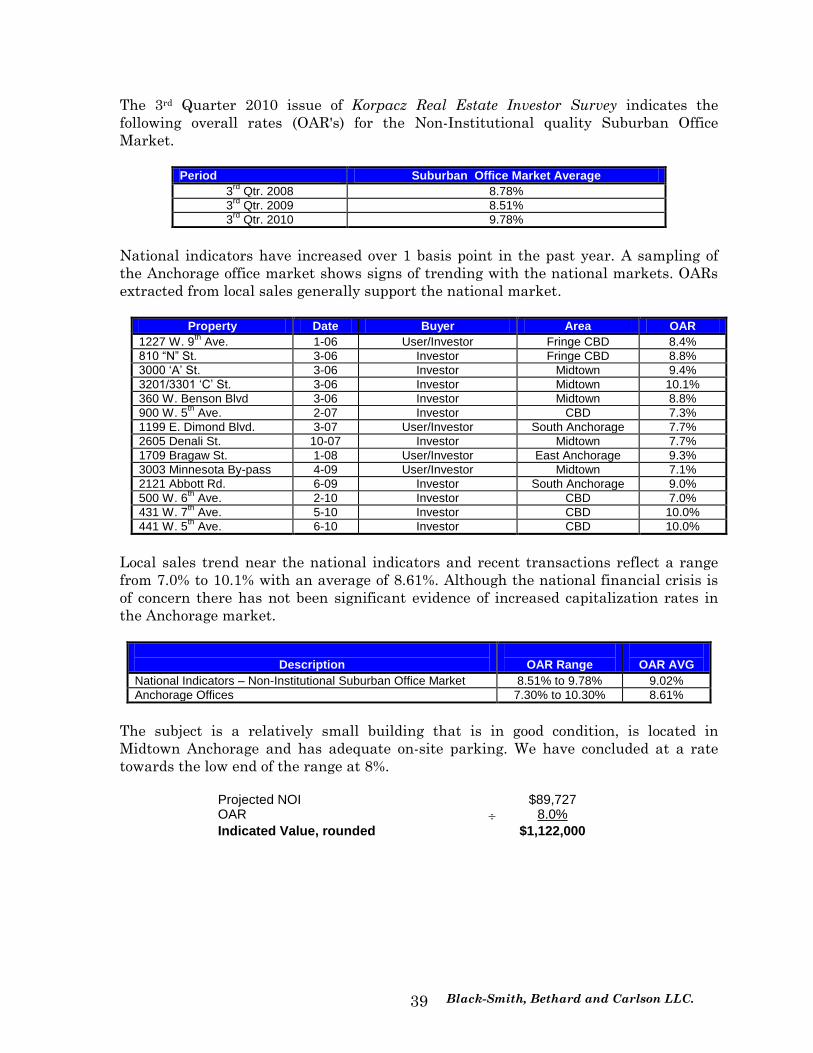
Black-Smith, Bethard and Carlson LLC. 39
The 3rd Quarter 2010 issue of Korpacz Real Estate Investor Survey indicates the
following overall rates (OAR's) for the Non-Institutional quality Suburban Office
Market.
Period Suburban Office Market Average
3rd
Qtr. 2008 8.78%
3rd
Qtr. 2009 8.51%
3rd
Qtr. 2010 9.78%
National indicators have increased over 1 basis point in the past year. A sampling of
the Anchorage office market shows signs of trending with the national markets. OARs
extracted from local sales generally support the national market.
Property Date Buyer Area OAR
1227 W. 9th
Ave. 1-06 User/Investor Fringe CBD 8.4%
810 “N” St. 3-06 Investor Fringe CBD 8.8%
3000 ‘A’ St. 3-06 Investor Midtown 9.4%
3201/3301 ‘C’ St. 3-06 Investor Midtown 10.1%
360 W. Benson Blvd 3-06 Investor Midtown 8.8%
900 W. 5th
Ave. 2-07 Investor CBD 7.3%
1199 E. Dimond Blvd. 3-07 User/Investor South Anchorage 7.7%
2605 Denali St. 10-07 Investor Midtown 7.7%
1709 Bragaw St. 1-08 User/Investor East Anchorage 9.3%
3003 Minnesota By-pass 4-09 User/Investor Midtown 7.1%
2121 Abbott Rd. 6-09 Investor South Anchorage 9.0%
500 W. 6th
Ave. 2-10 Investor CBD 7.0%
431 W. 7th
Ave. 5-10 Investor CBD 10.0%
441 W. 5th
Ave. 6-10 Investor CBD 10.0%
Local sales trend near the national indicators and recent transactions reflect a range
from 7.0% to 10.1% with an average of 8.61%. Although the national financial crisis is
of concern there has not been significant evidence of increased capitalization rates in
the Anchorage market.
Description
OAR Range
OAR AVG
National Indicators – Non-Institutional Suburban Office Market 8.51% to 9.78% 9.02%
Anchorage Offices 7.30% to 10.30% 8.61%
The subject is a relatively small building that is in good condition, is located in
Midtown Anchorage and has adequate on-site parking. We have concluded at a rate
towards the low end of the range at 8%.
Projected NOI $89,727 OAR 8.0%
Indicated Value, rounded $1,122,000

Black-Smith, Bethard and Carlson LLC. 40
FINAL RECONCILIATION
The value indicators developed are summarized in the following table.
Indicated value by the Sales Comparison Approach $1,253,000 Indicated value by the Income Approach $1,122,000
The sales approach established a range of indicated values for similar office buildings.
Due to the subject’s smaller size, good condition and location in midtown, a unit value
towards the upper end of the range is supported by the data. The approach provides a
reasonable indication of value.
The subject is suitable for users or investors. The market rent estimate, expenses, and
capitalization rate are all well supported by actual data from the subject and
comparable properties. The approach is reasonable given the data available.
In the end, both approaches are reasonable. Giving slightly greater weight to the
income approach, market value is fairly represented at $1,200,000.
Total Market Value Lot 5A, Block 5 (Starn Building): $1,200,000 Lot 4, Block 5 (Excess Land): $184,000

Black-Smith, Bethard and Carlson LLC. 41
ADDENDA

Black-Smith, Bethard and Carlson LLC. 42
Black-Smith, Bethard and Carlson LLC. 43
Black-Smith, Bethard and Carlson LLC. 44

Black-Smith, Bethard and Carlson LLC. 45
FIRST FLOOR

Black-Smith, Bethard and Carlson LLC. 46
SECOND FLOOR

Black-Smith, Bethard and Carlson LLC. 47
QUALIFICATIONS OF BRIAN Z. BETHARD, MAI
State Certification No. 281
General Education Service High School, Anchorage, Alaska - Graduate 1989 The Colorado College, Colorado Springs, CO - Bachelor of Arts, Economics 1993 University of Alaska, Anchorage, Anchorage, AK - MBA 1996
Employment History Black-Smith, Bethard & Carlson, LLC - Managing Member – 2005 + Black-Smith and Richards, Inc. - Fee Appraiser - 1995 to 2005 Randall, Hayes, and Henderson, Inc. - Fee Appraiser - 1993 to 1995
Appraisal Courses/Seminars Taken Residential Case Study - University of Alaska Anchorage - 1994 Uniform Residential Appraisal Report - Appraisal Institute - 1993 Standards of Professional Practice, Part A & B - Appraisal Institute - 1996 Advanced Sales Comparison & Cost Approaches - Appraisal Institute - 1997 Appraisal Principles & Procedures - Appraisal Institute - 1998 Highest and Best Use Market Analysis - Appraisal Institute - 1998 Advanced Applications and Market Analysis - Appraisal Institute - 1998 Report Writing and Valuation Analysis - Appraisal Institute, 1998 Advanced Income Capitalization, Course 510 - Appraisal Institute - 2000 Intro to Statistics & Supporting Adjustments - Appraisal Institute - 2002 Market Studies for Affordable Housing - NH&RA - 2002 Standards of Professional Practice - Appraisal Institute – 2002/03/04/05/07/09 Subdivision Analysis - Appraisal Institute – 2004 Rates & Ratios – Appraisal Institute – 2005 Principles of Real Estate Law – IRWA – 2005 Skills of Expert Testimony – IRWA – 2006 Analyzing Distressed Real Estate – AI – 2006 Condemnation Appraising – AI – 2007 Appraisal Challenges in Declining Markets – AI, 2009 Forcasting Revenue – AI, 2009
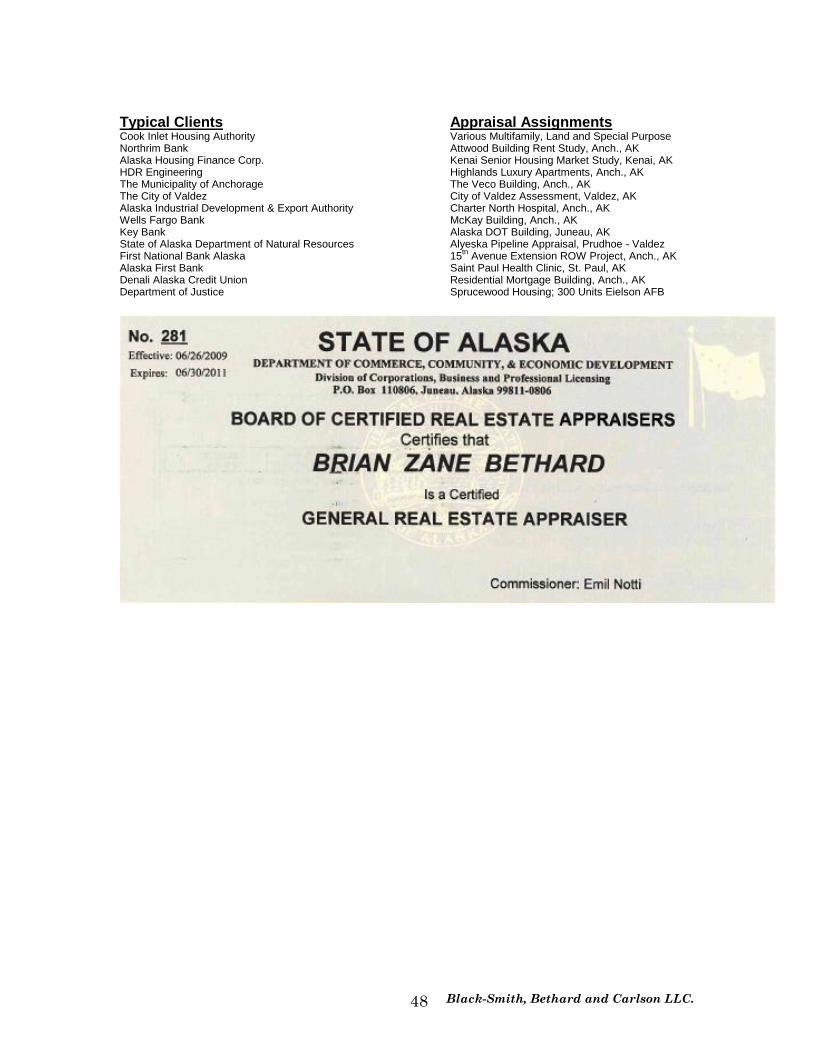
Certifications Alaska State Certification: General Real Estate Appraiser #281
Affiliations Member Appraisal Institute (Member No. 11857) President: Alaska Chapter Appraisal Institute – 2005 & 2006 Vice Pres: Alaska Chapter Appraisal Institute - 2004
Black-Smith, Bethard and Carlson LLC. 48
Typical Clients Appraisal Assignments Cook Inlet Housing Authority Various Multifamily, Land and Special Purpose Northrim Bank Attwood Building Rent Study, Anch., AK Alaska Housing Finance Corp. Kenai Senior Housing Market Study, Kenai, AK HDR Engineering Highlands Luxury Apartments, Anch., AK The Municipality of Anchorage The Veco Building, Anch., AK The City of Valdez City of Valdez Assessment, Valdez, AK Alaska Industrial Development & Export Authority Charter North Hospital, Anch., AK Wells Fargo Bank McKay Building, Anch., AK Key Bank Alaska DOT Building, Juneau, AK State of Alaska Department of Natural Resources Alyeska Pipeline Appraisal, Prudhoe - Valdez First National Bank Alaska 15
th Avenue Extension ROW Project, Anch., AK
Alaska First Bank Saint Paul Health Clinic, St. Paul, AK Denali Alaska Credit Union Residential Mortgage Building, Anch., AK Department of Justice Sprucewood Housing; 300 Units Eielson AFB
Black-Smith, Bethard and Carlson LLC. 49
LIMITING CONDITIONS AND ASSUMPTIONS
This appraisal report has been made with the following general assumptions:
1. No responsibility is assumed for the legal description provided or for matters pertaining to
legal or title considerations. Title to the property is assumed to be good and marketable unless
otherwise stated.
2. The property is appraised free and clear of any or all liens or encumbrances unless otherwise
stated.
3. Responsible ownership and competent property management are assumed.
4. The information furnished by others is believed to be reliable, but no warranty is given for its
accuracy.
5. All engineering studies (if any) are assumed to be correct. The plot plans and illustrative
material in this report are included only to help the reader visualize the property.
6. It is assumed that there are no hidden or unapparent conditions of the property, subsoil, or
structures that render it more or less valuable. No responsibility is assumed for such conditions
or for obtaining the engineering studies that may be required to discover them.
7. It is assumed that the property is in full compliance with all applicable federal, state, and local
environmental regulations and laws unless the lack of compliance is stated, described, and
considered in the appraisal report.
8. It is assumed that the property conforms to all applicable zoning and use regulations and
restrictions unless a nonconformity has been identified, described, and considered in the
appraisal report.
9. It is assumed that all required licenses, certificates of occupancy, consents, and other
legislative or administrative authority from any local, state, or national government or private
entity or organization have been or can be obtained or renewed for any use on which the opinion
of value contained in this report is based.
10. It is assumed that the use of the land and improvements is confined within the boundaries or
property lines of the property described and that there is no encroachment or trespass unless
noted in the report.
11. Unless otherwise stated in this report, the existence of hazardous materials, which may or
may not be present on the property, was not observed by the appraiser. The appraiser has no
knowledge of the existence of such materials on or in the property. The appraiser, however, is
not qualified to detect such substances. The presence of substances such as asbestos, urea-
formaldehyde foam insulation and other potentially hazardous materials may affect the value of
the property. The value estimated is predicated on the assumption that there is no such material
on or in the property that would cause a loss in value. No responsibility is assumed for such
conditions or for any expertise or engineering knowledge required to discover them. The intended
user is urged to retain an expert in this field, if desired.
Black-Smith, Bethard and Carlson LLC. 50
This appraisal report has been made with the following general limiting conditions:
1. Any allocation of the total value estimated in this report between the land and the
improvements applies only under the stated program of utilization. The separate values allocated
to the land and buildings must not be used in conjunction with any other appraisal and are
invalid if so used.
2. Possession of this report, or a copy thereof, does not carry with it the right of publication.
3. The appraiser, by reason of this appraisal, is not required to give further consultation or
testimony or to be in attendance in court with reference to the property in question unless
arrangements have been previously made.
4. Neither all nor any part of the contents of this report (especially any conclusions as to value,
the identity of the appraiser, or the firm with which the appraiser is connected) shall be
disseminated to the public through advertising, public relations, news, sales, or other media
without the prior written consent and approval of the appraiser.
Additional Assumptions and Limiting Conditions:
1. Any opinions of value provided in the report apply to the entire property, and any proration or
division of the total into fractional interests will invalidate the opinion of value, unless such
proration or division of interests has been set forth in the report.
2. The client agency provided the area estimates for the larger parcel, area of the acquisition, and
the remainder. Design changes, if any, that result in changes to those area estimates will
require a modification of the appraisal.
3. The forecasts, projections, or operating estimates contained herein are based on current
market conditions, anticipated short-term supply and demand factors, and a continued stable
economy. These forecasts are, therefore, subject to changes with future conditions.
4. The Americans with Disabilities Act (ADA) became effective January 26, 1992. The appraiser
has not made a specific compliance surveyor analysis of the property to determine whether or not
it is in conformity with the various detailed requirements of ADA. It is possible that a compliance
survey of the property and a detailed analysis of the requirements of the ADA would reveal that
the property is not in compliance with one or more of the requirements of the act. If so, this fact
could have a negative impact upon the value of the property. Since the appraiser has no direct
evidence relating to this issue, possible noncompliance with the requirements of ADA was not
considered in estimating the value of the property.