Apppeennddiixx AA Mooddeelliinngg … AA Mooddeelliinngg RReeppoorrtt ... WBID 1926 Cedar Creek...
19
Transcript of Apppeennddiixx AA Mooddeelliinngg … AA Mooddeelliinngg RReeppoorrtt ... WBID 1926 Cedar Creek...

AAppppeennddiixx AA
MMooddeelliinngg RReeppoorrtt
CCeeddaarr CCrreeeekk
WWBBIIDD 11992266
NNuuttrriieennttss,, BBOODD aanndd DDiissssoollvveedd OOxxyyggeenn
MMaarrcchh 22001133

Model Report: WBID 1926 Cedar Creek March 2013
i
Table of Contents
1. WATERSHED DESCRIPTION ........................................................................................................ 1
2. TMDL TARGETS .............................................................................................................................. 4
3. MODELING APPROACH ................................................................................................................ 4
3.1. CEDAR CREEK WATERSHED MODEL ............................................................................................ 4
3.1.1. Watershed Delineation and Landuse ...................................................................................... 4
3.2. CEDAR CREEK WATERSHED RUNOFF ........................................................................................... 6
3.2.1. Meteorological........................................................................................................................ 6
3.2.2. BOD and Nutrient Loadings ................................................................................................... 6
3.3. CEDAR CREEK WATER QUALITY MODEL ..................................................................................... 7
3.3.1. WASP Model ........................................................................................................................... 7
4. MODELING SCENARIOS ...............................................................................................................12
4.1. NATURAL CONDITION ANALYSIS ................................................................................................12
4.2. TMDL LOAD REDUCTIONS .........................................................................................................14
5. TMDL DETERMINATION ..............................................................................................................14
6. REFERENCES ...................................................................................................................................14
Table of Figures
FIGURE 1 LOCATION MAP FOR WBID 1926 .................................................................................................... 2
FIGURE 2 LANDUSE DISTRIBUTION FOR CEDAR CREEK WATERSHED .............................................................. 3
FIGURE 3 CEDAR CREEK WATERSHED DELINEATION ..................................................................................... 5
FIGURE 4 WASP CALIBRATION FOR TOTAL NITROGEN .................................................................................. 9
FIGURE 5 WASP CALIBRATION FOR TOTAL PHOSPHORUS .............................................................................. 9
FIGURE 6 WASP CALIBRATION FOR DISSOLVED OXYGEN .............................................................................10
FIGURE 7 WASP CALIBRATION FOR BOD5 ...................................................................................................10

Model Report: WBID 1926 Cedar Creek March 2013
ii
FIGURE 8 WASP CALIBRATION FOR CHLOROPHYLL A ...................................................................................11
FIGURE 9 WASP CALIBRATION FOR MONTHLY AVERAGE FLOW ..................................................................11
FIGURE 10 WASP CALIBRATION FOR FLOW ..................................................................................................12
FIGURE 11 DO CONCENTRATION TIME SERIES UNDER NATURAL CONDITION ...............................................14
Table of Tables
TABLE 1 EVENT MEAN CONCENTRATION FOR LANDUSE CLASSIFICATIONS .................................................... 6
TABLE 2 CEDAR CREEK NUTRIENT LOADS (1/2002-7/2008) ........................................................................... 7
TABLE 3 WASP KINETIC RATES ..................................................................................................................... 7
TABLE 4 EXISTING CONDITION OBSERVED AND PREDICTED ANNUAL AVERAGE CONCENTRATIONS (2003-
2009) ..................................................................................................................................................... 8
TABLE 5 ANNUAL AVERAGE LOADINGS FOR NATURAL CONDITION ..............................................................13
TABLE 6 SIMULATED ANNUAL AVERAGE CONCENTRATIONS UNDER NATURAL CONDITIONS .......................13
TABLE 7 TMDL DETERMINATION ..................................................................................................................14

Model Report: WBID 1926 Cedar Creek March 2013
1
1. Watershed Description
Cedar Creek (WBID 1926, Figure 1) is a tributary basin to the Braden River. Braden
River drains the southern portion of the Manatee River watershed in Manatee County.
Cedar Creek is a small basin (5.0 km2) in the Manatee River watershed. The creek enters
the Braden River approximately 1.5 km upstream of Ward Lake, the primary water
supply reservoir for the City of Bradenton. Land use in the Cedar Creek basin is
predominantly urban (76 percent) consisting of residential housing and golf course land
uses. Cedar Creek, as a tributary to Braden River and Ward Lake is designated as a Class
I potable water supply by the Florida Department of Environmental Protection.
Changes in land use in the Cedar Creek basin are from urbanization and subsequent
stormwater management. These changes in land use are reflected in the hydraulic
modification of the basin such that wetlands have been converted to small stormwater
ponds at the neighborhood scale.

Model Report: WBID 1926 Cedar Creek March 2013
2
Figure 1 Location Map for WBID 1926
The landuse distribution for the Cedar Creek watershed is presented in Figure 2. The
watershed is predominantly urban.

Model Report: WBID 1926 Cedar Creek March 2013
3
Figure 2 Landuse Distribution for Cedar Creek watershed

Model Report: WBID 1926 Cedar Creek March 2013
4
2. TMDL Targets
The TMDL reduction scenarios will be done to achieve a dissolved oxygen concentration
of 5 mg/L within the Cedar Creek watershed or establish the natural condition.
3. Modeling Approach
A coupled watershed and water quality modeling framework was used to simulate
biological oxygen demand (BOD), nutrients (total nitrogen and total phosphorus), and
chlorophyll a (Chla) and dissolved oxygen (DO) for the time period of January 2002
through July 2008. The watershed model provides daily runoff, nutrient and BOD
loadings from the watershed. The predicted results from the LSPC model served as
boundary conditions to the receiving in-stream model Water Quality Analysis Simulation
Program (WASP 7.5) (USEPA, 2009). The WASP model integrates the predicted flows
and loads from the LSPC model to simulate water quality responses in: nitrogen,
phosphorus, chlorophyll a and dissolved oxygen. Both LSPC and WASP were calibrated
to current conditions and used to simulate a natural condition. The WASP model was
used to determine the percent reduction in loadings that would be needed to meet water
quality standards.
3.1. Cedar Creek Watershed Model
The goal of this watershed modeling effort is to estimate runoff (flow), total nitrogen
(TN), total phosphorus (TP) and BOD loads and concentrations from the upstream
watersheds flowing into Cedar Creek. The Loading Simulation Program C++ (LSPC)
was used as the watershed model.
LSPC is a watershed modeling system that includes streamlined Hydrologic Simulation
Program Fortran (HSPF) algorithms for simulating hydrology, sediment, and general
water quality on land as well as a simplified stream fate and transport model. LSPC is
derived from the Mining Data Analysis System (MDAS), which was originally developed
by EPA Region 3 (under contract with Tetra Tech) and has been widely used for TMDLs.
In 2003, the U.S. Environmental Protection Agency (EPA) Region 4 contracted with
Tetra Tech to refine, streamline, and produce user documentation for the model for public
distribution. LSPC was developed to serve as the primary watershed model for the EPA
TMDL Modeling Toolbox.
3.1.1. Watershed Delineation and Landuse
The surrounding watershed that drains directly to Cedar Creek is presented in Figure 3.
The LSPC model includes 5 sub-basins. The WBID does not have a flow station; hence,
the model uses a drainage basin ratio method to calibrate flows at the mouth of Cedar
Creek to a nearby gage in the Braden River.

Model Report: WBID 1926 Cedar Creek March 2013
5
Figure 3 Cedar Creek Watershed Delineation

Model Report: WBID 1926 Cedar Creek March 2013
6
3.2. Cedar Creek Watershed Runoff
The LSPC watershed model was developed to simulate hydrologic runoff and pollutant
loadings in response to recorded precipitation events for the current and natural
conditions.
3.2.1. Meteorological
Rainfall and other pertinent meteorological data was obtained from the National Weather
Service (NWS) WBAN station 086880.
3.2.2. BOD and Nutrient Loadings
Watershed loadings were generated using event mean concentrations for total nitrogen,
total phosphorus and BOD (Table 1). The initial EMC values were derived for each
landuse type from a study by Harper and Baker (2003) and then calibrated to all data
available for the watershed. Wetland EMCs were derived from the study of Reiss et.al,
(2009). The study summarizes the available literature on nutrient concentrations and
hydrology for wetlands in Florida.
Table 1 Event Mean Concentration for Landuse Classifications
Landuse Total
Nitrogen
Total
Phosphorus BOD
Upland Forest 1.09 0.05 1.2
Transportation 2.23 0.27 6.7
Urban Area 1.64 0.38 4.3
Water 1.6 0.07 1.6
Wetlands 1.01 0.09 2.6
BOD and nutrient watershed runoff were determined using EMCs for surface water
runoff and interflow runoff and baseflow concentrations for groundwater flow. Table 2
provides the annual average total nitrogen, total phosphorus and BOD loads for the
simulated period 1/2002 through 7/2008. It is these loadings that the TMDL load
reduction will be calculated from.

Model Report: WBID 1926 Cedar Creek March 2013
7
Table 2 Cedar Creek Nutrient Loads (1/2002-7/2008)
WBID 1926
Constituent
WLA
(kg/yr)
LA
(kg/yr)
Total Nitrogen NA 7413
Total Phosphorus NA 948
BOD NA 13349
3.3. Cedar Creek Water Quality Model
The Cedar Creek WASP water quality model integrates the predicted flows and loads
from the LSPC model to simulate water quality responses in: nitrogen, phosphorus,
chlorophyll a and dissolved oxygen. A five segment WASP water quality model was
setup to include the Cedar Creek basin.
3.3.1. WASP Model
The WASP water quality model uses net flows to simulate flow and velocity and the
basic eutrophication module to predict dissolved oxygen and Chlorophyll a responses to
BOD, total nitrogen and total phosphorus loadings. Widths and depths were taken from
the National Hydraulic Dataset (NHD) published by the United States Geologic Survey.
These widths and depths were then modified based on satellite imagery and best
judgment. Table 3 provides the basic kinetic rates used in the model.
Table 3 WASP Kinetic Rates
WASP Kinetic Parameters Value
Global Reaeration Rate Constant @ 20 °C (per day) Covar Method
Sediment Oxygen Demand (g/m2/day) 1.0
Phytoplankton Maximum Growth Rate Constant @ 20
°C (per day)
3
Phytoplankton Carbon to Chlorophyll Ratio 60
BOD (1) Decay Rate Constant @ 20 °C (per day) 0.15
Ammonia, nitrate, phosphorus rates @ 20 °C (per day) 0.2, 0.001, 0.1
Table 4 provides a comparison of predicted annual average concentrations (WASP
segment 2) versus the annual average concentrations of the measured data at the IWR
station 21FLMANA-TS2 for 2003 through 2009 (model was run from 1/2002 through
7/2008).
Model Report: WBID 1926 Cedar Creek March 2013
8
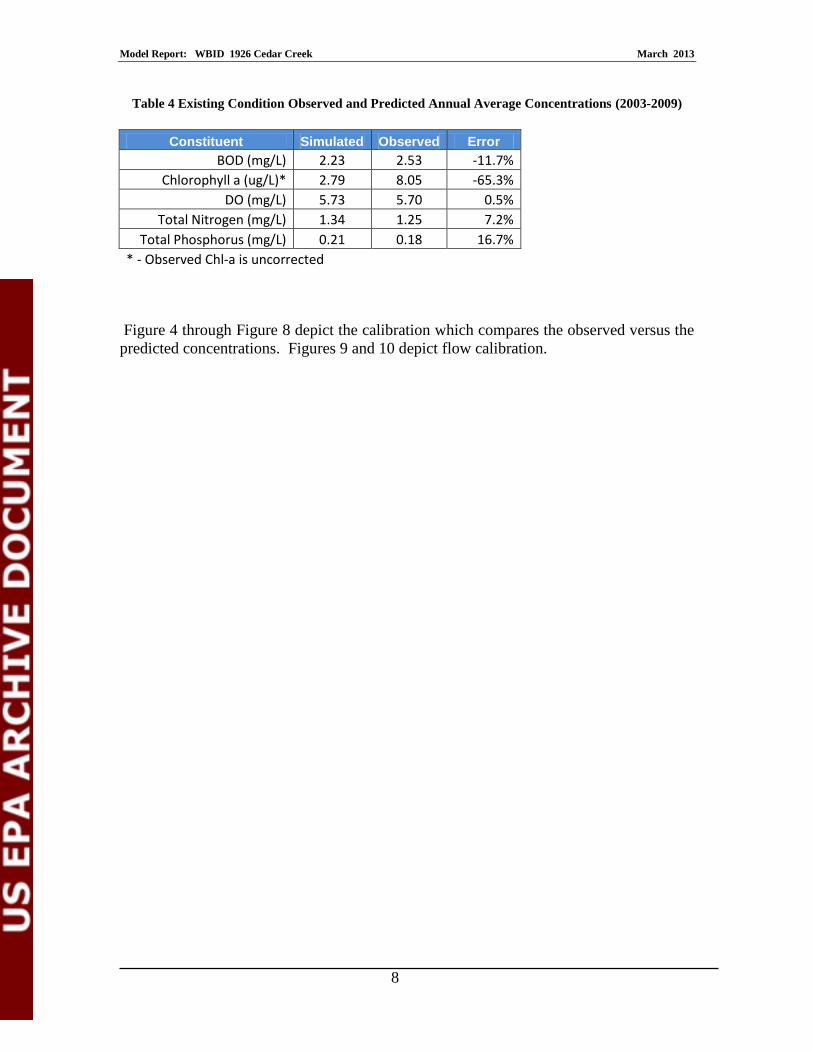
Table 4 Existing Condition Observed and Predicted Annual Average Concentrations (2003-2009)
Constituent Simulated Observed Error
BOD (mg/L) 2.23 2.53 -11.7%
Chlorophyll a (ug/L)* 2.79 8.05 -65.3%
DO (mg/L) 5.73 5.70 0.5%
Total Nitrogen (mg/L) 1.34 1.25 7.2%
Total Phosphorus (mg/L) 0.21 0.18 16.7%
* - Observed Chl-a is uncorrected
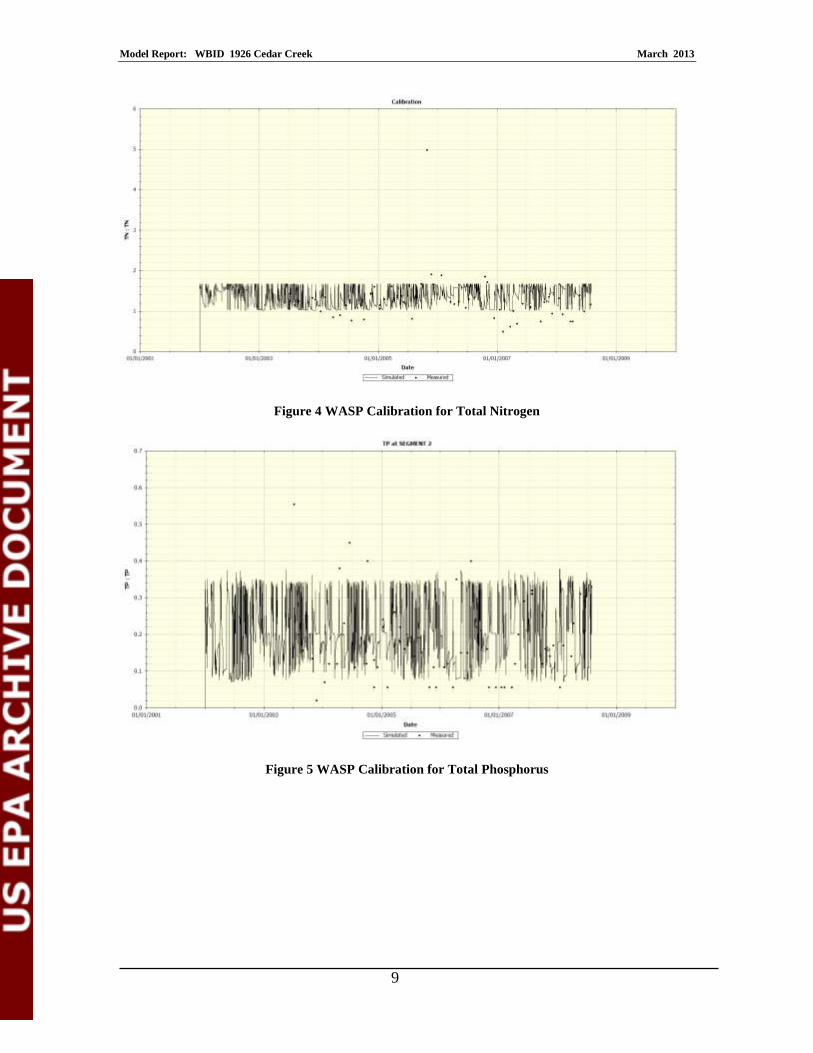
Figure 4 through Figure 8 depict the calibration which compares the observed versus the
predicted concentrations. Figures 9 and 10 depict flow calibration.
Model Report: WBID 1926 Cedar Creek March 2013
9
Figure 4 WASP Calibration for Total Nitrogen
Figure 5 WASP Calibration for Total Phosphorus

Model Report: WBID 1926 Cedar Creek March 2013
10
Figure 6 WASP Calibration for Dissolved Oxygen
Figure 7 WASP Calibration for BOD5

Model Report: WBID 1926 Cedar Creek March 2013
11
Figure 8 WASP Calibration for Chlorophyll a
Figure 9 WASP Calibration for Monthly Average Flow

Model Report: WBID 1926 Cedar Creek March 2013
12
Figure 10 WASP Calibration for Flow
4. Modeling Scenarios
Using the calibrated watershed and water quality models, two potential modeling
scenarios will be developed. The calibrated model was first used to predict water quality
conditions under natural condition (without point sources and returning landuses back to
upland forests and wetlands). A second scenario will be developed if water quality
standards can be met under natural conditions (balanced flora and fauna, dissolved
oxygen greater than 5 mg/L); loads would be reduced from the current conditions until
standards are met (balanced flora and fauna, dissolved oxygen greater than 5 mg/L).
4.1. Natural Condition Analysis
Cedar Creek sub-basins and upstream land uses were changed from impacted lands to
upland forest and wetlands land uses. LSPC was then used to simulate the natural
condition nutrient loads (Table 5) which were inputted in to WASP model.
Natural
Condition
Constituent WLA
(kg/yr) LA
(kg/yr)
Total Nitrogen NA 1,641
Total Phosphorus NA 101
BOD NA 2,788

Model Report: WBID 1926 Cedar Creek March 2013
13
Table 5 Annual Average Loadings for Natural Condition
Table 6 presents the predicted annual average concentrations under natural conditions.
Without the impacts of anthropogenic sources the dissolved oxygen concentration in the
Cedar Creek still would not achieve the dissolved oxygen standard of 5 mg/l (Figure 11).
Natural Condition
Constituent Natural
BOD (mg/L) 1.11
Chlorophyll a (ug/L) 2.89
DO (mg/L) 5.91
Total Nitrogen (mg/L) 1.10
Total Phosphorus (mg/L) 0.06
Table 6 Simulated Annual Average Concentrations Under Natural Conditions

Model Report: WBID 1926 Cedar Creek March 2013
14
4.2. TMDL Load Reductions
Because water quality standards cannot be met under natural conditions (Figure 11) no
other scenarios were conducted. The TMDL will be set to the natural conditions.
Figure 11 DO Concentration Time Series under Natural Condition
5. TMDL Determination
The TMDL load reduction was determined by reducing the current conditions to the
natural conditions. The annual average loadings are given in Table 7 along with the
prescribed load reductions.
Table 7 TMDL Determination
Current Condition TMDL Condition MS4 LA
Constituent WLA
(kg/yr) LA
(kg/yr) WLA
(kg/yr) LA
(kg/yr) %
Reduction % Reduction
BOD NA 5,079 NA 2,787 45% 45%
Total Nitrogen NA 2,139 NA 1,682 21% 21%
Total Phosphorus NA 421 NA 101 76% 76%
6. References
Harper, H. H. and D.M. Baker. 2003. Evaluation of Alternative Stormwater Regulations
for Southwest Florida. Environmental Research & Design, Inc. Orlando, FL.

Model Report: WBID 1926 Cedar Creek March 2013
15
Reiss, K. C., J. Evans and M.T. Brown. 2009. Summary of the Available Literature on
Nutrient Concentrations and Hydrology for Florida Isolated Wetlands. Howard T. Odum
Center for Wetlands, Department of Environmental Engineering Sciences, University of
Florida, Water Management District, Gainesville, FL.
PBSJ. 2007. Peace River Cumulative Impact Study. Final Report Submitted to Florida
Department of Environmental Protection. Tallahassee, FL.

![FINAL TMDL REPORT - Florida Dep · FINAL TMDL Report: Ochlockonee–St. Marks Basin; Munson Slough, WBID 807D (DO), Lake Munson, WBID 807C (DO, Nutrients [TSI], and Turbidity), and](https://static.fdocuments.in/doc/165x107/5b81affa7f8b9a7b6f8cf3d5/final-tmdl-report-florida-dep-final-tmdl-report-ochlockoneest-marks-basin.jpg)