AppManager for CA ARCserve - NetIQ
54
NetIQ ® AppManager ® for CA ARCserve Management Guide February 2011
Transcript of AppManager for CA ARCserve - NetIQ

NetIQ® AppManager® for CA ARCserve
Management GuideFebruary 2011

Legal Notice
NetIQ AppManager is covered by United States Patent No(s): 05829001, 05986653, 05999178, 06078324, 06397359, 06408335.
THIS DOCUMENT AND THE SOFTWARE DESCRIBED IN THIS DOCUMENT ARE FURNISHED UNDER AND ARE SUBJECT TO THE TERMS OF A LICENSE AGREEMENT OR A NON-DISCLOSURE AGREEMENT. EXCEPT AS EXPRESSLY SET FORTH IN SUCH LICENSE AGREEMENT OR NON-DISCLOSURE AGREEMENT, NETIQ CORPORATION PROVIDES THIS DOCUMENT AND THE SOFTWARE DESCRIBED IN THIS DOCUMENT "AS IS" WITHOUT WARRANTY OF ANY KIND, EITHER EXPRESS OR IMPLIED, INCLUDING, BUT NOT LIMITED TO, THE IMPLIED WARRANTIES OF MERCHANTABILITY OR FITNESS FOR A PARTICULAR PURPOSE. SOME STATES DO NOT ALLOW DISCLAIMERS OF EXPRESS OR IMPLIED WARRANTIES IN CERTAIN TRANSACTIONS; THEREFORE, THIS STATEMENT MAY NOT APPLY TO YOU.
This document and the software described in this document may not be lent, sold, or given away without the prior written permission of NetIQ Corporation, except as otherwise permitted by law. Except as expressly set forth in such license agreement or non-disclosure agreement, no part of this document or the software described in this document may be reproduced, stored in a retrieval system, or transmitted in any form or by any means, electronic, mechanical, or otherwise, without the prior written consent of NetIQ Corporation. Some companies, names, and data in this document are used for illustration purposes and may not represent real companies, individuals, or data.
This document could include technical inaccuracies or typographical errors. Changes are periodically made to the information herein. These changes may be incorporated in new editions of this document. NetIQ Corporation may make improvements in or changes to the software described in this document at any time.
© 2011 NetIQ Corporation. All rights reserved.
U.S. Government Restricted Rights: If the software and documentation are being acquired by or on behalf of the U.S. Government or by a U.S. Government prime contractor or subcontractor (at any tier), in accordance with 48 C.F.R. 227.7202-4 (for Department of Defense (DOD) acquisitions) and 48 C.F.R. 2.101 and 12.212 (for non-DOD acquisitions), the government’s rights in the software and documentation, including its rights to use, modify, reproduce, release, perform, display or disclose the software or documentation, will be subject in all respects to the commercial license rights and restrictions provided in the license agreement.
Check Point, FireWall-1, VPN-1, Provider-1, and SiteManager-1 are trademarks or registered trademarks of Check Point Software Technologies Ltd.
ActiveAudit, ActiveView, Aegis, AppManager, Change Administrator, Change Guardian, Compliance Suite, the cube logo design, Directory and Resource Administrator, Directory Security Administrator, Domain Migration Administrator, Exchange Administrator, File Security Administrator, Group Policy Administrator, Group Policy Guardian, Group Policy Suite, IntelliPolicy, Knowledge Scripts, NetConnect, NetIQ, the NetIQ logo, PSAudit, PSDetect, PSPasswordManager, PSSecure, Secure Configuration Manager, Security Administration Suite, Security Manager, Server Consolidator, VigilEnt, and Vivinet are trademarks or registered trademarks of NetIQ Corporation or its subsidiaries in the USA. All other company and product names mentioned are used only for identification purposes and may be trademarks or registered trademarks of their respective companies.
For purposes of clarity, any module, adapter or other similar material ("Module") is licensed under the terms and conditions of the End User License Agreement for the applicable version of the NetIQ product or software to which it relates or interoperates with, and by accessing, copying or using a Module you agree to be bound by such terms. If you do not agree to the terms of the End User License Agreement you are not authorized to use, access or copy a Module and you must destroy all copies of the Module and contact NetIQ for further instructions.

Contents
About this Book and the Library.................................................................................................................vAbout NetIQ Corporation ........................................................................................................................vii
Chapter 1Introduction to AppManager for CA ARCserve 1Why Monitor CA ARCserve? .....................................................................................................................................1Viewing CA ARCserve Resources in AppManager....................................................................................................2
Chapter 2Installing AppManager for CA ARCserve 3System Requirements..................................................................................................................................................3Permissions for Running Knowledge Scripts..............................................................................................................4Installing AppManager for CA ARCserve..................................................................................................................4Discovering CA ARCserve Resources ........................................................................................................................5Upgrading Knowledge Script Jobs..............................................................................................................................6
Chapter 3ARCserve Knowledge Scripts 9ActivityLogSize ..........................................................................................................................................................11AlertMediaChange....................................................................................................................................................12CanceledJobs.............................................................................................................................................................13DeleteJobs .................................................................................................................................................................14EventLog ...................................................................................................................................................................15FailedJobs ..................................................................................................................................................................17HungJobs ..................................................................................................................................................................18IncompleteJobs .........................................................................................................................................................20LogFiles .....................................................................................................................................................................22Report_ActivityLogSize.............................................................................................................................................23Report_CPUandMemoryUsage ...............................................................................................................................26Report_NumberofCanceledJobs ..............................................................................................................................29Report_NumberofFailedJobs....................................................................................................................................32Report_NumberofIncompleteJobs ...........................................................................................................................35Report_NumberofSuccessfulJobs .............................................................................................................................38RescheduleJobs .........................................................................................................................................................41ResourceHigh............................................................................................................................................................42ServiceDown .............................................................................................................................................................43SetLoggingType.........................................................................................................................................................44SuccessfulJobs ...........................................................................................................................................................45
Contents iii

iv Management Guide

About this Book and the Library
The NetIQ AppManager product (AppManager) is a comprehensive solution for managing, diagnosing, and analyzing performance, availability, and health for a broad spectrum of operating environments, applications, services, and server hardware.
AppManager provides system administrators with a central, easy-to-use console to view critical server and application resources across the enterprise. With AppManager, administrative staff can monitor computer and application resources, check for potential problems, initiate responsive actions, automate routine tasks, and gather performance data for real-time and historical reporting and analysis.
Intended AudienceThis guide provides information for individuals responsible for installing an AppManager module and monitoring specific applications with AppManager.
Other Information in the LibraryThe library provides the following information resources:
Installation Guide for AppManager
Provides complete information about AppManager pre-installation requirements and step-by-step installation procedures for all AppManager components.
User Guide for AppManager Control Center
Provides complete information about managing groups of computers, including running jobs, responding to events, creating reports, and working with Control Center. A separate guide is available for the AppManager Operator Console.
Administrator Guide for AppManager
Provides information about maintaining an AppManager management site, managing security, using scripts to handle AppManager tasks, and leveraging advanced configuration options.
Upgrade and Migration Guide for AppManager
Provides complete information about how to upgrade from a previous version of AppManager.
Management guides
Provide information about installing and monitoring specific applications with AppManager.
Help
Provides context-sensitive information and step-by-step guidance for common tasks, as well as definitions for each field on each window.
The AppManager library is available in Adobe Acrobat (PDF) format from the NetIQ Web site: www.netiq.com/support/am/extended/documentation/default.asp?version=AMDocumentation.
About this Book and the Library v

ConventionsThe library uses consistent conventions to help you identify items throughout the documentation. The following table summarizes these conventions.
Convention Use
Bold • Window and menu items• Technical terms, when introduced
Italics • Book and CD-ROM titles• Variable names and values• Emphasized words
Fixed Font • File and folder names• Commands and code examples• Text you must type• Text (output) displayed in the command-line interface
Brackets, such as [value] • Optional parameters of a command
Braces, such as {value} • Required parameters of a command
Logical OR, such as value1|value2
• Exclusive parameters. Choose one parameter.
vi Management Guide
About NetIQ Corporation
NetIQ, an Attachmate business, is a global leader in systems and security management. With more than 12,000 customers in over 60 countries, NetIQ solutions maximize technology investments and enable IT process improvements to achieve measureable cost savings. The company’s portfolio includes award-winning management products for IT Process Automation, Systems Management, Security Management, Configuration Audit and Control, Enterprise Administration, and Unified Communications Management. For more information, please visit www.netiq.com.
Contacting Sales SupportFor questions about products, pricing, and capabilities, please contact your local partner. If you cannot contact your partner, please contact our Sales Support team.
Contacting Technical SupportFor specific product issues, please contact our Technical Support team.
Contacting Documentation SupportOur goal is to provide documentation that meets your needs. If you have suggestions for improvements, please email [email protected]. We value your input and look forward to hearing from you.
Contacting the Online User CommunityQmunity, the NetIQ online community, is a collaborative network connecting you to your peers and NetIQ experts. By providing more immediate information, useful links to helpful resources, and access to NetIQ experts, Qmunity helps ensure you are mastering the knowledge you need to realize the full potential of IT investments upon which you rely. For more information, please visit http://community.netiq.com.
Worldwide: www.netiq.com/about_netiq/officelocations.asp
United States and Canada: 888-323-6768
Email: [email protected]
Web Site: www.netiq.com
Worldwide: www.netiq.com/Support/contactinfo.asp
North and South America: 1-713-418-5555
Europe, Middle East, and Africa: +353 (0) 91-782 677
Email: [email protected]
Web Site: www.netiq.com/support
About NetIQ Corporation vii

viii Management Guide

Chapter 1Introduction to AppManager for CA ARCserve
This chapter discusses the advantages of using AppManager to monitor ARCserve and illustrates how AppManager lets you view CA ARCserve resources.
Why Monitor CA ARCserve?Data is the lifeblood of today’s corporations. From the documents stored on individual workstations, to databases housed on network servers, data represents in many cases a company’s most valuable asset.
As corporate computing environments become more complex and the amount of data mushrooms, companies are turning to products that can provide dependable and robust backup capabilities. One popular backup product line is BrightStor ARCserve Backup, and ARCserveIT from Computer Associates.
With more and more business-critical data being generated, corporate IT organizations are increasingly feeling pressure from corporate management to:
• Ensure the availability and performance of their CA ARCserve services
• Reduce support costs associated with deploying and managing CA ARCserve
• Fulfill corporate service-level agreements (SLAs) regarding the dependability of backup services
If system administrators are going to successfully meet the expectations of corporate management, they will need administrative and management tools that are dependable, robust, and comprehensive.
CA ARCserve itself provides some tools to help administer CA ARCserve services, alert administrators to error conditions, and produce reports. For example, CA ARCserve provides a console that administrators can use to manually stop, pause, and start CA ARCserve services, but this console cannot monitor CA ARCserve services automatically. CA ARCserve can send alerts when specific jobs fail, but this feature cannot be fine-tuned to send alerts when a certain threshold is exceeded. In addition, the CA ARCserve tools do not provide an integrated, seamless mechanism for collecting performance data for analysis, graphing, and reporting.
AppManager for ARCserve provides ready-made Knowledge Scripts and reports that complement and extend CA ARCserve’s built-in features and provide additional value as well. With AppManager, you will be able to automate monitoring tasks; automated monitoring is especially critical for a backup application such as CA ARCserve, which typically runs during off hours. You will also be able to fine-tune monitoring tasks and easily produce graphs and reports that will help you analyze the efficiency of your backup regimen and verify service-level agreements.
Chapter 1 • Introduction to AppManager for CA ARCserve 1
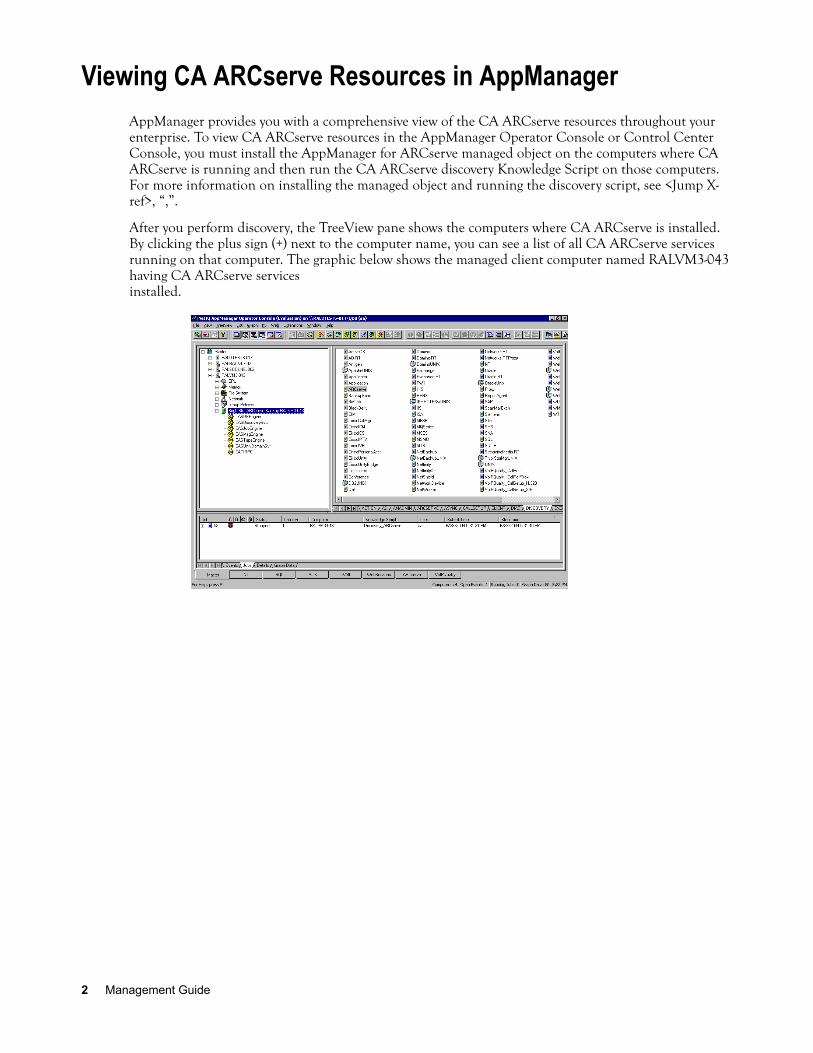
Viewing CA ARCserve Resources in AppManagerAppManager provides you with a comprehensive view of the CA ARCserve resources throughout your enterprise. To view CA ARCserve resources in the AppManager Operator Console or Control Center Console, you must install the AppManager for ARCserve managed object on the computers where CA ARCserve is running and then run the CA ARCserve discovery Knowledge Script on those computers. For more information on installing the managed object and running the discovery script, see <Jump X-ref>, “,”.
After you perform discovery, the TreeView pane shows the computers where CA ARCserve is installed. By clicking the plus sign (+) next to the computer name, you can see a list of all CA ARCserve services running on that computer. The graphic below shows the managed client computer named RALVM3-043 having CA ARCserve services installed.
2 Management Guide
Chapter 2Installing AppManager for CA ARCserve
This chapter provides installation instructions and describes system requirements for AppManager for CA ARCserve.
This chapter assumes you have AppManager installed. For more information about installing AppManager or about AppManager system requirements, see the Installation Guide for AppManager, which is available on the AppManager Documentation Web site: https://www.netiq.com/support/am/extended/documentation/default.asp.
System RequirementsAppManager for CA ARCserve requires the following software:
• At minimum, version 7.0 of the AppManager for CA ARCserver repository, management server, and Operator Console or Control Center Console must be installed.
Each computer that you want to monitor must be configured with the following:
• At minimum, version 7.0 of the AppManager for CA ARCserver agent.
• CA ARCserve version 11.5. We have tested this module with CA ARCserve version 11.5. This module might work properly with a later version, such as a service pack, but this configuration has not been tested.
For the latest information on supported versions and the availability of module updates for AppManager for CA ARCserve, visit the AppManager Suite Supported Products page at www.netiq.com/support/am/supportedproducts.asp. If you encounter problems using this module with a later version, contact Technical Support.
• Windows 2000, Windows Server 2003 or Windows Server 2003 SP2.
For the latest information about supported software versions and the availability of module updates, visit the AppManager Supported Products page at www.netiq.com/support/am/supportedproducts/default.asp. If you encounter problems using this module with a later version of your application, contact NetIQ Technical Support.
For more information about system requirements for the AppManager for CA ARCserver agent, repository, and management server, see the Installation Guide for AppManager.
Chapter 2 • Installing AppManager for CA ARCserve 3
Permissions for Running Knowledge Scripts
Some Knowledge Scripts require the agent services (both NetIQmc and NetIQccm) to run under a Windows user account (such as Domain Admin) that has permission to create a directory on and copy files to a remote computer. By default, the agent is installed under the Windows Local System account. You may need to change the account the agent services are using.
To update the agent services to run under a different account:
1. On each computer where you’re installing the AppManager for CA ARCserve managed object, click Start > Settings > Control Panel.
2. Click Administrative Tools > Services.
3. Find the NetIQ AppManager Client Communication Manager (netiqccm) service in the list of services. Right-click, and select Properties.
4. In the Properties dialog box, click the Logon tab. Click to select Log on as... and select another account, such as Domain Admin.
5. Take the same steps for the NetIQ AppManager Client Resource Monitor (netiqmc) service.
6. Restart both services.
Installing AppManager for CA ARCserveYou can install AppManager for CA ARCserve in one of the following ways:
• Use Control Center to install the module on a remote computer where an AppManager agent is installed.
• Run the AppManager setup program, and install the module when installing AppManager.
• Use the command prompt to install the module silently.
For more information about installing modules, see the AppManager Installation Guide. After the installation has completed, you can find a record of problems encountered in the ARCserve_Install.log file, located in the \NetIQ\Temp\NetIQ_Debug folder.
NoteFor system requirements and instructions on installing the AppManager agent and repository, see the NetIQ AppManager Installation Guide.
4 Management Guide

Discovering CA ARCserve ResourcesTo complete the installation and begin monitoring CA ARCserve, you need to run the Discovery_ARCserve Knowledge Script, which will discover Computer Associates ARCserve servers and the services associated with them
To discover CA ARCserve resource objects in your environment:
1. Start the Operator Console or Control Center Console.
Ensure the TreeView and Knowledge Script panes are open (a check mark should be visible next to the TreeView pane and Knowledge Script pane in the View menu).
2. In the Knowledge Script pane, click the Discovery tab.
3. Drag the CA ARCserve Knowledge Script to the computer(s) in the TreeView pane where CA ARCserve and the AppManager agent are installed.
4. Click the Schedule tab to review the schedule. By default, Discovery jobs are set to Run once.
5. Click the Values tab, and set the event severity levels for successful and failed Discovery events:
After you run the Discovery script, you should see the new CA ARCserve view and CA ARCserve Knowledge Script category in the Operator Console or Control Center Console. You are now ready to begin monitoring CA ARCserve through the Operator Console or Control Center Console.
Description How to Set It
Event for successful discovery? This Knowledge Script always raises an event when the job fails for any reason. In addition, you can set this parameter to y to raise an event when the job succeeds. The default is n.
Event severity when discovery... Set the event severity level, from 1 to 40, to reflect the importance when the job:
• ...succeeds. If you set this Knowledge Script to raise an event when the job succeeds, set the event severity level for a successful discovery. The default is 25 (blue event indicator).
• ...fails. The default is 5 (red event indicator).• ...is partially done. Set the event severity level for a discovery that
returns some data but also generates warning messages. The default is 10 (red event indicator).
• ...is not applicable. This type of failure usually occurs when the target computer does not have ARCserve installed. The default is 15 (yellow event indicator).
Chapter 2 • Installing AppManager for CA ARCserve 5
Upgrading Knowledge Script JobsThis release of AppManager for CA ARCserve may contain updated Knowledge Scripts. You can push the changes for updated scripts to running Knowledge Script jobs in one of the following ways:
• Use the AMAdmin_UpgradeJobs Knowledge Script.
• Use the Properties Propagation feature.
Running AMAdmin_UpgradeJobsThe AMAdmin_UpgradeJobs Knowledge Script can push changes to running Knowledge Script jobs. Your AppManager repository (QDB) must be at version 7.0 or later. In addition, the repository computer must have hotfix 72040 installed, or the most recent AppManager Repository hotfix. To download the hotfix, see the AppManager Suite Hotfixes Web page.
Upgrading jobs to use the most recent script version allows the jobs to take advantage of the latest script logic while maintaining existing parameter values for the job.
For more information, see the Help for the AMAdmin_UpgradeJobs Knowledge Script.
Propagating Knowledge Script ChangesYou can propagate script changes to jobs that are running and to Knowledge Script Groups, including recommended Knowledge Script Groups and renamed Knowledge Scripts.
Before propagating script changes, verify that the script parameters are set to your specifications. Customized script parameters may have reverted to default parameters during the installation of the module. New parameters may need to be set appropriately for your environment or application.
You can choose to propagate only properties (specified in the Schedule and Values tabs), only the script (which is the logic of the Knowledge Script), or both. Unless you know specifically that changes affect only the script logic, you should propagate both properties and the script.
For more information about propagating Knowledge Script changes, see the “Running Monitoring Jobs” chapter of the Operator Console User Guide for AppManager.
Propagating Changes to Ad Hoc JobsYou can propagate the properties and the logic (script) of a Knowledge Script to ad hoc jobs started by that Knowledge Script. Corresponding jobs are stopped and restarted with the Knowledge Script changes.
To propagate changes to ad hoc Knowledge Script jobs:
1. In the Knowledge Script view, select the Knowledge Script for which you want to propagate changes.
2. Click Properties Propagation > Ad Hoc Jobs.
3. Select the components of the Knowledge Script that you want to propagate to associated ad hoc jobs:
Select To propagate
Script The logic of the Knowledge Script.
Properties Values from the Knowledge Script Schedule and Values tabs, such as schedule, monitoring values, actions, and advanced options.
6 Management Guide

Propagating Changes to Knowledge Script GroupsYou can propagate the properties and logic (script) of a Knowledge Script to corresponding Knowledge Script Group members.
After you propagate script changes to Knowledge Script Group members, you can propagate the updated Knowledge Script Group members to associated running jobs. For more information, see “Propagating Changes to Ad Hoc Jobs” on page 6.
To propagate Knowledge Script changes to Knowledge Script Groups:
1. In the Knowledge Script view, select the Knowledge Script Group for which you want to propagate changes.
2. On the KS menu, select Properties propagation > Ad Hoc Jobs.
3. If you want to exclude a Knowledge Script member from properties propagation, deselect that member from the list in the Properties Propagation dialog box.
4. Select the components of the Knowledge Script that you want to propagate to associated Knowledge Script Groups:
5. Click OK. Any monitoring jobs started by a Knowledge Script Group member are restarted with the job properties of the Knowledge Script Group member.
Select To propagate
Script The logic of the Knowledge Script.
Properties Values from the Knowledge Script Schedule and Values tabs, including the schedule, actions, and Advanced properties.
Chapter 2 • Installing AppManager for CA ARCserve 7

8 Management Guide
Chapter 3ARCserve Knowledge Scripts
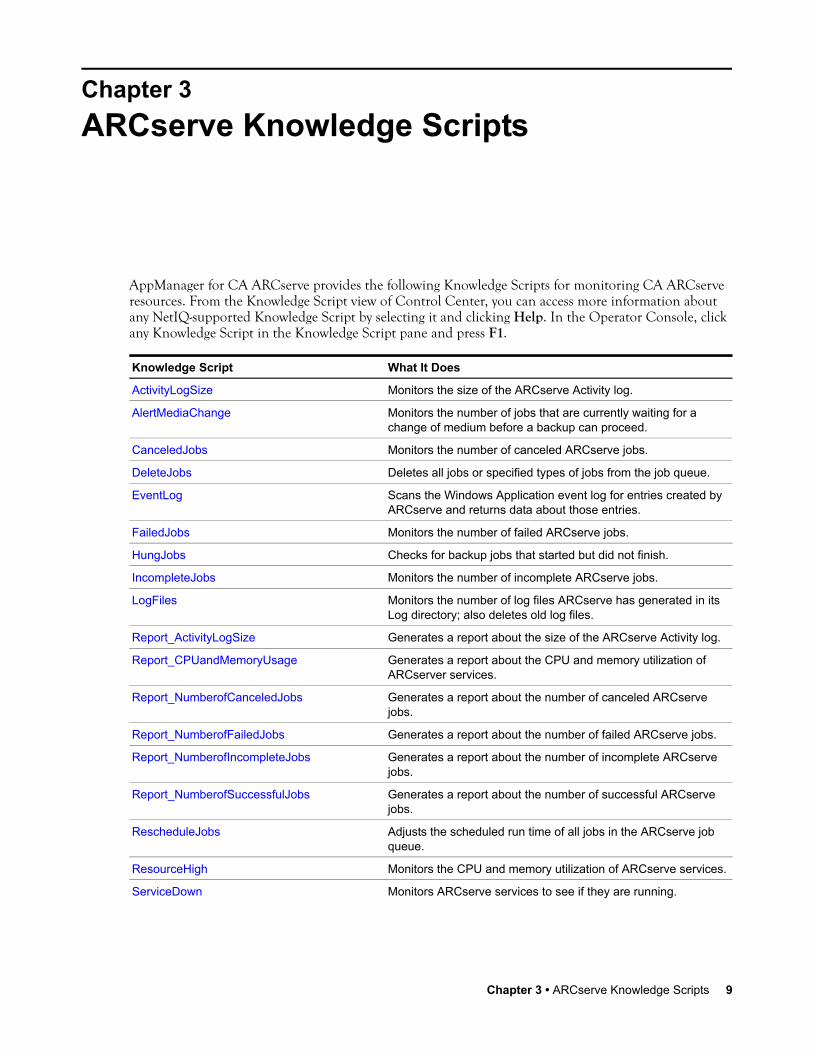
AppManager for CA ARCserve provides the following Knowledge Scripts for monitoring CA ARCserve resources. From the Knowledge Script view of Control Center, you can access more information about any NetIQ-supported Knowledge Script by selecting it and clicking Help. In the Operator Console, click any Knowledge Script in the Knowledge Script pane and press F1.
Knowledge Script What It Does
ActivityLogSize Monitors the size of the ARCserve Activity log.
AlertMediaChange Monitors the number of jobs that are currently waiting for a change of medium before a backup can proceed.
CanceledJobs Monitors the number of canceled ARCserve jobs.
DeleteJobs Deletes all jobs or specified types of jobs from the job queue.
EventLog Scans the Windows Application event log for entries created by ARCserve and returns data about those entries.
FailedJobs Monitors the number of failed ARCserve jobs.
HungJobs Checks for backup jobs that started but did not finish.
IncompleteJobs Monitors the number of incomplete ARCserve jobs.
LogFiles Monitors the number of log files ARCserve has generated in its Log directory; also deletes old log files.
Report_ActivityLogSize Generates a report about the size of the ARCserve Activity log.
Report_CPUandMemoryUsage Generates a report about the CPU and memory utilization of ARCserver services.
Report_NumberofCanceledJobs Generates a report about the number of canceled ARCserve jobs.
Report_NumberofFailedJobs Generates a report about the number of failed ARCserve jobs.
Report_NumberofIncompleteJobs Generates a report about the number of incomplete ARCserve jobs.
Report_NumberofSuccessfulJobs Generates a report about the number of successful ARCserve jobs.
RescheduleJobs Adjusts the scheduled run time of all jobs in the ARCserve job queue.
ResourceHigh Monitors the CPU and memory utilization of ARCserve services.
ServiceDown Monitors ARCserve services to see if they are running.
Chapter 3 • ARCserve Knowledge Scripts 9

SetLoggingType Configures ARCserve to write event information to the Windows Application event log.
SuccessfulJobs Monitors the number of successful ARCserve jobs.
Knowledge Script What It Does
10 Management Guide
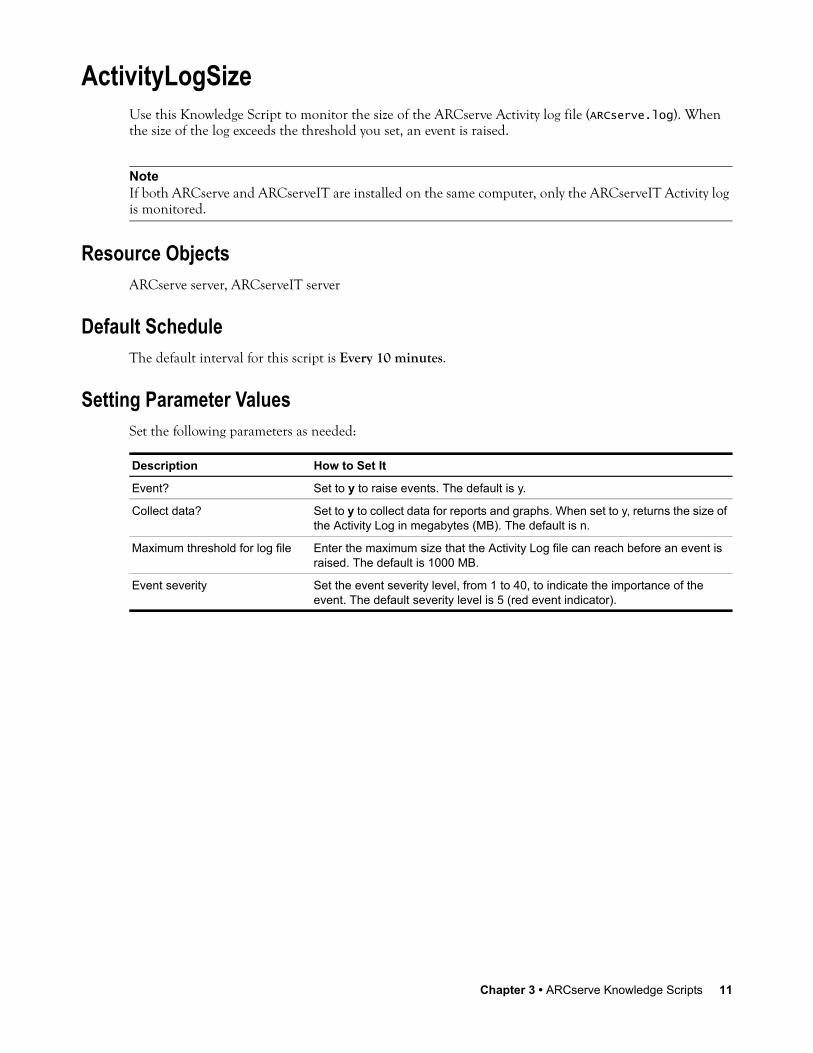
ActivityLogSizeUse this Knowledge Script to monitor the size of the ARCserve Activity log file (ARCserve.log). When the size of the log exceeds the threshold you set, an event is raised.
Resource ObjectsARCserve server, ARCserveIT server
Default ScheduleThe default interval for this script is Every 10 minutes.
Setting Parameter ValuesSet the following parameters as needed:
NoteIf both ARCserve and ARCserveIT are installed on the same computer, only the ARCserveIT Activity log is monitored.
Description How to Set It
Event? Set to y to raise events. The default is y.
Collect data? Set to y to collect data for reports and graphs. When set to y, returns the size of the Activity Log in megabytes (MB). The default is n.
Maximum threshold for log file Enter the maximum size that the Activity Log file can reach before an event is raised. The default is 1000 MB.
Event severity Set the event severity level, from 1 to 40, to indicate the importance of the event. The default severity level is 5 (red event indicator).
Chapter 3 • ARCserve Knowledge Scripts 11

AlertMediaChangeUse this Knowledge Script to search the ARCserve log for messages indicating that jobs that are currently waiting for a change of medium before a backup can proceed. If the number of jobs exceeds the threshold you set, an event is raised.
When a backup job pauses to wait for new backup media (such as a tape drive) to become available, it writes a media alert message to the log file (ARCserve.log). The same job may write multiple media alert entries in the log while it is waiting, and then it may continue when the medium becomes available. You can set the threshold to a value that indicates a job has been waiting for a long time (while issuing multiple alerts), or that many jobs are waiting. Or, if you want this Knowledge Script to raise an event anytime it detects even one media alert entry in the log, set the threshold to 0.
Resource ObjectsARCserve server, ARCserveIT server
Default ScheduleThe default interval for this script is Every hour.
Setting Parameter ValuesSet the following parameters as needed:
NoteIf both ARCserve and ARCserveIT are installed on the same computer, only the ARCserveIT Activity log is monitored.
Description How to Set It
Event? Set to y to raise events. The default is y.
Collect data? Set to y to collect data for reports and graphs. When set to y, returns the number of media alerts found in the log during the current interval. The default is n.
Start with new entries? This parameter controls what the Knowledge Script does on its first iteration:• If set to y, this script does not scan existing entries on its first iteration, and
therefore it does not raise events or collect data on its first iteration. On subsequent iterations, this script only scans new entries written to the log file since the last monitoring interval.
• If set to n, this script scans all existing entries on its first iteration and therefore can raise events and collect data on its first interval. On subsequent iterations, this script only scans new entries written to the log file since the last monitoring interval.
The default is n.
Maximum threshold for media alerts
Enter the maximum number of media alert messages allowed during any single scan of the ARCserve log file before an event is raised. If you specify 0, the script raises an event when it finds any media alerts. The default is 0 alert messages.
Event severity Set the event severity level, from 1 to 40, to indicate the importance of the event. The default severity level is 5 (red event indicator).
12 Management Guide

CanceledJobsUse this Knowledge Script to check for canceled ARCserve jobs and to return data about those jobs.
This script periodically scans the latest ARCserve Activity log file (ARCserve.log) for entries that indicate a job was canceled. If, during any monitoring interval, the number of canceled jobs found in the ARCserve.log file exceeds the threshold you set, an event is raised.
When an event is raised, the contents of the event detail message depend on whether you are also collecting data. When the Knowledge Script is collecting data, the event detail message reports the number of canceled jobs. The data detail message contains the actual log entries. When the Knowledge Script is not collecting data, the event detail message returns all of the log entries related to canceled jobs.
Resource ObjectsARCserve server, ARCserveIT server
Default ScheduleThe default interval for this script is Every hour.
Setting Parameter ValuesSet the following parameters as needed:
NoteIf both ARCserve and ARCserveIT are installed on the same computer, only the ARCserveIT jobs are monitored.
Description How to Set It
Event? Set to y to raise events. The default is y.
Collect data? Set to y to collect data for reports and graphs. If set to y, returns the number of canceled jobs. The default is n.
Start with new entries? This parameter controls what the Knowledge Script does on its first iteration:• If set to y, this script does not scan existing entries on its first iteration, and
therefore does not raise events or collect data on its first iteration. On subsequent iterations, this script only scans the new entries that are written to the log file since the last monitoring interval.
• If set to n, this script scans all existing entries on its first iteration and therefore can raise events and collect data on its first iteration. On subsequent iterations, this script only scans the new entries that are written to the log file since the last monitoring interval.
The default is n.
Include • error messages?• warning messages?
Set either of these parameters to y to collect error and warning messages. This script always returns informational messages related to canceled jobs.
Maximum threshold for canceled jobs
Enter the maximum number of canceled jobs allowed during any monitoring interval before an event is raised. The default is 10 canceled jobs.
Event severity Set the event severity level, from 1 to 40, to indicate the importance of the event. The default severity level is 5 (red event indicator).
Chapter 3 • ARCserve Knowledge Scripts 13

DeleteJobsUse this Knowledge Script to delete all jobs or specific types of jobs from the ARCserve job queue. An event is raised if any jobs are successfully deleted. The event detail message reports the number of jobs actually deleted and also indicates when some jobs could not be deleted.
Resource ObjectsARCserve server, ARCserveIT server
Default ScheduleBy default, this script runs only once.
Setting Parameter ValuesSet the following parameters as needed:
Note If both ARCserve and ARCserveIT are installed on the same computer, only the ARCserveIT jobs are deleted.
Description How to Set It
Event when job is successful? Set this parameter to y to raise an event when the job succeeds. The default is n.Note This script always raises an event when the job fails.
Event severity level when job is successful
If you set the previous parameter to y, set the event severity level, from 1 to 40, to indicate the job ran successfully. The default severity level is 25 (blue event indicator).Note This script raises an event of severity 5 (red event indicator) when the job fails.
Collect data? Set to y to collect data for reports and graphs. If set to y, returns the number of jobs successfully deleted. The default is n.
Delete all jobs? Set this parameter to y to delete all jobs in the ARCserve job queue. If set to y, any settings you select for the Delete jobs of type parameters are ignored. The default is n.
Delete jobs of type: • Backup• Restore• Copy• Count
If you disabled the Delete all jobs parameter, set any of these parameters to y to delete the jobs of that type. The default for each type of job is n.
14 Management Guide
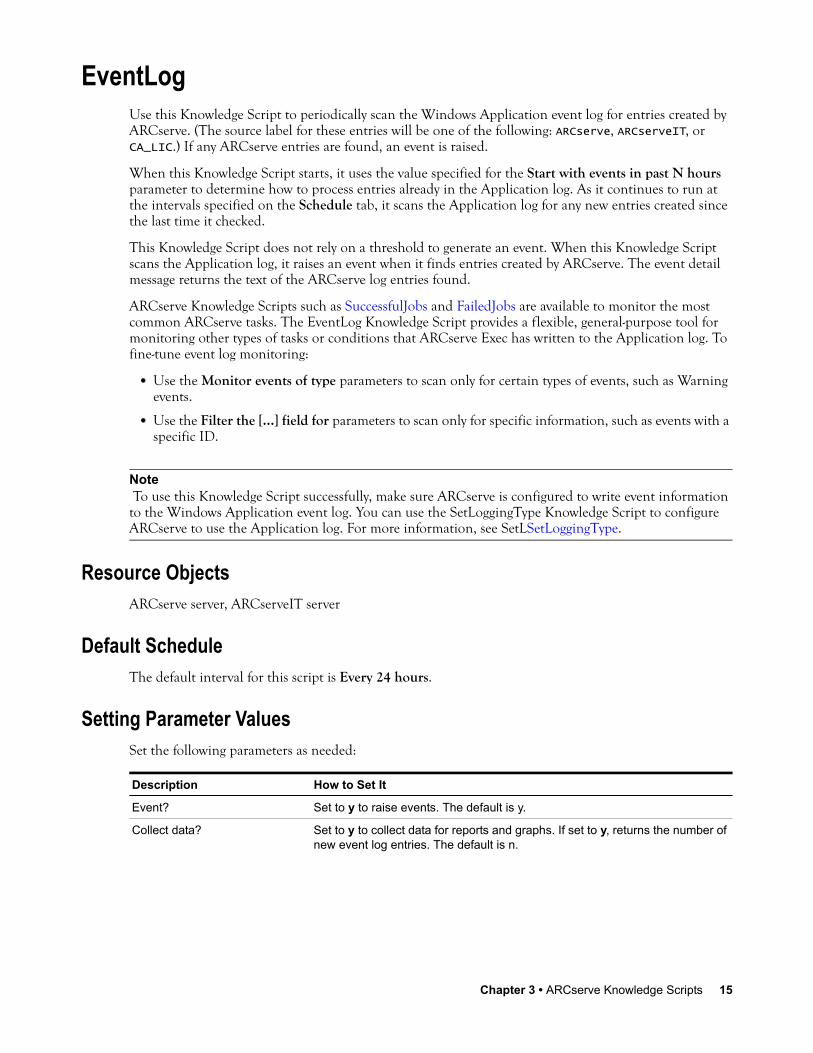
EventLogUse this Knowledge Script to periodically scan the Windows Application event log for entries created by ARCserve. (The source label for these entries will be one of the following: ARCserve, ARCserveIT, or CA_LIC.) If any ARCserve entries are found, an event is raised.
When this Knowledge Script starts, it uses the value specified for the Start with events in past N hours parameter to determine how to process entries already in the Application log. As it continues to run at the intervals specified on the Schedule tab, it scans the Application log for any new entries created since the last time it checked.
This Knowledge Script does not rely on a threshold to generate an event. When this Knowledge Script scans the Application log, it raises an event when it finds entries created by ARCserve. The event detail message returns the text of the ARCserve log entries found.
ARCserve Knowledge Scripts such as SuccessfulJobs and FailedJobs are available to monitor the most common ARCserve tasks. The EventLog Knowledge Script provides a flexible, general-purpose tool for monitoring other types of tasks or conditions that ARCserve Exec has written to the Application log. To fine-tune event log monitoring:
• Use the Monitor events of type parameters to scan only for certain types of events, such as Warning events.
• Use the Filter the [...] field for parameters to scan only for specific information, such as events with a specific ID.
Resource ObjectsARCserve server, ARCserveIT server
Default ScheduleThe default interval for this script is Every 24 hours.
Setting Parameter ValuesSet the following parameters as needed:
Note To use this Knowledge Script successfully, make sure ARCserve is configured to write event information to the Windows Application event log. You can use the SetLoggingType Knowledge Script to configure ARCserve to use the Application log. For more information, see SetLSetLoggingType.
Description How to Set It
Event? Set to y to raise events. The default is y.
Collect data? Set to y to collect data for reports and graphs. If set to y, returns the number of new event log entries. The default is n.
Chapter 3 • ARCserve Knowledge Scripts 15

Start with events in past N hours Set this parameter to determine which events are included in the search the first time the Knowledge Script is run. Subsequent searches begin where the last search finished. The following entries are valid:
• -1 -- search all current and previous Application log events during the first monitoring interval.
• 0 -- search only for events created since the last monitoring interval; previous events are not searched.
• N -- search events logged in the past N hours to the Application log. For example, enter 8 to scan the last 8 hours of the Application log for matching entries.
The default is 0.
Monitor for events of type: • Error• Warning• Information
Set to y for each type of event you want to monitor. If you disable any of these parameters, that type of entry does not raise an event, is not returned in an event detail message, and is not collected as data if you’ve enabled the Collect data parameter. The default is y.
Filter the [...] field for To limit the types of log entries that raise events and the type of data that is collected, enter a search string that filters the following fields in the event log:
• Event ID. Specify a single ARCserve event ID or a range of event IDs separated by commas. For example: 1,2,10-15,202.
• Event Description. Specify a description or keywords in the description. You can specify multiple descriptions separated by commas.
The search string can contain criteria used to include entries, exclude entries, or both. Separate the include and exclude criteria with a colon (:). If you are specifying only include criteria, the colon is not necessary.
Maximum number of entries per event message
Set the maximum number of Application log events that can be returned in each event report. For example, if this value is set to 30 and 67 Application log events are found, three event reports are created, two reports containing 30 events and one report containing 7 events.The Message column on the Events tab in the Operator Console or Control Center Console displays the number of events in each event report, the type of log the events are from, and the event report batch number. The batch number is the sequential number of the event report. Batch numbers start at 1 for each Knowledge Script iteration.The default is 30 entries per event message.
Event severity Set the event severity level, from 1 to 40, to indicate the importance of the event. You may want to adjust the severity depending on which types of events you are checking for. The default severity level is 8 (red event indicator).
Description How to Set It
16 Management Guide

FailedJobsUse this Knowledge Script to check for failed ARCserve jobs and to return data about those jobs.
This script periodically scans the latest ARCserve Activity log file (ARCserve.log) for entries that indicate a job failed. If the number of failed jobs found in the ARCserve.log file during any monitoring interval exceeds the threshold you set, an event is raised.
When an event is raised, the contents of the event detail message depend on whether you are also collecting data. When the Knowledge Script is collecting data, the event detail message reports the number of failed jobs. The data detail message contains the actual log entries. When the Knowledge Script is not collecting data, the event detail message returns all of the log entries related to failed jobs.
Resource ObjectsARCserve server, ARCserveIT server
Default ScheduleThe default interval for this script is Every hour.
Setting Parameter ValuesSet the following parameters as needed:
NoteIf both ARCserve and ARCserveIT are installed on the same computer, only the ARCserveIT jobs are monitored.
Description How to Set It
Event? Set to y to raise events. The default is y.
Collect data? Set to y to collect data for reports and graphs. If set to y, returns the number of failed jobs. The default is n.
Start with new entries? This parameter controls what the Knowledge Script does on its first iteration:• If set to y, this script does not scan existing entries on its first iteration, and
therefore does not raise events or collect data on its first iteration. On subsequent iterations, this script only scans the new entries that were written to the log file since the last monitoring interval.
• If set to n, this script scans all existing entries on its first iteration and therefore can raise events and collect data on its first iteration. On subsequent iterations, this script only scans the new entries that were written to the log file since the last monitoring interval.
The default is n.
Include • error messages?• warning messages?
Set either of these parameters to y to scan error and warning messages. This script always returns informational messages related to canceled jobs.
Maximum threshold for failed jobs
Enter the maximum number of failed jobs allowed during any monitoring interval before an event is raised. The default is 10 failed jobs.
Event severity Set the event severity level, from 1 to 40, to indicate the importance of the event. The default severity level is 5 (red event indicator).
Chapter 3 • ARCserve Knowledge Scripts 17

HungJobsUse this Knowledge Script to check for backup jobs that started but did not finish.
Use the Expected duration of a job parameter to specify the maximum amount of time, in minutes, that any single job can take to complete. This script periodically scans the latest ARCserve Activity log file (ARCserve.log) and makes a note of the start time of each job it finds. Any job that starts and then does not finish by the time you set as the expected duration considered “hung.” If you set a threshold for the number of hung jobs, the script raises an event if the number of hung jobs exceeds this threshold. You can specify a threshold of 0 to receive an event when any job is hung.
If both ARCserve and ARCserveIT are installed on the same computer, only the ARCserveIT jobs are monitored.
Resource ObjectsARCserve server, ARCserveIT server
Default ScheduleThe default interval for this script is Every hour.
Setting Parameter ValuesSet the following parameters as needed:
NoteA job that has finished did not necessarily complete successfully. A job might have failed or have been canceled before the expected duration elapsed. Therefore, HungJobs is not a substitute for the monitoring provided by other ARCserve Knowledge Scripts, such as FaFailedJobsnd CaCanceledJobs.
Description How to Set It
Event? Set to y to raise events. The default is y.
Collect data? Set to y to collect data for reports and graphs. If set to y, returns the number of hung jobs. The default is n.
Start with new entries? This parameter controls what the Knowledge Script does on its first iteration:• If set to y, this script does not scan existing entries on its first iteration, and
therefore does not raise events or collect data on its first iteration. On subsequent iterations, this script only scans the new entries that were written to the log file since the last monitoring interval.
• If set to n, this script scans all existing entries on its first iteration and therefore can raise events and collect data on its first iteration. On subsequent iterations, this script only scans the new entries that are written to the log file since the last monitoring interval.
The default is n.
Jobs to monitor [separated by comma w/o space]
Specify the job ID of the backup job (or jobs) you want to monitor. Separate multiple job IDs with commas; leave this parameter blank to monitor all backup jobs.
18 Management Guide

Expected duration of a job Enter the maximum amount of time that any single job can take to complete. A job that does not complete within this expected duration is considered “hung.” The default is 30 minutes.
Maximum threshold for hung jobs Enter the maximum number of hung jobs allowed before an event is raised. The default is 10 hung jobs.
Maximum number of jobs to monitor
Enter the maximum number of jobs that this Knowledge Script keeps track of at any given moment. By entering as small a number as is practical for your environment, you can fine-tune the amount of system resources that this script consumes. However, if the script reaches the maximum number of jobs, it will not keep track of any new jobs that start. Specify a value that is at least equal to or greater than the threshold you set.The default is 100 jobs.
Event severity Set the event severity level, from 1 to 40, to indicate the importance of the event. The default severity level is 5 (red event indicator).
Description How to Set It
Chapter 3 • ARCserve Knowledge Scripts 19

IncompleteJobsUse this Knowledge Script to check for incomplete ARCserve jobs and to return data about those jobs.
This script periodically scans the latest ARCserve Activity log file (ARCserve.log) for entries that indicate a job was incomplete. If, during any interval, the number of incomplete jobs found in the ARCserve.log file is greater than the threshold you set, an event is raised.
When an event is raised, the contents of the event detail message depend on whether you are also collecting data. When the Knowledge Script is collecting data, the event detail message reports the number of incomplete jobs. The data detail message contains the actual log entries. When the Knowledge Script is not collecting data, the event detail message returns all of the log entries related to incomplete jobs.
Resource ObjectsARCserve server, ARCserveIT server
Default ScheduleThe default interval for this script is Every hour.
Setting Parameter ValuesSet the following parameters as needed:
NoteIf both ARCserve and ARCserveIT are installed on the same computer, only the ARCserveIT jobs are monitored.
Description How to Set It
Event? Set to y to raise events. The default is y.
Collect data? Set to y to collect data for reports and graphs. If set to y, returns the number of incomplete jobs. The default is n.
Start with new entries? This parameter controls what the Knowledge Script does on its first iteration:• If set to y, this script does not scan existing entries on its first iteration, and
therefore does not raise events or collect data on its first iteration. On subsequent iterations, this script only scans the new entries that were written to the log file since the last monitoring interval.
• If set to n, this script scans all existing entries on its first iteration and therefore can raise events and collect data on its first iteration. On subsequent intervals, this script only scans the new entries that were written to the log file since the last monitoring interval.
The default is n.
Include • error messages?• warning messages?
Set either of these parameters to y to collect error and warning messages. This script always returns informational messages related to canceled jobs.
20 Management Guide

Maximum threshold for incomplete jobs
Enter the maximum number of incomplete jobs allowed during any monitoring interval before an event is raised. The default is 10 incomplete jobs.
Event severity Set the event severity level, from 1 to 40, to indicate the importance of the event. The default severity level is 5 (red event indicator).
Description How to Set It
Chapter 3 • ARCserve Knowledge Scripts 21
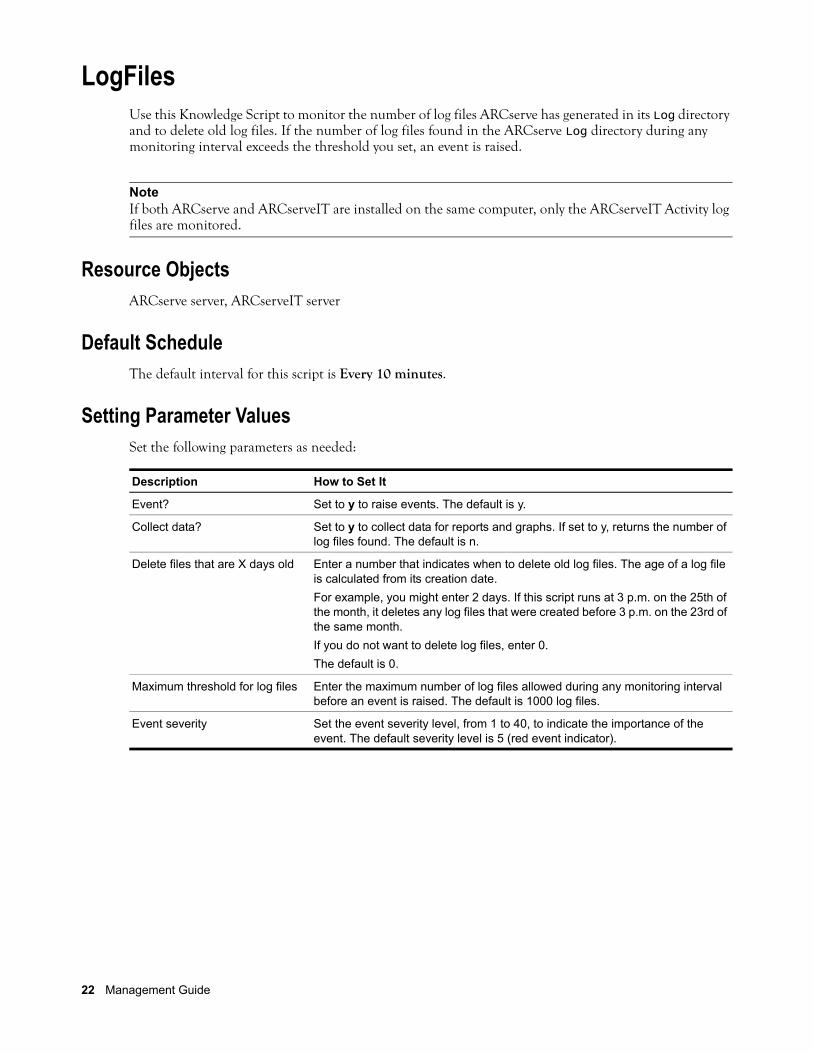
LogFilesUse this Knowledge Script to monitor the number of log files ARCserve has generated in its Log directory and to delete old log files. If the number of log files found in the ARCserve Log directory during any monitoring interval exceeds the threshold you set, an event is raised.
Resource ObjectsARCserve server, ARCserveIT server
Default ScheduleThe default interval for this script is Every 10 minutes.
Setting Parameter ValuesSet the following parameters as needed:
NoteIf both ARCserve and ARCserveIT are installed on the same computer, only the ARCserveIT Activity log files are monitored.
Description How to Set It
Event? Set to y to raise events. The default is y.
Collect data? Set to y to collect data for reports and graphs. If set to y, returns the number of log files found. The default is n.
Delete files that are X days old Enter a number that indicates when to delete old log files. The age of a log file is calculated from its creation date. For example, you might enter 2 days. If this script runs at 3 p.m. on the 25th of the month, it deletes any log files that were created before 3 p.m. on the 23rd of the same month. If you do not want to delete log files, enter 0. The default is 0.
Maximum threshold for log files Enter the maximum number of log files allowed during any monitoring interval before an event is raised. The default is 1000 log files.
Event severity Set the event severity level, from 1 to 40, to indicate the importance of the event. The default severity level is 5 (red event indicator).
22 Management Guide

Report_ActivityLogSizeUse this ARCserve_Report script to generate a report about the size of the ARCserve Activity log. This report lets you aggregate data by time period (minute, hour, or day) and calculate statistics for each period (for example, the average value per hour).
This report uses data collected by the ActivityLogSize Knowledge Script.
Resource ObjectsReport Agent > AM Repositories > AppManager for CA ARCserve repository
Default ScheduleThe default schedule is Run once.
Setting Parameter ValuesSet the following parameters as needed:
Description How to Set It
Data source Use the following parameters to select the data for your report.
Select computer(s) Click the Browse [...] button to start the data wizard. Use the data wizard to select the computers for your report.
Select time range Click the Browse [...] button to open the time browser. Set a specific or sliding time range for data included in your report.
Select peak weekday(s) Click the Browse [...] button to select the days of the week to include in your report.
Data settings Use the following parameters to define the statistical calculation applied to data, and which of the data is displayed.
Statistics to show Select a statistical method by which to display data in the report:• Average: The average value of data points for the aggregation interval (for
example, the average value for 1 Hour)• Minimum: The minimum value of data points for the aggregation interval• Maximum: The maximum value of data points for the aggregation interval• Min/Avg/Max: The minimum, average, and maximum values of data
points for the aggregation interval• Range: The range of values in the data stream (maximum - minimum =
range)• StandardDeviation: The measure of how widely values are dispersed
from the mean• Sum: The total value of data points for the aggregation interval• Close: The last value for the aggregation interval• Change: The difference between the first and last values for the
aggregation interval (close - open = change)• Count: The number of data points for the aggregation interval
Chapter 3 • ARCserve Knowledge Scripts 23

Select sorting/display option Select whether data is sorted, or the method of display:• No sort: Data is not sorted• Sort: Data is sorted by value (lowest to highest from front to back; highest
to lowest from left to right)• Top %: Chart only the top N % of selected data (sorted by default)• Top N: Chart only the top N of selected data (sorted by default)• Bottom %: Chart only the bottom N % of data (sorted by default)• Bottom N: Chart only the bottom N of selected data (sorted by default)
Percentage/count for top/bottom Enter a number for either the percent or count defined in the previous parameter (for example, Top 10%, or Top 10).The default is 25.
Truncate top/bottom? If set to yes, the data table shows only the top or bottom N or % (for example, only the top 10%).Otherwise, the table shows all data.The default is no.
Show totals on the table? If set to yes, additional calculations are made for each column of numbers in a table, and the following values are listed at the end of the table:
• Report Average: An average of all values in a column• Report Minimum: The minimum value in a column• Report Maximum: The maximum value in a column• Report Total: The total of all values in a column
The default is no.
Report settings Use the following parameters to define the graphical presentation of data, the folder where the report is generated, and properties that identify the report.
Include parameter help card? Set to yes to include a table in the report that lists parameter settings for the report script. The default is yes.
Include table? Set to yes to include a table of data stream values in the report. The default is yes.
Include chart? Set to yes to include a chart of data stream values in the report. The default is yes.
Select chart style Click the Browse [...] button to open the Chart Settings dialog box. Define the graphic properties of the charts in your report.
Select output folder Click the Browse [...] button to set parameters for the output folder.
Add job ID to output folder name?
Set to yes to append the job ID to the name of the output folder.This is helpful to make the correlation between a specific instance of a Report Script and the corresponding report.The default is no.
Select properties Click the Browse [...] button to open the Report Properties dialog box. Set the properties parameters as desired.
Add time stamp to title? Set to yes to append a timestamp to the title of the report, making each title unique. The timestamp is composed of the date and time the report was generated.Adding a timestamp is useful in order to run consecutive iterations of the same report without overwriting previous output.The default is no.
Description How to Set It
24 Management Guide
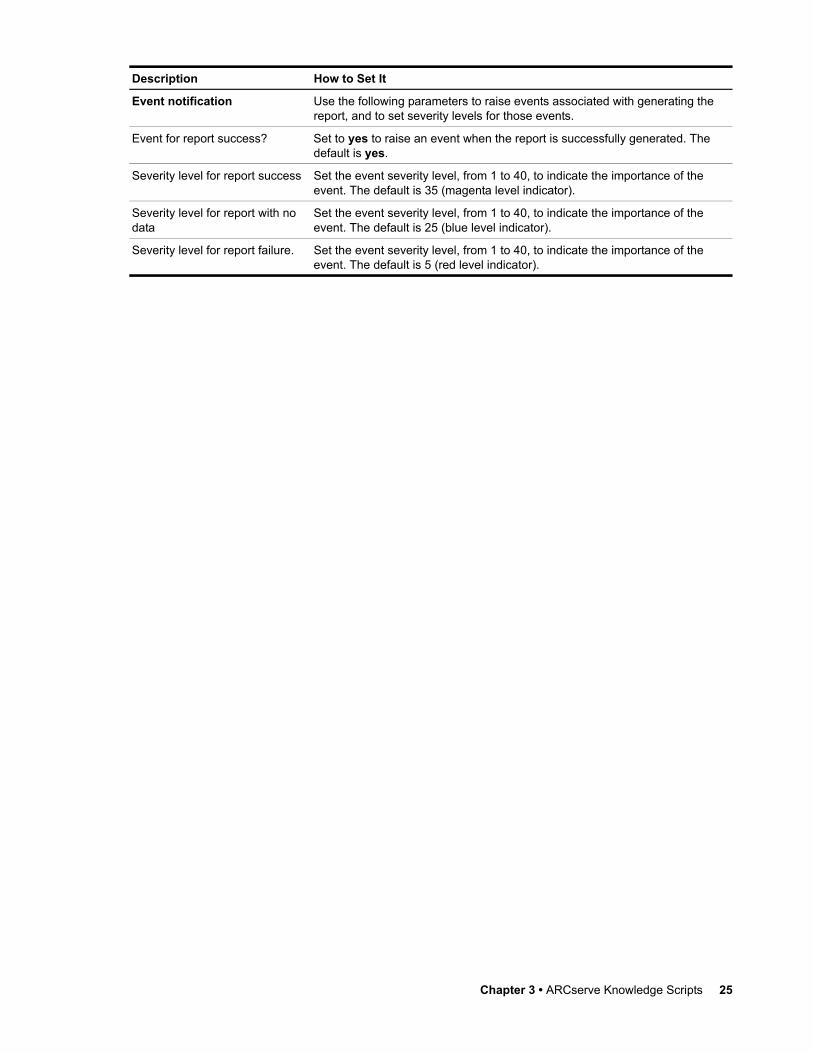
Event notification Use the following parameters to raise events associated with generating the report, and to set severity levels for those events.
Event for report success? Set to yes to raise an event when the report is successfully generated. The default is yes.
Severity level for report success Set the event severity level, from 1 to 40, to indicate the importance of the event. The default is 35 (magenta level indicator).
Severity level for report with no data
Set the event severity level, from 1 to 40, to indicate the importance of the event. The default is 25 (blue level indicator).
Severity level for report failure. Set the event severity level, from 1 to 40, to indicate the importance of the event. The default is 5 (red level indicator).
Description How to Set It
Chapter 3 • ARCserve Knowledge Scripts 25
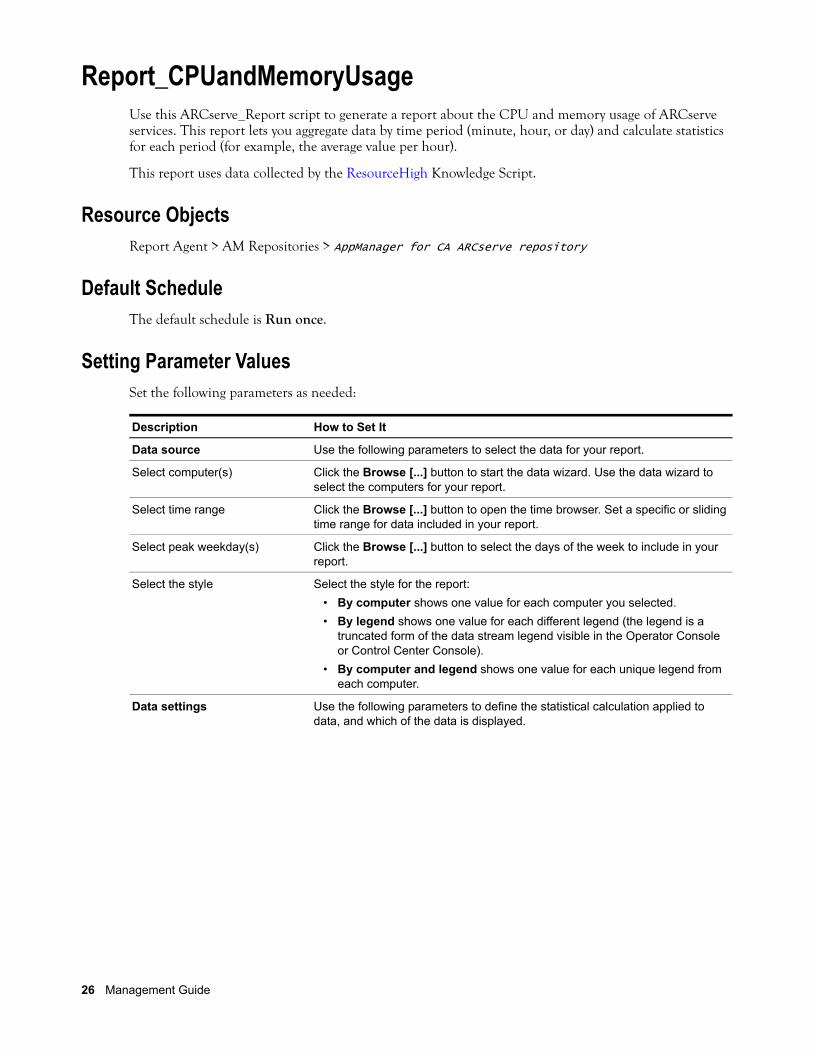
Report_CPUandMemoryUsageUse this ARCserve_Report script to generate a report about the CPU and memory usage of ARCserve services. This report lets you aggregate data by time period (minute, hour, or day) and calculate statistics for each period (for example, the average value per hour).
This report uses data collected by the ResourceHigh Knowledge Script.
Resource ObjectsReport Agent > AM Repositories > AppManager for CA ARCserve repository
Default ScheduleThe default schedule is Run once.
Setting Parameter ValuesSet the following parameters as needed:
Description How to Set It
Data source Use the following parameters to select the data for your report.
Select computer(s) Click the Browse [...] button to start the data wizard. Use the data wizard to select the computers for your report.
Select time range Click the Browse [...] button to open the time browser. Set a specific or sliding time range for data included in your report.
Select peak weekday(s) Click the Browse [...] button to select the days of the week to include in your report.
Select the style Select the style for the report:• By computer shows one value for each computer you selected.• By legend shows one value for each different legend (the legend is a
truncated form of the data stream legend visible in the Operator Console or Control Center Console).
• By computer and legend shows one value for each unique legend from each computer.
Data settings Use the following parameters to define the statistical calculation applied to data, and which of the data is displayed.
26 Management Guide
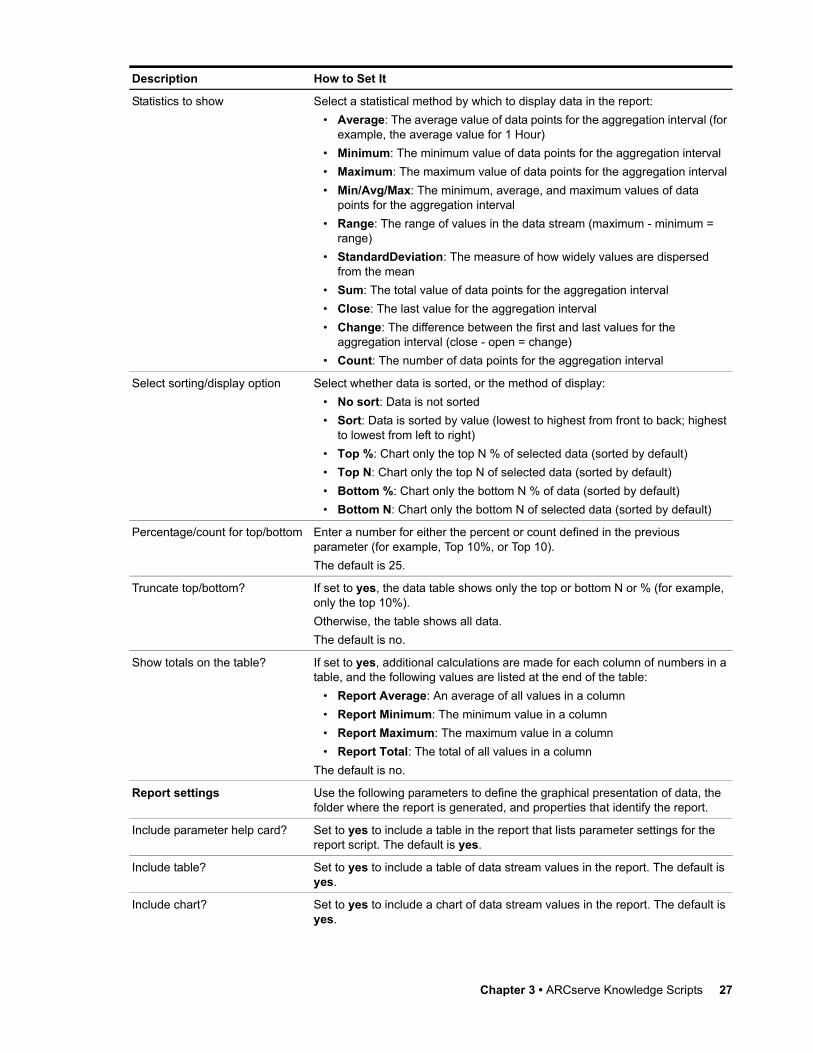
Statistics to show Select a statistical method by which to display data in the report:• Average: The average value of data points for the aggregation interval (for
example, the average value for 1 Hour)• Minimum: The minimum value of data points for the aggregation interval• Maximum: The maximum value of data points for the aggregation interval• Min/Avg/Max: The minimum, average, and maximum values of data
points for the aggregation interval• Range: The range of values in the data stream (maximum - minimum =
range)• StandardDeviation: The measure of how widely values are dispersed
from the mean• Sum: The total value of data points for the aggregation interval• Close: The last value for the aggregation interval• Change: The difference between the first and last values for the
aggregation interval (close - open = change)• Count: The number of data points for the aggregation interval
Select sorting/display option Select whether data is sorted, or the method of display:• No sort: Data is not sorted• Sort: Data is sorted by value (lowest to highest from front to back; highest
to lowest from left to right)• Top %: Chart only the top N % of selected data (sorted by default)• Top N: Chart only the top N of selected data (sorted by default)• Bottom %: Chart only the bottom N % of data (sorted by default)• Bottom N: Chart only the bottom N of selected data (sorted by default)
Percentage/count for top/bottom Enter a number for either the percent or count defined in the previous parameter (for example, Top 10%, or Top 10).The default is 25.
Truncate top/bottom? If set to yes, the data table shows only the top or bottom N or % (for example, only the top 10%).Otherwise, the table shows all data.The default is no.
Show totals on the table? If set to yes, additional calculations are made for each column of numbers in a table, and the following values are listed at the end of the table:
• Report Average: An average of all values in a column• Report Minimum: The minimum value in a column• Report Maximum: The maximum value in a column• Report Total: The total of all values in a column
The default is no.
Report settings Use the following parameters to define the graphical presentation of data, the folder where the report is generated, and properties that identify the report.
Include parameter help card? Set to yes to include a table in the report that lists parameter settings for the report script. The default is yes.
Include table? Set to yes to include a table of data stream values in the report. The default is yes.
Include chart? Set to yes to include a chart of data stream values in the report. The default is yes.
Description How to Set It
Chapter 3 • ARCserve Knowledge Scripts 27

Select chart style Click the Browse [...] button to open the Chart Settings dialog box. Define the graphic properties of the charts in your report.
Select output folder Click in the Value column, and click the Browse [...] button to set parameters for the output folder.
Add job ID to output folder name?
Set to yes to append the job ID to the name of the output folder.This is helpful to make the correlation between a specific instance of a Report Script and the corresponding report.The default is no.
Select properties Click in the Value column, and click the Browse [...] button to open the Report Properties dialog box. Set the properties parameters as desired.
Add time stamp to title? Set to yes to append a timestamp to the title of the report, making each title unique. The timestamp is composed of the date and time the report was generated.Adding a timestamp is useful in order to run consecutive iterations of the same report without overwriting previous output.The default is no.
Event notification Use the following parameters to raise events associated with generating the report, and to set severity levels for those events.
Event for report success? Set to yes to raise an event when the report is successfully generated. The default is yes.
Severity level for report success Set the event severity level, from 1 to 40, to indicate the importance of the event. The default is 35 (magenta level indicator).
Severity level for report with no data
Set the event severity level, from 1 to 40, to indicate the importance of the event. The default is 25 (blue level indicator).
Severity level for report failure. Set the event severity level, from 1 to 40, to indicate the importance of the event. The default is 5 (red level indicator).
Description How to Set It
28 Management Guide
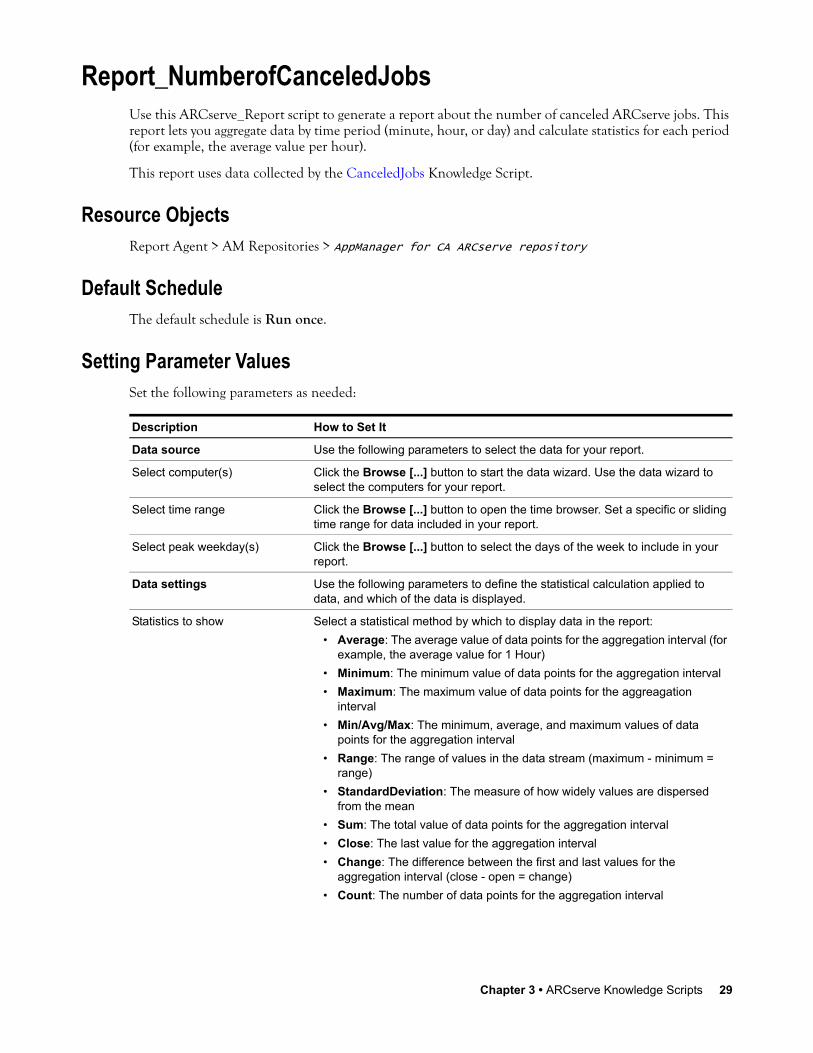
Report_NumberofCanceledJobsUse this ARCserve_Report script to generate a report about the number of canceled ARCserve jobs. This report lets you aggregate data by time period (minute, hour, or day) and calculate statistics for each period (for example, the average value per hour).
This report uses data collected by the CanceledJobs Knowledge Script.
Resource ObjectsReport Agent > AM Repositories > AppManager for CA ARCserve repository
Default ScheduleThe default schedule is Run once.
Setting Parameter ValuesSet the following parameters as needed:
Description How to Set It
Data source Use the following parameters to select the data for your report.
Select computer(s) Click the Browse [...] button to start the data wizard. Use the data wizard to select the computers for your report.
Select time range Click the Browse [...] button to open the time browser. Set a specific or sliding time range for data included in your report.
Select peak weekday(s) Click the Browse [...] button to select the days of the week to include in your report.
Data settings Use the following parameters to define the statistical calculation applied to data, and which of the data is displayed.
Statistics to show Select a statistical method by which to display data in the report:• Average: The average value of data points for the aggregation interval (for
example, the average value for 1 Hour)• Minimum: The minimum value of data points for the aggregation interval• Maximum: The maximum value of data points for the aggreagation
interval• Min/Avg/Max: The minimum, average, and maximum values of data
points for the aggregation interval• Range: The range of values in the data stream (maximum - minimum =
range)• StandardDeviation: The measure of how widely values are dispersed
from the mean• Sum: The total value of data points for the aggregation interval• Close: The last value for the aggregation interval• Change: The difference between the first and last values for the
aggregation interval (close - open = change)• Count: The number of data points for the aggregation interval
Chapter 3 • ARCserve Knowledge Scripts 29
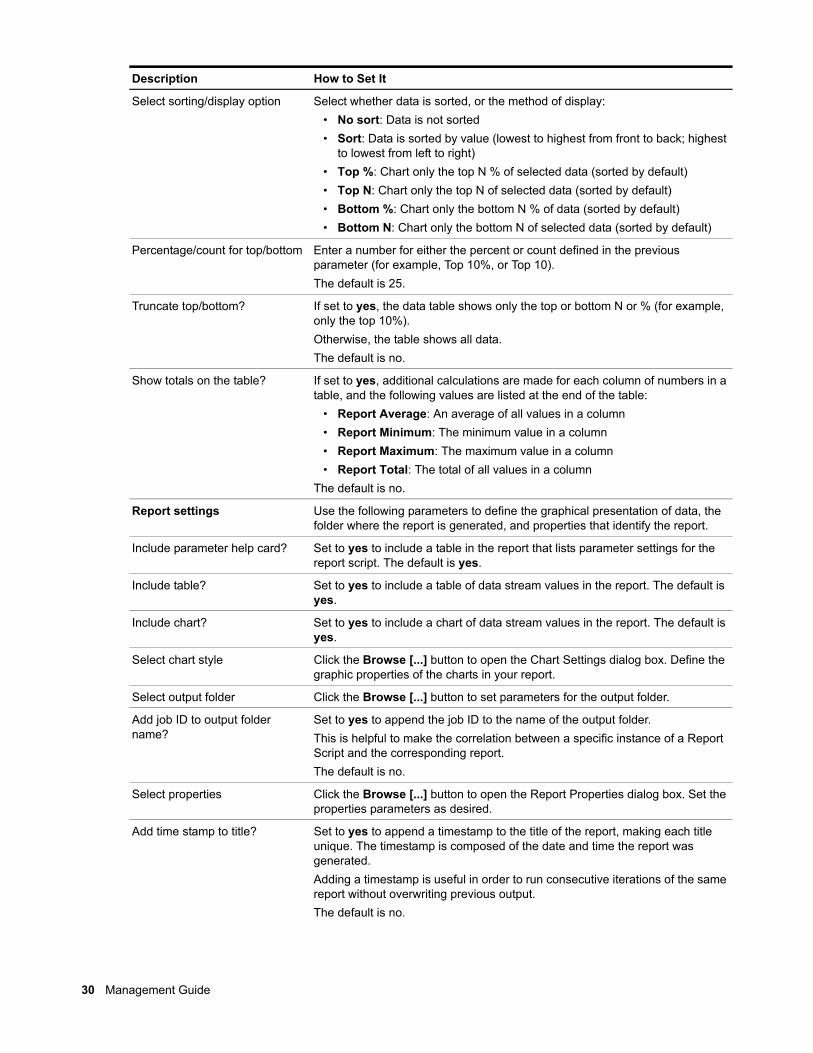
Select sorting/display option Select whether data is sorted, or the method of display:• No sort: Data is not sorted• Sort: Data is sorted by value (lowest to highest from front to back; highest
to lowest from left to right)• Top %: Chart only the top N % of selected data (sorted by default)• Top N: Chart only the top N of selected data (sorted by default)• Bottom %: Chart only the bottom N % of data (sorted by default)• Bottom N: Chart only the bottom N of selected data (sorted by default)
Percentage/count for top/bottom Enter a number for either the percent or count defined in the previous parameter (for example, Top 10%, or Top 10).The default is 25.
Truncate top/bottom? If set to yes, the data table shows only the top or bottom N or % (for example, only the top 10%).Otherwise, the table shows all data.The default is no.
Show totals on the table? If set to yes, additional calculations are made for each column of numbers in a table, and the following values are listed at the end of the table:
• Report Average: An average of all values in a column• Report Minimum: The minimum value in a column• Report Maximum: The maximum value in a column• Report Total: The total of all values in a column
The default is no.
Report settings Use the following parameters to define the graphical presentation of data, the folder where the report is generated, and properties that identify the report.
Include parameter help card? Set to yes to include a table in the report that lists parameter settings for the report script. The default is yes.
Include table? Set to yes to include a table of data stream values in the report. The default is yes.
Include chart? Set to yes to include a chart of data stream values in the report. The default is yes.
Select chart style Click the Browse [...] button to open the Chart Settings dialog box. Define the graphic properties of the charts in your report.
Select output folder Click the Browse [...] button to set parameters for the output folder.
Add job ID to output folder name?
Set to yes to append the job ID to the name of the output folder.This is helpful to make the correlation between a specific instance of a Report Script and the corresponding report.The default is no.
Select properties Click the Browse [...] button to open the Report Properties dialog box. Set the properties parameters as desired.
Add time stamp to title? Set to yes to append a timestamp to the title of the report, making each title unique. The timestamp is composed of the date and time the report was generated.Adding a timestamp is useful in order to run consecutive iterations of the same report without overwriting previous output.The default is no.
Description How to Set It
30 Management Guide

Event notification Use the following parameters to raise events associated with generating the report, and to set severity levels for those events.
Event for report success? Set to yes to raise an event when the report is successfully generated. The default is yes.
Severity level for report success Set the event severity level, from 1 to 40, to indicate the importance of the event. The default is 35 (magenta level indicator).
Severity level for report with no data
Set the event severity level, from 1 to 40, to indicate the importance of the event. The default is 25 (blue level indicator).
Severity level for report failure. Set the event severity level, from 1 to 40, to indicate the importance of the event. The default is 5 (red level indicator).
Description How to Set It
Chapter 3 • ARCserve Knowledge Scripts 31

Report_NumberofFailedJobsUse this ARCserve_Report script to generate a report about the number of failed ARCserve jobs. This report lets you aggregate data by time period (minute, hour, or day) and calculate statistics for each period (for example, the average value per hour).
This report uses data collected by the FailedJobs Knowledge Script.
Resource ObjectsReport Agent > AM Repositories > AppManager for CA ARCserve repository
Default ScheduleThe default schedule is Run once.
Setting Parameter ValuesSet the following parameters as needed:
Description How to Set It
Data source Use the following parameters to select the data for your report.
Select computer(s) Click the Browse [...] button to start the data wizard. Use the data wizard to select the computers for your report.
Select time range Click the Browse [...] button to open the time browser. Set a specific or sliding time range for data included in your report.
Select peak weekday(s) Click the Browse [...] button to select the days of the week to include in your report.
Data settings Use the following parameters to define the statistical calculation applied to data, and which of the data is displayed.
Statistics to show Select a statistical method by which to display data in the report:• Average: The average value of data points for the aggregation interval (for
example, the average value for 1 Hour)• Minimum: The minimum value of data points for the aggregation interval• Maximum: The maximum value of data points for the aggregation interval• Min/Avg/Max: The minimum, average, and maximum values of data
points for the aggregation interval• Range: The range of values in the data stream (maximum - minimum =
range)• StandardDeviation: The measure of how widely values are dispersed
from the mean• Sum: The total value of data points for the aggregation interval• Close: The last value for the aggregation interval• Change: The difference between the first and last values for the
aggregation interval (close - open = change)• Count: The number of data points for the aggregation interval
32 Management Guide

Select sorting/display option Select whether data is sorted, or the method of display:• No sort: Data is not sorted• Sort: Data is sorted by value (lowest to highest from front to back; highest
to lowest from left to right)• Top %: Chart only the top N % of selected data (sorted by default)• Top N: Chart only the top N of selected data (sorted by default)• Bottom %: Chart only the bottom N % of data (sorted by default)• Bottom N: Chart only the bottom N of selected data (sorted by default)
Percentage/count for top/bottom Enter a number for either the percent or count defined in the previous parameter (for example, Top 10%, or Top 10).The default is 25.
Truncate top/bottom? If set to yes, the data table shows only the top or bottom N or % (for example, only the top 10%).Otherwise, the table shows all data.The default is no.
Show totals on the table? If set to yes, additional calculations are made for each column of numbers in a table, and the following values are listed at the end of the table:
• Report Average: An average of all values in a column• Report Minimum: The minimum value in a column• Report Maximum: The maximum value in a column• Report Total: The total of all values in a column
The default is no.
Report settings Use the following parameters to define the graphical presentation of data, the folder where the report is generated, and properties that identify the report.
Include parameter help card? Set to yes to include a table in the report that lists parameter settings for the report script. The default is yes.
Include table? Set to yes to include a table of data stream values in the report. The default is yes.
Include chart? Set to yes to include a chart of data stream values in the report. The default is yes.
Select chart style Click the Browse [...] button to open the Chart Settings dialog box. Define the graphic properties of the charts in your report.
Select output folder Click the Browse [...] button to set parameters for the output folder.
Add job ID to output folder name?
Set to yes to append the job ID to the name of the output folder.This is helpful to make the correlation between a specific instance of a Report Script and the corresponding report.The default is no.
Select properties Click the Browse [...] button to open the Report Properties dialog box. Set the properties parameters as desired.
Add time stamp to title? Set to yes to append a timestamp to the title of the report, making each title unique. The timestamp is composed of the date and time the report was generated.Adding a timestamp is useful in order to run consecutive iterations of the same report without overwriting previous output.The default is no.
Description How to Set It
Chapter 3 • ARCserve Knowledge Scripts 33

Event notification Use the following parameters to raise events associated with generating the report, and to set severity levels for those events.
Event for report success? Set to yes to raise an event when the report is successfully generated. The default is yes.
Severity level for report success Set the event severity level, from 1 to 40, to indicate the importance of the event. The default is 35 (magenta level indicator).
Severity level for report with no data
Set the event severity level, from 1 to 40, to indicate the importance of the event. The default is 25 (blue level indicator).
Severity level for report failure. Set the event severity level, from 1 to 40, to indicate the importance of the event. The default is 5 (red level indicator).
Description How to Set It
34 Management Guide

Report_NumberofIncompleteJobsUse this ARCserve_Report script to generate a report about the number of incomplete ARCserve jobs. This report lets you aggregate data by time period (minute, hour, or day) and calculate statistics for each period (for example, the average value per hour).
This report uses data collected by the IncompleteJobs Knowledge Script.
Resource ObjectsReport Agent > AM Repositories > AppManager for CA ARCserve repository
Default ScheduleThe default schedule is Run once.
Setting Parameter ValuesSet the following parameters as needed:
Description How to Set It
Data source Use the following parameters to select the data for your report.
Select computer(s) Click the Browse [...] button to start the data wizard. Use the data wizard to select the computers for your report.
Select time range Click the Browse [...] button to open the time browser. Set a specific or sliding time range for data included in your report.
Select peak weekday(s) Click the Browse [...] button to select the days of the week to include in your report.
Data settings Use the following parameters to define the statistical calculation applied to data, and which of the data is displayed.
Statistics to show Select a statistical method by which to display data in the report:• Average: The average value of data points for the aggregation interval (for
example, the average value for 1 Hour)• Minimum: The minimum value of data points for the aggregation interval• Maximum: The maximum value of data points for the aggregation interval• Min/Avg/Max: The minimum, average, and maximum values of data
points for the aggregation interval• Range: The range of values in the data stream (maximum - minimum =
range)• StandardDeviation: The measure of how widely values are dispersed
from the mean• Sum: The total value of data points for the aggregation interval• Close: The last value for the aggregation interval• Change: The difference between the first and last values for the
aggregation interval (close - open = change)• Count: The number of data points for the aggregation interval
Chapter 3 • ARCserve Knowledge Scripts 35

Select sorting/display option Select whether data is sorted, or the method of display:• No sort: Data is not sorted• Sort: Data is sorted by value (lowest to highest from front to back; highest
to lowest from left to right)• Top %: Chart only the top N % of selected data (sorted by default)• Top N: Chart only the top N of selected data (sorted by default)• Bottom %: Chart only the bottom N % of data (sorted by default)• Bottom N: Chart only the bottom N of selected data (sorted by default)
Percentage/count for top/bottom Enter a number for either the percent or count defined in the previous parameter (for example, Top 10%, or Top 10).The default is 25.
Truncate top/bottom? If set to yes, the data table shows only the top or bottom N or % (for example, only the top 10%).Otherwise, the table shows all data.The default is no.
Show totals on the table? If set to yes, additional calculations are made for each column of numbers in a table, and the following values are listed at the end of the table:
• Report Average: An average of all values in a column• Report Minimum: The minimum value in a column• Report Maximum: The maximum value in a column• Report Total: The total of all values in a column
The default is no.
Report settings Use the following parameters to define the graphical presentation of data, the folder where the report is generated, and properties that identify the report.
Include parameter help card? Set to yes to include a table in the report that lists parameter settings for the report script. The default is yes.
Include table? Set to yes to include a table of data stream values in the report. The default is yes.
Include chart? Set to yes to include a chart of data stream values in the report. The default is yes.
Select chart style Click the Browse [...] button to open the Chart Settings dialog box. Define the graphic properties of the charts in your report.
Select output folder Click the Browse [...] button to set parameters for the output folder.
Add job ID to output folder name?
Set to yes to append the job ID to the name of the output folder.This is helpful to make the correlation between a specific instance of a Report Script and the corresponding report.The default is no.
Select properties Click the Browse [...] button to open the Report Properties dialog box. Set the properties parameters as desired.
Add time stamp to title? Set to yes to append a timestamp to the title of the report, making each title unique. The timestamp is composed of the date and time the report was generated.Adding a timestamp is useful in order to run consecutive iterations of the same report without overwriting previous output.The default is no.
Description How to Set It
36 Management Guide

Event notification Use the following parameters to raise events associated with generating the report, and to set severity levels for those events.
Event for report success? Set to yes to raise an event when the report is successfully generated. The default is yes.
Severity level for report success Set the event severity level, from 1 to 40, to indicate the importance of the event. The default is 35 (magenta level indicator).
Severity level for report with no data
Set the event severity level, from 1 to 40, to indicate the importance of the event. The default is 25 (blue level indicator).
Severity level for report failure. Set the event severity level, from 1 to 40, to indicate the importance of the event. The default is 5 (red level indicator).
Description How to Set It
Chapter 3 • ARCserve Knowledge Scripts 37

Report_NumberofSuccessfulJobsUse this ARCserve_Report script to generate a report about the number of successful ARCserve jobs. This report lets you aggregate data by time period (minute, hour, or day) and calculate statistics for each period (for example, the average value per hour).
This report uses data collected by the SuccessfulJobs Knowledge Script.
Resource ObjectsReport Agent > AM Repositories > AppManager for CA ARCserve repository
Default ScheduleThe default schedule is Run once.
Setting Parameter ValuesSet the following parameters as needed:
Description How to Set It
Data source Use the following parameters to select the data for your report.
Select computer(s) Click the Browse [...] button to start the data wizard. Use the data wizard to select the computers for your report.
Select time range Click the Browse [...] button to open the time browser. Set a specific or sliding time range for data included in your report.
Select peak weekday(s) Click the Browse [...] button to select the days of the week to include in your report.
Data settings Use the following parameters to define the statistical calculation applied to data, and which of the data is displayed.
Statistics to show Select a statistical method by which to display data in the report:• Average: The average value of data points for the aggregation interval (for
example, the average value for 1 Hour)• Minimum: The minimum value of data points for the aggregation interval• Maximum: The maximum value of data points for the aggreagation
interval• Min/Avg/Max: The minimum, average, and maximum values of data
points for the aggregation interval• Range: The range of values in the data stream (maximum - minimum =
range)• StandardDeviation: The measure of how widely values are dispersed
from the mean• Sum: The total value of data points for the aggreagation interval• Close: The last value for the aggregation interval• Change: The difference between the first and last values for the
aggregation interval (close - open = change)• Count: The number of data points for the aggregation interval
38 Management Guide

Select sorting/display option Select whether data is sorted, or the method of display:• No sort: Data is not sorted• Sort: Data is sorted by value (lowest to highest from front to back; highest
to lowest from left to right)• Top %: Chart only the top N % of selected data (sorted by default)• Top N: Chart only the top N of selected data (sorted by default)• Bottom %: Chart only the bottom N % of data (sorted by default)• Bottom N: Chart only the bottom N of selected data (sorted by default)
Percentage/count for top/bottom Enter a number for either the percent or count defined in the previous parameter (for example, Top 10%, or Top 10).The default is 25.
Truncate top/bottom? If set to yes, the data table shows only the top or bottom N or % (for example, only the top 10%).Otherwise, the table shows all data.The default is no.
Show totals on the table? If set to yes, additional calculations are made for each column of numbers in a table, and the following values are listed at the end of the table:
• Report Average: An average of all values in a column• Report Minimum: The minimum value in a column• Report Maximum: The maximum value in a column• Report Total: The total of all values in a column
The default is no.
Report settings Use the following parameters to define the graphical presentation of data, the folder where the report is generated, and properties that identify the report.
Include parameter help card? Set to yes to include a table in the report that lists parameter settings for the report script. The default is yes.
Include table? Set to yes to include a table of data stream values in the report. The default is yes.
Include chart? Set to yes to include a chart of data stream values in the report. The default is yes.
Select chart style Click the Browse [...] button to open the Chart Settings dialog box. Define the graphic properties of the charts in your report.
Select output folder Click the Browse [...] button to set parameters for the output folder.
Add job ID to output folder name?
Set to yes to append the job ID to the name of the output folder.This is helpful to make the correlation between a specific instance of a Report Script and the corresponding report.The default is no.
Select properties Click the Browse [...] button to open the Report Properties dialog box. Set the properties parameters as desired.
Add time stamp to title? Set to yes to append a timestamp to the title of the report, making each title unique. The timestamp is composed of the date and time the report was generated.Adding a time stamp is useful in order to run consecutive iterations of the same report without overwriting previous output.The default is no.
Description How to Set It
Chapter 3 • ARCserve Knowledge Scripts 39

Event notification Use the following parameters to raise events associated with generating the report, and to set severity levels for those events.
Event for report success? Set to yes to raise an event when the report is successfully generated. The default is yes.
Severity level for report success Set the event severity level, from 1 to 40, to indicate the importance of the event. The default is 35 (magenta level indicator).
Severity level for report with no data
Set the event severity level, from 1 to 40, to indicate the importance of the event. The default is 25 (blue level indicator).
Severity level for report failure. Set the event severity level, from 1 to 40, to indicate the importance of the event. The default is 5 (red level indicator).
Description How to Set It
40 Management Guide
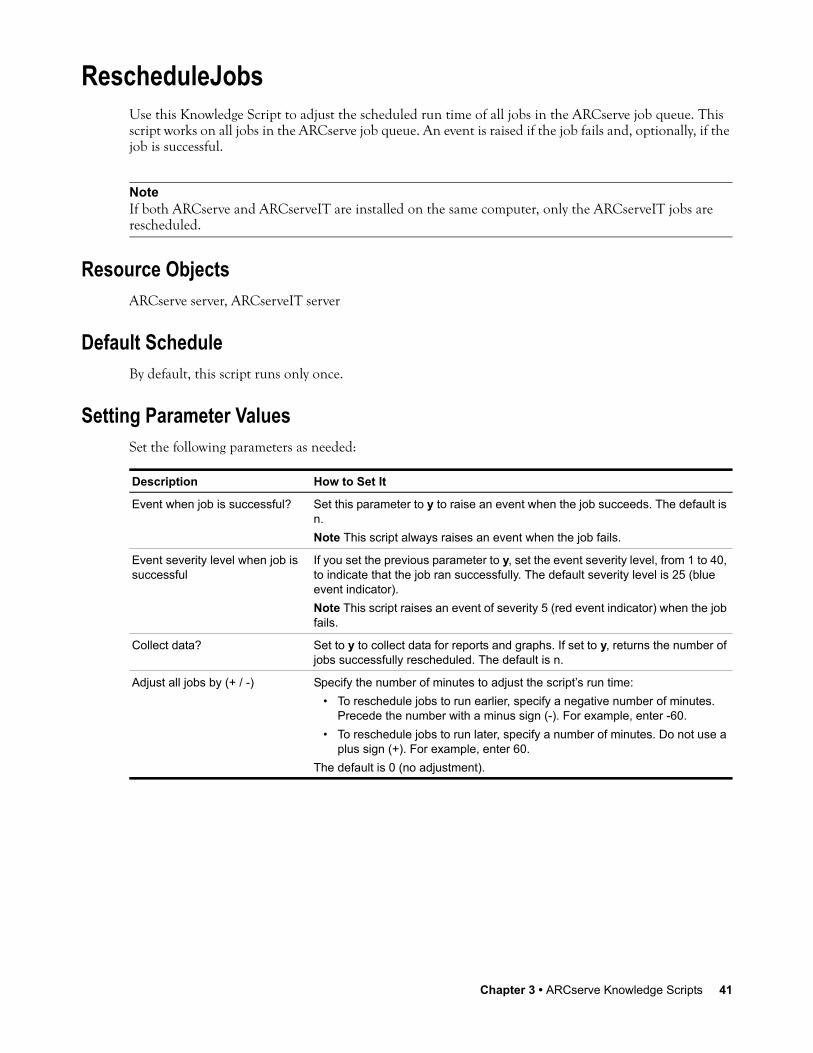
RescheduleJobsUse this Knowledge Script to adjust the scheduled run time of all jobs in the ARCserve job queue. This script works on all jobs in the ARCserve job queue. An event is raised if the job fails and, optionally, if the job is successful.
Resource ObjectsARCserve server, ARCserveIT server
Default ScheduleBy default, this script runs only once.
Setting Parameter ValuesSet the following parameters as needed:
NoteIf both ARCserve and ARCserveIT are installed on the same computer, only the ARCserveIT jobs are rescheduled.
Description How to Set It
Event when job is successful? Set this parameter to y to raise an event when the job succeeds. The default is n.Note This script always raises an event when the job fails.
Event severity level when job is successful
If you set the previous parameter to y, set the event severity level, from 1 to 40, to indicate that the job ran successfully. The default severity level is 25 (blue event indicator).Note This script raises an event of severity 5 (red event indicator) when the job fails.
Collect data? Set to y to collect data for reports and graphs. If set to y, returns the number of jobs successfully rescheduled. The default is n.
Adjust all jobs by (+ / -) Specify the number of minutes to adjust the script’s run time:• To reschedule jobs to run earlier, specify a negative number of minutes.
Precede the number with a minus sign (-). For example, enter -60.• To reschedule jobs to run later, specify a number of minutes. Do not use a
plus sign (+). For example, enter 60.The default is 0 (no adjustment).
Chapter 3 • ARCserve Knowledge Scripts 41

ResourceHighUse this Knowledge Script to monitor the CPU and memory utilization of the ARCserve services that were found on a managed client during discovery. Monitored ARCserve services include:
• Database engine (displayed as ASDBEngine in the TreeView)
• Job engine (ASJobEngine)
• Tape engine (ASTapeEngine)
• Discovery server (ASDiscoverySvc)
• Message engine (ASMsgEngine)
If you change the number of ARCserve services running on a managed client, run the ARCserve_Discovery Knowledge Script on that computer again.
You can set two thresholds: one for maximum CPU time and one for maximum memory utilization. If the CPU or memory utilization of any service exceeds the thresholds you set, an event is raised.
Resource ObjectsARCserve server, ARCserveIT server, individual ARCserve services
Default ScheduleThe default interval for this script is Every 10 minutes.
Setting Parameter ValuesSet the following parameters as needed:
Description How to Set It
Event? Set to y to raise events. The default is y.
Collect data? Set to y to collect data for reports and graphs. If set to y, returns the CPU usage and the memory usage for each service it is monitoring. The default is n.
CPU usage Enter the maximum amount of CPU resources that you want any single ARCserve service to consume before an event is raised. The default is 60%.
Memory usage Enter the maximum amount of memory that you want any single ARCserve service to consume before an event is raised. The default is 6 MB.
Event severity Set the event severity level, from 1 to 40, to indicate the importance of the event. The default severity level is 8 (red event indicator).
42 Management Guide
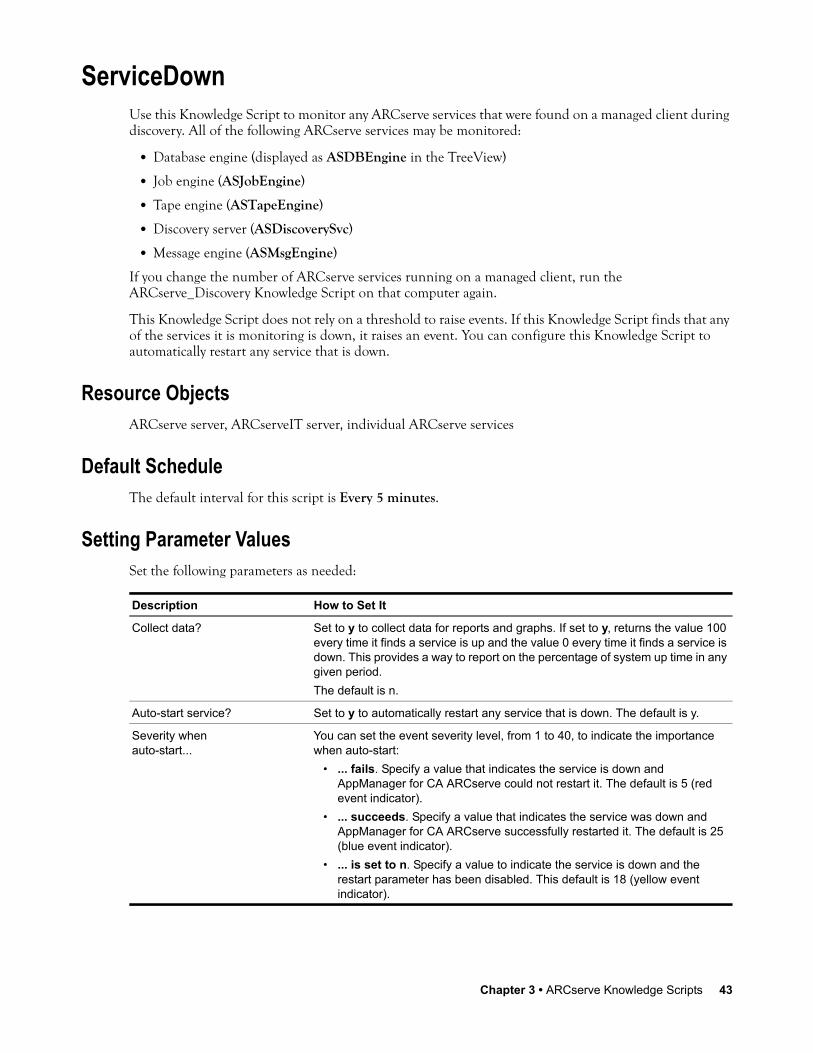
ServiceDownUse this Knowledge Script to monitor any ARCserve services that were found on a managed client during discovery. All of the following ARCserve services may be monitored:
• Database engine (displayed as ASDBEngine in the TreeView)
• Job engine (ASJobEngine)
• Tape engine (ASTapeEngine)
• Discovery server (ASDiscoverySvc)
• Message engine (ASMsgEngine)
If you change the number of ARCserve services running on a managed client, run the ARCserve_Discovery Knowledge Script on that computer again.
This Knowledge Script does not rely on a threshold to raise events. If this Knowledge Script finds that any of the services it is monitoring is down, it raises an event. You can configure this Knowledge Script to automatically restart any service that is down.
Resource ObjectsARCserve server, ARCserveIT server, individual ARCserve services
Default ScheduleThe default interval for this script is Every 5 minutes.
Setting Parameter ValuesSet the following parameters as needed:
Description How to Set It
Collect data? Set to y to collect data for reports and graphs. If set to y, returns the value 100 every time it finds a service is up and the value 0 every time it finds a service is down. This provides a way to report on the percentage of system up time in any given period. The default is n.
Auto-start service? Set to y to automatically restart any service that is down. The default is y.
Severity when auto-start...
You can set the event severity level, from 1 to 40, to indicate the importance when auto-start:
• ... fails. Specify a value that indicates the service is down and AppManager for CA ARCserve could not restart it. The default is 5 (red event indicator).
• ... succeeds. Specify a value that indicates the service was down and AppManager for CA ARCserve successfully restarted it. The default is 25 (blue event indicator).
• ... is set to n. Specify a value to indicate the service is down and the restart parameter has been disabled. This default is 18 (yellow event indicator).
Chapter 3 • ARCserve Knowledge Scripts 43
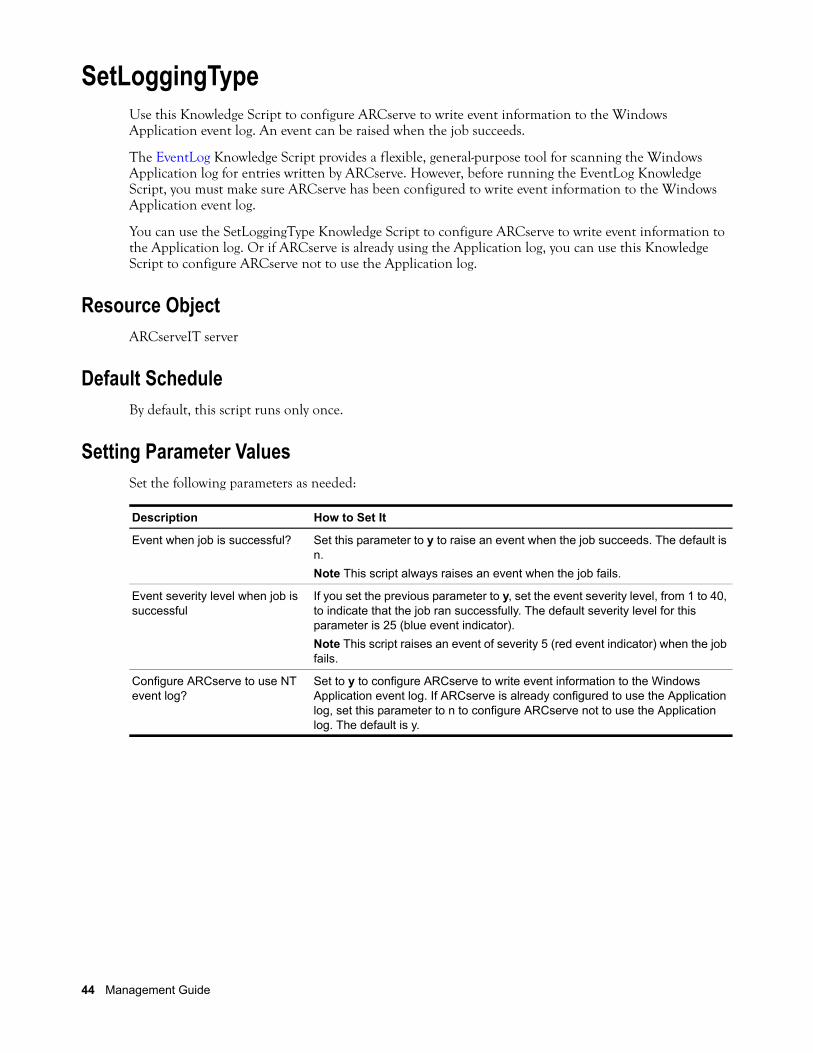
SetLoggingTypeUse this Knowledge Script to configure ARCserve to write event information to the Windows Application event log. An event can be raised when the job succeeds.
The EventLog Knowledge Script provides a flexible, general-purpose tool for scanning the Windows Application log for entries written by ARCserve. However, before running the EventLog Knowledge Script, you must make sure ARCserve has been configured to write event information to the Windows Application event log.
You can use the SetLoggingType Knowledge Script to configure ARCserve to write event information to the Application log. Or if ARCserve is already using the Application log, you can use this Knowledge Script to configure ARCserve not to use the Application log.
Resource ObjectARCserveIT server
Default ScheduleBy default, this script runs only once.
Setting Parameter ValuesSet the following parameters as needed:
Description How to Set It
Event when job is successful? Set this parameter to y to raise an event when the job succeeds. The default is n.Note This script always raises an event when the job fails.
Event severity level when job is successful
If you set the previous parameter to y, set the event severity level, from 1 to 40, to indicate that the job ran successfully. The default severity level for this parameter is 25 (blue event indicator).Note This script raises an event of severity 5 (red event indicator) when the job fails.
Configure ARCserve to use NT event log?
Set to y to configure ARCserve to write event information to the Windows Application event log. If ARCserve is already configured to use the Application log, set this parameter to n to configure ARCserve not to use the Application log. The default is y.
44 Management Guide

SuccessfulJobsUse this Knowledge Script to check for the number of successful ARCserve jobs and to return data about those jobs.
This script periodically scans the latest ARCserve Activity log file (ARCserve.log) for entries that indicate a job succeeded. During the first script iteration, this Knowledge Script does not scan existing entries in the log, and therefore does not return any results. As it continues to run at the interval specified on the Schedule tab, this script scans the ARCserve.log file for any new entries created since the last monitoring interval.
If, during any monitoring interval, the number of successful jobs found in the ARCserve.log file falls below the threshold you specify, an event is raised.
Resource ObjectsARCserve server, ARCserveIT server
Default ScheduleThe default interval for this script is Every hour.
Setting Parameter ValuesSet the following parameters as needed:
NoteIf both ARCserve and ARCserveIT are installed on the same computer, only the ARCserveIT jobs are monitored.
Description How to Set It
Event? Set to y to raise events. The default is y.
Collect data? Set to y to collect data for reports and graphs. If set to y, returns the number of successful jobs found. The default is n.
Minimum threshold for successful jobs
Specify the minimum number of successful jobs required during any interval to prevent an event from being raised. If the number of failed jobs is less than this threshold, an event is raised. The default is 10 successful.
Event severity Set the event severity level, from 1 to 40, to indicate the importance of the event. The default severity level is 5 (red event indicator).
Chapter 3 • ARCserve Knowledge Scripts 45

46 Management Guide