Applying PAT Principles
51
6/10/2011 1 Applying PAT Principles to Pharmaceutical Water Systems By Bob Livingston Ai Wt I IVT ACE: Philly June 23 , 2011 Arion Water, Inc. [email protected] Vocabulary • PAT – Process Analytical Technology • GAMP –Good Automated Manufacturing Practice • CCP- Critical Control Points • CQA- Critical Quality Attributes • MDA - Multi-Variant Data Analysis • DOE – Design of Experiments • DCS -Distributive Control System • HACCP - Hazard Analysis and Critical Control Points • FMEA – Failure Mode and Effects Analysis • FMECA – Failure Mode Effects and Criticality Analysis
Transcript of Applying PAT Principles

6/10/2011
1
Applying PAT Principlespp y g pto
Pharmaceutical Water Systems
By Bob LivingstonA i W t I
IVT ACE: Philly June 23 , 2011
Arion Water, [email protected]
Vocabulary • PAT – Process Analytical Technology• GAMP –Good Automated Manufacturing
Practice • CCP- Critical Control Points • CQA- Critical Quality Attributes • MDA - Multi-Variant Data Analysis• DOE – Design of Experiments • DCS -Distributive Control System • HACCP - Hazard Analysis and Critical
Control Points • FMEA – Failure Mode and Effects
Analysis • FMECA – Failure Mode Effects and
Criticality Analysis

6/10/2011
2
PAT - The Promise and the Problem
• PAT offers the promise of reducing or removingreducing or removing laboratory testing from the verification process and permitting real-time release of water for productionproduction
ASTM E-2500 -07
• New Regulatory expectationsp
• Dramatic reductions in the scope of validation now coming to a facility near you

6/10/2011
3
Verification replaces VALIDATION
• ASTM Standard E 2500 – 07• promotes a scientific
RISK BASED approach to Pharmaceutical FacilitiesPharmaceutical Facilities Processes, Utilities and Equipement
Verification is based upon RISK:-to the product
-and patient safety• Verification testing• Verification testing
assures the process or equipment is fit for the application
• The verification testing is gdetermined by the engineers, not just the QA/QC unit

6/10/2011
4
Verification is based upon RISK:-to the product
-and patient safety
• The level of verification testing and documentation is based
th RISKupon the RISK
The Problem
• Many USP Purified pharmaceutical water psystem designs may not be robust or reliable enough to qualify for PAT approval
Y t it– You cannot monitor a system into compliance

6/10/2011
5
PAT already exists-
• All continuous 24/7All continuous 24/7 utilities and processes in a Semiconductor production facility use PAT and PAI technology-
l b t t• no lab tests are administered 1
FDA PAT web site
• Timely measurement of raw materials and in
t i l dprocess materials and processes
• Analytical in PAT includes –chemical, physical, microbial,
th ti l d i kmathematical and risk analysis conducted in an integrated manner 2

6/10/2011
6
Industry: On-line analytical requirements 2
• Regulatory expectation• ReliabilityReliability• Analytical performance• Ease of use• Elimination of manual
errors
System Suitability test frequency
• For on-line instruments, it may be performed only y p yonce per year
• What if it failed?• Corroborating evidence
may be a necessity 2

6/10/2011
7
Real time release of data-• Computer, data acquisition,
process sensors, process analytical equipment (PAI) a a yt ca equ p e t ( )must be integrated in to a comprehensive management system.
• GAMP provides guidance in designing process control system.
• Not only monitoring- must have a control element involved-auto or manual
PAT (Process Understanding)
• CQA’s (Critical Quality Attributes))
– Identify– Monitor– Analyze– Control– Report

6/10/2011
8
The challenge in PAT
• Efficient management and effective analysis of ylarge amounts of streaming data, facilitating the correct response to changes
WFI Critical Quality Attributes (CQA’s)
• TOC• ConductivityConductivity• Temperature• Rapid Microbiological
Enumeration• On-line Endotoxin

6/10/2011
9
Multivariate data analysis
• Used to determine if any correlation exists between various combinations of the process inputs and critical quality attributes
Correlations-
• Mathematical relationships between in process measurement and critical quality attributes are critical to understanding the process, identifying data gaps, performing Design of Experiments and ultimatelyExperiments, and ultimately , developing feedback controls strategies to optimize the process. 3

6/10/2011
10
Design of Experiments (DOE)-
• Verifies correlations established via MVA (multivariate Analysis)
• Running experiments on water systems is not easy and may not be a good ideaidea 3
Demonstration-
• The analytical instrumentation
• the IT system• the statistical reporting
• With sufficient data to demonstrate reliable hardware/softwarehardware/software functionality, and establish a baseline of inter and intra batch variability 3

6/10/2011
11
Demonstration -
• Natural Variance Method• Useful for existing water
systems
• Imposed Variance Method– DOE
• Expanding Variance Method (The KernelMethod (The Kernel Approach) – Uses both of the above 3
Expanding Variance Method (The Kernel Approach) -
• Sufficient # of demo batches to correlate a range of variability smaller than the statistical model suggests could be employed (the kernel)
• If outside of kernel, in-process and final releaseprocess and final release testing must be added
• But then the kernel expands 3

6/10/2011
12
Monitoring and Control
• Monitor the analyzers– TOC, Temp and
Conductivity report to the Utilities DCS System
• The DCS system should be compatible with all the latest bus technologies (MODBUS fieldbus(MODBUS, fieldbus, profibus, 4-20 mA signals, etc.)
Monitoring and Control
• Data from all skids should be available on
l tfone platform• Phase in new sensors as
technology becomes proven– New analyzers may be
evaluated and added to the platform after successful validation

6/10/2011
13
PAT Dossier- consensus on-• Extent of experimentation• Interpretation of results• Accuracy of mathematical models• Accuracy of mathematical models• Capability and reliability of new
technology• Assessment of risks• Selection of CCP and CQA• Selection and placement of
analyzersanalyzers• Determination of endpoints and
process ranges• Design decisions
Change Procedures
• Risk assessments for Failures– Instrument failure– Hard/software failure– Adverse trends– Variation outside up/low
control limits• For likelihood, ability to
detect, and severity of failures 3

6/10/2011
14
Tools for Risk Assessment
• HACCP (say ”hassup”)
– Critical control pointp– Process input– Process Parameters– Process Output
– Critical Quality attribute– Use a Pareto Chart
• FMEA• FMECA
Analytical Tools-
• Spectroscopy-• (Vis, UV, NIR, X-ray, Turbidity,
Refractivity)Refractivity)
• Chromatography • (HPLC, GC, IC)
• Electrochemical• (pH, DO2, CO2, Conductivity, TOC)
• PhysicalPhysical• Particle count, temp, pressure,
flow)
• Wet Chemistry- in lab

6/10/2011
15
Create a PAT Project Plan 3
• Opportunity description• Scope- process and equipment• Scientific Rational
P D i ti• Process Description• Roles and responsibilities• Training• Benchmarking, Data Collection, Metrics,• IT requirements• Financial analysis • Validation strategy• Regulatory submission strategyRegulatory submission strategy• Implementation strategy• Project execution plan• Project Change Management
Critical Evaluation of USP Purified Water S t D iSystem Designs

6/10/2011
16
City Feed
• Potability required• Risk – Low to moderateRisk Low to moderate
– Historical data trending– Quality of potable feed is
of sufficient stability and quality to prevent risk to final product qualityfinal product quality
City feed on-line Monitoring
• Conductivity• Turbidityy• Temperature• Pressure• Flow
• Lab – Bioburden– Potability

6/10/2011
17
Pretreatment Functions
• Multi-media • Filtration
• Softener
• Carbon
• Hardness
• Oxidants• TOC
• Filters • Pump protection

6/10/2011
18
Multi media vessel
• Function- Filtration• Risk- Low to moderate• Instrument -turbidity(no good on-line SDI test) • Operation-
– Pressure dropFl t– Flow rates
• (Service and backwash)• Lab- Bioburden
Water Softener
• Function- Hardness Removal
• Risk- Low to moderate• Often non-critical
• Instrument- Hardness meter
• Operation– Brine level, flow rates,
pressure profile

6/10/2011
19
Carbon Bed• Function:
– Oxidant and TOC removal• Risk:• Risk:
– Moderate to High (for WFI only)• (Amines in Still or clean steam)
• Instrument : – Chlorine analyzer
• Operation:• Pressure dropPressure drop• Flow rates
– (Service and backwash)
• Lab- Bioburden
Pretreatment Performance • Low Risk for most
pretreatment functions not directly feeding WFIdirectly feeding WFI
• Consolidate allinstrumentation to monitor RO feed water only
• Pressure drop• Flow (service and backwash)• Conductivity• Conductivity• Turbidity• Hardness• Temperature • Oxidants (Total Chlorine, not ORP)

6/10/2011
20
Purification Technologies and Functions
• Risk : High(critical process step)(critical process step)
• Reverse Osmosis• Double Pass RO• EDI/CDI
Mi d B d I E h• Mixed Bed Ion Exchange• Or combination of above
Purification Functions
• Reverse Osmosis is a universal critical process pstep for Purified Water production
• > 95% ion reduction• >95% bacteria reduction• >95 % TOC reduction• >99 % Suspended Solids

6/10/2011
21
Primary RO Functions
• Risk : High to moderate• InstrumentationInstrumentation
– % Ion Rejection– TOC reduction
• Operation– Flow profiles
– Rates and totals
– Pressure profiles• Lab- bioburden

6/10/2011
22
Secondary Purification
• Risk : High to moderate• InstrumentationInstrumentation
– % Ion Rejection– TOC reduction
• Operation– Flow profiles
– Rates and totals
– Pressure profiles• Lab- bioburden
Design Matters
• Are we finished yet?• Often no additional
processing after storage is utilized
• Water System Design must be robust to utilize PAT approachespp
• Pharmaceutical water systems designs are not often robust

6/10/2011
23
Conventional Purified Design
• RO and CDI run continuously• TOC Control is insufficient• Water is never 18 MegΩ
• Will support microbiology
• No equipment after storage– Lose control of product water quality
• Routine Sanitization is Required

6/10/2011
24
Purified Plastic Design
• RO operates On /OFF as requiredq
• Process equipment in distribution loop
• 18 MegΩ water made and delivered
• But bacteria are often in product water– Must be sanitized
Storage
• Storage tanks cannot control microbiologygy– Attempts to do so will
prove frustrating• Water in storage is
essentially stagnantC t h ld• Counts should range from 1-20 cfu/mL
• Walls of tank should not feel slimy
6/10/2011
25
Water Storage
• PAT is not only monitoring- must strive to ghave a control element involved– auto or manual
• Sufficient control of prod ct ater q alit isproduct water quality is difficult to maintain in storage
Quality Process Design
• PAT benefits and results are best applied to high
lit b t d llquality, robust and well understood Process Designs
• Insufficient process expertise may be lacking i th d i h fin the design phase of some Pharmaceutical Processes
6/10/2011
26
FDA web site -PAT Guidance for Industry (Principles and Tools) 2
• These PAT tools used in a system can provide effective and efficient means ofand efficient means of acquiring info to facilitate process understanding, develop risk mitigation strategies, achieve continuous improvement,p ,and share knowledge.
• Must include two or more tools to be PAT
Postreatment equipment after storage is highly recommended
• Do not “lose control” of the high purity water g p yonce produced
• Add TOC control to distribution loop– TOC control=
microbiological controlmicrobiological control• Do not use regenerated
ion-X resin
6/10/2011
27
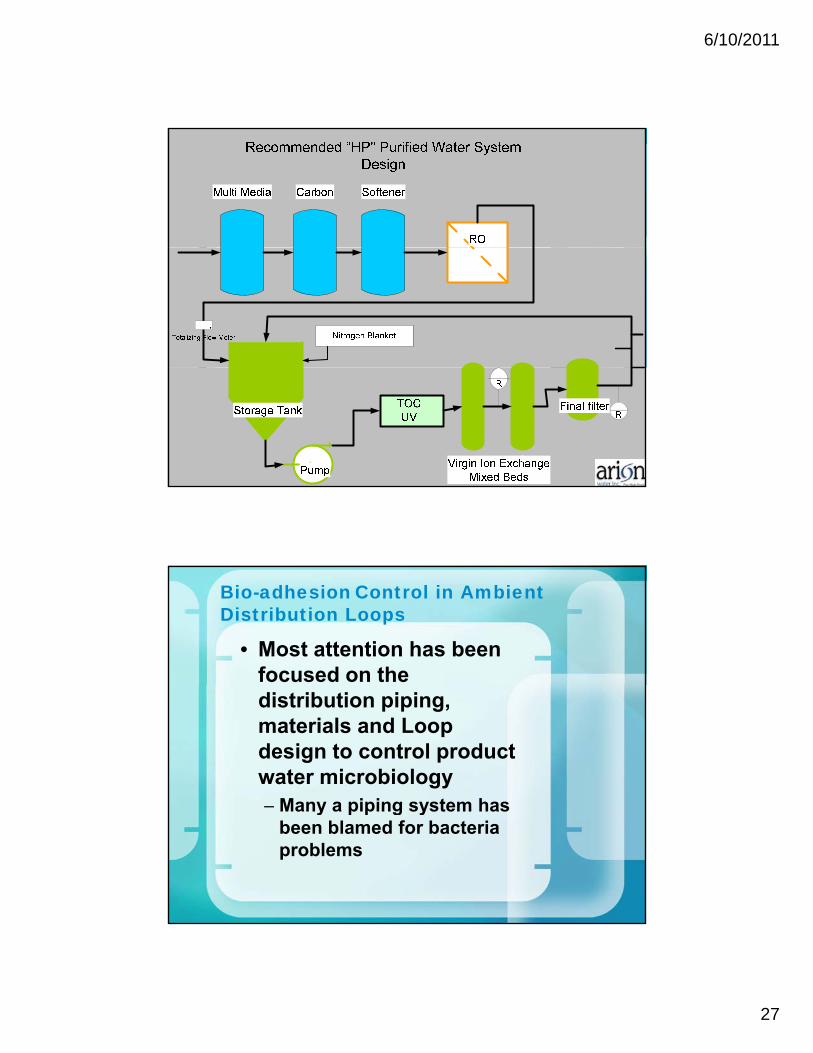
Bio-adhesion Control in Ambient Distribution Loops
• Most attention has been focused on the distribution piping, materials and Loop design to control product water microbiology
Many a piping system has– Many a piping system has been blamed for bacteria problems

6/10/2011
28
Product Water Quality controls microbiology
A properly designed water system will control bacteria in ambient distribution loops via :distribution loops via :
• Inoculation Prevention• Nutrient deprivation
– Both of which are functions of the water system design, not the distribution piping design
Robust Design facilitates “Real Time Release”
• Water quality exceeds specifications by orders p yof magnitude
• Reduced maintenance requirements ensure reliable operation

6/10/2011
29
Post Treatment Design
• Ambient temperature water systems must have yhigh product water quality with no fluctuations
• Post Treatment Equipment permitsEquipment permits precise product water quality control
TOC UV Irradiation
• Function: Microbial and TOC control
• Risk: Low • (high reliability)
• Instrumentation:– UV Monitor– (On-line TOC not required
until final product)

6/10/2011
30
Mixed Bed Ion Exchange
• Function: Trace impurity removal– (ionic, CO2, microbial,
endotoxin, particles, silica)• Risk: Moderate to low
• Due to redundant operation
Instrumentation:• Instrumentation:• Resistivity probe
• Lab: Bioburden
Final Filtration
• Function: Backup particulate removalp
• Risk: Low • (high reliability at this stage)
• Instrumentation:– Pressure drop and
di t ib ti fl tdistribution flow rate

6/10/2011
31
Real-time Release of Product Water for Production e

6/10/2011
32
Product Water
• USP Purified Specs – Conductivityy– TOC– Microbio – Endotoxin
• A common risk is permitting Carbon Dioxide in product water
Product Water Critical Quality Attributes (CQA)
• Microbiology• ConductivityConductivity• Endotoxin• TOC• Flow • PressurePressure• Temperature • Particle Counts

6/10/2011
33
Validate after Changes ?
• If the changes will result in little or no risk to the
d t t CQA’product water CQA’s, or even improvement or increase in reliability,
• NO re-validation of the system is required.
• A change control with continued monitoring will suffice!
Final Product Water Quality
• Meet final product water quality specification with q y proom to spare with no evidence of trending at all towards regulatory specifications

6/10/2011
34
TEST ATTAINABLE ACCEPTABLE
ALERT
CRITICAL PURIFIED WFI
Conductivity
Resistivity (MegOhm) @ 25 C
0.055
(18.2)
0.10(17.9)
>0.5
(<17.5)
>1.0
(<1.0)
<1.0 <1.0
TOC (ppb) Off Line (grab sample)
<10 < 50 >50 >300 <500 <500
TOC (ppb)On Line - Instrument
<2 <10 >100 >300 <500 <500
Bacteria (CFU)Count / 10 L sample
Count / 1000 mL sampleCount / 100 mL sample
Count / 1 -ml
<1<1<1<1
<100<10<1
>100>10>1>1
>500>50>5>1
1 Million100K
10,000**100**
1,00010010<1
<1
Endotoxin (by LAL)Units: EU (Endotoxin Units)
<0.001 <0.001 0.005 >0.10 N/A 0.25
Silica (ppb) dissolved(For information purposes only)
<3 <5 >25 N/A N/A
Required future on-line testing-1
• Endotoxin • Microbial enumerationMicrobial enumeration• Microbial Identification• Ion chromatography
– Will be on-line or at-line
6/10/2011
35
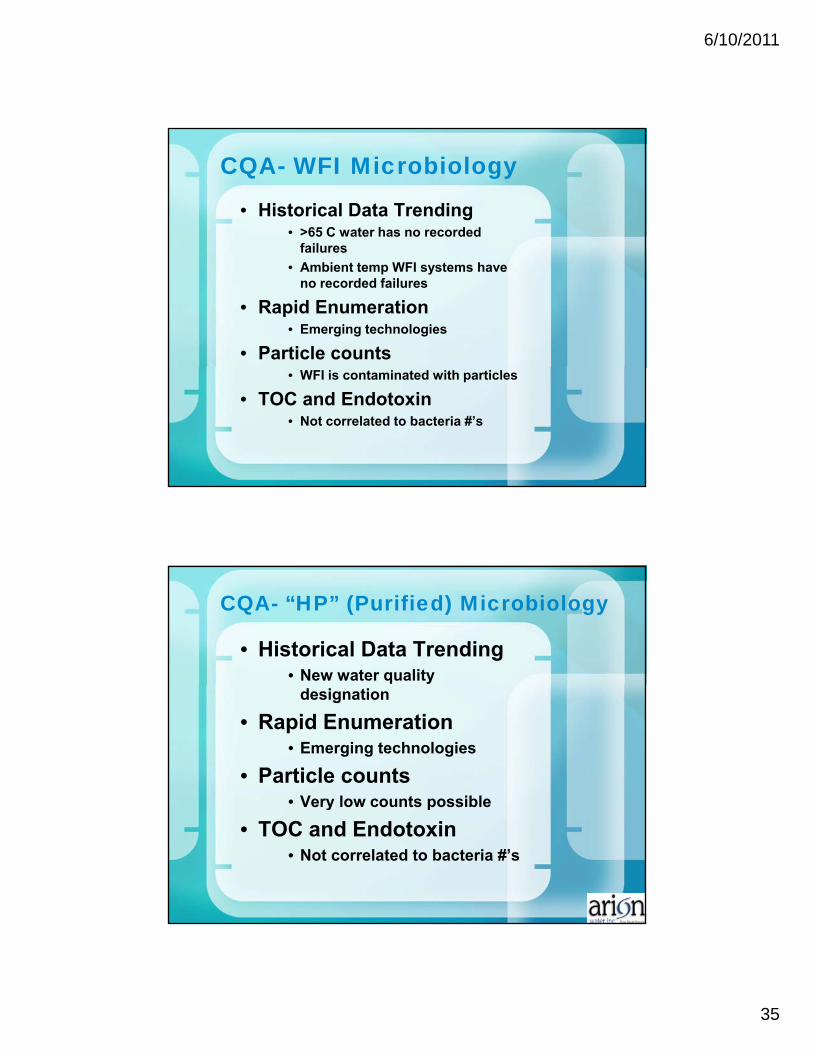
CQA- WFI Microbiology
• Historical Data Trending• >65 C water has no recorded
failuresfailures• Ambient temp WFI systems have
no recorded failures
• Rapid Enumeration• Emerging technologies
• Particle counts• WFI is contaminated with particles
• TOC and Endotoxin• Not correlated to bacteria #’s
CQA- “HP” (Purified) Microbiology
• Historical Data Trending• New water quality
designation
• Rapid Enumeration• Emerging technologies
• Particle counts• Very low counts possibleVery low counts possible
• TOC and Endotoxin• Not correlated to bacteria #’s

6/10/2011
36
CQA – Conductivity, TOC, Endotoxin
• Standard Pharmaceutical design not robust enough
– No post treatment
• Conductivity fluctuates from 0.9 – 1.3uS with occasional excursions
• TOC fluctuates and often t l h tnot low enough to
provide microbial inhibition
Robust HP Purified Design
• Post treatment equipment in distribution loopp
• On-line Conductivity does not fluctuate (0.05 uS)
• On-line TOC does not fluctuate
• 5- 1 ppb without excursions
• Endotoxin does not fluctuate <0.001EU
6/10/2011
37
Product Water Operational Parameters
• Product Flow and Pressure
• (outgoing and return)
• Product Particle Counts• (return water for worst case)• Correlate with lab bioburden
Multivariate Data Analysis-3
• Process understanding and historical data may ybe used to build models to predict in process material attributes from the engineering measurements 3measurements. -3

6/10/2011
38
Real-Time ReleaseProcess understanding can
provide high assurance f lit b t hof quality on every batch
and provide alternativeeffective mechanisms to achieve validation.
• “Process understanding j tif l tican justify real time
release”• HOOOORRAAYY !!
The Problem with PAT

6/10/2011
39
Purified Water is not good enough
• Often Purified Water is not of sufficient microbial quality for most BioPharm applications
• 10 - 50 cfu/ml cannot be reliably controlled
B ik OOS f– Bugs can spike OOS for a variety of reasons
HP Purified Water is secretly desired
• HP (Highly Purified) Water requires q– <10 cfu/ 100 ml bioburden– < 0.25 EU Endotoxindue to popular demand
• Low microbial HP Purified W t i i d fWater is required for diverse application,
• Lab, media and buffer prep

6/10/2011
40
Distribution Loop and Point of Use Configuration
It’s is better than you think
• The microbial quality of the water is distribution is typically better than the microbio test results indicate
• The difficulty is getting the water out of thethe water out of the distribution system without contamination

6/10/2011
41
Figure 7Standard Plate Count for Ambient Temperature Purified Water System
No Sanitizations Performed Since Start-up (May 2000)Average of 6 samples collected weekly8 out of 300 samples were discarded
90
100
30
40
50
60
70
80
cfu/
100m
L
Arion System DesignNon Arion System Design
0
10
20
30
1/8/
2002
1/22
/200
2
2/5/
2002
2/19
/200
2
3/5/
2002
3/19
/200
2
4/2/
2002
4/16
/200
2
4/30
/200
2
5/14
/200
2
5/28
/200
2
6/11
/200
2
6/25
/200
2
7/9/
2002
7/23
/200
2
8/6/
2002
8/20
/200
2
9/3/
2002
9/17
/200
2
10/1
/200
2
10/1
5/20
02
10/2
9/20
02
11/1
2/20
02
11/2
6/20
02
12/1
0/20
02
Sample Date
Problem Water Systems
• Allow stabilization or equilibration of microbial
ltresults• If numbers remain
excessive, look for ways to reduce nutrients (TOC)
• If quality is not q yacceptable, the water system design is likely at fault

6/10/2011
42
Sanitization may not help
• Hot Water and Chemical Sanitization of problem pwater systems may exacerbate problems
• TNTC spikes are common after sanitization
Thi i lik l th– This is likely the recolonization of biofilms
The Microbiological Quality of Water in Distribution
• If higher quality Purified Water is required, 100 ml q ,sample size is statistically too small
• To demonstrate < 1 cfu/ 100 ml quality,
lit l ione liter sample sizes are required

6/10/2011
43
If Better Microbio Results are Required
• Reliable HP Purified water system design is requiredy g q
• Point of Use and Sample valve configuration is critical
• Properly designed and t d di t ib ti loperated distribution loop
is required

6/10/2011
44
Microbio Quality of Product Water
• Point of Distribution (PoD)( )– the quality of water the
system can produce. If it is not in spec, the water system design is at fault.
• PoD must be sampled atPoD must be sampled at high volume – (1L minimum) for
statistical relevance.
Micro Bio Quality of Return
• Point of Return (PoR) – The quality of water the q y
distribution system can deliver. If not in spec; the use points or distribution piping design is suspect.
• PoR must also be sampled in large volume– 1 Ltr sample size

6/10/2011
45
Point of Use Configuration
• Point of Use (PoU) – The quality of water procured q y pfrom the use point configurations and the sample points
• The PoU bacteria results are often significantlyare often significantly poorer than the water in distribution
Point of Use Valve Multiplier (estimated)
(distribution bacteria = 1X)
• Zero dead leg diaphragm (1 5x)• Zero dead-leg diaphragm (1.5x) • Diaphragm (3 x) • Ball Valve (5 X)• Needle Valve (10X)• Goose Neck (20 X)• Goose Neck (20 X)• Hoses or Tubing (30 X)

6/10/2011
46
Use Point Configuration
• The number and size of the use points must bethe use points must be in realistic proportion to the size of the pipe
• PoU valves must not exceed ½ the size of the distribution pipe sizedistribution pipe size
Size and # of Use Points
Pipe Size Use Point Max #
1.0” ¼ - 1/2” 15- 101.5” 3/8” – ¾” 30- 202.0” ½” – 1.0” 40 - 203.0” ¾” – 1.5” 50 - 204 0” 1 ” 2 ” 60 204.0” 1 ” – 2 ” 60 - 205.0” 1 ” – 3 ” 70 - 20

6/10/2011
47
Distribution Loop Design
• Instantaneous water demand should not exceed 75% of the flow in distribution
• In critical applications, max water demand should not exceed 50% ofshould not exceed 50% of the flow in distribution
Distribution Piping
Pipe Size Flow rate Length
1.0” 12 gpm 400 ft1.5” 30 gpm ~1,500 ft 2.0” 60 gpm ~3,000 ft 3.0” 140 gpm ~4,000 ft 4 0” 200 gpm 6 000 ft4.0” 200 gpm ~6,000 ft 5.0” 350 gpm ~8,000 ft

6/10/2011
48
Distribution Loop Design
• Do not disrupt flow• Flow surges and g
pressure fluctuations in the distribution loop scour pipe and dislodge biofilm
Do not disrupt flow
• Only distribution pumpsneed be on back up ppower supply
• If distribution is disrupted, await one or two loop recirculation volumes to be assured ofvolumes to be assured of a return to equilibrium quality

6/10/2011
49
Water Sampling
Water Sampling
• Sampling still remains problematicproblematic
• Sampling should reflect the way water is used
• Do not use alcohol or long rinse regimes
• Require Max velocity rinse for 3-5 seconds prior to use or sampling

6/10/2011
50
Rinse at Maximum Velocity
• Use points must be capable of max velocity irinse
• Do not place in ceiling or pointed at electrical panels
• Use points over 1.5” cannot be rinsed at max velocityvelocity– Must add a hose or a
sample valve
The FDA PAT Team wants to help
• Should be included from the beginning g g
• The FDA PAT team performs inspections

6/10/2011
51
Thank You Questions?
Contact Us:
References• 1-”An Introduction to Process Analytical
Technologies” , by Nissan Cohen, Pharmaceutical Engineering, Jan/Feb 2004, Vol. 24 no.1
• 2-”Auto Release of Water Using TOC Analysis and Risk based cGMP, Inspection, and PAT Principles,” Rick Godec and Nissan Cohen, Pharmaceutical Engineering, Jan/Feb 2005, Vol 25 No.1
• 3-”The Four Steps of PAT Implementation-by John Davis, PE and John Wasynczuk, PhD. Pharmaceutical Engineering, Jan/Feb 2005.