Applying Lessons Learned from Waste-To-Energy … North American Waste to Energy Conference May 1-3,...
7
14th North American Waste to Energy Conference May 1-3, 2006, Tampa, Florida USA NAEC14-3183 APPLYING LESSONS LEARNED FROM WASTE-TO-ENERGY FEASIBILITY STUDY PROJECTIONS TO CONTRACT RENEWALS, EXPANSIONS AND NEW PROJECTS Jonathan S. Bilmes, PE, QEP, Executive Director Susan F. Hemenway, Solid Waste Analyst Bristol Resource Recovery Facility Operating Committee 43 Enterprise Drive Bristol, Connecticut. 06010 Tel: 860.585.0419 Fax: 860.585.9875 Web Site: w.brrfoc.org ABSTRACT A majority of today's operating waste to energy plants were developed in the 1980s. In order to finance these facilities, comprehensive feasibility reports were required that assessed the engineering and financial feasibility of the projects. The Bristol Resource Recovery Facility Operating Committee (BRRFOC) commissioned two such reports; in 1985 when the project was initially financed and again in 1993 when the initial bonds were refunded. Key assumptions were made in the 1985 and 1993 reports regarding energy prices, landfill costs, inflation, member tonnage, recycling rates, changes in law and plant operations. Despite the enormous changes that have occurred in the waste to energy indust over the past 20 years, BRRFOC's member community tipping fee has consistently outperformed projections. In fact, due to BRRFOC's financial track record, a 2005 refinancing was successfully marketed to financial institutions without independent economic study. This paper will compare and contrast the 1985 and 1993 projections and assumptions to actual performance. The information provided will assist decision makers contemplating contract renewals, expansions or new waste to energy projects determine what sensitivity analyses, if any, need to be included in the feasibility report. INTRODUCTION Established in 1988, the Bristol Resource Recovery Facility Operating Committee (BRRFOC) administers an integrated solid waste disposal program for 14 Connecticut cities and towns with an estimated population of 320,000 (Figure I). The BRRFOC's integrated waste management system includes: public education on source reduction; source separation, recycling, household hazardous waste and e-waste collections through its sister agency, Tunxis Recycling; and a waste-to-energy facility in Bristol, Connecticut (owned by Covanta Bristol Inc), which safely and efficiently bums approximately 650 tons of solid waste daily, reducing the volume of waste in member communities by 90% and producing enough electricity to serve about 15,000 homes. In addition, since our Board is comprised of Mayors, Selectmen and Town Managers, we also represent the direct interests of our taxpayers, both residential and commercial. ACTUAL TIPPING FEES VS PROJECTED Comprehensive feasibility studies were conducted in 1985, when the initial bonds were sold and again in 39 1993 to support an advance rending of the 1985 bonds. The 1985 and 1993 feasibility studies were conducted by nationally recognized engineering firms with substantial experience in solid waste. Both studies comprehensively examined the project, predicted member community tipping fees under several scenarios and, coincidentally, were the exact same length (61 pages). As Figure 2 below demonstrates, actual tipping fees paid by the member communities have consistently outperformed the projected tipping fees under the "base case" scenario 1. This paper will examine several key assumptions that were made in 1985 andlor 1993, and the impact of those assumptions on project economics, i.e. member community tipping fees. This infoation will be valuable to those planning new projects and expansions. l It is the intent of the authors to analyze, not critique or criticize the 1985 and 1993 feasibility reports. Both feasibility reports were rigorously analyzed and vetted by numerous parties to the transaction. Copyght © 2006 by ASME
Transcript of Applying Lessons Learned from Waste-To-Energy … North American Waste to Energy Conference May 1-3,...

14th North American Waste to Energy Conference May 1-3, 2006, Tampa, Florida USA
NAWTEC14-3183
APPLYING LESSONS LEARNED FROM WASTE-TO-ENERGY FEASIBILITY STUDY PROJECTIONS TO CONTRACT RENEWALS, EXPANSIONS AND NEW PROJECTS
Jonathan S. Bilmes, PE, QEP, Executive Director Susan F. Hemenway, Solid Waste Analyst
Bristol Resource Recovery Facility Operating Committee 43 Enterprise Drive
Bristol, Connecticut. 06010 Tel: 860.585.0419 Fax: 860.585.9875
Web Site: www.brrfoc.org
ABSTRACT A majority of today's operating waste to energy plants were developed in the 1980s. In order to finance these facilities, comprehensive feasibility reports were required that assessed the engineering and financial feasibility of the projects. The Bristol Resource Recovery Facility Operating Committee (BRRFOC) commissioned two such reports; in 1985 when the project was initially financed and again in 1993 when the initial bonds were refunded. Key assumptions were made in the 1985 and 1993 reports regarding energy prices, landfill costs, inflation, member tonnage, recycling rates, changes in law and plant operations. Despite the enormous changes that have occurred in the waste to energy industry over the past 20 years, BRRFOC's member community tipping fee has consistently outperformed projections. In fact, due to BRRFOC's financial track record, a 2005 refinancing was successfully marketed to financial institutions without an independent economic study. This paper will compare and contrast the 1985 and 1993 projections and assumptions to actual performance. The information provided will assist decision makers contemplating contract renewals, expansions or new waste to energy projects determine what sensitivity analyses, if any, need to be included in the feasibility report.
INTRODUCTION Established in 1988, the Bristol Resource Recovery Facility Operating Committee (BRRFOC) administers an integrated solid waste disposal program for 14 Connecticut cities and towns with an estimated population of 320,000 (Figure I). The BRRFOC's integrated waste management system includes: public education on source reduction; source separation, recycling, household hazardous waste and e-waste collections through its sister agency, Tunxis Recycling; and a waste-to-energy facility in Bristol, Connecticut (owned by Covanta Bristol Inc), which safely and efficiently bums approximately 650 tons of solid waste daily, reducing the volume of waste in member communities by 90% and producing enough electricity to serve about 15,000 homes. In addition, since our Board is comprised of Mayors, Selectmen and Town Managers, we also represent the direct interests of our taxpayers, both residential and commercial.
ACTUAL TIPPING FEES VS PROJECTED Comprehensive feasibility studies were conducted in 1985, when the initial bonds were sold and again in
39
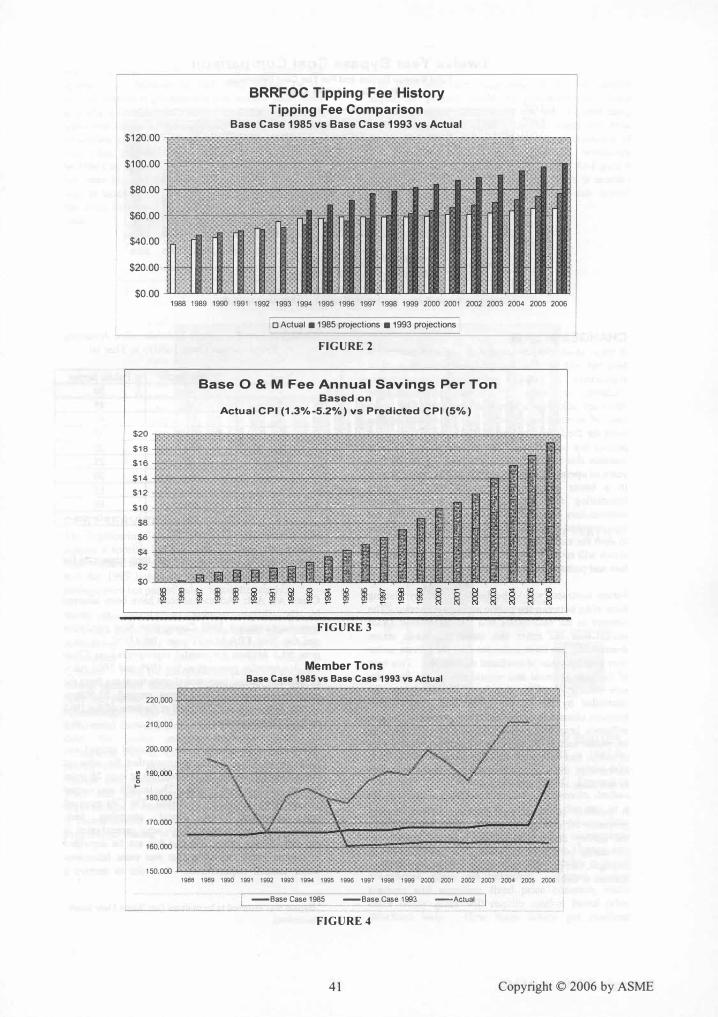
1993 to support an advance refunding of the 1985 bonds. The 1985 and 1993 feasibility studies were conducted by nationally recognized engineering firms with substantial experience in solid waste. Both studies comprehensively examined the project, predicted member community tipping fees under several scenarios and, coincidentally, were the exact same length (61 pages). As Figure 2 below demonstrates, actual tipping fees paid by the member communities have consistently outperformed the projected tipping fees under the "base case" scenario 1. This paper will examine several key assumptions that were made in 1985 andlor 1993, and the impact of those assumptions on project economics, i.e. member community tipping fees. This information will be valuable to those planning new projects and expansions.
l It is the intent of the authors to analyze, not critique or criticize the 1985 and 1993 feasibility reports. Both feasibility reports were rigorously analyzed and vetted by numerous parties to the transaction.
Copyright © 2006 by ASME

Bristol Resource Recovery Facility Operating Committee Service Territory
FIGURE 1
CONSUMER PRICE INDEX (CPI) Most, if not aU, public-private projects such as Bristol, have annual inflation indexed contractual adjustments applied to various operation and maintenance fees. Small variations in the CPI can result in varying payments on the order of hundreds of thousands of dollars per year. Inflation adjustments vary from project to project depending on what percentage of the CPl (25%-100%) is applied and the specific index to be applied2• The 1985 Engineer's Report assumed inflation increases on the order of 5% per year. With the exception of 1989, actual inflation has been significantly lower than that presumed in the 1985 base case, resulting in substantial CPI indexed operation and maintenance savings per ton, as shown in Figure 3 below.
It is beyond the scope of this paper to discuss and analyze the Commerce Department's various consumer price indices. Suffice it to say there are hundreds, perhaps thousands of these indices. As new contracts are negotiated, it is critical that attention be paid to the type of index to be used and the percentage increase applied.
2 For the Bristol project, the CPI index used is the Urban Wage Earners and Clerical Worker, US City Average. Operation and Maintenance Fees increase at 100% of the annual index.
Copyright © 2006 by ASME 40
WASTE FLOW ISSUES In 1985, when the Bristol project was initially conceived and financed, most of the region's tonnage was disposed of in local unlined landfills. Scale data was not uniformly available and industry standard density estimates were used to predict municipal tonnages. Based on the information available, the 1985 feasibility study predicted regional tonnage would be less than plant capacity, i.e., no bypass/diverted waste was forecast. In addition, several factors which we now know to be critical to predicting waste flow and tonnage processed (higher heating values, seasonal and monthly tonnage variations) were not well understood at the time. These variables, even if known with more certainty in 1985, would not have been that important since the processing capacity was expected to be in excess of the predicted deliveries.
In 1988, when tonnage was first "tipped", the project experienced deliveries in excess of predicted (Figure 4), especially during the spring months and during outage periods. Bypass became a necessity, always exceeding the amount estimated in 1985 (zero). Further, once the City of Bristol landfill closed, bypass costs exceeded the 1993 forecast (Figure 5) by up to $1.4 Million ($7.20 per ton MSW delivered). The financial impact of this unexpected bypass was minimized the first ten years as unit costs for bypass at adjacent City of Bristol landfill were far less than the tipping fee collected on incoming waste. However, in 1997, the City of Bristol landfill closed (see Change in Law discussion below) and the Committee was now forced to pay market rates for bypass waste. In addition, as a result of modest population growth and increasing per capita generation rates, total member waste continued to grow. The 1993 feasibility study prediction that the region would achieve 34% recycling rates (increasing from 23%) did not materialize.
Waste flow projections and potential bypass tonnage/costs should always be analyzed in detail. Even though historical scale data is now available, it is impossible to predict with certainty items such as population growth, per capita waste disposal, recycling rates, and interstate transport restrictions. Waste flow sensitivity analyses are important in determining project economics. Since market capacity and bypass costs are region-specific, new contracts might need to consider excess tonnage payments (perhaps tied to regional tipping fee costs from nationally recognized publications or surveys) in addition to minimum tonnage expectations.
I BRRFOC Tipping Fee History Tipping Fee Comparison
Base Case 1985 vs Base Case 1993 vs Actual $120.00 �
$100.00 "
$80.00
$60.00 -- _ ... --_ . . _ _ ............... _...;;c;" - .
$40.00 -=.- 1- - 1- .... - - -
I I $20.00 -- I- - I- - -
I $0.00 1988 1989 1990 1991 1992 1993 1994 1995 1996 1997 1998 1999 2000 2001 2002 2003 2004 2005 2006
o Actual. 1985 projections. 1993 projections I FIGURE 2
Base 0 & M Fee Annual Savings Per Ton Based on
Actual CPI (1.3%-5.2%) vs Predicted CPI (5%)
$20 $18 mil $16 �� 'l . - l1H $14 $12 $10 .
$8 $6 �--- ." � ,
I'" $4
CD ... f.i .. 1 , $2
!!!lEi II """Ilrl It III $0
� � � � � � � � � m � � � m m � � � � � � � FIGURE 3
Member Tons Base Case 1985 vs Base Case 1993 vs Actual
220,000 y
I 210,000 . .-
/ I I 200,000
ZS/ � 190,000' � 0
\ Z V
I ... � 180,000
\/ '\' / I 170,000 I
.... , 180,000 \
W,
150,000 ........•
'988 1989 1990 1991 1992 1993 1994 1995 1996 1997 1998 1999 2000 2001 2002 2003 2004 2005 2006
; -Base Case 1985 -Base Case 1993 -Actual I FIGURE 4
41 Copyright © 2006 by ASME

Twelve Year Bypass Cost Comparison Total Bypass Dollars and Per Ton Cost Difference
Base Case 1993 vs Actual
2,000 1,800 1,600 1,400
0- 1,200 c 1,000 c � 800
600 400 200
0 1995 1996 1997 1998 1999 2000 2001 2002 2003 2004 2005 2006
• Base Case 1993 • Actual r 1985 Base caseassurres al waste processed
FIGURE 5
CHANGES IN LAW A major issue to be negotiated on any new contract is how risk will be allocated for future changes in laws, regulations or other unforeseen circumstances ("Changes in Law"). By its very definition, these items are unknown and/or can't be quantified at the time of contract execution. The feasibility studies done for the Bristol project in 1985 and 1993 did not predict any such costs. The private sector typically assesses this risk in its business plan. With 20 plus years of operating experience, the public sector is now in a better position to evaluate this risk when negotiating new projects. The Bristol project communities assumed 100% of the risk in 1985 and unanticipated costs have been significant. Attempting to shift the entire risk of Change in Law to the private sector will result in higher operation and maintenance fees and perhaps higher inflation payments.
Future contracts would be better served by sharing these risks between the public and private sector. The concept in the mid 1980s was that the public sector should bear the entire risk since the public sector theoretically has more influence than the private sector over promulgation of laws and regulations. This type of thinking is passe and should not be the basis for new contracts. With significant merchant capacity controlled by the private sector and a more probusiness climate in legislatures, the private sector can influence laws and regulations just as effectively as the public sector. Further, the industry's evolving mix of public and merchant (private) facilities means that, nationwide, the private sector has just as much a stake in this issue as the public sector.
A possible solution is to include a cost sharing provision for changes in law, with the entity owning the facility at tbe end of the contract bearing an increasing burden of the change in law costs. For example, one possible contractual scenario could be as follows in Table I:
Copyright © 2006 by ASME 42
Change in Law Percentage Risk Allocation Assuming Private Sector Owns Facility in Year 10
Year Private Sector Public Sector
I 50 50
2 55 45
3 60 40
4 65 35
5 70 30
6 75 25
7 80 20
8 85 15
9 90 10
10 100 0
TABLE 1
Two Change In Law examples and their impact on the Bristol project follow.
Clean Air Act: Additional costs have been incurred by the Bristol member communities to assure compliance with a 1995 Connecticut Nox regulation and the 2000 EPA MACT rule. BRRFOC bas spent over $4.5 Million for capital expenditures on Clean Air Act retrofits pursuant to the 1995 and 2000 rules. In addition, annual operational costs resulting from the retrofits (reagents, O&M fees) exceed $3.50/ton. These costs were unanticipated at the time of the 1985 or 1993 feasibility studies.
Ash Residue Disposal: When the Bristol project was financed in 1985, it was assumed that the adjacent Bristol landfill would be available for at least 25 years for ash and bypass disposal. 3 The landfill was owned and operated by the City of Bristol. The City received lease payments and annual operating fees. Connecticut landfill regulations were promulgated in the early 1990s which required that ash be deposited in double lined monofills that met most hazardous waste landfill requirements. In order to receive a
3 Bypass was assumed to be minimal (see Waste Flow lssues discussion).
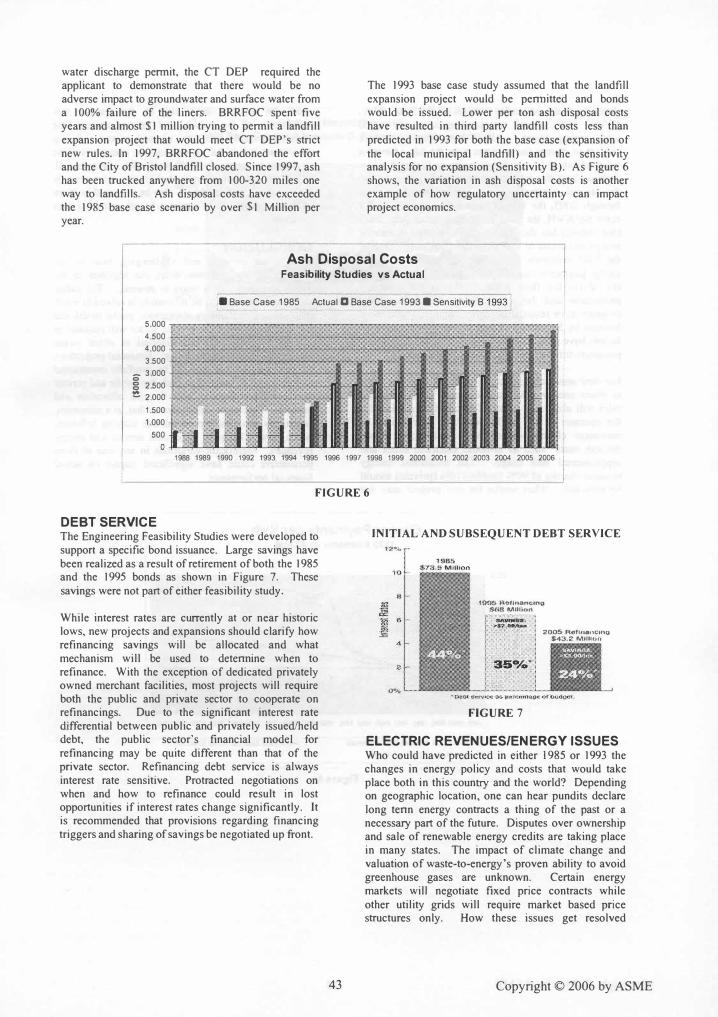
water discharge pennit, the CT DEP required the applicant to demonstrate that there would be no adverse impact to groundwater and surface water from a 100% failure of the liners. BRRFOC spent five years and almost $1 million trying to pennit a landfill expansion project that would meet CT DEP's strict new rules. In 1997, BRRFOC abandoned the effort and the City of Bristol landfill closed. Since 1997, ash has been trucked anywhere from 100-320 miles one way to landfills. Ash disposal costs have exceeded the 1985 base case scenario by over $1 Million per year.
The 1993 base case study assumed that the landfill expansion project would be pennitted and bonds would be issued. Lower per ton ash disposal costs have resulted in third party landfill costs less than predicted in 1993 for both the base case (expansion of
the local municipal landfill) and the sensitivity analysis for no expansion (Sensitivity B). As Figure 6 shows, the variation in ash disposal costs is another example of how regulatory uncertainty can impact project economics.
Ash Disposal Costs Feasibility Studies vs Actual
I_ Base Case 1985 Actual a Base Case 1993 _ Sensitivity B 1993 1 5.000 r-"-'�""""�""""�""""""="=�"""''''''''-'''''''''''''''''''''''''''''''''=''''''''=""",,=''''''''=�'''''''''''''''''''''''' 4.500 ......... -_��--......... _.......c.._ .................... -.,.-�--------� __ -ll-"-� 4.000 +---.-..--.......;..----�--........ ---...-.....oio;;;;_ ...... � ...... ,..... .......... +__I ....... _I1 3.500 +------------.. -..._-.......,,-I--i ............. -........................ .........J ........ .....fl
0- 3,000 +-�---.......... -=-� ___ _=_-=L....�� ..... .",..... ................... -I--i ............. ¥';;; .... ;c"II. g 2,500 - -� 2,000
1,500
1,000
500
O����_����LJu.���a.��.uu.���a.�JU.uLU�� 1988 1989 1990 1992 1993 1994 1995 1996 1997 1998 1999 2000 2001 2002 2003 2004 2005 2006
FIGURE 6
DEBT SERVICE The Engineering Feasibility Studies were developed to support a specific bond issuance. Large savings have been realized as a result of retirement of both the 1985 and the 1995 bonds as shown in Figure 7. These savings were not part of either feasibility study.
While interest rates are currently at or near historic lows, new projects and expansions should clarify how refinancing savings will be allocated and what mechanism will be used to detennine when to refinance. With the exception of dedicated privately owned merchant facilities, most projects will require both the public and private sector to cooperate on refinancings. Due to the significant interest rate differential between public and privately issued/held debt, the public sector's financial model for refinancing may be quite different than that of the private sector. Refinancing debt service is always interest rate sensitive. Protracted negotiations on when and how to refinance could result in lost opportunities if interest rates change significantly. It is recommended that provisions regarding financing triggers and sharing of savings be negotiated up front.
43
INITIAL AND SUBSEQUENT DEBT SERVICE
12%
0%
1\)-0$ fHdinancino $08 MUllan
FIGURE 7
2005 Rt)fftla{lCino $43,2 Million
ELECTRIC REVENUES/ENERGY ISSUES Who could have predicted in either 1985 or 1993 the changes in energy policy and costs that would take place both in this country and the world? Depending on geographic location, one can hear pundits declare long tenn energy contracts a thing of the past or a necessary part of the future. Disputes over ownership and sale of renewable energy credits are taking place in many states. The impact of climate change and valuation of waste-to-energy's proven ability to avoid greenhouse gases are unknown. Certain energy markets will negotiate fixed price contracts while other utility grids will require market based price structures only. How these issues get resolved
Copyright © 2006 by ASME

depends on the particular policies of the local utility, DPUC, FERC, local restructuring laws and world wide energy prices. All of these parameters are subject to change many times over the life of even a relatively short 5-yr or 10-yr contract. Figure 8 below demonstrates the impact of these global changes on the Bristol contract rate. For all contract years through 2005, the Bristol contract payment was 8.3 cents per KwH, the floor price. Only since July, 2005 (not shown) has the Bristol project started to receive energy payments in excess of the floor rate. One of the 1985 scenarios (Sensitivity D) assumed that the energy payments received from the utility would never rise above the floor price. Higher net electrical production and the establishment of an incentives program have resulted in higher payments than those forecast by Sensitivity D (see Figure 9). These same factors have mitigated the impact of the lower contract payments forecast in the 1985 base case.
For new contracts, participants should look for ways to share energy risks and revenues. Since electric sales will always be mostly dependent on production, the operator of the facility must be incentivized to maximize electric output while minimizing "pass through costs" such as in-house electrical usage and supplemental fuel usage. The traditional energy revenue sharing of 90% (public)/ IO% (private) should be revisited. What works for one project may not
work for another depending on the various risk valuations of the public and private sector. One possible solution for new electric revenue sharing provisions would be to increase the operator's share over time to insure electrical production is maximized. While prevailing wisdom is that electric rates are only going up, all parties should also be prepared to share in the downside risk of a market based contract if rates go down.
CONCLUSION This is an exciting and challenging time in the industry as the complex deals put together in the 1980s and early 1990s begin to unwind. . The public sector will continue to be intimately involved in waste disposal due to statutory obligations, public health and taxpayer concerns. The private sector will continue to have a key role in waste disposal as either owner and/or operator of the facilities. Financial projections for new projects will have to be carefully constructed and analyzed to insure that both the public and private sector are comfortable with the risk allocation and rewards. This paper demonstrates that, at a minimum, sensitivity analyses should include varying inflation, waste flow, Change in Law, debt service and energy revenues. Significant variations in any one of these parameters could have significant impact on actual financial performance,
Electric Payments per Kwh 1985 Estimates vs Actual
25.0
.. � 20.0 l-.e / it
15.0 l<:
I � .,,!..
. c. -!l 10.0 c:: .. U
----� . -.--'-"--5.0 ._---..._._- - -
0.0
1988 1989 1990 1991 1992 1993 1994 1995 1996 1997 1998 1999 20 00 200 1 2 002 2 00320 04 2005
-1985 AloOided Cost Estimate 1985 Contract Rate Estimate
I -Actual Contract Rate
Figure 8
Copyright © 2006 by ASME 44

Annual Electric Revenue 1985 Base Case and Scenario D, Reduced Electric vs Actual
$9,000 +-�------------- ---�-�� $8,500
$8,000 +-----�-------=_--�
0' $7,500 o
� $7.000
$6,500
$6,000
$5,500
$5,000
1990 1991 1992 1993 1994 1995 1996 1997 1998 1999 2000 2001 2002 2003 2004 2005
1 • Base Case 1985 • Actual • Scenario D, 1985 1
Figure 9
45 Copyright © 2006 by ASME