Applied Information Economics An Executive Overview
28
Copyright HDR 2008 [email protected] 1 Applied Information Economics An Executive Overview A Proven Method for Measuring Intangibles, Optimizing Decisions & Avoiding Catastrophe
Transcript of Applied Information Economics An Executive Overview

Copyright HDR 2008
1
Applied Information Economics
An Executive Overview
A Proven Method for Measuring Intangibles,
Optimizing Decisions & Avoiding Catastrophe

Copyright HDR 2008
2
Objectives
• Discuss key concepts behind Applied Information
Economics (AIE) including:
– How AIE uses uncertainty, risk and measurement more
like a statistician or actuary
– How AIE is different from other methods
– How AIE approaches an investment decision
• Discuss surprising findings from the combined
results of 60 major AIE analysis projects and
some powerful examples of measurements made
with this method

Copyright HDR 2008
3
Background
• In the past 14 years, I conducted 60 major risk/return analysis projects so far
• I noticed that what were thought of as “impossible” measurements could actually be measured
• I also noticed that risk management and much decision analysis in business was mostly unscientific and did not reflect the latest research
• I wrote these two books published by John Wiley & Sons

What is AIE?
4
Applied Information Economics (AIE) is:
1. The practical application of scientific and mathematical methods to quantify the
value of management choices - regardless of how difficult the measurement
challenge appears to be.
2. The optimization of the decision by optimizing the information gathering process
itself – the highest payoff measurements are identified by computing the economic
value of information.
3. The emphasis on using forecasting methods that have been scientifically tested to
measurably reduce error of expert estimates
• “Quantifying the risk and comparing its risk/return with other investments sets AIE apart from other methodologies. It can substantially assist in financially justifying a project -- especially projects that promise significant intangible benefits.” The Gartner Group
• “AIE represents a rigorous, quantitative approach to improving IT investment decision making…..this investment will return multiples by enabling much better decision making. Giga recommends that IT executives learn more about AIE and begin to adopt its tools and methodologies, especially for large IT projects.” Giga Information Group
Copyright HDR 2008
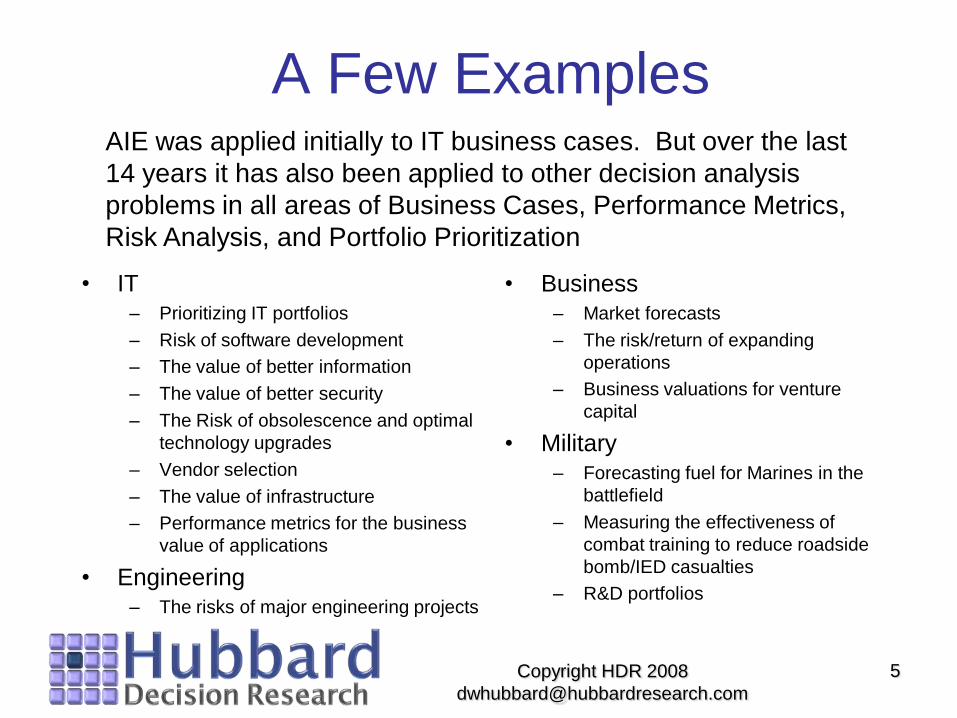
A Few Examples
• IT– Prioritizing IT portfolios
– Risk of software development
– The value of better information
– The value of better security
– The Risk of obsolescence and optimal
technology upgrades
– Vendor selection
– The value of infrastructure
– Performance metrics for the business
value of applications
• Engineering– The risks of major engineering projects
5
AIE was applied initially to IT business cases. But over the last
14 years it has also been applied to other decision analysis
problems in all areas of Business Cases, Performance Metrics,
Risk Analysis, and Portfolio Prioritization
• Business– Market forecasts
– The risk/return of expanding
operations
– Business valuations for venture
capital
• Military– Forecasting fuel for Marines in the
battlefield
– Measuring the effectiveness of
combat training to reduce roadside
bomb/IED casualties
– R&D portfolios
Copyright HDR 2008

6
Assessing Assessment Methods
• Only empirical evidence that forecasts and decisions are actually improved can separate real benefits from a “placebo effect”
• Effective methods for evaluating IT investments should have a lot in common with well-known methods in other fields (actuarial science, portfolio optimization, etc.)
• What doesn’t count as evidence that a method works:– Testimonials from users or any perception of a benefit
– Wide use or acceptance as an official “standard” or “best practice”
– Being “structured” or “formal”
– The expertise of the developers
Copyright HDR 2008

Copyright HDR 2008
7
Key ComparisonsApplied Information Economics Traditional Methods
Uncertainty and risk are modeled like a statistician
or an actuary would model it – even (and
especially) when there is limited data
The chance of failure, negative returns or
disaster is not quantified and it is unlikely key
risks will even be identified
All components of AIE have been proven in
controlled experiments to improve on unaided
human judgment
There is no evidence (other than anecdotal
cases in uncontrolled situations) that the
decision is any better – Often, unproven
“scoring” methods are employed
Any “intangible” is defined in terms of its practical
consequences and is modeled economically
“Intangibles” are excluded or will be assessed
with arbitrary, unproven scoring methods
The value of additional information is computed for
each measurement – this results in many
revelations about measurements are critical
The value of information is not computed and
there is no way to know that the right
measurements are taken
The level of risk aversion or risk tolerance is
quantified as in Modern Portfolio Theory (Nobel
Prize 1990)
Risk tolerance is never quantified in any
sound, mathematical way

Copyright HDR 2008
8
Six Key Concepts
1. Any “intangible” can be defined in terms of its practical business consequences
2. We must look at uncertainty, risk and measurement like a statistician
3. There are proven methods that improve on human judgment
4. We can learn how to put odds on unknowns
5. We can compute the value of additional information to direct empirical measurements
6. We can quantify the level of risk aversion or risk tolerance and “optimize” the investment

Copyright HDR 2008
9
Uncertainty, Risk & Measurement
• The “Measurement Theory” definition of
measurement: “A measurement is an
observation that results in
information (reduction of uncertainty)
about a quantity.”
• An Actuary's approach to Risk
Measurement: “To quantify probability
and loss of an undesirable
possibility”
• The value of a Measurement: “The
monetized reduction in risk from making
decisions under less uncertainty”
• We model uncertainty statistically – with
Monte Carlo simulations
Measuring Uncertainty, Risk and the Value of Information are closely
related concepts, important measurements themselves, and precursors
to most other measurements

Copyright HDR 2008
10
An Approach That Works
1. Define the decision
2. Quantify the current uncertainty (model what you know now)
3. Compute the value of additional information
4. Measure where the information value is high
5. Optimize the decision

Copyright HDR 2008
11
Defining the Decision• The EPA needed to compute the ROI of the Safe Drinking Water
Information System (SDWIS)
• As with any AIE project, we built a spreadsheet model that connected the expected effects of the system to relevant impacts – in this case public health and its economic value

12
Model What You Know
• Decades of studies show that most managers are
statistically “overconfident” when assessing their
own uncertainty
– Studies showed that bookies were great at assessing odds
subjectively, while doctors were terrible
• Studies also show that measuring your own
uncertainty about a quantity is a general skill that
can be taught with a measurable improvement
• Training can “calibrate” people so that of all the
times they say they are 90% confident, they will be
right 90% of the time
Copyright HDR 2008

Copyright HDR 2008
13
Giga Analysts
Giga Clients
Statistical Error
“Ideal” Confidence
30%
40%
50%
60%
70%
80%
90%
100%
50% 60% 80% 90% 100%
25
75 71 65 58
21
17
68152
65
4521
70%Assessed Chance Of Being Correct
Per
cent C
orr
ect
99 # of Responses
Calibrated Probabilities• 1997: An experiment Hubbard conducted with Giga Information Group proves
people can be trained to assess probabilities of uncertain forecasts
• Hubbard has calibrated hundreds of people since then
• Calibrated probabilities are the basis for modeling the current state of uncertainty
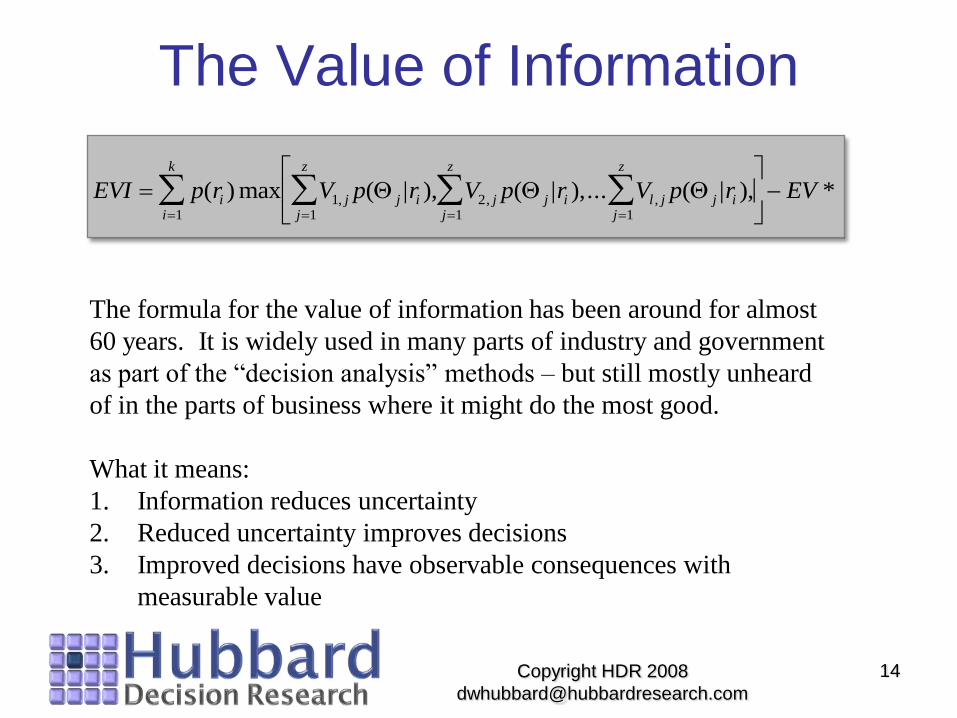
The Value of Information
Copyright HDR 2008
14
EVI p r V p r V p r V p r EVi j j ij
z
j j i l j j ij
z
j
z
i
k
( ) max ( | ), ( | ),... ( | ), *, , ,11
2111
The formula for the value of information has been around for almost
60 years. It is widely used in many parts of industry and government
as part of the “decision analysis” methods – but still mostly unheard
of in the parts of business where it might do the most good.
What it means:
1. Information reduces uncertainty
2. Reduced uncertainty improves decisions
3. Improved decisions have observable consequences with
measurable value

Copyright HDR 2008
15
The Measurement Inversion
Typical A
ttentio
n
Eco
nom
ic R
elev
ance
Measurement Attention
vs. Relevance• After the information values for over 4,000
variables was computed, a pattern emerged.
• The highest value measurements were almost
never measured while most measurement effort
was spent on less relevant factors
– Costs were measured more than the more uncertain
benefits
– Small “hard” benefits would be measured more than
large “soft” benefits
• Also, we found that, if anything, fewer
measurements were required after the
information values were known.

Copyright HDR 2008
16
Next Step: Observations
• Once we’ve determined what to measure, we can think of observations that would reduce uncertainty
• The value of the information limits what methods we should use, but we have a variety of methods available
• Take the “Nike Method”: Just Do It – don’t let imagined difficulties get in the way of starting observations
Copyright HDR 2008
17
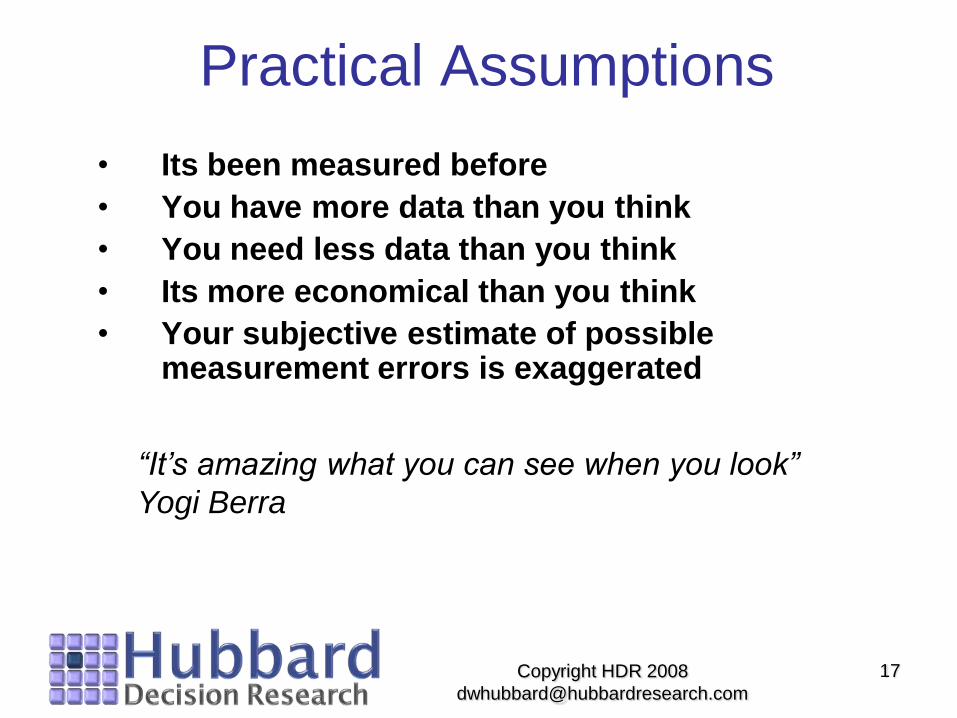
Practical Assumptions
• Its been measured before
• You have more data than you think
• You need less data than you think
• Its more economical than you think
• Your subjective estimate of possible measurement errors is exaggerated
“It’s amazing what you can see when you look”
Yogi Berra

Copyright HDR 2008
18
Statistics and Measurement• Several clever sampling methods exist that can measure
more with less data than you might think
• Examples: – estimating the population of fish in the ocean is like measuring
the mistakes/intrusions you didn’t detect
– Measuring the effect of a drug is like measuring the effect of project on the performance of a complex organization
– Statistical methods used by most scientists apply to estimating the size or rate of change of virtually anything
Statistical Estimates of German Tank Production in WWII

Copyright HDR 2008
19
Reducing Inconsistency• The “Lens Model” is another method used to improve on expert intuition
• The chart shows the reduction in error from this method on intuitive estimates
• In every case, this method equaled or bettered the judgment of experts – this is the valid evidence for the effectiveness of an estimation or decision making method
0% 10% 20% 30% 40%
Cancer patient life-expectancy
Life-insurance agent performance
Graduate students grades
Changes in stock prices
Mental illness using personality tests
Student ratings of teaching effectiveness
Business failures using financial ratios
Reduction in Forecasting Errors
Battlefield Fuel Forecasts
IT Portfolio Priorities
Source: Hubbard Decision Research
R&D Portfolio Prioritization

Copyright HDR 2008
20
Risk/ROI w/ “Monte Carlo”
Administrative Cost
Reduction
Total Project Cost
Customer Retention
Increase
5% 10% 15%
10% 20% 30%
$2 million $4 million $6 million
ROI-50% 50% 100%0%
• A Monte Carlo simulation generates
thousands of random scenarios using
the defined probabilities and ranges
• The result is a range ROI not a point
ROI

Quantifying Risk Aversion
Copyright HDR 2008
Acceptable Risk/Return
Boundary
Investment
Region
• The simplest element of Harry Markowitz’s Nobel Prize-winning
method “Modern Portfolio Theory” is documenting how much risk
an investor accepts for a given return.
• The “Investment Boundary” states how much risk an investor is
willing to accept for a given return.
• For our purposes, we modified Markowitz’s approach a bit.
Investment

Define Decision Model
Calibrate
Estimators
Measure the value of
additional Information
Measure where the
information value is high
Model w/Estimates &
Measurements
Optimize Decision
Review
22Copyright HDR 2008
Modeling
what you
know now

Copyright HDR 2008
23
How Much Analysis?
No C
lass
ific
atio
n
Req
uir
ed
Abbre
via
ted
Del
iver
able
Accept w/o
Further
Analysis
Reject
w/o Further
Analysis
Proceed with
Risk/Return
Calculation
Expected Investment Size ($)
Confi
den
ce I
ndex
.2
.4
.6
.8
1.0
010k 100k 1M 10M 100M
• A statistical model of IT investments is created to assess their chance of success/failure
• Plotted against investment size, this tells us whether a project should be accepted, rejected, or go through a complete risk/return analysis
• The boundaries of the “classification chart” are unique to the organization, but must follow some constraints

Copyright HDR 2008
24
Example Classification
3
4
5
6
7
8
9
1011
12
13
14
15
16
17
18
0.3
0.4
0.5
0.6
0.7
0.8
0.9
1
10 100 1,000 10,000
12
Expected Investment Size ($000)
Confi
den
ce I
ndex
No C
lass
ific
ati
on
Nee
ded
Do Abbreviated Risk-
Return Analysis:
6. DLSW Router Network
Redesign
9. Extended Hours
18. Doc. Access Strategy
Do Full Risk-
Return Analysis:
8. Pearl Indicator
and Pearl I/O
interface
11. Richardson
Data Center
Consolidation
15. MVS DB2
Tools
Reject; Consider Other Options:
1. Data Strategy
2. Enterprise Security Strategy
3. Remote Server Redundancy
12. MQ Series: Base
13. Development Environment 2000 (mf)
14. “Source Control” Source Code Mgmt
16. Enterprise InterNet
Success Factor Adjustments:
4. Network OS migration to Novell 5.x
10. Optimize Single Code Base
Accept without Further Analysis:
5. Lucent switch upgrade
7. Image Server Relocation
17. Enterprise IntraNet to all sites

Copyright HDR 2008
25
Forecasting Fuel for Battle
• The US Marine Corps with the Office of Naval Research needed a better method for forecasting fuel for wartime operations
• The VIA showed that the big uncertainty was really supply route conditions, not whether they are engaging the enemy
• Consequently, we performed a series of experiments with supply trucks rigged with GPS and fuel-flow meters.

Copyright HDR 2008
26
Reactions: Fuel for the Marines
• “The biggest surprise was that we can save so much fuel. We freed up vehicles because we didn’t have to move as much fuel. For a logistics person that's critical. Now vehicles that moved fuel can move ammunition.“ Luis Torres, Fuel Study Manager, Office of Naval Research
• “What surprised me was that [the model] showed most fuel was burned on logistics routes. The study even uncovered that tank operators would not turn tanks off if they didn’t think they could get replacement starters. That’s something that a logistician in a 100 years probably wouldn’t have thought of.” Chief Warrant Officer Terry Kunneman, Bulk Fuel Planning, HQ Marine Corps

Copyright HDR 2008
27
Reactions: Safe Water
• “I didn’t think that just defining the problem quantitatively would result in something that eloquent. I wasn’t getting my point across and the AIE approach communicated the benefits much better.” Jeff Bryan, SDWIS Program Chief
• “Until [AIE], nobody understood the concept of the value of the information and what to look for. They had to try to measure everything, couldn’t afford it, so opted for nothing. Translating software to environmental and health impacts was amazing. I think people were frankly stunned anyone could make that connection. The result I found striking was the level of agreement of people with disparate views of what should be done. From my view, where consensus is difficult to achieve, the agreement was striking” Mark Day, Deputy CIO and CTO for the Office of Environmental Information

Copyright HDR 2008
28
Questions?
Doug Hubbard
Hubbard Decision Research
www.hubbardresearch.com
630 858 2788