Applied Geothermics Physical Basics...Applied Geothermics ... Lithosphere (0-80 km) A: Asthenosphere...
65
1 Applied Geothermics – Physical Basics Prof. Dr. Christoph Clauser
Transcript of Applied Geothermics Physical Basics...Applied Geothermics ... Lithosphere (0-80 km) A: Asthenosphere...

1
Applied Geothermics –
Physical Basics
Prof. Dr. Christoph Clauser

2
• What is Geothermal energy?
• Thermal structure of the Earth
• Energy budget of the Earth: sources and sinks
• Thermal regime of the Earth, plate tectonics and geothermal systems
• Heat transport processes○Conduction○Advection○Radiation
• Thermal rock properties○Specific heat capacity○Thermal conductivity○Thermal diffusivity○Thermal capacity
Topics discussed

3
is heat contained in the solid Earth and its internal fluids.
This sets it apart from other terrestrial energy sources such as
• fossil or fissional fuels in the subsurface; • biomass, solar energy, and hydropower on the surface of the solid
Earth and in its rivers and seas; • wind energy in the atmosphere.
Geothermal energy is stored as sensible or latent heat.
Supply: both internal and external sources, representing a vast resource only just started to be tapped by mankind for space heating, process heat, and generation of electric power.
Geothermal Energy

4
determined by heterogeneity in:• Structure with respect to• Properties which govern different• Processes for heat transport: Diffusion; Advection; Radiation
Variation with depth of the observed seismic velocities and elastic constants combined with Maxwell’s four thermodynamic relations between pressure P, volume V, entropy S (ΔS=ΔQ/T; Q: heat), and temperature T yields the predominantly radial structure of the Earth.
From Maxwell’s relation (∂T/∂P)S=(∂V/∂S)P one obtains an expression for the adiabatic temperature gradient in terms of temperature, volume coefficient of thermal expansion α=(∂V/∂T)P/V, and isobaric specific heat capacity cP (at constant pressure):
(g: gravity; subscripts P und S: isobaric and adiabatic conditions).
The Earth’s thermal regime
PS
gT T cz⎛ ⎞⎜ ⎟⎜ ⎟⎜ ⎟⎝ ⎠
= α∂∂

5
according to Earth models PREM and AK135-f. From top left to bottom right: gravity g and pressure P; sonic and shear wave velocity vp and vs; coefficient of thermal volume expansion α and isobaric specific heat capacity cP; thermodynamic Grüneisen parameter γ and density ρ.
Variation of selected properties with depth
500 1000 1500cP (J kg-1 K-1)
0
1000
2000
3000
4000
5000
6000
Rad
ius
(km
)
5 10 15 20 25 α (μK-1)
6000
5000
4000
3000
2000
1000
0
Dep
th (
km) Grü
neis
en
Cubic
Expan
sion
0 5000 10000 15000ρ (kg m-3)
0
1000
2000
3000
4000
5000
6000
6000
5000
4000
3000
2000
1000
0
Dep
th (
km)
0.0 0.5 1.0 1.5γ (−)
0 100 200 300 400P (GPa)
0
1000
2000
3000
4000
5000
6000
Rad
ius
(km
)
0 2 4 6 8 10 12g (m s-2)
6000
5000
4000
3000
2000
1000
0
Dep
th (
km)
Pressure
Gravity
0 5000 10000 15000vs (m s-1)
0
1000
2000
3000
4000
5000
6000
6000
5000
4000
3000
2000
1000
0
Dep
th (
km)
0 5000 10000 15000vp (m s-1)
Sonic
Shear
Hea
t Cap
a cit y
Density

6
Examples:
Approximate estimates for the adiabatic temperature inside the Earth can be obtained with the aid of the dimensionless thermodynamic Grüneisenparameter γ = α KS /(ρ cP) (KS: adiabatic incompressibility or bulk modulus; ρ: density; g: gravity; subscripts P und S: isobaric and adiabatic conditions):
(T0 and ρ0 at a given depth and a density profile in a region where the Grüneisen parameter is known yield the adiabatic temperature profile)
Adiabatic temperature gradient
.0 0dT , or: T TT
⎛ ⎞⎜ ⎟⎜ ⎟⎜ ⎟⎝ ⎠
γ= ρ ρ∂ γ =ρ ρ
T=4000 K; g=10.1 m s-2; cP=700 J kg-1 K-1; α=14 µK-1
→ (∂T/∂z)S = 0.8 K km-1.
T=2400 K; g=9.9 m s-2; cP=1200 J kg-1 K-1; α=14 µK-1
→ (∂T/∂z)S = 0.3 K km-1
Outer core (~ 3500 km)Lower mantle (~ 1500 km)

7
From another thermodynamic Maxwell relation, (∂S/∂P)T=-(∂V/∂T)P, one can derive the fractional variation of the melting point temperature Tmpwith depth within the Earth:
(L: latent heat of fusion; ρsolid, ρliquid: density of solid and liquid phase).
With the information on the variation of gravity and density with depth derived from seismic travel times, one may obtain a profile of the melting point temperature with depth.
Outer core (~ 3300 km):T=4000 K; g=10.1 m s-2; ρsolid=13000 kg m-3; ρliquid=11000 kg m-3; L=7 MJ kg-1 (for iron) → ∂Tmp/∂z ≈ 1 K km-1
Solidus temperature gradient
solid liquid
liquidmp
mp
dT g1 ,T Ldz
⎛ ⎞⎜ ⎟⎜ ⎟⎝ ⎠=ρ −ρ
ρ

8
Variation of temperature and melting point in the Earth with depth (poorly constrained at great depth, indicated by error bars).
The Earth’s thermal profile
7300 °C
0 1000 2000 3000 4000 5000T (K)
6000
5000
4000
3000
2000
1000
Dep
th (
km)
1000
2000
3000
4000
5000
6000R
adius (km)
0 1000 2000 3000 4000 5000
T (°C)
L: Lithosphere (0-80 km)A: Asthenosphere (80-220 km)TZ: Transition Zone (220-670 km)D'': D'' layer (2741-2891 km)400 km: Phase transition olivine-spinel670 km: Phase transition spinel-perovskite
D''
InnerCore
OuterCore
LowerMantle
TZ
A
Solidus
L
6371
5150
2891
670
80
Temperature
UpperMantle
8000 °C
220

9
Abbreviations and units
W
kW h
Jabbreviation
1 W h = 3.600 J = 3.6 kJ1 kW h = 3.6 ×10⁶ J = 3.6 MJ
Kilowatt-hours
1 J ≈ 278 ×10-6 W h = 278 ×10-9 kW hJoule Energy
conversionunitquantity
1 W = 1 J s-1WattPower
1024YYottaquadrillionseptillion1021ZZetta–sextillion
EPTGMk
abbreviation
106Megamillionmillion103Kilothousandthousand
factorprefixsystemAmerican British/French/German
1018Exatrillionquintillion1015Peta–quadrillion1012Terabilliontrillion109Gigamilliardbillion

10
Global energy consumption
200
300
400
500
600
700
E (E
J)
1970 1980 1990 2000 2010 2020 2030Year
5000
10000
15000
E (M
toe)
209
420
507
682
Primary energy consumed in 1971 and 2001, and expected demand in2010 and 2030 in EJ (left axis) or Megatonnes of oil equivalent (Mtoe, right axis; 1 Mtoe = 41.868 PJ)

11
Energy budget of the Earth
is the difference between thermal income and expenditure.
• External sources: ○ solar irradiation; ○ gravitational energy from tidal friction;
• Internal sources: ○ radiogenic heat from the decay of unstable, radioactive
isotopes;○ original heat, of the infant Earth immediately after formation;○ potential energy released as heat during the creation of new
crust, the enrichment of heavy metals in the Earth’s mantle, or the formation iron core of the Earth;
○ frictional heat from elastic energy released in earthquakes.

12
Scaling of sources and sinks
Enormous size of sources best illustrated by comparison with current global primary energy production (year 2001), about 420 EJ, or the annual primary energy requirements predicted for the 21st century, estimated to 600 EJ – 1800 EJ depending on various assumptions. Largest external energy source is solar irradiation.
Solar energy incident on the Earth during one day: 15 ZJcorresponding to about 35 years worth of the global production of primary energy in the year 2001.
In other terms, 4 days–12 days of solar irradiation (600 EJ – 1800 EJ,depending on various assumptions) correspond to the expected cumulative primary energy requirements for the entire 21st century.

13
External sources: solar irradiation
Earth intercepts total solar radiation power P=S π R² ≈ 175 PW, with S=1373 W m-2: solar constant, R=6371 km: radius of the best-fitting sphere for the Earth.
About 35 % (61 PW) directly reflected as short wavelength radiation, 65 % (114 PW) scattered and absorbed in atmosphere, hydrosphere, and lithosphere, and finally re-emitted as long-wavelength radiation.
Of this absorbed fraction, 31 % or 35.3 PW are absorbed in the atmosphere, while 69 % or 78.7 PW reach the surface of the Earth. Thus 45 % of incident solar radiation, can be considered an external source to the terrestrial heat budget.
Most of absorbed energy flux is directly re-emitted as long-wavelength radiation. Only less than 1 ppm (3.2 GW – 32 GW) is converted into biomass by photosynthesis and finally stored in the Earth’s crust as fossil fuels, such as coal and hydrocarbons.

14
External sources: gravitational energy
Tidal deceleration of Earth results in decrease of rotational kinetic energy at a rate of about 3 TW– 6 TW. This energy is dissipated by tidal friction and finally converted into heat. Most of this heat, at least 80 %, is dissipated in the oceans, and only a fraction of less than 20 % in the Earth’s mantle.
Thus, heat derived from gravitational energy is accumulated in the solid Earth at a rate of about 0.6 TW– 1.2 TW.
There is large uncertainty attached to these numbers, and they are probably correct only with respect to the order of magnitude. They indicate, however, that the heat delivered to the Earth by conversion of gravitational energy into heat is 1–2 orders of magnitude less than that which is produced by the decay of radioactive isotopes in the rocks of the Earth (see below). However, the relative importance of gravitational and radioactive heating might have changed during the Earth’s life time

15
Internal sources: Radioactive decay
Radioactive decay: emission of α- and β-particles; neutrinos and antineutrinos (without mass or charge) and γ-rays.
Matter is almost transparent to neutrinos and antineutrinos, no energy delivered to the Earth. In contrast, α- and β-particles (helium nuclei and electrons) interact with the surrounding rock which absorbs their kinetic energy thus generating heat.
Most important isotopes generating radiogenic heat are 238U and 235U (natural uranium: 99.28 % 238U + 0.71 % 235U + 0.01% 234U), 232Th, and 40K (natural Potassium: 0.01167 % 40K). The low concentration of the 40K isotope is made up for by the abundance of potassium in rocks.

16
Internal sources: Radioactive decay
Heat production of a bulk rock: determined from its concentrations in uranium, thorium and potassium.
Current heat generation rate of average Earth Aav determined from estimated concentrations of the radiogenic isotopes 238U, 235U, 232Th und 40K: Aav~27.5 TW. Larger in the geological past, when less radio-active isotopes had yet decayed.
Total heat production E accumulated over a period of 4.6×10⁹ years computed from current value and the different half-lives of uranium, thorium, and potassium: E~8,9×1030 J. This is equivalent to several millions of years of solar irradiation received by the Earth. Earth looses heat by conduction (see below) at rate of Qglobal = 44.2 TW. Combined with total accumulated heat production this global heat loss yields typical cooling time τ of the Earth:
≈30 13 17 9globalτ=E/Q =8.9×10 J /4.42×10 W=2.0×10 s 6.4×10 a

17
Internal sources: Radioactive decay
With respect to age of the Earth (4.6×10⁹ a): current terrestrial heat flow could be sustained by radioactive heat alone at least for another 1.8×10⁹ years.
This period is more than doubled if the original heat and the latent heat which would be liberated during a further solidification of the Earth’s core are also considered.
The ratio of radiogenic heat generation to global heat loss is:27.5 TW /44.2 TW = 0.62.
Thus, slightly less than ⅔ of the Earth’s heat output can be accounted for by radioactivity.

18
Internal sources: Original heat, frictional heat
Cooling of the Earth since its early history − when internal temperatures were much higher than they are now − contributes a significant amount to the present terrestrial heat flow comparable to that from radiogenic heat.
Assuming an average specific heat capacity of 1088 J kg-1 K-1 and a temperature drop of 650 K over a cooling time of 4.6×10⁹ years yields 29 TW as the average rate for the loss of original heat.
As the heat loss was much larger for the hotter and not yet solidified young Earth than today, this contribution is certainly lower at present.
Frictional heat dissipation: 0.016 TW – 1.3 TW due to release of elastic energy in earthquakes (for 10–40 earthquakes per year of surface wave magnitudes Ms>7)

19
Internal sources: Summary
Maximum estimate for the non-radiogenic heat generation rate from original heat, potential energy, and frictional heat: 78 TW. True value certainly much lower.
Actual current terrestrial non-radiogenic heat generation can be estimated from difference between current average radiogenic heat production rate of 27.5 TW and Earth’s total heat loss of 44.2 TW(see below).
This yields 16.7 TW for the current rate of non-radiogenic heat generation in the Earth. Thus radiogenic exceeds non-radiogenic heat generation by a factor of 5/3

20
Heat income
Thermal power (TW) received by the Earth from different sources.
16.7
27.5
38 % non-radiogenic
Total: 44.2 TW
62 % radiogenic

21
Heat expenditure
The Earth is loosing heat owing mainly to four processes:
• long-wavelength heat radiation;• energy supply to the geomagnetic dynamo; • volcanism;• global heat flow.
By far largest contribution: global heat flow.

22
Heat sinks: Long-wavelength heat radiation
Of the Sun’s irradiation power of 35.3 PW which are absorbed in the atmosphere,
• 73 % are directly heating the atmosphere,• 27 % are converted into kinetic (wind) energy. These transmit about 10
% of their energy to waves on the surface waters of the Earth. Ultimately, all wind and wave energy is converted again into heat and re-emitted as long-wavelength radiation.
Because rocks and soil are poor heat conductors, most of the energy flux of 78.7 PW incident at the Earth’s surface does not penetrate to any depth greater than one meter and must be re-emitted as long-wavelength radiation, particularly at night. Since only small amounts of solar energy are converted into energy forms that can be permanently stored in the Earth, any disturbance of the delicate balance between solar income and terrestrial radiation will lead to a heating of the Earth’s surface.

23
Heat sinks: Powering of the geomagnetic dynamo, volcanism, and global heat flow
Volcanic lava flows, ash eruptions, and steam venting advect heat through the Earth’s surface at a rate of ~ 320 GW, two orders of magnitude less than the conductive heat loss.
Global rate of conductive heat loss across the surface of the Earth: Qglobal = Qoceans + Qcontinents = 31 TW + 13,2 TW = 44.2 ± 1.0 TW.
In the oceans, 34±12 % or 11±4 TW is associated with hydrothermal flow.
Average global specific heat flow (24774 observations at 20201 locations:10337 continental; 9864 marine): 87 mW m-2
(continents: 67 mW m-2, oceans: 101 mW m-2).

24
Heat sinks: Powering of the geomagnetic dynamo, volcanism, and global heat flow
Thermal and compositional convection in the Earth’s fluid outer core contribute to heat flow and provide the energy for driving the geomagnetic dynamo (no heat sink since this electromagnetic energy is finally dissipated as heat).
Combined analyses of laboratory dynamo experiments and numericalsimulations indicate that 200 GW – 500 GW is required to drive the geomagnetic dynamo. With Carnot-style efficiencies of 5 % - 15 % for the conversion of thermal and compositional convection into magnetic field energy, this yields a heat flow on the order of 1 TWrequired for driving the geomagnetic dynamo.

25
Heat sinks: Global heat flow
Specific heat flow vs. age based on 13003 observations in the continental crust. (left to right: Cenozoic, Mesozoic, Paleozoic, Proterozoic, Archean).
0 1000 2000 3000 4000Age (Ma)
20
40
60
80
100
120
140
Spec
ific
Hea
t Flo
w (
mW
m-2
)
6617
global mean: 87 mW m-2
2213963
2950
260

26
Heat expenditure: Summary
Thermal power (TW) spent by the Earth via different processes (disregarding long-wavelength heat radiation).
44.20
1.000.32
Total: 44.52 TW
99.3 % heat flow(powering of geomagnetic dynamo)0.7 % volcanism

27
Energy budget of the Earth
Budget of the Earth’s heat income and expenditure negative – Earth loses heat at a rate of approximately 1.4 TW.
Numbers based on balance calculated between the Earth’s global heat loss by heat flow and the estimated radiogenic heat generation rate. Uncertainty is largely dominated by uncertainty of this estimate – future estimates may modify this number to a certain extent.
However, beyond doubt Earth has been loosing heat since its formation and still continues to do so at a rate equivalent to roughly 2 ppm of Earth’s solar irradiation

28
Thermal regime of the Earth
Thermal anomalies in the oceans and on the continents where heat is not only diffused to the surface only but also advected by moving fluids:
• near mid-ocean ridges (upwelling magma, large lateral temperature gradients);
• above hot spots and in volcanic regions;• in many sedimentary basins on the continents where heat is
redistributed by regional or focused groundwater flow
Economic production of geothermal energy is facilitated, but notrestricted to, regions of elevated heat flow. Various types of geothermal energy extraction schemes are available, suitable for both power production and direct thermal use (see later), which can be implemented in high and low temperature regimes, respectively.

29
World Tectonics and geothermal fields
ww
w.geo.lsa.um
ich.edu/IHFC
/heatflow.htm
l
World map of specific heat flow q (mW m-2) from degree 12 spherical harmonic expansion of more than 24.000 field data supplemented by heat flow estimates in unsurveyed regions

30
World Tectonics and geothermal fields
World tectonic map and geothermal fields: (1) Geothermal fields producing electric energy; (2) mid-oceanic ridges crossed by transform faults; (3) subduction zones.
Dickson
and Fanelli, 2004

31
Plate tectonics
Cross section of oceanic and continental crust showing plate tectonic processes
Dickson
and Fanelli, 2004

32
Thermal Anomalies in EuropeH
urter& S
chellschmidt, 2002

33
Geothermal systems
Schematic geothermal steam system
Dickson
and Fanelli, 2004

34
Heat Storage: Specific heat capacity
Heat capacity C determines heat stored in rocks and their pore fluids. It is defined as the ratio of heat ΔQ required to raise the temperature of a body by ΔT: C= ΔQ / ΔT. Specific heat capacity c is heat capacity divided by mass M: c = C / M = ΔQ / (ΔT M).
Isobaric specific heat capacity cP (at constant pressure) is larger than isochoric specific heat capacity cV (at constant volume) because additional work is required for volume expansion. Their ratio, the adiabatic exponent, is equal to
cP/cV = βT/ βS = KS/KT = 1 + α γ T, where β = ΔV/(V ΔP) is compressibility, its inverse K = V ΔP/(ΔV) is incompressibility or bulk modulus, α = ΔV / (V ΔT) the volume expan-sion coefficient, and γ = α KS/(ρ cP) = α KT/(ρ cV) is the dimension-less Grüneisen parameter. Inserting expressions for α and K yields:
The Grüneisen parameter γ is thus the relative pressure change in a material heated at constant volume.
P P
1 V V P Pc V T V c T
Δ Δ Δγ = =ρ Δ Δ ρ Δ

35
Heat Storage : Specific heat capacity
Alternatively, isobaric specific heat capacity cP can be expressed by means of enthalpy H(T,P): H = E + P V, where E is internal energy, P pressure and V volume.
In a closed system, the change in internal energy (dE) is the sum of the change in heat (dQ) and the work delivered (dW): dE = dQ + dW. If we only consider volume expansion work: dW = -P dV, the change in enthalpy dH becomes:
Comparing coefficients, we obtain
Thus,specific heat capacity cP is the first derivative of enthalpy with respect to temperature if dQ=ΔQ/M, and if the isobaric enthalpy change is equal to the specific heat content ΔH = ΔQ/M.
For crustal rocks (γ=0.5; α=20 µK-1; T<103 K; ρ=2600 kg m-3; KS<75 GPa, the difference between isobaric and isochoric specific heat capacity cP-cV <9 J kg-1 K-1. This is less than 1 % and can be neglected.
P TH HdH(T,P) dE PdV VdP dQ VdP dT dPT P
⎛ ⎞ ⎛ ⎞⎜ ⎟ ⎜ ⎟⎜ ⎟ ⎜ ⎟⎜ ⎟ ⎜ ⎟⎝ ⎠ ⎝ ⎠
∂ ∂= + + = + = +∂ ∂
PP
dQ Hc dT T⎛ ⎞⎜ ⎟⎜ ⎟⎜ ⎟⎝ ⎠
∂=∂

36
Heat Storage : Specific heat capacity
Specific heat capacity c can be measured directly or derived as the isobaric derivative of enthalpy H with respect to temperature.There are numerous steady-state and transient calorimetric methods
available for direct measurement of specific heat capacity. The most popular are mixing or drop calorimeters and heat flux differential scanning calorimeters (DSC). The first method yields an absolute value, the second one is a comparative method
Measuring principle (left) and experimental set-up (right: PC, DSC, controller and power supply) of a heat flux differential scanning calorimeter.
ΦP ΦR

37
Heat Storage : Specific heat capacity
When no direct measurements can be performed, isobaric enthalpy change and specific heat capacity of rocks can be calculated from Kopp’s law as the arithmetic mean from the contributions of the individual mineralogical constituents and saturating fluids of the rock weighted by the volume fractions ni of the N individual phases relative to total rock volume, where 1=∑ni:
Variation of isobaric enthalpy change ΔH with temperature T for common rock forming oxides
N Ni i iii 1 i=1
H = H ; c = cn n=
Δ Δ∑ ∑

38
Heat Storage : Specific heat capacity
Freezing and thawing of water in soils or rocks liberates or consumes heat, respectively.
Latent heat L corresponds to these additional heat sources and sinks and can be combined with the specific heat capacities of water and ice, cf and cice respectively, into an effective specific heat capacity ceff of the pore space.
This effective specific water heat capacity then accounts for the entire enthalpy change, including latent heat. In this approach, the latent heat effects are assumed to occur between the solidus and liquidus temperatures T1 and T2, respectively. Weighting by the volume fractions of unfrozen fluid water φf and ice φice, the enthalpy change of the water volume becomes dH = (φf cf + φice cice) dT + L dφf, and the effective water heat capacity ceff is:
feff f f ice ice
ddHc c c LdT dTφ
= =φ +φ +

39
Heat Storage : Thermal capacity
Thermal capacity (ρ c) (volumetric heat capacity), is related to thermal conductivity λ and diffusivity κ: (ρ c) = λ / κ. Analogous to specific heat capacity, the bulk rock thermal capacity (ρ c)b is:
where φ is porosity, (ρ c)s thermal capacity of the rock skeleton, Si frac-tional saturation, and (ρ c)i thermal capacity of the ith fluid phase in the pore space.
Variation of thermal capacity (ρ c) with temperature (left) and thermal diffusivity κ with thermal conductivity λ (right) for common rock types (slope = 1 / (ρ c) ).
Nib s i1
c 1 c S c⎛ ⎞⎛ ⎞ ⎛ ⎞ ⎛ ⎞⎜ ⎟⎜ ⎟ ⎜ ⎟ ⎜ ⎟ ⎜ ⎟⎝ ⎠ ⎝ ⎠ ⎝ ⎠ ⎝ ⎠ρ = −φ ρ +φ ρ∑
sedimentsvolcanic rocksbasic magmatic rockspicriteultra-mafic rocksgneissamphibolite
κ = 0.44 × 10⁻⁶ λ = λ / 2.3 × 10⁶
2.0 2.5 3.0 3.5 4.0 4.5
λ ( W m-1 K
-1 )
1.0
1.5
2.0
κ
( 10-6
m2 s
-1 )
+ 20 %
- 20 %
20 40 60 80 100T ( °C )
2.2
2.4
2.6
ρ c
(M
J m
-3 K
-1 ) ρ c = 2.134 + 0.0044 T

40
Heat conduction : Thermal conductivity
Fourier’s law of heat conduction defines specific heat flow qi, i.e. heat flow normalized by area, as the product of the thermal conductivity tensor λijand the temperature gradient vector ∂T/∂xj:
Thermal conductivity in some rocks is, to a good approximation, isotropic, particularly for volcanic and plutonic rocks: Heat flow will be predominantly vertical, and it is sufficient to consider only the vertical component of q.
In contrast, thermal conductivity of many sedimentary and metamorphic rocks, is strongly anisotropic, and lateral heat flow will be significant. Hence information on anisotropy is often required, demanding laboratory measurements in different directions. Anisotropy may have different reasons: (1) many minerals are anisotropic; (2) folding, orogenic or other tectonic processes.
i ij jTq = x
∂−λ ∂

41
Heat conduction : Thermal conductivity
Thermal conductivity λ can be measured in the laboratory on rock samples, i.e. cores or cuttings, or in situ either in boreholes or with shallow penetration (3 m – 20 m) marine heat flow probes. There are numerous steady-state and transient techniques available for measuring thermal conductivity, the most prominent being the "divided bar", "needle probe", and “optical scanning”
Experimental set-up of a thermal conductivity scanner (from left to right: PC, controller and scanner).

42
Heat conduction : Thermal conductivity
Thermal conductivity λ can be inferred from mineralogical composition and saturating fluids: While some methods are based on well defined physical models, others are purely empirical:
Parallel and series model for thermal resistance of layered media: easy to understand, but rather special cases, applicable mostly to bedded sediments; correspond to the well known arithmetic and harmonicmeans λari and λhar, respectively, and define upper and lower limits for all other models, and constrain the maximum variance of possiblepredictions.
Geometric mean λgeo: Successful in many cases, but without a clearly defined physical model; falls in between λhar and λari
Hashin-Shtrikman mean λHS: its upper and lower bounds, provide tighter constraints for the predictions of different models other than the arithmetic and harmonic means.
Effective medium mean λeff: Based on effective medium theory, useful for macroscopically homogeneous and isotropic rocks consisting of randomly distributed grains and pores.

43
Heat conduction : Thermal conductivity
For a two-component system consisting of pore fluid (porosity φ) and solid rock (solidity 1- φ ) with thermal conductivities λf and λs the upper and lower Hashin-Shtrikman means are:
i
-1N N ii i meanmax ari min har ii=1 i 1
N Nn 1 iigeo effi 1 i 1 i
1n(a) ; (b) ; (c) ;n 23n (d) = ; (e) = ; (f) 2
⎛ ⎞⎛ ⎞⎜ ⎟⎜ ⎟⎜ ⎟⎜ ⎟⎜ ⎟
⎜ ⎟ ⎝ ⎠⎝ ⎠⊥ ⊥=
−= =
λ =λ=λ = =λ = λ = λ +λλ =λ ∑ ∑λ λ
λ∏ ∑λλ λ+λU L
HS HS HS1 = ;2
⎛ ⎞⎜ ⎟⎜ ⎟⎝ ⎠
λ λ +λ
U sHS
s sfLHS f
s f f
113
1 .1
3
φλ =λ +−φ+
λ −λ λ−φλ =λ +
φ+λ −λ λ
L Umean geoHS HS HShar eff ari⊥λ =λ <λ <λ <λ <λ <λ <λ <λ =λ

44
Heat conduction : Thermal conductivity
Thermal conductivity λ can be inferred from the volume fractions Vi of the N different mineral (or fluid) phases are determined from a joint analysis of a suitable number J of geophysical logs such as gamma ray (GR), sonic slowness (DT, the inverse of velocity), gamma density (DEN), and neutron porosity (NPHI). If x and b are vectors consisting of the N volume fractions Vi and the J theoretical log responses Rj with respect to the N different rock constituents, then
Arranging the specific responses of each log to the N rock constituents as rows of the matrix A:
we can write the direct and inverse problems as:
N Nj j T 1 N TN1i i ii i
R n R , where: n 1, and [n , ,n ] , [R , ,R ] .= = = =∑ ∑ x b… …
1 1N1
J JN1
R R
R R
⎡ ⎤⎢ ⎥⎢ ⎥⎢ ⎥⎢ ⎥⎢ ⎥⎢ ⎥⎢ ⎥⎢ ⎥⎣ ⎦
=A
and −= = 1A x b x A b

45
Heat conduction : Thermal conductivity
Sand-Shale-Carbonate model for a borehole. From left to right: (1): Input data: NPHI - neutron porosity; GR - natural gamma radiation; DT - acoustic slow-ness. (2): Composition comput-ed from input logs. (3): Log of saturated thermal conductivity λ(log) computed from composi-tion (geometric mean). (4): Log of dry thermal conductivity λ(log) computed from composition (geometric mean). In (3) and (4) thermal conductivity measured on saturated and dry core is shown as red and cyan circles, respectively

46
Heat conduction : Thermal conductivity
Thermal conductivity of four basic rock types
0 1 2 3 4 5 60
5
10
15
20
25
30
35
40
Freq
uenc
y (%
)
λ (W m-1 K-1)
(a) Sedimentary Rocks
n=1564, chemicaln=648, physical (terrestrial, low porosity)n=4204 physical (marine, high porosity)
0 1 2 3 4 5 60
2
4
6
8
10
12
14
16
18
λ (W m-1 K-1)
Freq
uenc
y (%
)
(b) Volcanic Rocks
n=115, high porosityn=4335, low porosity
0 1 2 3 4 5 6 7 80
2
4
6
8
10
12
14
λ (W m-1 K-1)
Freq
uenc
y (%
)
(d) Metamorphic Rocks
n=514, rich in quartzn=12926, poor in quartz
1 1.5 2 2.5 3 3.5 4 4.5 50
2
4
6
8
10
12
14
16
18
λ (W m-1 K-1)
Freq
uenc
y (%
)
(c) Plutonic Rocks
n=805, rich in feldsparn= 6088, poor in feldspar

47
Variation of thermal conductivity with temperature
Phonon conduction, empirical: λ ~ 1/T
Vosteen & Schellschmidt (2003).
magmatic and metamorphic rocks ( 0 °C – 500 °C):
sedimentary rocks ( 0 °C – 300 °C)
B(T) = A + 350 + Tλ
00 0intercept slope0
(T) or (T) a (b c ) Ta T b c⎛ ⎞
⎜ ⎟⎜ ⎟⎝ ⎠
λλ = λ λ = + − λ
+ − λ
2
2(25)) (25)
(0)(T)0.99 T b c (0)
(0) 0.53 (25) 0.5 1.13( (25)) 0.42 (25); b 0.0030 0.0015; c 0.0042 0.0006
(0) 0.54 (25) 0.5 1.16( 0.39 ; b 0.0034 0.0006; c 0.0039 0.0014
⎛ ⎞⎜ ⎟⎜ ⎟⎝ ⎠
λ λ
λλ =+ − λ
λ = λ + λ − λ = ± = ±
λ = λ + − = ± = ±
48
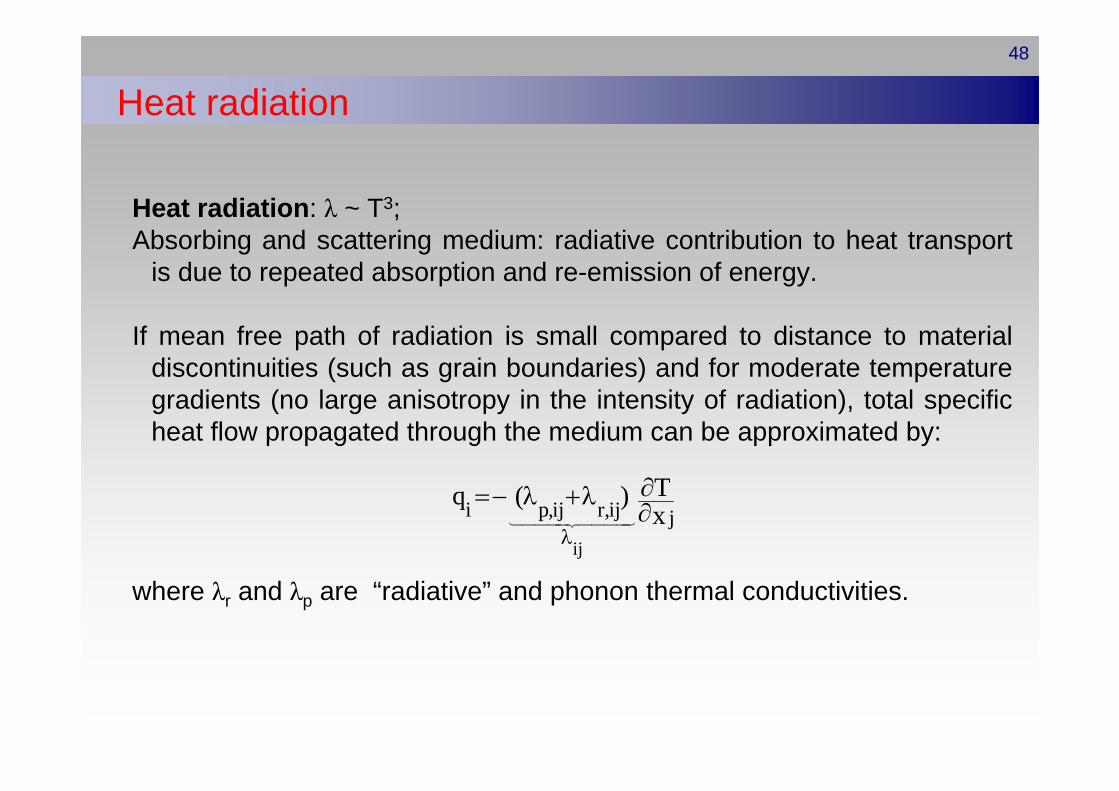
Heat radiation
Heat radiation: λ ~ T3; Absorbing and scattering medium: radiative contribution to heat transport
is due to repeated absorption and re-emission of energy.
If mean free path of radiation is small compared to distance to material discontinuities (such as grain boundaries) and for moderate temperature gradients (no large anisotropy in the intensity of radiation), total specific heat flow propagated through the medium can be approximated by:
where λr and λp are “radiative” and phonon thermal conductivities.
ij
i p,ij r,ij jTq ( )x
λ
∂=− λ +λ∂

49
Variation of thermal conductivity with temperature
The intensity I transmitted by radiation, is related to the incident intensity I0, the radiation path, x, and the opacity, ε: I = I0 exp(-εx). Opacity is defined as the reciprocal mean free path l of radiation (i.e. the average distance a photon travels between it interacts with matter) as ε = 1/ l. In general, opacity is a function of the radiation wavelength. Opacity in an absorbing and scattering medium is the sum of contributions from these two processes: ε =χ + ς, where χ and ς are the absorption and scattering coefficients, respectively. Gray body approximation: opacity ε is finite, constant, and independent of the radiation’s wavelength.
All materials have a complex index of refraction m defined by: m = n – iK, where n=c0/c (the ratio of the speed of light in vacuum and in a substance) is the real part of the index of refraction, i = (-1)1/2, and K is the imaginary part of the index, sometimes also called extinction coefficient. The absorption coefficient χ is related to the complex index of refraction K by:
where Λ is the wavelength of radiation.
4 K/χ= π Λ

50
Variation of thermal conductivity with temperature
If the real part of the index of refraction and the spectral radiance are also independent of wavelength and temperature T, λr can be expressed by:
where σ = 5,6704×10⁻⁸ W m-2 K-4 is the Stefan-Boltzmann constant.
As an example of magnitude, when opacity ε is identified with the absorption coefficient χ (neglecting contributions from scattering) and taking typical silicate values of n = 1.7 and values of the olivine (Fo92Fa08) and the absorption coefficient χ at 1700 K of1000 m-1 < χ < 1500 m-1 this yields a range for radiative thermal conductivity λr at 1700 K of
4.29 W m-1 K-1 > λr > 2.86 W m-1 K-1.
Refractive index n of some substances.
1.5 – 1.6glass
1.544rock salt (NaCl)
2.417diamond
1.628carbon disulfide (CS2)
1.333Water
1.000272air
n=c0/csubstance
2 3r16 n T3
σλ = ε

51
Variation of thermal conductivity with temperatureA more detailed analysis of heat transport based on an analysis of phonon
lifetimes obtained from infrared reflectivity has been provided by Hofmeister (1999), accounting for the variation of the phonon contribution λp to thermal conductivity with both temperature and pressure as well as for the pressure dependent radiative contribution λr to thermal conductivity. It replicates experimental data at ambient conditions and is therefore particularly attractive for calculating mantle geotherms.
Assuming: (1) K’0=dKT/dP=const (K’0: pressure derivative of the isothermal bulk modulus KT); (2) the variations of K as a function of temperature and pressure are mutually independent; (3) the pressure derivative of the Grüneisen parameter γ is constant: dγ/dP=f. For mantle substances: 1 < γ < 1.4; 5 < K’0 < 5, and f≈0. Within the uncertainty of these parameters, thermal conductivity under mantle condition is given by Hofmeister (1999) as
where λ298 K, 1 atm: thermal conductivity at ambient conditions; α(T): volume coefficient of thermal expansion as a function of temperature.
a T 0 r298K,1atm 298 T
K P298(T,P) exp 4 1 3 ( )d 1T K
⎛ ⎞⎡ ⎤⎛ ⎞ ⎜ ⎟⎢ ⎥⎛ ⎞⎜ ⎟ ⎜ ⎟⎢ ⎥⎜ ⎟⎜ ⎟ ⎜ ⎟⎜ ⎟⎢ ⎥⎜ ⎟ ⎝ ⎠ ⎜ ⎟⎢ ⎥ ⎜ ⎟⎝ ⎠ ⎣ ⎦ ⎝ ⎠
′λ =λ − γ+ α θ θ + +λ∫

52
Variation of thermal conductivity with temperatureThe radiative contribution λr may be again approximated by
Alternatively, Hofmeister (1999) provides expressions for λr (in W m-1 K-1) for ferrous minerals or dense silicates and oxides:
4 7 2 11 3r11 3r
0.01753 1.0365 10 T 2.2451 10 T 3.407 10 T (ferrous minerals)8.5 10 T (dense silicates and oxides).
− − −
−λ = − × + × − ×λ = ×
2 3r16 n T3
σλ = ε
0 500 1000 1500 2000 2500
T (°C)
0.0
0.5
1.0
1.5
2.0
λ r (W
m-1
K-1
)
ferrous mineralsdense silicates & oxides

53
Variation of thermal conductivity with temperature
Variation of thermal conductivity with temperature: λ ~ 1/T

54
Variation of thermal conductivity with porosity, saturation
0 20 40 60 80 100φ (%)
0.0
0.5
1.0
1.5
2.0
2.5
λ (W
m-1
K-1
)
airwater
0 25 50 75 100Water Saturation (%)
0.6
0.7
0.8
0.9
1.0
λ/λ r
ef
Sandstone; λref = 4.5 W m-1 K-1
Granite; λref = 3.15 W m-1 K-1
0 25 50 75 100Oil Saturation (%)
0.7
0.8
0.9
1.0
λ/λ 1
00 %
mean± σ
0 25 50 75 100Oil Saturation (%)
0
5
10
15
20
N

55
1088 measurements: (1) 21 limestones; (2) 54 lime-stones; (3) 13 quartz sand-stones; (4) 44 quartz silt-stones; (5) 35 conglomerates; (6) 141 quartz sandstones; (7) 33 claystones; (8) 99 poly-mictic sandstones; (9) 30 quartz sandstones; (10) 22 claystones; (11) 65 quartz silt-stones; (12) 99 quartz silt-stones; (13) 241 quartz silt-stones
Variation of thermal conductivity with porosity

56
Set 1: 13 means based on 1088 measurements: (1) 21 limestones; (2) 54 lime-stones; (3) 13 quartz sand-stones; (4) 44 quartz silt-stones; (5) 35 conglomerates; (6) 141 quartz sandstones; (7) 33 claystones; (8) 99 polymictic sandstones; (9) 30 quartz sandstones; (10) 22 claystones; (11) 65 quartz silt-stones; (12) 99 quartz silt-stones; (13) 241 quartz silt-stones; For comparison: Set 2: 58 oceanic basalts; Set 3: 179 shaly and limy sandstones
Variation of thermal conductivity with porosity
0 0.1 0.2 0.3 0.4 0.5 0.6 0.7 0.8 0.9 10
0.1
0.2
0.3
0.4
0.5
0.6
0.7
0.8
0.9
1
φ
λ d / λ s
harmonic
HS-
geometric
square-root
HS+arithmetic
Set 1Set 2Set 31
2
3
45
6 7 8
910
11 1213

57
Heat advection
Non-Isothermal flow is always associated with advective heat transport. In porous medium flow Darcy’s equation describes the linear relationship between the specific fluid discharge v and the pressure gradient ∇P over a wide range of pressure gradients:
where ρf and μ are the density and dynamic viscosity of the water; hydraulic permeability tensor k, and g is gravity.
With and we obtain.
The equation of continuity follows from the law of mass conservation:
where W accounts for sources and sinks.
fP g z⎛ ⎞⎜ ⎟⎜ ⎟⎝ ⎠
=− ∇ +ρ ∇μkv
f r0g ( h z)−ρ
= ∇ +ρ ∇μkv
0f r0 0f 0(1 ) (1 )ρ −ρ
ρ =ρ + =ρ +ρρ 0 0Ph z g= +ρ
*ff
( )0 ( ) Wt∂ ρ φ
= +∇ ρ +ρ∂
v

58
Heat advection
The flow equations follows from inserting the Darcy equation into the equation of continuity:
where Ss = ρf g (α+β φ) is the specific storage coefficient.
In a similar way, the heat transport equation follows from inserting Fourier’s heat conduction law into the equation of energy conservation:
where A is heat generation rate, and ρc and (ρc)f are the thermal capacities of the saturated medium and the fluid.
*0 fs r0 0
ρ gkh ρS ( h ρ z) Wμ ρt
⎛ ⎞⎜ ⎟⎜ ⎟⎜ ⎟⎜ ⎟⎜ ⎟⎝ ⎠
∂=∇ ∇ + ∇ +
∂
f( cT) T ( c) T At
⎛ ⎞⎜ ⎟⎜ ⎟⎝ ⎠
∂ ρ =∇ ∇ − ρ +∂
λ v
59
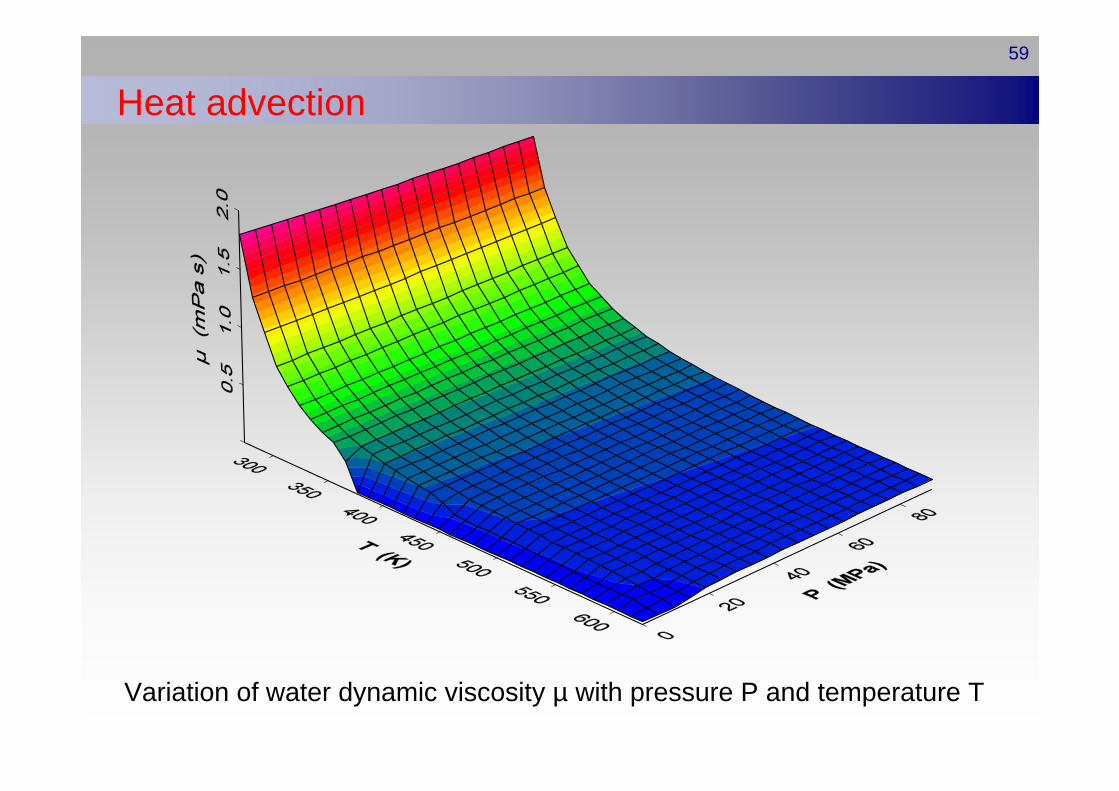
Heat advection
Variation of water dynamic viscosity µ with pressure P and temperature T

60
Heat advection
Variation of water relative density ρr (with respect to P=0.1 MPa and T=293.15 K=20 °C) with pressure P and temperature T.

61
Heat advection
Permeability k versus porosity φ for different consolidated and uncon-solidated clean and shaly sand-stones from the North German sedimentary basin. Colored curves, calibrated by several hundred data points, correspond to different clean to shaly sandstones (top to bottom), and are validated by independent data (symbols). Broken red line corresponds to average North German sandstone; straight dotted line to the frequently employed cubic relationship bet-ween permeability and porosity; bent, straight line characterizes French Fontainebleau sandstone.
100 101 1023 4 5 6 2 3 4 5 6 7 2 3 4 5 6 7
porosity φ (%)
10-4
10-3
10-2
10-1
100
101
102
103
104
105
106
107
108
109
perm
eabi
lity
(nm
2 )
62
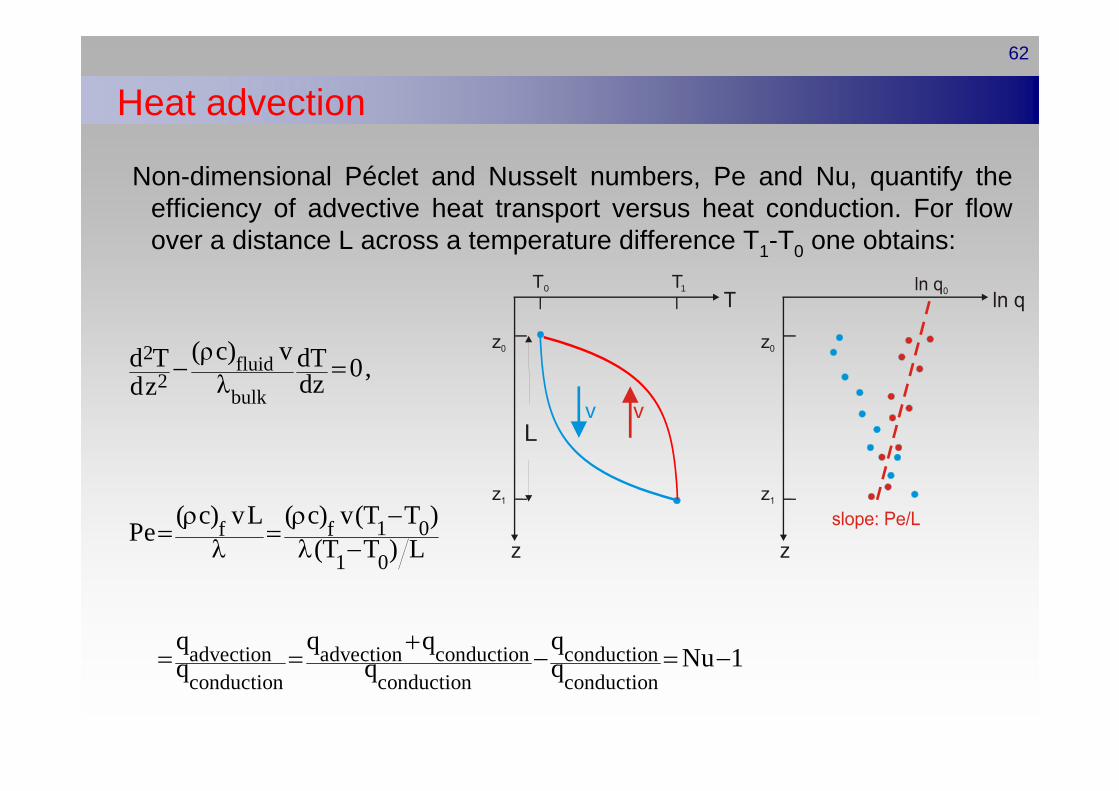
Heat advection
Non-dimensional Péclet and Nusselt numbers, Pe and Nu, quantify the efficiency of advective heat transport versus heat conduction. For flow over a distance L across a temperature difference T1-T0 one obtains:
1 0f f1 0
advection advection conduction conductionconduction conduction conduction
( c) vL ( c) v(T T )Pe (T T ) L
q q q qNu 1q q q
ρ ρ −= =
λ λ −
+= = − = −
L
z
T0
vv
T1
z
2 fluid2
bulk
(ρc) vd T dT 0,λ dzdz− =

63
For flow over a depth interval L=z1-z0 one obtains a temperature difference T1-T0. In non-dimensional variables
one obtains:
an ordinary (not partial), homogeneous (=0), linear 2nd order pdf with constant coefficients 1 and Pe. Its solution is:
,
where ri are the real roots of the characteristic equation r2- r Pe = 0 =r (r-Pe).r1=Pe; r2=0, and thus:
Coefficients C1 and C2 follow from boundary conditions:Θ(0)=0 (or T(z0)=T0) and Θ(1)=1 (or T(z0+L)=T1).
Vertical Péclet number analysis
.0 01 0
T T z zΘ and ζT T L− −
= =−
22
d Θ dΘPe 0dζdζ− =
1 2r ζ r ζ1 2Θ(ζ) C e C e .....= + +
Peζ1 2Θ(ζ) C e C= +

64
0
1 2
2 1 1Pe Pe
1 2 1 1
1 Pe Pe
PeζPeζPe Pe Pe
Pe(z z )L0Pe
0 0
Θ(0) C C ; C Θ(0) C CΘ(1) C e C C e C ,
Θ(1) 1C(e 1) (e 1)
1 1 e 1Θ(ζ) e (e 1) (e 1) e 1
T(z) T(z ) e 1T(z L) T(z ) e 1
=
−
= += − =−= + = −
= =− −
−= − =− − −
− −=+ − −
yielding:thus:
Therefore:
Vertical Péclet number analysis
0 0.2
0.4
0.6
0.8 1
ς
0
0.
2
0.
4
0
.6
0
.8
1Θ
-10
-5
-3-2
-1-0
.50
0.5
1
2
3
5
10

65
Variable thermal conductivity cast equation in terms of specific heat flow:
with ζ=(z-z0), dζ=dz yielding:
which has the characteristic equation r-Pe/L = 0 yielding r=Pe/L.
Therefore:
The boundary condition q(0)=q0 yields: q0=C from which we have:
Vertical Péclet number analysis
f(ρc) vdq Pe Peq 0; with: L Ldz λ− = =
dq Peq 0Ldζ − =
PeζLq(ζ) Ce=
0(z z )PePeζL L0 0 0
00 0 0
q(ζ) q e or q(z z ) q e(z z )ζlnq(ζ) lnq Pe or lnq(z z ) lnq PeL L
−= − =
−= + − = +