Applications of Gel Permeation Chromatoggpyraphy (GPC) to ...
25
Applications of Gel Permeation Chromatography (GPC) to Asphalt Binder Binder Characterization William H. Daly Ionela Glover, Ioan Negulescu
Transcript of Applications of Gel Permeation Chromatoggpyraphy (GPC) to ...

Applications of Gel Permeation Chromatography g p y(GPC) to Asphalt Binder Binder Characterization
William H. DalyIonela Glover, Ioan Negulescu

The CoThe Co authorsauthorsThe CoThe Co--authorsauthors
Ioan Negulescu Ionela GloverIonela Glover
11/4/2010 2

ACKNOWLEDGMENTSC O LE G E S
Bill King
Chris Abadie Rafael Cueto
3

ObjectivesObjectives
Develop Experimental Procedures for utilizing GelDevelop Experimental Procedures for utilizing Gel Permeation Chromatography (GPC)
Evaluate binder changes during processing sequence i GPC
Observe impact of RAP addition during processing
using GPC
Follow aging process by coring pavements at annual intervals
11/4/2010 4

Sequence of Binder Samples for this Studythis Study
1.BinderRefinery
6.Binder Extracted from Road Cores
after 6 months7.After 12 months
Refinery after 6 months
2.Binder Hot Mix Asphalt
Plant (tank)
5.Binder Extracted from Fresh Road
Cores
8.After 24 months(no samples yet)
Plant (tank)
3 B E
Cores
3.Binder Extracted from HMA Plant :
Mixture Binder+Agg.+RAP
(DRUM)
4.Binder Extracted from HMA (after
transport)
RAP
11/4/2010 5

A B EA B E
CORE 6”6”
Asphalt Binder ExtractionAsphalt Binder Extraction
SOHXLET EXTRACTION ROTARY EVAPORATOR
6Vacuum Oven OVERNIGHT
SEDIMENTATION
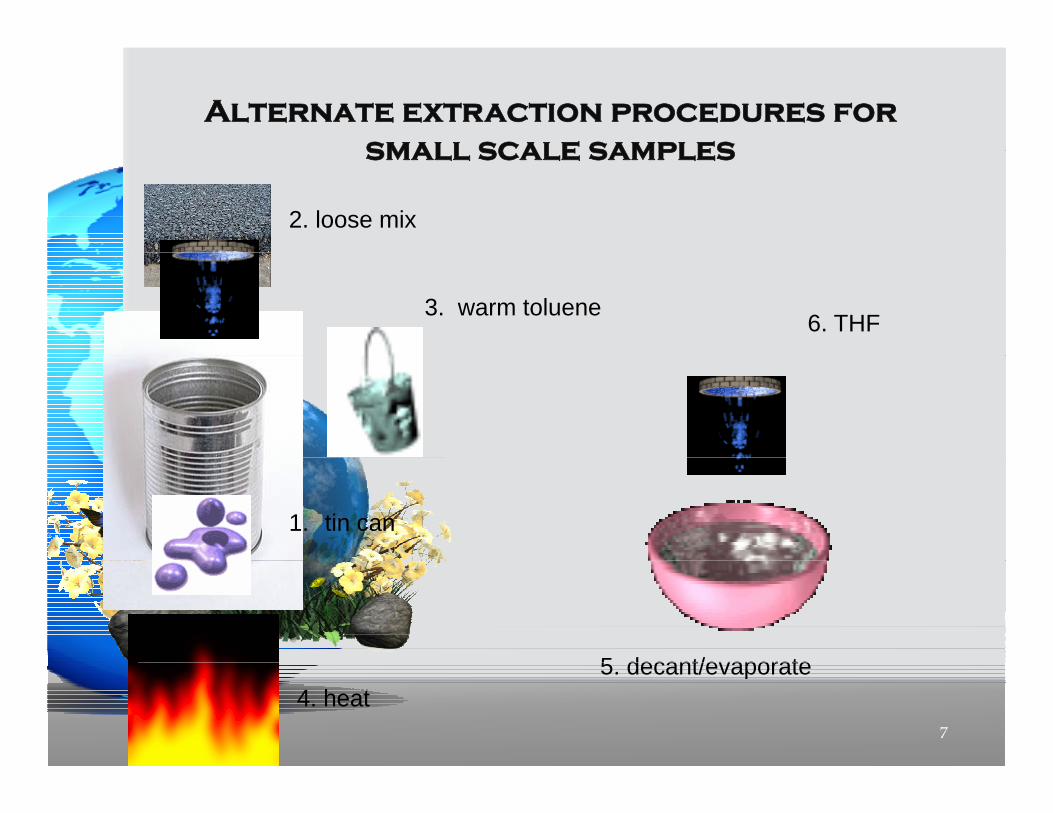
Alternate extraction procedures for small scale samplessmall scale samples
2. loose mix
6. THF3. warm toluene
1. tin can
5 decant/evaporate
7
4. heat 5. decant/evaporate
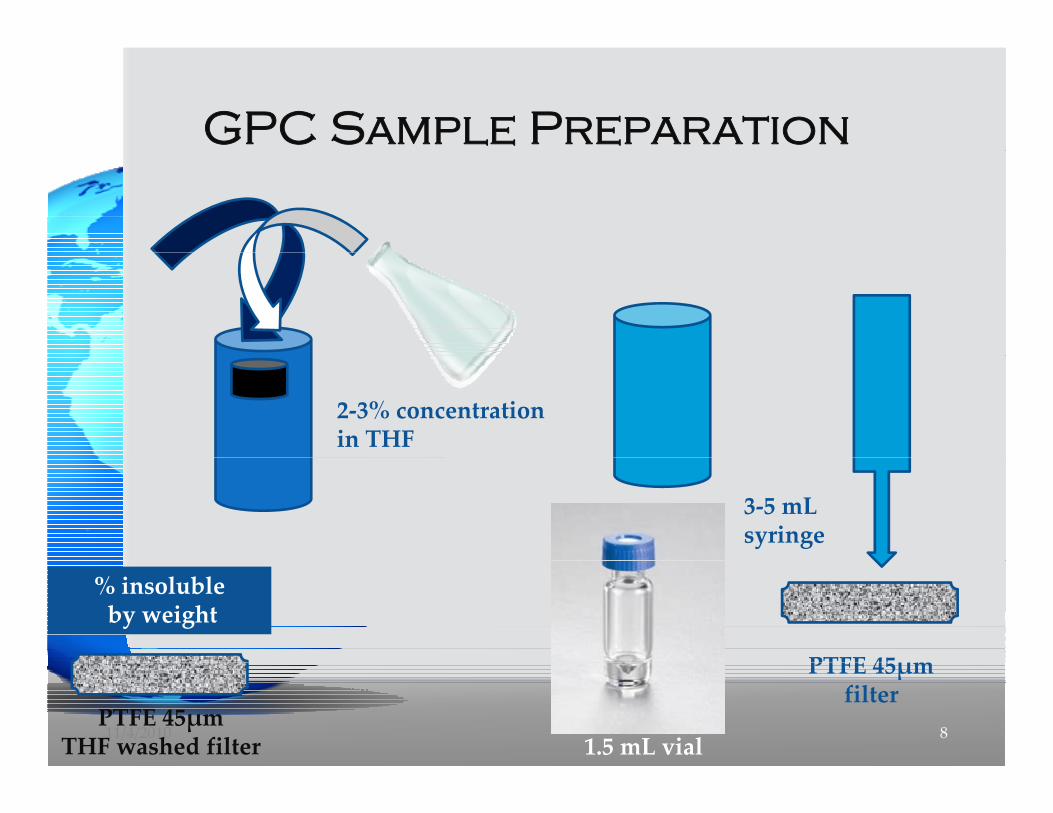
GPC Sample Preparation
2‐3% concentrationin THF
3‐5 mLsyringe
PTFE 45μm
% insoluble by weight
8
PTFE 45μmfilter
1.5 mL vialPTFE 45μm
THF washed filter11/4/2010

Agilent 1100 GPC SystemAgilent 1100 GPC System
911/4/2010
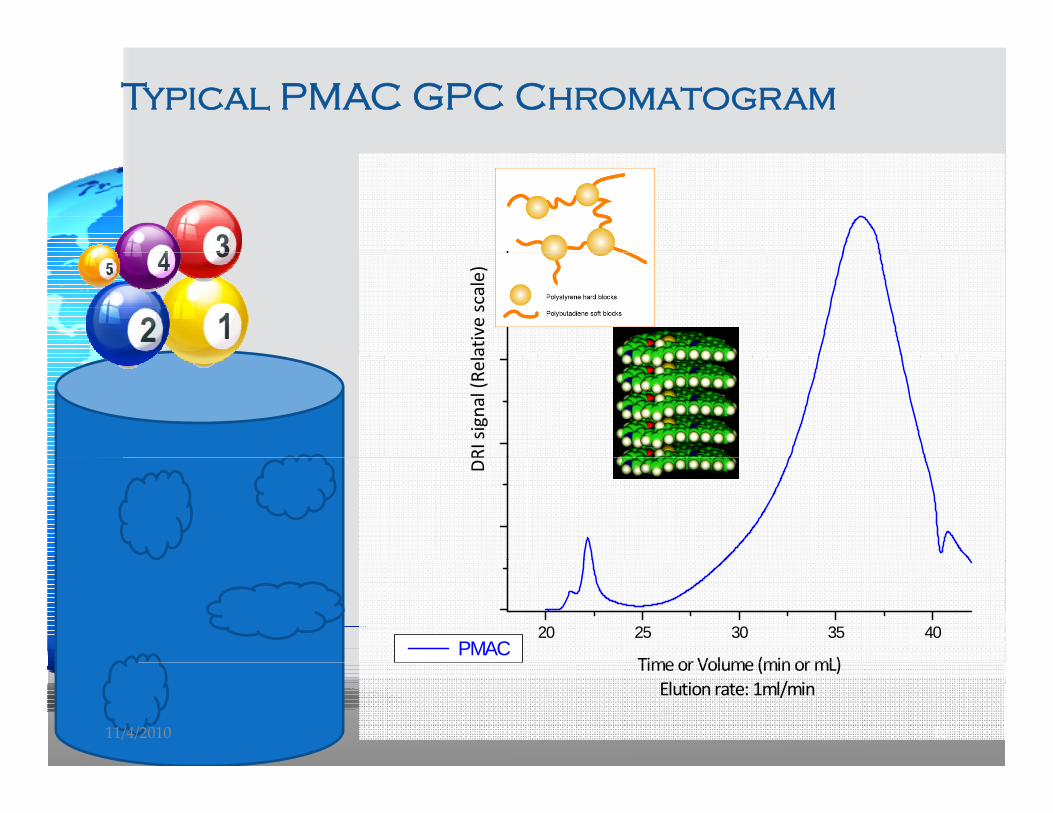
Typical PMAC GPC Chromatogram
ative scale)
RI signal (Re
laD
20 25 30 35 40
Timeor Volume (minormL) PMAC
10
Time or Volume (min or mL)Elution rate: 1ml/min
11/4/2010

Regions of a PMAC GPC chromatogram, showing the relationship between elution volume and molecular weights relationship between elution volume and molecular weights
values, based on calibration curve.
1111/4/2010

GPC chromatogram of binders Before and after 1 year in the Before and after 1 year in the
field
0.20
0.22
0.24
0.20
0.25
US 190 new0.14
0.16
0.18
0.21
0.24
0.27Supplier C Supplier B
0 10
0.12
0.14
0.16
0.18
0.10
0.15
ts
US
190
1 yr
s U
S 1
90 n
ew
US 190 new
0.06
0.08
0.10
0.12
0.12
0.15
0.18
s LA
18
new
LA 1
8 af
ter 1
yr
LA 18 after 1 yr
0.02
0.04
0.06
0.08
0.10
0.00
0.05 DR
I uni
DR
I uni
t s
-0.02
0.00
0.02
0.04
0 00
0.03
0.06
0.09
DR
I uni
ts
DR
I uni
ts L
LA 18 new
25 30 35 40
0.00
25 30 35 40
US 190 after 1 year
Ve, mL20 25 30 35 40 45
-0.04 0.00
Ve, mL
12

Effect of RAP conc on GPCEffect of RAP conc on GPC
0 25
LA 116 15% and 20% RAP
0.2
0.25
0.15
15%RAP
0.05
0.120%RAP
0
22 27 32 37 42 47
11/4/2010 13

Distribution of components in original asphalt binders
VHMw HMw MMw Sum Asphaltenes Maltenes
PG 1000 300K 300 45K 45 19K 1000 19K 19 3K 3 0 2KPG 1000-300K 300-45K 45-19K 1000-19K 19-3K 3-0.2K
A 64-22 0.0% 0.0% 0.0% 0.0% 15% 85%
A 70-22M 0.2% 0.6% 0.5% 1.3% 15% 84%
A 76-22M 0 6% 3 0% 0 7% 4 3% 14% 82%A 76-22M 0.6% 3.0% 0.7% 4.3% 14% 82%
B 64-22 0.0% 0.0% 0.0% 0.0% 19% 81%
B 70-22M 0.1% 1.2% 0.6% 1.9% 17% 81%
B 76-22M 0.3% 1.0% 0.8% 2.1% 16% 82%
C 64-22 0.0% 0.0% 0.0% 0.0% 16% 84%
C 70-22M 0.0% 0.5% 0.8% 1.3% 17% 82%
C 76-22 M 0.1% 1.3% 1.2% 2.7% 17% 81%
11/4/2010 14

Polymer component content of original asphalts from different refineries
4.0%
4.5%
3.0%
3.5%
9K
MMw 45‐19K
2.0%
2.5%
mer = SUM 100
0‐19
HMw 300‐45K
1.0%
1.5%%po
lym HMw 300 45K
0.0%
0.5% VHMw 1000‐300K
15
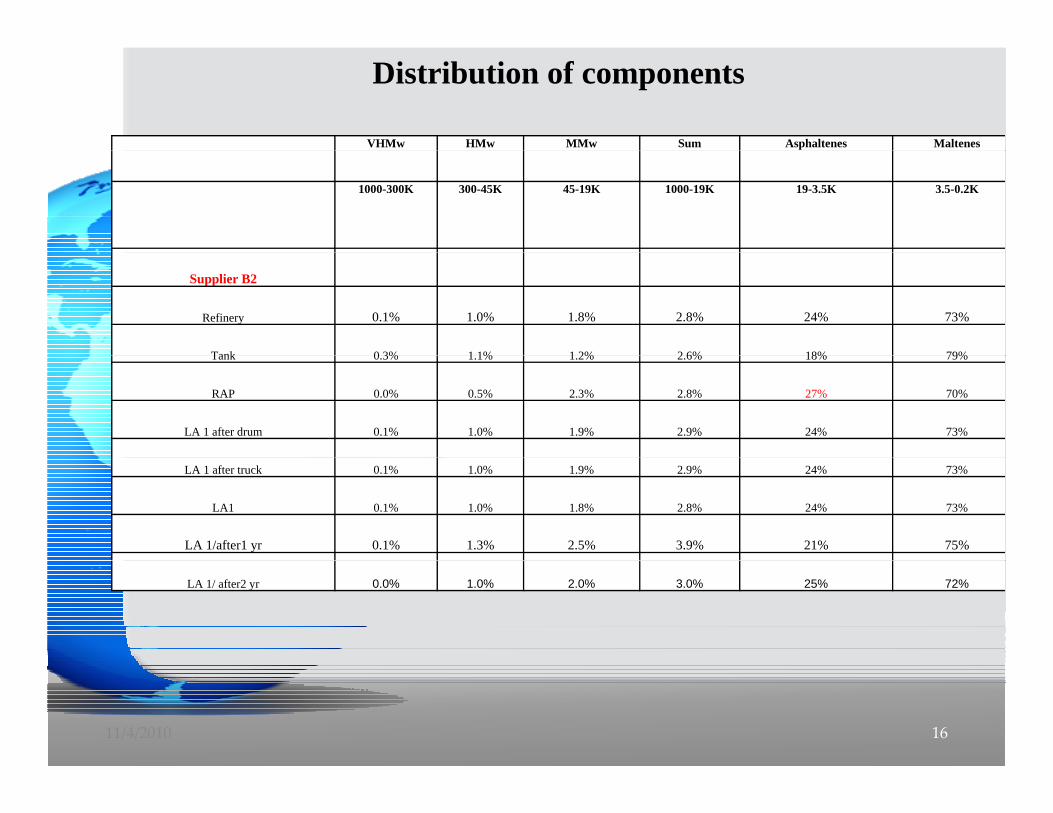
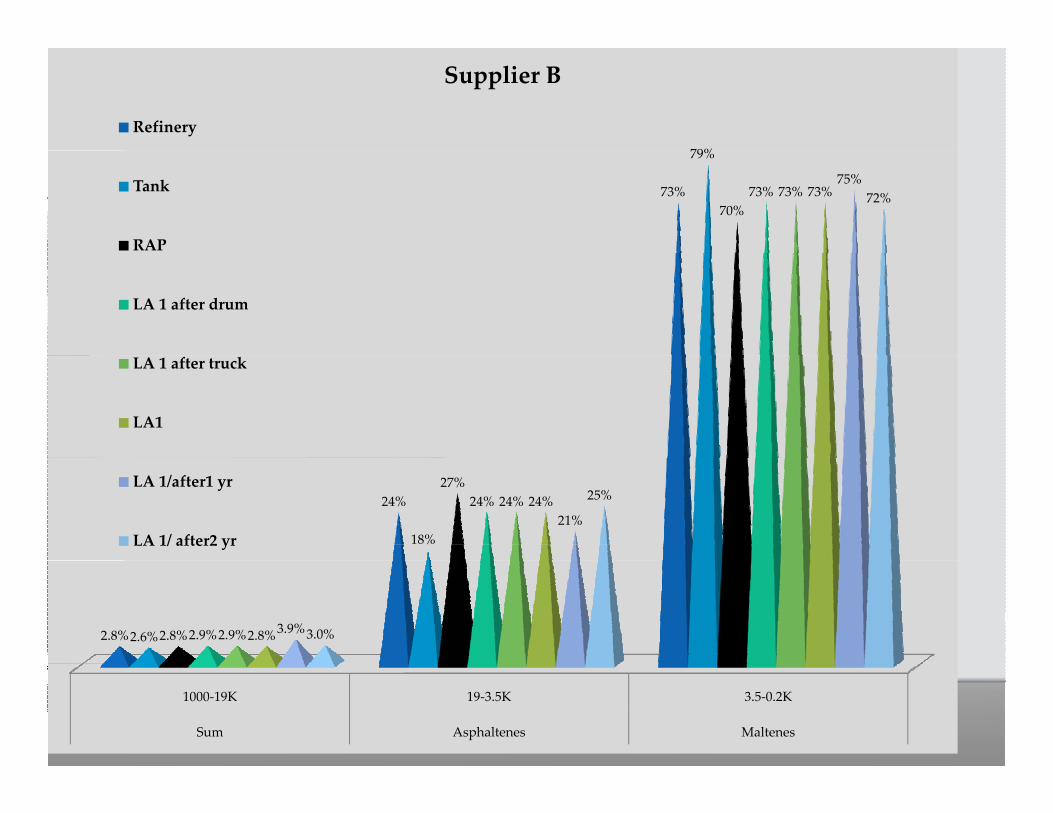
Distribution of components
VHMw HMw MMw Sum Asphaltenes Maltenes
1000-300K 300-45K 45-19K 1000-19K 19-3.5K 3.5-0.2K
Supplier B2
Refinery 0.1% 1.0% 1.8% 2.8% 24% 73%
Tank 0 3% 1 1% 1 2% 2 6% 18% 79%Tank 0.3% 1.1% 1.2% 2.6% 18% 79%
RAP 0.0% 0.5% 2.3% 2.8% 27% 70%
LA 1 after drum 0.1% 1.0% 1.9% 2.9% 24% 73%
LA 1 after truck 0.1% 1.0% 1.9% 2.9% 24% 73%
LA1 0.1% 1.0% 1.8% 2.8% 24% 73%
LA 1/after1 yr 0.1% 1.3% 2.5% 3.9% 21% 75%
LA 1/ after2 yr 0.0% 1.0% 2.0% 3.0% 25% 72%
11/4/2010 16

Typical Binder THF InsolublesTypical Binder THF InsolublesPG Grade or RAP sample Typical % insoluble THF on 0.45 mμ
filter
64-22, original 4%-5%
76-22 original 6-7%
76 22 core new route 10 11%76-22, core new route 10-11%
RAP 7-10%
Source Atypical
B1 refinery 18%
LA 18 new 23%
11/4/2010 17
79%
Supplier B
Refinery
73%
79%
70%73% 73% 73%
75%72%
Tank
RAP
LA 1 after drum
LA 1 after truck
LA1
24%
18%
27%24% 24% 24%
21%
25%LA 1/after1 yr
LA 1/ after2 yr
2.8%2.6%2.8%2.9%2.9%2.8%3.9%3.0%
18
1000‐19K 19‐3.5K 3.5‐0.2K
Sum Asphaltenes Maltenes

79%
Supplier A
Refinery
76%79%
70%
76%
72%
77%
Tank
RAP for US 71
us 71
US 71/after1 yr
22%
18%
27%
22%25%
19%
US 71/after 2 yr
2.3% 2.4% 3.0% 2.3% 3.1% 3.4%
19
1000‐19K 19‐3.5K 3.5‐0.2K
Sum Asphaltenes Maltenes

Supplier C
75%79%
75%
84%
78%
Refinery
Tank75% 75%
NO RAP
US 190
US 190/after 1yr
21%18%
21%19%
Us 190/after 2 yr
3.6% 3.1% 3.6% 3.5%
13%
3.5%
11/4/2010 20
1000‐19K 19‐3.5K 3.5‐0.2K
Sum Asphaltenes Maltenes

Recommendations •Library of RAP Samples•History of Selected RAP Sources
RecommendationsFuture Work
• Impact of• Impact of different blending processes
•Does SHRP characterization apply to RAP mixes
•Aging properties of Binders containing RAP at variouscontaining RAP at various levels
11/4/2010 21

RTFO vs Road CoresRTFO vs. Road Cores
VHMw HMw MMw Sum Asphaltenes Maltenes
1000-300K 300-45K 45-19K 1000-19K 19-3.5K 3.5-0.2K
Refinary A/ RTFO 0 2% 1 3% 0 9% 2 4% 20% 78%Refinary A/ RTFO 0.2% 1.3% 0.9% 2.4% 20% 78%
LA 26 road core 0.2% 1.5% 1.4% 3.1% 25% 72%
Refinery B/ RTFO 0 3% 1 2% 1 3% 2 9% 19% 79%Refinery B/ RTFO 0.3% 1.2% 1.3% 2.9% 19% 79%
LA18 road core 0.0% 1.2% 2.3% 3.5% 26% 70%
Refinery D/ RTFO 0.5% 0.8% 0.7% 2.0% 16% 82%
LA 15 road core 0.2% 1.2% 0.9% 2.3% 20% 77%
22

Old RAP vsnewer PMAC Aging newer PMAC
RAP Additives, nature and content
simulation related to GPC
analysis
Concerns
RAP Sto a e Percentage RAP upper
limits
RAP Storage time and conditions
11/4/2010 23
ConclusionsConclusions
Field samples containing RAP age less than predicted by RTFO laboratory aging.
Experimental data limited by number of RAP samples laboratory aging. RAP samples available. Please send us more samples.
24

Thank You , any Questions ??
11/4/2010 25