Applications and benefits of weather, climate and water information to the power sector Laurent...
25
Applications and benefits of weather, climate and water information to the power sector Laurent Dubus EDF R&D Applied Meteorology & Atmospheric Environment Group WORLD METEOROLOGICAL ORGANIZATION “MEETING OF THE WMO FORUM: SOCIAL AND ECONOMIC APPLICATIONS AND BENEFITS OF WEATHER, CLIMATE AND WATER SERVICES” WMO HEADQUARTERS, GENEVA, SWITZERLAND 8-11 APRIL 2013
-
Upload
clark-stevers -
Category
Documents
-
view
215 -
download
0
Transcript of Applications and benefits of weather, climate and water information to the power sector Laurent...

Applications and benefits of weather, climate and water
information to the power sector
Laurent DubusEDF R&DApplied Meteorology & Atmospheric Environment Group
WORLD METEOROLOGICAL ORGANIZATION
“MEETING OF THE WMO FORUM: SOCIAL AND ECONOMIC APPLICATIONS AND BENEFITS
OF WEATHER, CLIMATE AND WATER SERVICES”
WMO HEADQUARTERS, GENEVA, SWITZERLAND
8-11 APRIL 2013

WMO Forum, SEB, 8-11 April 2013 2
Overview
1. Preliminary remarks on power systems
2. Important meteorological parameters and data/forecasts used
3. What about economic evaluation of the benefits from weather/water/climate data ?

WMO Forum, SEB, 8-11 April 2013 3
Overview
1. Preliminary remarks on power systems
2. Important meteorological parameters and data/forecasts used
3. What about economic evaluation of the benefits from weather/water/climate data ?

WMO Forum, SEB, 8-11 April 2013 4
Power systems are more and more complex
EDF power production, 2011
46.6 / 628.2 TWh from renewables

WMO Forum, SEB, 8-11 April 2013 5
Growing importance of Renewables
(2010: 12%)

Power Offer/Demand balance: a complex problem
WMO Forum, SEB, 8-11 April 2013 6
Production units' program:58 nuclear reactors435 hydro power units~50 thermal (coal, gas, fuel)~900 Wind farms~250,000 solar (including households)
Huge optimization problem: 1 000 000 variables & 10 000 000 constraints for day+2 30 minutes forecasts
Highly non convex and non linear, discrete and continuous variables
Highly demanding on optimality (1% differenceseveral millions euros/year) and feasibility (all technical constraints must be satisfied)
Problems:Production=Demand at each time stepMany constraintsFinancial optimization of production
costs
6

WMO Forum, SEB, 8-11 April 2013 7
Overview
1. Preliminary remarks on power systems
2. Important meteorological parameters and data/forecasts used
3. What about economic evaluation of the benefits from weather/water/climate data ?
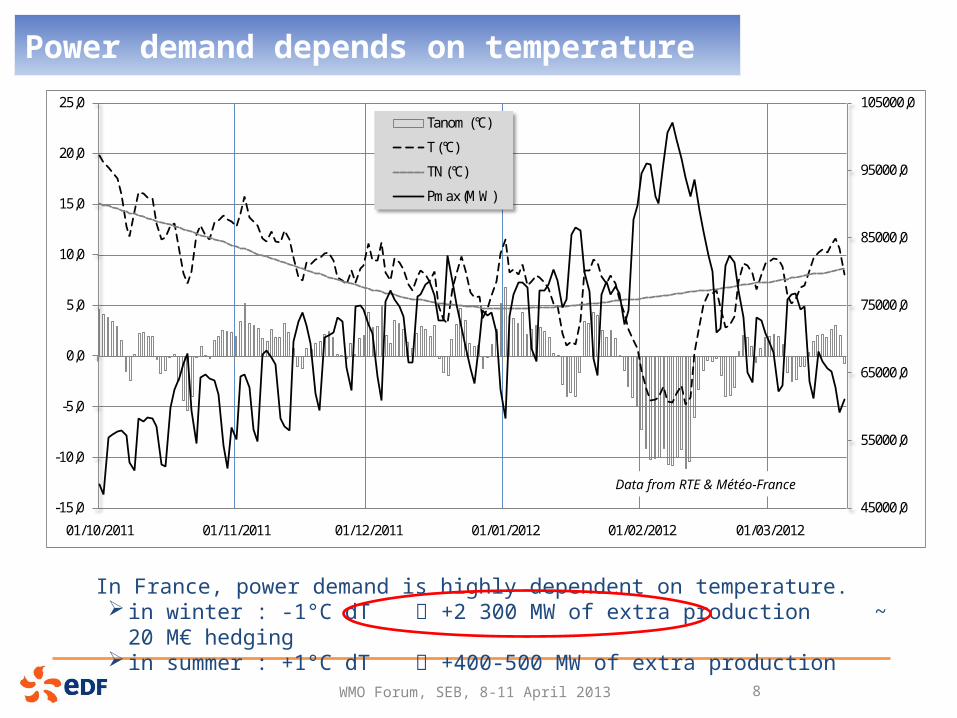
Power demand depends on temperature
WMO Forum, SEB, 8-11 April 2013 8
45000,0
55000,0
65000,0
75000,0
85000,0
95000,0
105000,0
-15,0
-10,0
-5,0
0,0
5,0
10,0
15,0
20,0
25,0
01/10/2011 01/11/2011 01/12/2011 01/01/2012 01/02/2012 01/03/2012
Tanom (°C)
T (°C)
TN (°C)
Pmax (MW)
In France, power demand is highly dependent on temperature. in winter : -1°C dT +2 300 MW of extra production ~ 20 M€
hedging in summer : +1°C dT +400-500 MW of extra production
Data from RTE & Météo-France

Increasing renewable energy production increases the dependance on weather variability and climate change
WMO Forum, SEB, 8-11 April 2013 9
Daily variations of french hydro power production capacity in 2003
Mois de juin 2010
0,00
500,00
1000,00
1500,00
2000,00
2500,00
3000,00
01/0
6/20
10 0
0:00
01/0
6/20
10 1
5:30
02/0
6/20
10 0
7:00
02/0
6/20
10 2
2:30
03/0
6/20
10 1
4:00
04/0
6/20
10 0
5:30
04/0
6/20
10 2
1:00
05/0
6/20
10 1
2:30
06/0
6/20
10 0
4:00
06/0
6/20
10 1
9:30
07/0
6/20
10 1
1:00
08/0
6/20
10 0
2:30
08/0
6/20
10 1
8:00
09/0
6/20
10 0
9:30
10/0
6/20
10 0
1:00
10/0
6/20
10 1
6:30
11/0
6/20
10 0
8:00
11/0
6/20
10 2
3:30
12/0
6/20
10 1
5:00
13/0
6/20
10 0
6:30
13/0
6/20
10 2
2:00
14/0
6/20
10 1
3:30
15/0
6/20
10 0
5:00
15/0
6/20
10 2
0:30
16/0
6/20
10 1
2:00
17/0
6/20
10 0
3:30
17/0
6/20
10 1
9:00
18/0
6/20
10 1
0:30
19/0
6/20
10 0
2:00
19/0
6/20
10 1
7:30
20/0
6/20
10 0
9:00
21/0
6/20
10 0
0:30
21/0
6/20
10 1
6:00
22/0
6/20
10 0
7:30
22/0
6/20
10 2
3:00
23/0
6/20
10 1
4:30
24/0
6/20
10 0
6:00
24/0
6/20
10 2
1:30
25/0
6/20
10 1
3:00
26/0
6/20
10 0
4:30
26/0
6/20
10 2
0:00
27/0
6/20
10 1
1:30
28/0
6/20
10 0
3:00
28/0
6/20
10 1
8:30
29/0
6/20
10 1
0:00
30/0
6/20
10 0
1:30
30/0
6/20
10 1
7:00
Pu
issa
nce
s en
MW
Réalisations J J+1 J+2 Forfait
Hydro
Wind
Solar (PV)
Renewables: highly
fluctuating resources
(especially wind and solar
energy)
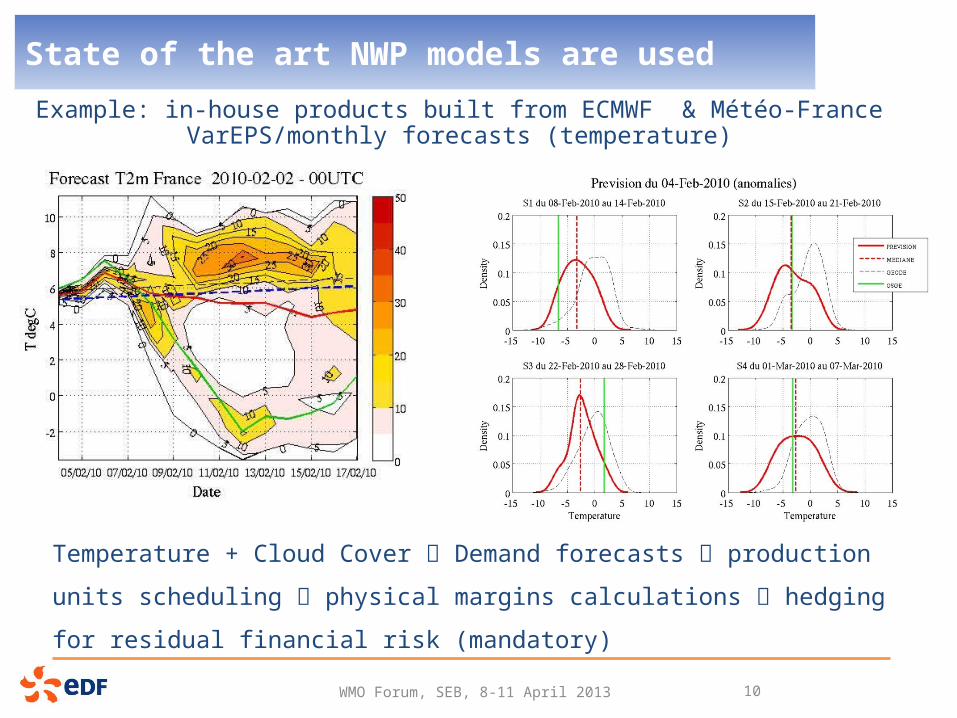
State of the art NWP models are used
WMO Forum, SEB, 8-11 April 2013 10
Example: in-house products built from ECMWF & Météo-France VarEPS/monthly forecasts (temperature)
Temperature + Cloud Cover Demand forecasts production units
scheduling physical margins calculations hedging for residual
financial risk (mandatory)

Monthly forecasts of river discharge using ECMWF products + in house post-processing methods
WMO Forum, SEB, 8-11 April 2013 11
ECMWF Monthly fcst (Z700 & Z1000)
Analog Method
Hydrological Model
Local T2m & Precip over 43 basins
Streamflow Prob fcsts
• Streamflow climatology• Hydro Model forced by T2m & Precip climatology (1969-
2008)• Hydro Model forced by Analog T2m & Precip• Observation
New model is now operational, an extension to seasonal forecasts is uner consideration
DUBUS, L. In Press. Weather & climate and the power sector: Needs, recent developments and challenges. In: TROCCOLI, A., AUDINET, P.,DUBUS, L. & HAUPT, S. (eds.) Weather matters for energy. Springer

WMO Forum, SEB, 8-11 April 2013 12
Local forecasts for renewables: a big challenge

WMO Forum, SEB, 8-11 April 2013 13

Many challenges remain
WMO Forum, SEB, 8-11 April 2013 14
Importance of meteorological data for project
definition/dimensionning (V@100m, solar rad)
Moderate forecast errors can lead to high
production errors
Some important parameters/events still not well
known/monitored/forecasted:
solar radiation (global/direct/diffuse)
rapid fluctuations (wind/radiation)
snow, icing events, low level clouds …
0
100
200
300
400
500
600
700
800
900
1 3 5 7 9 11 13 15 17 19 21 23 25
m/s
kW

WMO Forum, SEB, 8-11 April 2013 15
Overview
1. Preliminary remarks on power systems
2. Important meteorological parameters and data/forecasts used
3. What about economic evaluation of the benefits from weather/water/climate data ?

Economic evaluation of weather/water/climate info benefits
WMO Forum, SEB, 8-11 April 2013 16
Few publications on this subject, most of which come from research
institutes, universities, international agencies (NREL, IEA, OECD…)
Not from energy companies, because of the sensitivity of the
economic information (competitive markets)
Evaluations are country/technology specific :
depend on national policies (in particular for renewables:
incentives vs. pure market rules)
BAMS, dec. 2005

EDF’s financial communication (feb. 2011)
17WMO Forum, SEB, 8-11 April 2013

Importance of observed data for investments
WMO Forum, SEB, 8-11 April 2013 18
An accurate estimation of the resource is essential
Example: for an offshore wind turbine in France, an overestimation of 0.5m/s of the average wind speed (6.5 m/s instead of 6.0 m/s) can lead to a difference in production cost of 18% (V. Maupu, EDF R&D, personal communication)
Long time series are needed to assess the wind/solar resource for a given site

Forecasts for wind energy : the NCAR/Xcel Energy experience
WMO Forum, SEB, 8-11 April 2013 19
Mahoney, W.P.; Parks, K.; Wiener, G.; Yubao Liu; Myers, W.L.; Juanzhen Sun; Delle Monache, L.; Hopson, T.; Johnson, D.; Haupt, S.E., "A Wind Power Forecasting System to Optimize Grid Integration," Sustainable Energy, IEEE Transactions on , vol.3, no.4, pp.670,682, Oct. 2012. doi: 10.1109/TSTE.2012.2201758

WMO Forum, SEB, 8-11 April 2013 20
Cost analysis before, during and after the deployment of the new system:
Total decrease of 20% in MAPE between 2008 and 2010 US $6M savings between 2009 and 2010 for wind power forecasts + US $2M savings due to more efficient commitment and dispatching of fossil
fuel ressources
From Mahoney et al., 2012
Forecasts for wind energy : the NCAR/Xcel Energy experience
From Parks et al., 2011

Wind energy: the ANEMOS.plus & SafeWind Projects
WMO Forum, SEB, 8-11 April 2013 21
Includes 38 references about value of wind forecasting
Because in general TSO provide data publicly, free of charge

Results must be taken with care (many parameters to take into account)
WMO Forum, SEB, 8-11 April 2013 22
Increased penetration of renewable energies (wind/solar) can a priori decrease
energy prices, but have secondary effects like increase in maintenance costs for
other energy sources (nuclear, coal fuel, gas) that are used in less optimal
conditions
Results should be taken with care, and global assessments are needed

Conclusions (1/2)
WMO Forum, SEB, 8-11 April 2013 23
In the last 10 years, much progress was achieved in NMHSs and research centers (VarEPS & monthly forecasts @ ECMWF for instance)
Only a few energy companies actively collaborate with NMHSs & private weather companies to develop new tailored products (ex.: Xcel Energy & NCAR/NREL, EDF & Météo-France)
Dialog between Providers & Users is essential to translate improvements in science into business improvements
Communication towards & training of end-users is very important Upstream collaboration and partnerships should be encouraged
www.icem2013.org

Conclusions (2/2)
WMO Forum, SEB, 8-11 April 2013 24
Progress are needed in forecasts at all time scales, but also in
observations.
Showing an improvement w.r.t current practise is often enough
An economic evaluation of the benefits of WCW services in the energy
sector is :
technically complex
country/technology dependant
generally not publicly available because of strategic aspects
However, even if economic benefit assessment is difficult, the value
of WCW services is essential to the power sector

WMO Forum, SEB, 8-11 April 2013 25
Thank you for your attention