Application-specific muscle representations - CiteSeer
9
Application-specific muscle representations Victor Ng-Thow-Hing Fundamental Research Laboratories Honda R&D Americas, Inc. [email protected] Eugene Fiume Department of Computer Science University of Toronto [email protected] Abstract The need to model muscles means different things to artistic and technical practitioners. Three different mus- cle representations are presented and the motivations be- hind their design are discussed. Each representation al- lows unique capabilities and operations to be performed on the model, yet the underlying mathematical founda- tion is the same for all. This is achieved by develop- ing a data-fitting pipeline that allows samples that are generated from different data sources to be used in the guided construction of a B-spline solid. We show how B- spline solids can be used to create muscles from contour curves extracted out of medical images, digitized fibre sets from dissections of muscle specimens, and profile curves that can be interactively sketched and manipulated by an anatomical modeller. Key words: Anatomical modelling, muscles, data-fitting, B-spline solid 1 Introduction The concept of modelling muscles means different things to different communities. When modelling humans and other animals for use in film animation, the intention is to emulate the effects of superficial muscle anatomy that can be seen to contract and stretch through the skin. For biomechanists, the functional aspects of muscle have greater importance. Muscle models are developed based on controlled experiments with real muscle specimens to create parameterized models that relate generated force with muscle length, velocity of shortening, and neural ac- tivation. Simulations use these muscle models as actua- tors to exert forces on mechanical skeletons to study and reproduce motor tasks. At the structural level, anatomists seek to discover the internal fibre arrangements of mus- cle and how this muscle architecture determines the func- tional role the muscle plays in the overall context of the body’s locomotion system. The development of muscle models has progressed rel- atively independently in the animation and biomechanics industries. Justifiably, the trend has been to only model what is needed and to avoid unnecessary complexity. An- imation applications stress the need for body physiques to appear adequately realistic while biomechanical applica- tions only model the functional aspects of muscle, such as muscle force generation. Of the many modelling primitives available for such representations, parametric solid representations are par- ticularly convenient. Previously, the B-spline solid model has been used to demonstrate that a large variety of mus- cle shapes can be compactly represented by a model based on B-spline basis functions[7]. The model’s vol- umetric properties allows internal structures to be spec- ified and scalar field functions to be defined over the entire solid’s domain. A data-fitting pipeline has been described that allows deformable muscle models to be built from medical images of transverse slices of muscle anatomy[6]. In this work, the same mathematical frame- work is used to create entirely different muscle represen- tations that each enable new visualizations and phenom- ena to be depicted. The purpose of this work is to demonstrate how consid- erations of application and user interface drive the devel- opment of very different muscle models and that this de- sign process is essential to the success of the model’s util- ity. The next section reviews the previous work in muscle modelling in the fields of animation and biomechanics. In Section 3, the data-fitting pipeline for B-spline solids is reviewed, followed by separate sections for each of the three models developed with their unique applications. We conclude with discussion of current and future appli- cations of these models. 2 Previous work The idea of anatomical models for human and animal construction was introduced to the computer graphics community using geometric primitives such as ellipsoids, and parametric surfaces[14, 15, 12]. The emphasis on these models was the modelling of general approxima- tions of anatomic muscle groups. As these muscles would never be directly seen because of an obscuring skin surface, there is no need to correctly model exact muscle shapes. Indeed, since the introduction of these methods, many film production houses have implemented
Transcript of Application-specific muscle representations - CiteSeer

Application-specific muscle representations
Victor Ng-Thow-HingFundamental Research Laboratories
Honda R&D Americas, [email protected]
Eugene FiumeDepartment of Computer Science
University of [email protected]
AbstractThe need to model muscles means different things to
artistic and technical practitioners. Three different mus-cle representations are presented and the motivations be-hind their design are discussed. Each representation al-lows unique capabilities and operations to be performedon the model, yet the underlying mathematical founda-tion is the same for all. This is achieved by develop-ing a data-fitting pipeline that allows samples that aregenerated from different data sources to be used in theguided construction of a B-spline solid. We show how B-spline solids can be used to create muscles from contourcurves extracted out of medical images, digitized fibresets from dissections of muscle specimens, and profilecurves that can be interactively sketched and manipulatedby an anatomical modeller.
Key words: Anatomical modelling, muscles, data-fitting,B-spline solid
1 Introduction
The concept of modelling muscles means different thingsto different communities. When modelling humans andother animals for use in film animation, the intentionis to emulate the effects of superficial muscle anatomythat can be seen to contract and stretch through the skin.For biomechanists, the functional aspects of muscle havegreater importance. Muscle models are developed basedon controlled experiments with real muscle specimens tocreate parameterized models that relate generated forcewith muscle length, velocity of shortening, and neural ac-tivation. Simulations use these muscle models as actua-tors to exert forces on mechanical skeletons to study andreproduce motor tasks. At the structural level, anatomistsseek to discover the internal fibre arrangements of mus-cle and how this muscle architecture determines the func-tional role the muscle plays in the overall context of thebody’s locomotion system.
The development of muscle models has progressed rel-atively independently in the animation and biomechanicsindustries. Justifiably, the trend has been to only modelwhat is needed and to avoid unnecessary complexity. An-
imation applications stress the need for body physiques toappear adequately realistic while biomechanical applica-tions only model the functional aspects of muscle, suchas muscle force generation.
Of the many modelling primitives available for suchrepresentations, parametric solid representations are par-ticularly convenient. Previously, the B-spline solid modelhas been used to demonstrate that a large variety of mus-cle shapes can be compactly represented by a modelbased on B-spline basis functions[7]. The model’s vol-umetric properties allows internal structures to be spec-ified and scalar field functions to be defined over theentire solid’s domain. A data-fitting pipeline has beendescribed that allows deformable muscle models to bebuilt from medical images of transverse slices of muscleanatomy[6]. In this work, the same mathematical frame-work is used to create entirely different muscle represen-tations that each enable new visualizations and phenom-ena to be depicted.
The purpose of this work is to demonstrate how consid-erations of application and user interface drive the devel-opment of very different muscle models and that this de-sign process is essential to the success of the model’s util-ity. The next section reviews the previous work in musclemodelling in the fields of animation and biomechanics.In Section 3, the data-fitting pipeline for B-spline solidsis reviewed, followed by separate sections for each of thethree models developed with their unique applications.We conclude with discussion of current and future appli-cations of these models.
2 Previous work
The idea of anatomical models for human and animalconstruction was introduced to the computer graphicscommunity using geometric primitives such as ellipsoids,and parametric surfaces[14, 15, 12]. The emphasis onthese models was the modelling of general approxima-tions of anatomic muscle groups. As these muscleswould never be directly seen because of an obscuringskin surface, there is no need to correctly model exactmuscle shapes. Indeed, since the introduction of thesemethods, many film production houses have implemented
their own proprietary systems to incorporate an anatom-ical layer of muscles in the modelling pipeline of digi-tal characters[11, 13]. In these applications, secondarydynamic phenomena such as muscle “jiggles” are addedto simulate inertial effects. The muscles themselves areused for shape definition and have no functional role inthe creation of the motions. Shape changes are mainlydriven by joint motion of an underlying kinematic skele-ton.
In biomechanics, the venerable Hill model[16] is usedubiquitously to describe force magnitudes of muscle as afunction of various parameters such as muscle length, ac-tivation and rest length. In combination with a musculo-skeletal system that represents muscle lines of actionas piecewise line segment actuators on the skeleton[4],simulations have been made with muscles as active ac-tuators driving tasks such as jumping and walking[9].As the emphasis is on the functional role of muscle,the volumetric representation of muscle is ignored. As-sumptions are made that simplify muscle architecture andinter-muscular interactions that may lead to inaccuraciesfor some motions. Finite element models that representboth shape and physical function of muscles are usu-ally restricted to single muscles simulated in isolation[3].The use of the finite-element method generally requireslengthy computational times for detailed simulation thatlimits the scalability of the technique to large, multiplemuscle systems.
One of the goals of using a common mathematicalfoundation for modelling different muscle representa-tions is the ability to adapt to different levels of complex-ity using the same set of routines for tasks such as displaytessellation and volume calculation. Selective emphasiscan be made to focus on graphical, structural, or physicalcharacteristics of muscle contraction.
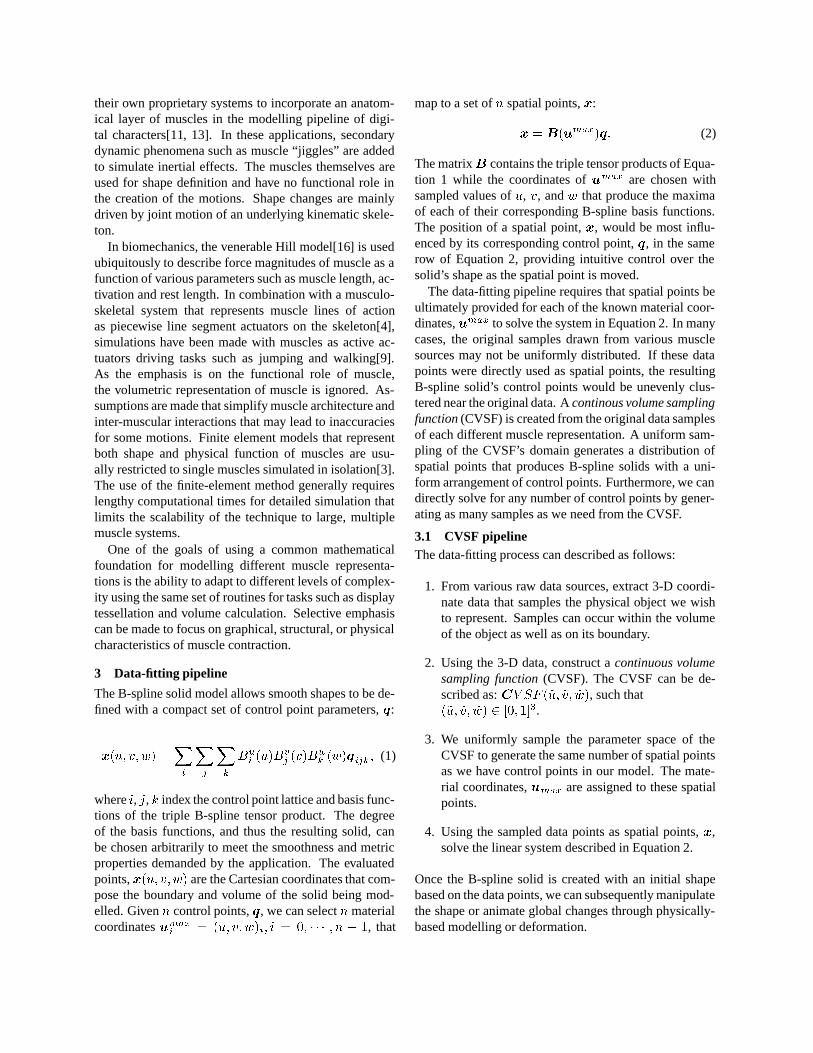
3 Data-fitting pipeline
The B-spline solid model allows smooth shapes to be de-fined with a compact set of control point parameters, �:
���� �� �� ��
�
�
�
�
�
��� ����
�� ����
�� ������� � (1)
where �, �, � index the control point lattice and basis func-tions of the triple B-spline tensor product. The degreeof the basis functions, and thus the resulting solid, canbe chosen arbitrarily to meet the smoothness and metricproperties demanded by the application. The evaluatedpoints, ���� �� �� are the Cartesian coordinates that com-pose the boundary and volume of the solid being mod-elled. Given � control points, �, we can select � materialcoordinates ����
� � ��� �� ���� � � �� � � � � � � �, that
map to a set of � spatial points, �:
� � �������� (2)
The matrix� contains the triple tensor products of Equa-tion 1 while the coordinates of ���� are chosen withsampled values of �, �, and � that produce the maximaof each of their corresponding B-spline basis functions.The position of a spatial point, �, would be most influ-enced by its corresponding control point, �, in the samerow of Equation 2, providing intuitive control over thesolid’s shape as the spatial point is moved.
The data-fitting pipeline requires that spatial points beultimately provided for each of the known material coor-dinates, ���� to solve the system in Equation 2. In manycases, the original samples drawn from various musclesources may not be uniformly distributed. If these datapoints were directly used as spatial points, the resultingB-spline solid’s control points would be unevenly clus-tered near the original data. A continous volume samplingfunction (CVSF) is created from the original data samplesof each different muscle representation. A uniform sam-pling of the CVSF’s domain generates a distribution ofspatial points that produces B-spline solids with a uni-form arrangement of control points. Furthermore, we candirectly solve for any number of control points by gener-ating as many samples as we need from the CVSF.
3.1 CVSF pipelineThe data-fitting process can described as follows:
1. From various raw data sources, extract 3-D coordi-nate data that samples the physical object we wishto represent. Samples can occur within the volumeof the object as well as on its boundary.
2. Using the 3-D data, construct a continuous volumesampling function (CVSF). The CVSF can be de-scribed as: � �� ���� ��� ���, such that���� ��� ��� � ��� ���.
3. We uniformly sample the parameter space of theCVSF to generate the same number of spatial pointsas we have control points in our model. The mate-rial coordinates, ���� are assigned to these spatialpoints.
4. Using the sampled data points as spatial points, �,solve the linear system described in Equation 2.
Once the B-spline solid is created with an initial shapebased on the data points, we can subsequently manipulatethe shape or animate global changes through physically-based modelling or deformation.

Of the four stages in the CVSF data-fitting schema,Stages 3 and 4 are independent of the original form ofthe data. Stages 1 and 2, however, must be designed toaccommodate each new muscle representation and ap-plication. Equations 1 and 2 provide extremely generalways in which to effect this. While this level of gen-erality is needed to accommodate the different forms ofinput that different muscle modelling applications mayneed, there is a clear structure in the way that each ap-plication both gathers and represents discrete data. Thatstructure defines a specific traversal of an otherwise verycomplex volume as well as having semantic importanceto the application. We have isolated three structures: con-tour curves, fibre sets, and profile curves. In the next threesections, we demonstrate how each can be used both todefine a novel muscle representation and to accommo-date the forms of data sources that are available in thatapplication.
4 Contour curves
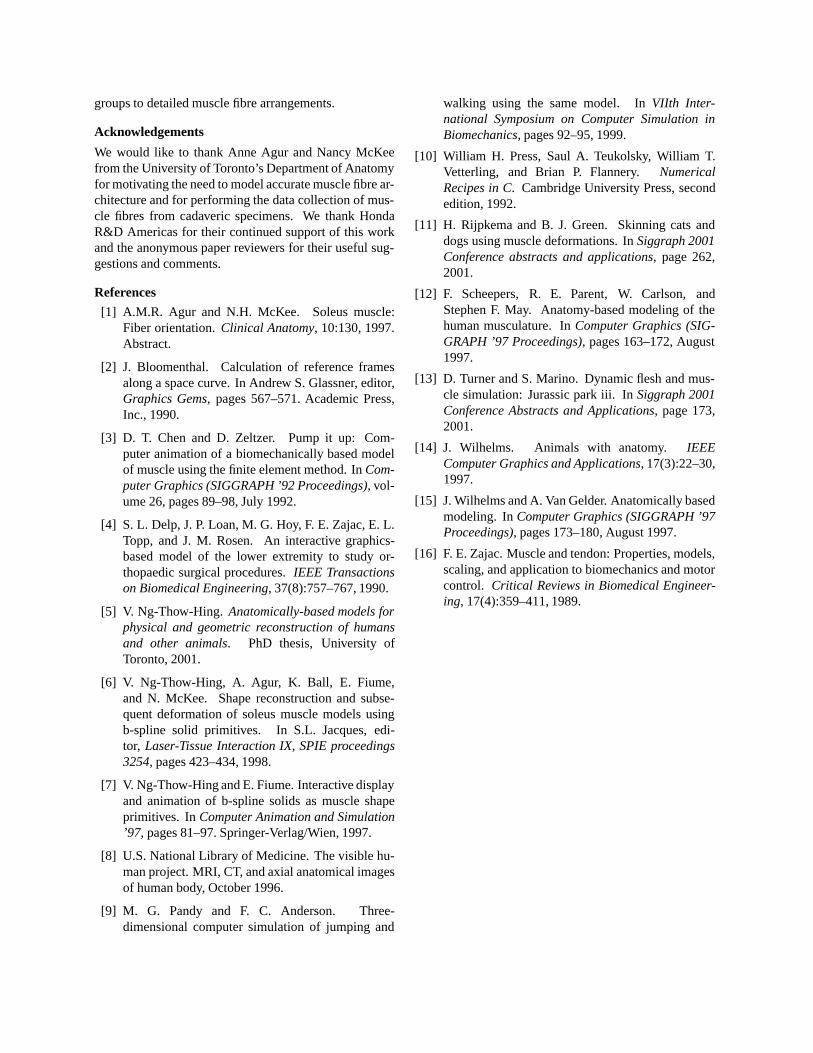
Medical imagery containing transverse anatomical cross-sectional slices can be used to perform reconstruction ofmuscles. For example, portions of the Visible Humandata-set[8] in the lower leg region can be used to isolatethe boundary form of muscles (Figure 8). Full detailsof this process are described in [7]. Once muscles havebeen successfully segmented from the image slices, theycan be selectively displayed and examined in relation toneighbouring anatomy.
4.1 Creating the CVSFGiven a set of � contour curves extracted from the trans-verse slices: ��� � � � ����, we wish to design a CVSFthat produces a uniform sampling of points throughoutthe volume spanned by these image contour curves. Thecontour curves are represented as B-spline curves createdby interpolating sample points taken along muscle cross-sectional boundaries. The sample points are re-indexedto minimize the distance between corresponding sampleson adjacent slices sharing the same index. This step willreduce rotational distortions in the B-spline solid. TheCVSF is designed to interpolate the contour curves suchthat traversing the parameters will span the solid in anintuitive manner. We select parameter �� to increase ra-dially outward from a central axis of the solid to its con-tour boundaries. Parameter �� will traverse the perimeteraround the axis and �� will range from the bottom of thestack to the top (Figure 1).
A curve, axis� ���� �� � ��� �� through the centroids ofthe contours is defined to travel along the length of themuscle. Given a specific set of parameters, ����� ���� ����,a second B-spline curve, profile���� ��� is created on theouter boundary of the muscle that interpolates all of the
C ~i
i+1
axis(w)
C
~
~
axis(w) (v)
CVSF(u,v,w)~ ~ ~
profile (w)~
(1) (2) (3)
AP
v~0
profile (w)~v0
0
~(v)0
u~
v~
w~
Figure 1: CVSF construction from contour curves
points � ������� � � �� � � � � � � � from each contour.The ��� parameter generates two points, axis� ���� andprofile���� ����, along the length of each of the two curvesand these points are linearly interpolated by ��� to producethe final spatial point.
Using an arclength parameterization for axis� ���� andprofile���� ���� ensures that the iso-parametric curves inthe �� direction of the solid do not undergo excessivetwisting and iso-parametric curves in the �� around themuscle’s axis are evenly distributed along the muscle’slength instead of being aligned with the original imageslices. Degree 2 B-spline basis functions were used inthe � and � domains to reduce unwanted oscillations inthe surface yet still produce smooth surfaces. A degree1 B-spline basis was used for the parameter � to modelan even distribution of material from the inner axis to theboundary of the muscles.
By transforming the original static images fromthe Visible Human data-set to a deformable B-splinesolid model, we have animated its shape to simulatecontractions[6] and generated muscle fibres as stream-lines in the solid’s volume. Unfortunately, from ananatomical standpoint, the fibres reconstructed from a B-spline solid derived from medical images do not matchmuscle architecture observed in real muscle (Figure 2).The contour curves inherently contain only boundary in-formation, losing all internal muscle architectural infor-mation. This restricts the use of muscles obtained in thismanner to only external muscle visualizations, volumeand mass computation, or modelling of general anatom-ical shapes of muscle groups. It is extremely difficult ifnot impossible to track individual fibres between adja-cent transverse sections. As muscle contracts in the direc-tion of its fibre arrangement, correct modelling of shapechanges during muscle activation cannot be obtained formuscles reconstructed from only its boundary surface.
Visible Humancontours
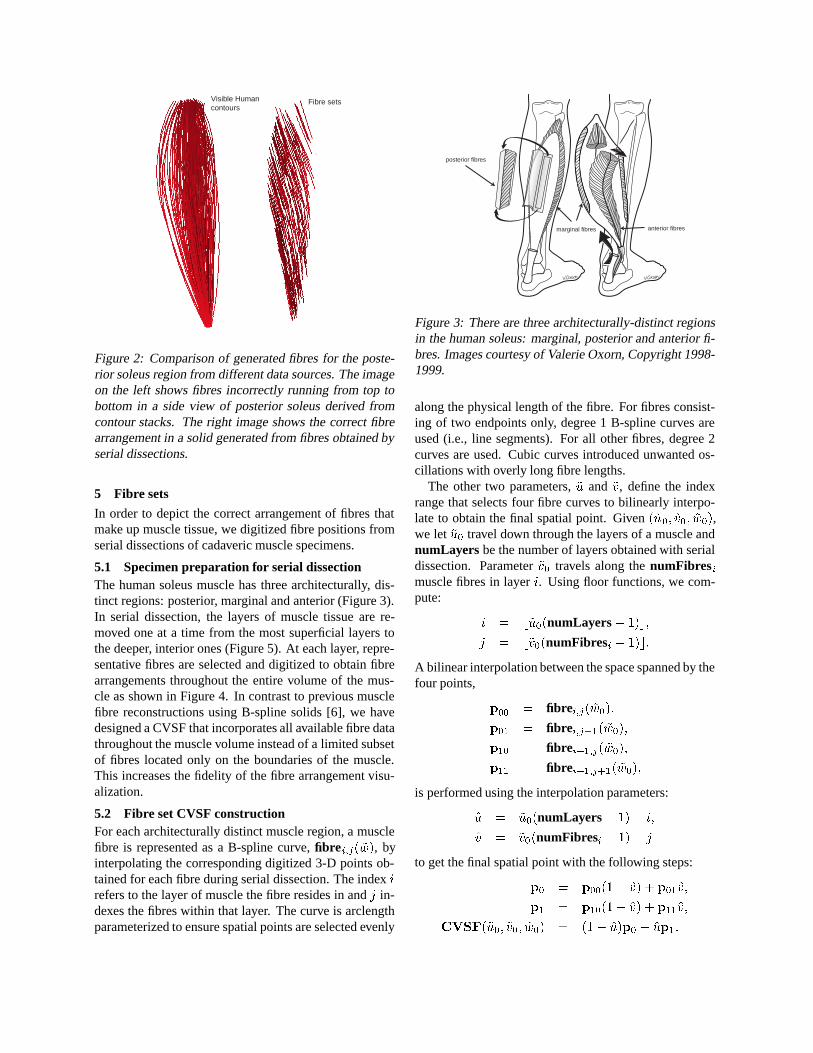
Fibre sets
Figure 2: Comparison of generated fibres for the poste-rior soleus region from different data sources. The imageon the left shows fibres incorrectly running from top tobottom in a side view of posterior soleus derived fromcontour stacks. The right image shows the correct fibrearrangement in a solid generated from fibres obtained byserial dissections.
5 Fibre sets
In order to depict the correct arrangement of fibres thatmake up muscle tissue, we digitized fibre positions fromserial dissections of cadaveric muscle specimens.
5.1 Specimen preparation for serial dissectionThe human soleus muscle has three architecturally, dis-tinct regions: posterior, marginal and anterior (Figure 3).In serial dissection, the layers of muscle tissue are re-moved one at a time from the most superficial layers tothe deeper, interior ones (Figure 5). At each layer, repre-sentative fibres are selected and digitized to obtain fibrearrangements throughout the entire volume of the mus-cle as shown in Figure 4. In contrast to previous musclefibre reconstructions using B-spline solids [6], we havedesigned a CVSF that incorporates all available fibre datathroughout the muscle volume instead of a limited subsetof fibres located only on the boundaries of the muscle.This increases the fidelity of the fibre arrangement visu-alization.
5.2 Fibre set CVSF constructionFor each architecturally distinct muscle region, a musclefibre is represented as a B-spline curve, fibre��� ���, byinterpolating the corresponding digitized 3-D points ob-tained for each fibre during serial dissection. The index �refers to the layer of muscle the fibre resides in and � in-dexes the fibres within that layer. The curve is arclengthparameterized to ensure spatial points are selected evenly
marginal fibres anterior fibres
posterior fibres
Figure 3: There are three architecturally-distinct regionsin the human soleus: marginal, posterior and anterior fi-bres. Images courtesy of Valerie Oxorn, Copyright 1998-1999.
along the physical length of the fibre. For fibres consist-ing of two endpoints only, degree 1 B-spline curves areused (i.e., line segments). For all other fibres, degree 2curves are used. Cubic curves introduced unwanted os-cillations with overly long fibre lengths.
The other two parameters, �� and ��, define the indexrange that selects four fibre curves to bilinearly interpo-late to obtain the final spatial point. Given ����� ���� ����,we let ��� travel down through the layers of a muscle andnumLayers be the number of layers obtained with serialdissection. Parameter ��� travels along the numFibres�muscle fibres in layer �. Using floor functions, we com-pute:
� � �����numLayers � ����
� � �����numFibres� � ���
A bilinear interpolation between the space spanned by thefour points,
��� � fibre��� �����
��� � fibre����� �����
��� � fibre����� �����
��� � fibre������� �����
is performed using the interpolation parameters:
�� � ����numLayers � ��� ��
�� � ����numFibres� � ��� �
to get the final spatial point with the following steps:
�� � ������ ��� ������
�� � ������ ��� ������
��������� ���� ���� � ��� ����� ����

marginalfibre set
posterior fibre set
anteriorfibre set
human soleus fibre set
Figure 4: Digitized fibre sets for the three regions of hu-man soleus
Figure 5: Serial dissection of human soleus muscle withmarked fibre points
Figure 6 illustrates this process.With the generated fibres, we can obtain virtual mea-
surements of fibres and their angles of insertion to thetendon region of muscle. These can be used to obtain es-timates of muscle force that take into account the finerdetails of muscle architecture. An arbitrary number offibres can be visualized within the solid by generatingstreamlines represented as 3-D space curves. Samplingusing parameter values at uniform intervals produces anunnaturally, regular grid-like distribution of fibres. Onthe other hand, a random sampling of fibres produces un-even clumps of fibres in the muscle. We have found atwo-dimensional Sobol sequence[10] guarantees a moreeven distribution of fibres (Figure 7).
By embedding viscoelastic links with Hill muscle
fibrei+1,j+1
fibrei+1,j
Layer i+1
Layer ifibrei,j+1
fibrei,j
3-D digitized fibrepoints
p10 p11
p01
p00
p1
p0
CVSF
Figure 6: CVSF construction for fibre sets. The CVSFsample point is the result of a bilinear interpolation pro-cess on the fibre set data.
force models[16], muscle contraction under volumepreservation has been simulated (Figure 9). Full details ofthis process are described in [5]. These fibre set modelsallow biomechanists to study muscle function to a greaterlevel of detail than previously offered. Cadaver studies onsoleus muscle have demonstrated that pennation anglescan vary throughout the volume of muscle[1]. Modelsthat account for pennation effects as a single parameteronly describe average force production for muscle fibres,losing any information about local regional effects withina muscle. Furthermore, the activation of muscle fibres isnot simultaneous. The parameterization of the B-splinesolid model permits local fibre regions to be delineatedand assigned different activation values. The combina-tion of this ability to model detailed fibre architecture andthe provision of a data-fitting pipeline to create modelsfrom real specimens makes our model a suitable candi-date for extensive functional studies of different muscles.
500 fibres100 fibres50 fibres
random
Sobolsequence
Figure 7: Generation of fibres. 50, 100, and 500 fibreswere generated in a model of the posterior soleus usinguniform pseudorandom number generation and Sobol se-quences. The Sobol sequence produced better distribu-tion of fibres.

6 Profile curves
Contour curves and fibre sets offer a migration path fromsources of actual anatomical muscle data to the construc-tion of a virtual B-spline solid model. However, thereare occasions where interactive creation of solid shapesis desirable. For example, for an application involvingmuscle reconstruction of extinct animals, it would be im-possible to obtain soft tissue specimens of real anatomy.A computer artist may wish to design a novel creaturewith a unique musculoskeletal system that does not ex-ist. Generally, a creature designer will use comparativeanatomy to guide where major muscle groups are placedon a fictional animal. These applications need to be ableto interactively design the shapes of B-spline solids, withvisual guidance from a human designer.
In creature modelling applications, the artist needsonly approximate shapes of muscle groups because theunderlying anatomy will be covered by a layer of skin.Manipulating the individual control points of a B-splinesolid would be too tedious. Using multiple profile curves,a modeller could capture important features and the over-all muscle shape at a higher level of abstraction thanthrough control points.
The attachment of musculotendon onto a skeleton canbe characterized by three important curves: origin, inser-tion and axial. The origin and insertion curves indicatethe attachment areas of the tendon portions of a muscu-lotendon to the bony surfaces of the skeleton. The axialcurve indicates the direction the muscles takes from oneend of the curve to the other - its line of action. If the ax-ial curve connects the centroids of the cross-sections ofthe muscle, biomechanists can use this curve to calculatethe moment arm of the muscle about a joint. Additionalcurves could be added along the axial curve to furtherrefine the muscle’s shape by creating a swept surface ofthese curves. In our application, a single mid-sectionalcurve is defined. We have designed a CVSF that con-structs the solid muscle using these profile curves (seeFigure 10).
The origin and insertion curves are represented astwo closed, periodic B-spline curves, origin���� andinsertion����. The axial curve is an open, aperiodicB-spline, axial� ���. We have used degree 2 B-splinecurves, but higher order curves can be used. In practice,quadratic curves provide a good compromise betweensmooth curves and reduced oscillations in the curve. Wewould like the CVSF to have the following properties thatguarantee the solid will interpolate the profile curves on
its boundaries:
� �� ��� ��� �� � origin�����
� �� ��� ��� �� � insertion�����
� �� ��� ��� ��� � axial� ������� � ��� ��
The mid-sectional curve, middle����, is generated au-tomatically by averaging the local coordinates of the in-sertion and origin curves (see Section 6.1 for the calcu-lation of local frames of reference for each curve) andcan be initially positioned anywhere along the axis. Wechose the halfway point on the axial curve for a balancedweighting between the two end curves. The mid-sectionalcurve along with the end curves influence the shape ofthe musculotendon along its length. Rather than linearlyinterpolating between the sections directly, a nonlinearweighting is made to account for the observation that theshape does not uniformly change from the midsection tothe extremal sections. Each cross-section of the solid isdesired to be approximately oriented perpendicular to thelocal tangent of the axial curve.
6.1 Reference frames for the axial curveTo generate points that deform as the axial curve moves,we need to define a local reference frame that can be cen-tred on any �� of axial� ���. We use Bloomenthal’s rota-tion minimizing frame[2] to avoid sudden large changesin orientation of the local frames along the axial spacecurve. This reference frame can be represented as a � matrix, �� �� �� with the origin located at the point,axial� ���. Having developed a local coordinate systemfor these profile curves, we will describe an interactiveuser interface to allow an artist to directly sketch and de-form muscle shapes on a skeleton.
6.2 Profile curve sketching with direct manipulationThe user sketches 3-D muscles by selecting points di-rectly on the visible bone surface geometry throughwhich profile curves should interpolate, allowing directmanipulation and editing of points. A musculotendonshape designer would proceed to select points to sketchout the curves for the origin, insertion and axial profilesof the muscle (Figure 10). If the user is using a 2-D point-ing device to pick points on an image of a 3-D skeleton,the problem is to find the corresponding 3-D points of thepicked geometry.
One alternative is to locate the intersection of a pro-jected ray from the picked screen coordinate with the sur-face geometry. The computational expense involved inlocating the geometric intersection point of this ray in acomplex scene may be too high for interactive applica-tions. Furthermore, the original picked point is at pixel

precision, which is already a discrete approximation ofthe true point on the viewing plane.
Instead, taking advantage of current depth buffer-basedgraphics hardware, the screen coordinates ��� �� �� areextracted, where � and � are image coordinates and � ���� �� contains the depth buffer value for that pixel. Withthese coordinates, inverse transformations of the mod-elling, camera and projection matrices are performed todetermine in real-time the corresponding world coordi-nates for the picked point on the screen.
As we are dealing with discretized representations ofthe geometry, there is always the danger of imprecision.To minimize this potential inaccuracy, we closely boundthe geometry with the near and far clipping planes to in-crease the dynamic range of the depth buffer. Currentdepth buffers have 16 to 32 bits of precision, provid-ing enough significant digits for finding adequate worldcoordinates. A nice side-effect of using this method isthat if more precision is required, the designer can zoomthe camera closer to the bone geometry, so that accuracyis bound to the discretization error of the picked visiblepixel.
6.3 CVSF constructionHaving created a local reference frame for our axial curveand having obtained point samples for the origin, inser-tion and mid-section curves, we now describe how tocompute spatial points from these profile curves given thesampling parameters ����� ���� ����.
The interpolating curves, origin����, insertion����, andmiddle���� are created from point samples obtained inter-actively from the user. We evaluate the points:
�� � origin������
�� � insertion������
�� � middle�����
and express them in terms of the axial local frame ofreferences, �� ���, �� ���, and �� ����� respec-tively, to get:
��� � �� ��� ���
��� � �� ��� ���
��� � �� ��� �����
The parameter �� is used to determine a point, � � on themuscle’s surface through interpolation of the points inEquation 3. Although we can use linear interpolation toget a point, �� on the muscle’s surface, the resulting sweptsurfaces are not satisfactory and there is only � � conti-nuity on the mid-section curve. Rather, we nonlinearlybias the swept surfaces towards the mid-section curve byusing a quadratic function. This creates a wider region
of influence in the middle of the muscle that follows theshape of middle���� before tapering off to the origin andinsertion curves. Depth in the muscle from the surface tothe axis is controlled by scaling the point � � by ��� beforetransforming �� back to its position in world coordinates:
� �� ����� ���� ���� � axial� ���� ��� �� �� �����
(3)By allowing a muscle shape designer to interactivelymodify the origin, insertion and axial curves, we cancompletely specify a new B-spline solid which interpo-lates these profile curves. This technique allows a largernumber of control points of the solid to be completelyspecified by a smaller set of points that make up the curve.Profile curves can be considered a deformation techniqueto define solid shapes because the points of the solid arereferenced and transformed relative to a local coordinatesystem based on the profile curves. The technique ofmodelling from profile curves is suitable for high-leveldesign of musculature on a human or animal model asseen in Figure 11, but lacks the fine muscle architecturaldetail needed for accurate muscle simulations.
7 Conclusion
The development of a consistent framework for data-fitting of B-spline solids allows the flexibility of design-ing volumetric geometric representations that are tailoredto different available data sources. In all cases, carefulconsideration of how the model will be used plays a ma-jor role in the construction of its CVSF. The three ap-plications we presented range from detailed muscle ar-chitectural studies to intuitive profile curves for interac-tive sketching of muscles onto a skeleton. The variety ofmuscle representations displayed attests to the versatilityof the B-spline solid model. However, a significant short-coming of using B-spline solids is the inability to inher-ently model branching structures. Although it is possibleto create a branched muscle through a union of severalB-spline solid muscles, subdivision solids may provide amore elegant method to inherently support branching.
The various muscle models presented here can alsobe combined to take advantage of the strength of eachmodel’s representation. For example, multiple fibre-setmuscles can be nested within a single muscle derivedfrom contour curves to visualize intricate fibre arrange-ments within the boundaries of a muscle extracted frommedical imagery. The control points of the envelop-ing solid can be used directly as a free-form deforma-tion, ensuring the nested solids deform with the solid thatcontains them. A unified B-spline solid framework canbe used to construct a digital library of muscle modelscontaining various levels of detail from general muscle
groups to detailed muscle fibre arrangements.
Acknowledgements
We would like to thank Anne Agur and Nancy McKeefrom the University of Toronto’s Department of Anatomyfor motivating the need to model accurate muscle fibre ar-chitecture and for performing the data collection of mus-cle fibres from cadaveric specimens. We thank HondaR&D Americas for their continued support of this workand the anonymous paper reviewers for their useful sug-gestions and comments.
References
[1] A.M.R. Agur and N.H. McKee. Soleus muscle:Fiber orientation. Clinical Anatomy, 10:130, 1997.Abstract.
[2] J. Bloomenthal. Calculation of reference framesalong a space curve. In Andrew S. Glassner, editor,Graphics Gems, pages 567–571. Academic Press,Inc., 1990.
[3] D. T. Chen and D. Zeltzer. Pump it up: Com-puter animation of a biomechanically based modelof muscle using the finite element method. In Com-puter Graphics (SIGGRAPH ’92 Proceedings), vol-ume 26, pages 89–98, July 1992.
[4] S. L. Delp, J. P. Loan, M. G. Hoy, F. E. Zajac, E. L.Topp, and J. M. Rosen. An interactive graphics-based model of the lower extremity to study or-thopaedic surgical procedures. IEEE Transactionson Biomedical Engineering, 37(8):757–767, 1990.
[5] V. Ng-Thow-Hing. Anatomically-based models forphysical and geometric reconstruction of humansand other animals. PhD thesis, University ofToronto, 2001.
[6] V. Ng-Thow-Hing, A. Agur, K. Ball, E. Fiume,and N. McKee. Shape reconstruction and subse-quent deformation of soleus muscle models usingb-spline solid primitives. In S.L. Jacques, edi-tor, Laser-Tissue Interaction IX, SPIE proceedings3254, pages 423–434, 1998.
[7] V. Ng-Thow-Hing and E. Fiume. Interactive displayand animation of b-spline solids as muscle shapeprimitives. In Computer Animation and Simulation’97, pages 81–97. Springer-Verlag/Wien, 1997.
[8] U.S. National Library of Medicine. The visible hu-man project. MRI, CT, and axial anatomical imagesof human body, October 1996.
[9] M. G. Pandy and F. C. Anderson. Three-dimensional computer simulation of jumping and
walking using the same model. In VIIth Inter-national Symposium on Computer Simulation inBiomechanics, pages 92–95, 1999.
[10] William H. Press, Saul A. Teukolsky, William T.Vetterling, and Brian P. Flannery. NumericalRecipes in C. Cambridge University Press, secondedition, 1992.
[11] H. Rijpkema and B. J. Green. Skinning cats anddogs using muscle deformations. In Siggraph 2001Conference abstracts and applications, page 262,2001.
[12] F. Scheepers, R. E. Parent, W. Carlson, andStephen F. May. Anatomy-based modeling of thehuman musculature. In Computer Graphics (SIG-GRAPH ’97 Proceedings), pages 163–172, August1997.
[13] D. Turner and S. Marino. Dynamic flesh and mus-cle simulation: Jurassic park iii. In Siggraph 2001Conference Abstracts and Applications, page 173,2001.
[14] J. Wilhelms. Animals with anatomy. IEEEComputer Graphics and Applications, 17(3):22–30,1997.
[15] J. Wilhelms and A. Van Gelder. Anatomically basedmodeling. In Computer Graphics (SIGGRAPH ’97Proceedings), pages 173–180, August 1997.
[16] F. E. Zajac. Muscle and tendon: Properties, models,scaling, and application to biomechanics and motorcontrol. Critical Reviews in Biomedical Engineer-ing, 17(4):359–411, 1989.
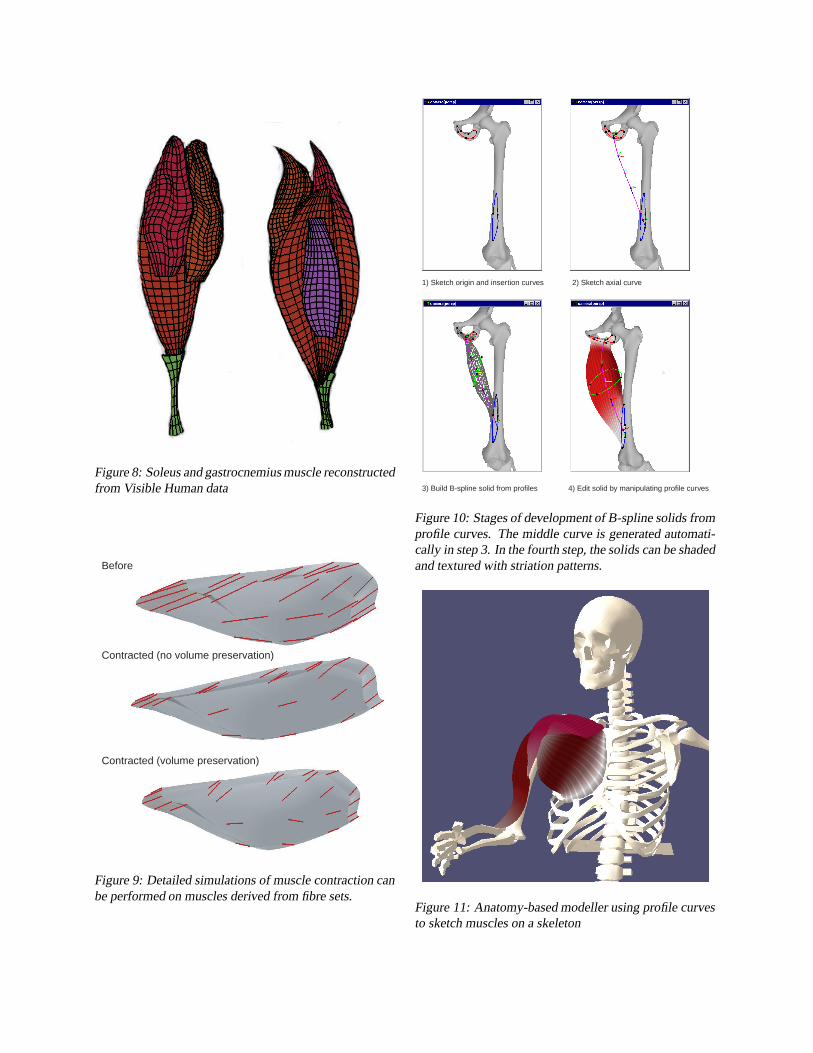
Figure 8: Soleus and gastrocnemius muscle reconstructedfrom Visible Human data
Before
Contracted (no volume preservation)
Contracted (volume preservation)
Figure 9: Detailed simulations of muscle contraction canbe performed on muscles derived from fibre sets.
1) Sketch origin and insertion curves 2) Sketch axial curve
3) Build B-spline solid from profiles 4) Edit solid by manipulating profile curves
Figure 10: Stages of development of B-spline solids fromprofile curves. The middle curve is generated automati-cally in step 3. In the fourth step, the solids can be shadedand textured with striation patterns.
Figure 11: Anatomy-based modeller using profile curvesto sketch muscles on a skeleton