Write back functionality from various dashboard tools to sap hana

Application Performance Monitoring for SAP©
Sandra Tipton
John Griffith
Tivoli Service Availability and Performance Management Integration Center of Competency
© Copyright International Business Machines Corporation 2011.
US Government Users Restricted Rights – Use, duplication or disclosure restricted by GSA ADP Schedule Contract with IBM Corporation

Contents1 Introduction.......................................................................................................................................................................................3
2 Application Performance Management for SAP Solution Usage Scenarios................................................................................3
3 Solution environment overview.....................................................................................................................................................12
4 Installing and configuring the products........................................................................................................................................21
5 Configuring Single Sign-on............................................................................................................................................................32
6 Configuring Agent-less Transaction Tracking of SAP.................................................................................................................33
7 Forwarding Events from ITM to OMNIbus.....................................................................................................................................40
8 Configuring Discovery Library Adaptors......................................................................................................................................48
9 Building SAP services using TADDM............................................................................................................................................48
10 Configuring the Discovery Library Toolkit..................................................................................................................................55
11 Creating the SAP Business Impact Dashboard in TBSM...........................................................................................................56
12 Conclusion....................................................................................................................................................................................63
Appendix A: Architecture:.................................................................................................................................................................64
Appendix B: Information centers......................................................................................................................................................65
Appendix C: Acronyms.....................................................................................................................................................................65

1 Introduction
This paper is a step-by-step solution guide to managing the end user response time for SAP transactions and monitoring of the SAP environments with IBM® Tivoli® solutions. Tivoli solutions works together to show a picture of the overall health of the SAP environment using agent-less monitors that will not impact the performance of your SAP components. This enables you to stay ahead of your clients by knowing critical availability and status information – and being able to proactively act on it. Tivoli solutions integrate with each other to discover the SAP environment, collect related elements into business services, and display notifications when events occur affecting the environment. From high-level visual overviews of the SAP system, you can drill down to more detailed information about the infrastructure and events happening within it.
2 Application Performance Management for SAP Solution Usage Scenarios
This section describes example scenarios of how to use the end to end business service and application performance management solution for SAP to improve the visibility into performance of the SAP business services, and understand the impact of application, server, middleware infrastructures on service health and the customer experience
2.1 Scenario 1: Operations detects an outage in the Metropolis data center
The operations center in Metropolis has been notified that several end users have complained about a performance slow down with their SAP application. The operations center must quickly assess if this performance issue is isolated, or if there is significant impact to their SAP business services. The SAP dashboard in the operations center gives them a consolidated view of the SAP transaction availability and response time, the status of the network, the SAP events impacting the SAP business services, and the relationships between the components in the SAP service impacted.
In this scenario, the operator can see that the SAP database server is in a critical state, and that multiple SAP transitions are being impacted with a significant slowdown.

Figure 1: SAP Business Impact Dashboard
2.2 Scenario 2: An end user calls in to the help desk to complain about the performance of the SAP application
A user from the Zion location has opened a ticket with the help desk, complaining about the performance of the SAP application. The operations center has been assigned the ticket, and needs to first determine whether the user’s issue is on the client side or in the data center.

The operator will first view the status of the simulated transactions being played back from the robot agents located in various locations, included the location of the end user, Zion. The statuses of the transaction playbacks in the Application Management Console workspace in the Tivoli Enterprise Portal will aid the operator in determining if the transaction performance issue is isolated to the client location in Zion, or is impacting other locations, which would indicate the issue is in the data center.
Figure 2: Robotic Playback Status in AMC
The operator can use the robotic response time workspace to view the end user response times and status. The even console on this workspace shows any violations of thresholds. By default, the thresholds are based on deviation from the baseline response time, but can be manually configured as well.

Figure 3: Robotic Response Time Workspace
For the operator to start isolating the cause of the problem, they can drill down and view the response time breakdown and availability trending.

Figure 4: Application Status
The operator can further isolate the problem by drilling down on the transaction to see response the time trending and sub-transactions.

The operator can quickly determine if there are any bottlenecks and where they are located in a topology view which shows the server components and the response times in between. In the figure below, the agent-less topology shows connection from the SAP NetWeaver/HTTP server to the DB/2 server and the bottleneck is highlighted. The table in the figure also summarizes the server interactions. In this example, the source SAP server xenmaster has a remote destination DB/2 server xenmaster-clone.
Figure 5: Reporter Network View

The transaction aggregate topology, as shown in the figure below, also shows the location of the bottlenecks, as well as the response times along each transaction hop.
Figure 6: Reporter Transaction View

If the operator needs to drill-down on the individual subtractions of the SAPGUI playback the SAP agent workspace will provide details about the user/transaction performance. This will show the response times for the transactions and any violations.
Figure 7: SAP Agent Workspaces

The operator would likely want to navigate to the operating system workspace since it is indicating a violation in the navigator view. The operating system workspace shown below indicates that there is a critical memory violation, so the operator will want to investigate further using that OS workspace.
Figure 8: Critical Violation in Agentless OS view

3 Solution environment overview3.1 Software Components Overview
The foundation software components for monitoring SAP application performance are IBM Tivoli Monitoring, ITCAM for Applications: SAP agent, ITCAM for Transactions (Response Time and Transaction Tracking components), and IBM Tivoli OMNIbus.
The Tivoli product, IBM Tivoli Application Dependency Discovery Manager, provides additional value over the base application performance monitoring solution, by discovering and monitoring changes to the SAP environment
The Tivoli product, IBM Tivoli Business Service Manager, provides additional value over the base application by visualizing and managing the impact to the business services.
3.2 Architectural Overview
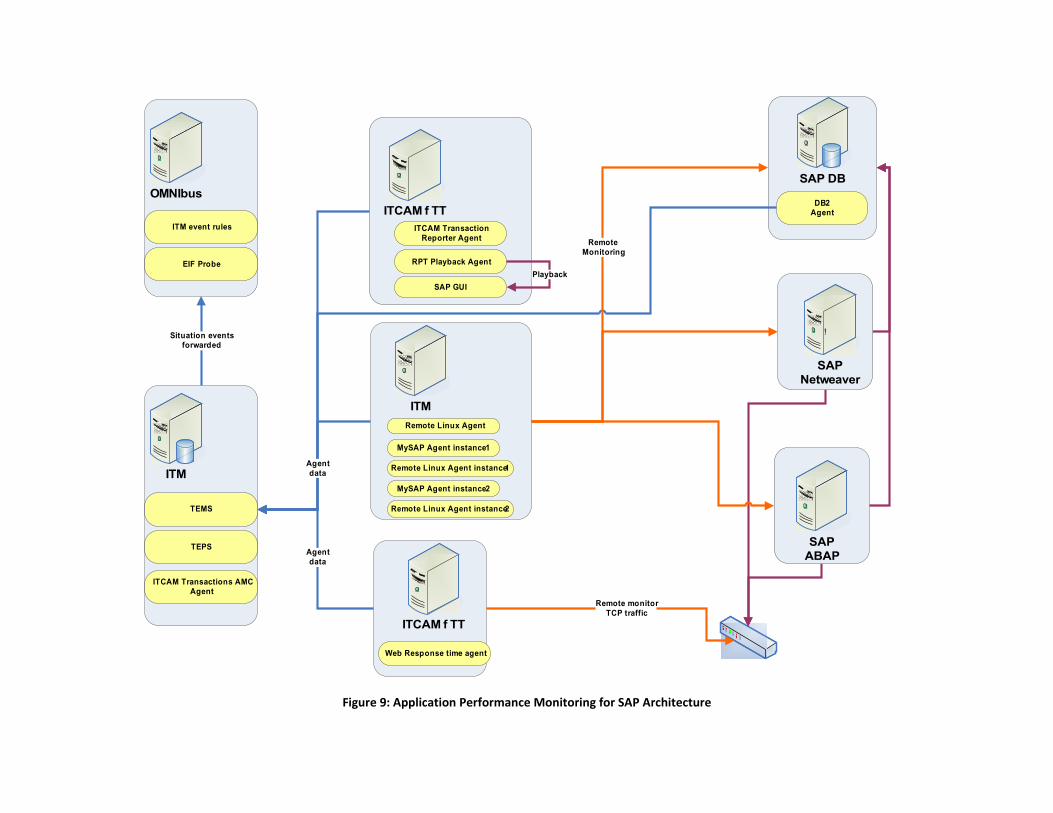
The figure below provides an architectural overview of the foundation software components for monitoring SAP application performance. These software components are used to monitor the end user response time and IT resources for the SAP application environment. The blue rounded rectangles represent the servers deployed in the solution. The yellow ovals represent the management software components deployed on the servers.
The application performance monitoring solution for SAP does not require any software components to be installed on the SAP servers.
A single OS agent is installed on a remote system for agent-less monitoring of each of the SAP and DB2 servers.
A single SAP agent is installed on a remote system for agent-less monitoring of each SAP instance.
DB2 agent is installed on the DB2 server to collect key performance metrics from the DB2 instance.
An ITCAM for Transactions Robotic agent is installed for recording and playing back robotic transactions. The playback scripts are uploaded to the ITCAM for Transactions Application Management Console Agent (AMC), which is deployed on the same server as the ITM server in this solution example. AMC can then deploy that script for playback by the remote playback agents.
In this solution example, SAP GUI and SAP HTTP robotic transactions are recorded and played back from a single server. In a production environment, a single server could be used for recording, and the lightweight robotic agent could be deployed to multiple geographic locations for playback.
An ITCAM for Transactions Web Response Time agent is installed on a remote system to monitor TCP and HTTP traffic. Due to the amount of network data that this agent collects, it needs to be installed on its own server. The WRT agent should be on the same network switch as the SAP

server. The switch needs to be configured with port mirroring. The agent-less data collected by this agent is retrieved by the ITCAM Transaction Tracking Reporter agent to stitch the transactions path based on the network hops.
As shown in Figure 9, each agent instance sends monitoring data to the Tivoli Enterprise Monitoring Server (TEMS or monitoring server). The monitoring server forwards situation alerts as events to the EIF probe. The EIF probe then forwards the events to the OMNIbus object server.
OMNIbus
ITM event rules
EIF Probe
ITM
TEMS
TEPS
ITCAM Transactions AMC Agent
ITCAM f TT
Web Response time agent
Remote monitor TCP traffic
ITCAM f TT
RPT Playback Agent
SAP GUI
Situation eventsforwarded
MySAP Agent instance 1
MySAP Agent instance 2
ITM
ITCAM Transaction Reporter Agent
DB2Agent
SAPABAP
SAPNetweaver
!
SAP DB
Agent data
Playback
Agent data Remote Linux Agent instance 1
Remote Linux Agent instance 2
Remote Linux Agent
RemoteMonitoring
Figure 9: Application Performance Monitoring for SAP Architecture

Figure 10 below builds upon the foundation software components for monitoring SAP application performance to provide a complete end to end business service management solution for SAP.
The TADDM server discovers the SAP environment by using the System Landscape Directory (SLD) and the Computing Center Management System (CCMS) sensors that discover the ABAP and J2EE components, respectively.
The DLA from ITM provides availability and configuration data collected by the monitoring agent to TADDM.
The SAP service tree in TBSM is created from TADDM discovery data. The TBSM Discovery Library Adapter Toolkit pulls the data from TADDM into TBSM. TBSM polls for events and provides status and availability data to the SAP nodes in the service tree.
Some customization is required for the SAP nodes to surface in the TBSM service tree. Also, some templates and rules in TBSM must be defined to enable status and availability.

OMNIbus
ITM event rules
EIF Probe
ITM
TEMS
TEPS
ITCAM Transactions AMC Agent
ITCAM f TT
Web Response time agent
Remote monitor TCP traffic
ITCAM f TT
RPT Playback Agent
SAP GUI
Situation eventsforwarded
MySAP Agent instance 1
MySAP Agent instance 2
ITM
ITCAM Transaction Reporter Agent
DB2Agent
SAPABAP
SAPNetweaver
!
SAP DB
Agent data
Playback
Agent data
Remote Linux Agent instance 1
Remote Linux Agent instance 2
Remote Linux Agent
RemoteMonitoring
TADDMDiscovery
CCMS and SLD Sensors
DLT Pulls
TADDMStorage DLA
Events synched
CDM to TBSM customizations
Template and rules customizations
TBSM
Figure 10: Business Service Management for SAP Architecture

3.3 Deployment Procedure Overview
The flow chart below provides an overview of the steps required to deploy the Tivoli software components needed to manage the end user response time and IT infrastructure for your SAP environment. The detailed explanation of these deployment steps are described in section 4 of this solution document.
Summary of APM For SAP Procedure
ITCAM TT ITM ITCAM RT OMNIbusITCAM WRT
Install EIF Probes
Install OMNIbus
Install ITCAM
Integration
Install and configure
ITCAM Transactions
Install & Configure ITM Server
Install DB2
Configure ITM EIF
Install ITCAM RT
& WRT Support
Record/Upload SAP
Robotic Scripts
Install & Configure ITCAM RT
Assign script
playback to agent
Install SAP GUI Client
Configure port monitor
on agent machine
Validate data in
topo view in
Reporter view in
TEP
Install & Configure
ITCAM WRT
Configure Reporter and
add all pertinent data collectors and WRT agents.
Install & Configure ITCAM TT Reporter
Figure 11: Application Performance Monitoring for SAP Deployment

To obtain the additional value of discovering and monitoring changes in your SAP environment, the flow chart below provides an overview of the additional software component deployment steps required. The detailed explanation of these deployment steps are described in section 4 of this solution document.
As you can see in the flow chart in Figure 12, the deployment of the TADDM discovery and storage components can be done before, after, or in parallel to the deployment of the response time and resource monitoring components.

Summary of APM For SAP Procedure
ITCAM TT ITM ITCAM RT OMNIbusITCAM WRTTADDM StorageTADDM Discovery
Install TADDM
Discovery Server
Run or Schedule
discoveries
Configure for
discovery(access list,
scopes)
Install DB2
Bulkload IDML data
Install TADDM Storage Servier
Create business
groupings
Install EIF Probes
Install OMNIbus
Install ITCAM
IntegrationInstall and configure
ITCAM Transactions
Run ITM DLA
Install & Configure ITM Server
Install DB2
Configure ITM EIF
Install ITCAM RT
& WRT Support
Record/Upload SAP
Robotic Scripts
Run RT DLA
Install & Configure ITCAM RT
Assign script
playback to agent
Install RT Discovery
Library Adaptor
Install SAP GUI Client
Configure port monitor
on agent machine
Validate data in
topo view in
Reporter view in
TEP
Install & Configure
ITCAM WRT
Configure Reporter and
add all pertinent data collectors and WRT agents.
Install & Configure ITCAM TT Reporter
Run TT DLA
Install TT Discovery
Library Adaptor
Figure 12: Flow showing TADDM discovery and storage components
The flow chart in Figure 13 describes the additional software component deployment steps that are needed to view the SAP business services and manage business impact. The detailed explanation of these deployment steps are described in section 4 of this solution document. Note that in this configuration the installation and configuration of the TBSM installation has a dependency on the OMNIbus deployed on a separate server.

Summary of APM For SAP Procedure
ITCAM TT ITM ITCAM RT OMNIbusTBSM Single Sign OnITCAM WRTTADDM StorageTADDM Discovery
Install TADDM
Discovery Server
Run or Schedule
discoveries
Configure for
discovery(access list,
scopes)
Install DB2
Bulkload IDML data
Install TADDM Storage Servier
Create business
groupings
Export LTPA Key
Configure ITM TEPS for SSO/ Import
LTPA key
Configure TADDM
for SSO/ Import
LTPA key
Configure TBSM TIP
Dashboard for SSO
Configure data feeds to
TBSM
DefineCustom Canvas
Custom Install TBSM Dashboard &
Server
Define Business Model & Template
Install DB2
Install/Configure data pull
from TADDM
Install ITCAM
Integration
Install EIF Probes
Install OMNIbus
Install TBSM
Integration
Install ITCAM
Integration
Install and configure
ITCAM Transactions
Run ITM DLA
Install & Configure ITM Server
Install DB2
Configure ITM EIF
Install ITCAM RT
& WRT Support
Record/Upload SAP
Robotic Scripts
Run RT DLA
Install & Configure ITCAM RT
Assign script
playback to agent
Install RT Discovery
Library Adaptor
Install SAP GUI Client
Configure port monitor
on agent machine
Validate data in
topo view in
Reporter view in
TEP
Install & Configure
ITCAM WRT
Configure Reporter and
add all pertinent data collectors and WRT agents.
Install & Configure ITCAM TT Reporter
Run TT DLA
Install TT Discovery
Library Adaptor
Figure 13: Showing additional software component deployment steps

4 Installing and configuring the products
In this section, the installation and configuration for each of the products is described.
4.1 ITM
Links to the official documents will be updated when FP 6 is released
For this solution, the ITM TEPS and Warehouse DB2 9.7 server and ITM 6.2.2 FP 2 server were installed and configured on a single Linux server using the documentation at the following link.
http://publib.boulder.ibm.com/infocenter/tivihelp/v15r1/topic/com.ibm.itm.doc_6.2.2fp2/install_itm.htm?path=3_1_2_0_5_3#install_itm
For agent-less monitoring of the operating systems for the SAP and DB2 servers, the ITM agents were installed and configured on a separate Linux server. For DB2 monitoring of the SAP DB2 server, the ITM agents was installed on the SAP DB2 server. The agents were installed and configured using the documentation at the following link:
http://publib.boulder.ibm.com/infocenter/tivihelp/v15r1/topic/com.ibm.itm.doc_6.2.2fp2/unix_instma.htm?path=3_1_2_0_5_3_3_1#unix_instma
4.2 IBM Tivoli Composite Application Manager for Transactions
Rational Function Tester V8.2 and components from the Tivoli Composite Application Manager for Transactions Version 7.3 were installed into the ITM environment for transaction tracking of SAP servers. The following web address is the Installation and Configuration section for ITCAM for Transactions. Please refer to this section for more details on installing and configuring all ITCAM for Transaction components discussed below:
http://publib.boulder.ibm.com/infocenter/tivihelp/v24r1/index.jsp?topic=/com.ibm.itcamt.doc_7.3/rt/Install_Guide/installingrationalproducts.html
4.3Rational Function Tester

Rational Function Tester (RFT) provides the ability to record HTTP and SAP-GUI transactions which will be played back by the Robotic Response Time agent. After installing RFT, ITCAM for Transactions support for RFT was installed which provides a Rational license and the upload capability to the Application Management Console (AMC). See the following web address for more details on installing and configuring RFT:
http://publib.boulder.ibm.com/infocenter/rtnlhelp/v6r0m0/index.jsp?topic=%2Fcom.rational.test.ft.help%2Ficwelcome_product_rft.htm
For more details on ITCAM for Transactions support for RFT, please refer to the Installation and Configuration section at the web address at the top of section 4.2.
After installing the ITCAM for Transaction support, ensure that the ITCAM views are in RFT and that you can upload scripts to the AMC.
4.4 Application Management Console Agent
The AMC agent manages and distributes profiles, maintenance windows, client information, and user information for all the other Response Time and Transaction Tracking monitoring agents. For this solution, the agent was installed and configured into the ITM environment. The AMC support was also installed on the Tivoli Enterprise Server (TEMS), Tivoli Enterprise Portal Server (TEPS), and Tivoli Enterprise Portal (TEP) desktop consoles. For more details on installing and configuring the AMC agent, please refer to the Installation and Configuration section at the web address at the top of section 3.2.
Once the agent is configured and started, verify that the AMC workspaces contain data. Click on the Application Management Configuration Editor icon as shown in the figure below.

Figure 14: Clicking to view Application Management Configuration Editor
Ensure that the Application Management Configuration editor panel appears. This editor will be used in a later section to configure and distribute response time playback of the SAP recordings to the robotic response time agent.
4.5 Robotic Response Time Agent
The Robotic Response Time (RRT) agent will play back SAP(c) web and SAP(c) GUI transactions recorded with RFT. These transactions represent a set of steps typically performed by a SAP end user to complete a business objective, such as logging into the SAP GUI, creating a bank statement for an account, and reading the balance of the account.
In this solution, the RRT agent was installed and configured in the ITM environment. In the agent configuration, you can configure key parameters for data analysis and Rational Functional Tester as shown below.

Figure 15: Robotic Response Time Agent Configuration
For more details on installing and configuring the RRT agent, please refer to the Installation and Configuration section at the web address at the top of section 4.2.
4.6 Web Response Time Agent
The Web Response Time (WRT) agent provides the end-user experience and uses server-side monitoring to capture HTTP and HTTPS transaction data such as response time and status codes. In this solution, the WRT agent was installed on a dedicated system; this is recommended as best practice since the agent can potentially process large amounts of TCP data.
For more details on installing and configuring the AMC agent, please refer to the Installation and Configuration section at the web address at the top of section 4.2.
In a later section, we’ll go into detail on configuring the WRT agent for agent-less tracking.

4.7 Transaction Reporter Agent
The Transaction Reporter collects data from the WRT agent and uses a number of algorithms to create end to end transaction topologies or transaction instance graphs which are displayed in the Tivoli Enterprise Portal. In this solution, in the agent configuration, the WRT agent was added to the aggregation agent list:
Figure 16: Transaction Reporter Agent Configuration
More aggregation agents can be added to this list; if left blank, the reporter will aggregate all available aggregate agents connected to the TEMS.

4.8 ITCAM for Applications: SAP agent (agent-less monitoring)
The ITCAM for Applications: SAP agent, Version 6.2 is installed in an existing IBM Tivoli Monitoring V6.2.1 with Fix Pack 1 infrastructure, hub Tivoli Enterprise Monitoring Server (TEMS), and Tivoli Enterprise Portal Server (TEPS or portal server). After installing the agent, you configure each instance by configuring the monitoring agent for SAP component by using the Manage Tivoli Enterprise Monitoring Services (MTEMS) utility.
See the following web address for more detail and troubleshooting information about configuring the SAP agent:
https://www.ibm.com/developerworks/wikis/display/tivolimonitoring/SAP+Agent
The agent is located on a remote system with multiple instances configured to monitor SAP servers on separate machines; this setup is known as agent-less monitoring.
Figure 17: Manage Tivoli Enterprise Monitoring Services showing multiple SAP instances.

Figure 17 shows the MTEMS panel with three agent instances corresponding to three SAP instances. In this case, each instance points to an SAP instance on a separate system. Note that you can also install the SAP agent on the SAP server itself. But in both cases, the transport files must be imported to the SAP server as described in the SAP installation guide.

Figure 18: SAP Agent configuration for SAP instance ST1
In the Figure 18, an SAP instance ST1 is located on the xenmaster host. The user ID and password for IBMMON_AGENT is generated by the transport file that is manually added and imported to the SAP server. This user ID is used for remote monitoring of the SAP server.

Install SAP agent Interim Fix 8 or greater to ensure the agent has the latest updates. The transport files from the Interim Fix must also be added and imported in to the SAP server.
4.9 OMNIbus ObjectServer and Event Integration Facility Probe
In this section, installing and configuring OMNIbus is described. In addition, we discuss how ITM and TBSM are integrated with OMNIbus.
4.9.1 OMNIbus Object Server
Tivoli Netcool/OMNIbus tracks alert information from the SAP, ITCAM, and OS agents and through event correlation provides status and availability indicators in TBSM. In this solution, OMNIbus Version 7.3.1 was installed on a dedicated system. The post-installation instructions were followed to create and start the object server. For more details on installation and configuration go to this web address:
http://publib.boulder.ibm.com/infocenter/tivihelp/v8r1/topic/com.ibm.netcool_ OMNIbus.doc_7.3.1/OMNIbus/wip/install/concept/omn_ins_installingu pgradinguninstalling.html
4.9.2 Event Integration Facility (EIF) probe
In this solution, the EIF probe bundled with Tivoli Business Service Manager (TBSM) Version 6.1 was installed on the system with the OMNIbus server. The EIF probe allows forwarding of situation alerts from the IBM Tivoli Monitoring server to the OMNIbus object server. For more details please go to the following web address:
http://publib.boulder.ibm.com/infocenter/tivihelp/v3r1/topic/com.ibm.tivoli.itbsm.doc/installguide/bsmi_t_installing_eif_probe.html
4.9.3 TBSM and ITM support
The TBSM install media contains some important configuration files in order to integrate ITM and TBSM with OMNIbus. In order for the events from ITM to map accurately to OMNIbus’ event model, install the itm_event.rules in the probe directory. Similarly, install the tbsm_eif_event.rules into the probe directory for event correlation with TBSM. The TBSM schema must also be loaded into the OMNIbus event database. To do this follow the procedure outlined at this web address:
http://publib.boulder.ibm.com/infocenter/tivihelp/v3r1/index.jsp?topic=%2Fcom.ibm.tivoli.itbsm.doc%2Finstallguide%2Fbsmi_c_netcool_ OMNIbus.html
For example, the following command will load the necessary TBSM alert fields and triggers into OMNIbus in schema bsmadmin.
./import_schema.sh /opt/ibm/netcool tbsm_db_update.sql bsmadmin BSM_COMS root “”
4.10 Tivoli Application Dependency Discovery Manager
Note: TADDM 7.2.1 FP 1 will ship perhaps late September. The links to official documentation will be updated prior to external publication
TADDM 7.2.1 FP 1 was deployed using the streaming server deployment for greater availability of data, cost savings, and elimination of merging problems when consolidating data as described in the following link http://publib.boulder.ibm.com/infocenter/tivihelp/v46r1/topic/com.ibm.taddm.doc_721/InstallGuide/c_cmdb_arch_streaming.html
In this solution, we selected WebSphere Federated Repositories-configured user registry.

4.11 Tivoli Business Service Manager
This section describes the installation steps for the Tivoli Business Service Manager (TBSM) Version 6.1.
4.11.1 TBSM Data Server and User Console
In this solution, TBSM data server and user console (Tivoli Integrated Portal) were installed on the same system. The system met hardware and software requirements in order to run both TBSM components concurrently. However, it is best practice to install each of these components on separate systems. For more detail on prerequisites, installation steps and configuration, visit the following web address:
http://publib.boulder.ibm.com/infocenter/tivihelp/v3r1/topic/com.ibm.tivoli.itbsm.doc/install_guide_ic.html
While configuring the object server during the TBSM installation, we used the connection info for our existing OMNIbus server. For user security, we chose file repository. In the next section, we will show how to configure LDAP user security with single sign-on enabled.
4.11.2 Tivoli Discovery Library Toolkit
The TBSM 6.1 installer also installs and configures the Discovery Library Toolkit (DLT). Choose this component and select both modes for loading data: TBSM and TADDM. Enter the TADDM storage server connection information and credentials. In a later section, we’ll use the DLT to pull data in from the TADDM storage server.

5 Configuring Single Sign-on
Single sign-on (SSO) is required for the ability to launch in context from a source to a destination without logging in. It also required for creating and viewing ITM web services charts in the TBSM user console. For more details on setting up SSO, go to this web address:
http://www.ibm.com/developerworks/wikis/display/tivolibsm/Quick+Configuration+Guide+for+SSO
This section presumes that all of the products (TBSM, TADDM, etc) are configured to use a common LDAP server. The following sections will show the steps to enable single sign-on between the products with an existing LDAP authentication.
5.1Configuring the TBSM User Console for SSO
In this solution, we configured the SSO properties in the WAS administrative console for the TBSM user console (TIP) using an Active Directory 2008 LDAP server. The following table shows the WAS security parameters used in this solution:
Parameter Value
Realm name BSMProfile
Base entry ou=DMF,dc=ivt2008,dc=tivlab,dc=austin,dc=ibm,dc=com
Domain name .ibm.com
Table 1: WebSphere Global Security Parameters
The LTPA key file was exported and then copied to the different computer systems to be imported.

5.2Configuring TADDM Data Management Portal for SSO
In this solution, TADDM was installed with a WebSphere Federated Repositories-configured user registry. Log into the WAS administrative console, and configure the security parameters to correspond values above. Import LTPA key file which was exported from the TBSM’s WAS in the section above.
5.3Configuring ITM TEPS for SSO
Using the Manage Tivoli Enterprise Monitoring Services console or the command-line, configure the SSO settings to correspond to the common values in the above sections. Enable the WAS administrative console, log in, and change the base entry. Import the LTPA key file.
For more details on setting up SSO in ITM, access this web address:
http://publib.boulder.ibm.com/infocenter/tivihelp/v15r1/index.jsp?topic=%2Fcom.ibm.itm.doc_6.2.2fp2%2Fuserauthenticate_tepse_console4ldap.htm
6 Configuring Agent-less Transaction Tracking of SAP
In this section, you configure the ITCAM for Transaction components to enable agent-less transaction tracking of SAP. For additional details on agent-less transaction tracking refer to this web address:
https://www.ibm.com/developerworks/mydeveloperworks/blogs/0587adbc-8477-431f-8c68-9226adea11ed/entry/ agent- less_transaction_tracking_in_itcam_for_transactions_7.3?lang=en
6.1 Advanced configuration of WRT

There are some prerequisite steps that need to be done in order to enable agent-less tracking.
6.1.1 Port mirroring
The WRT agent must be installed on the same switch as the SAP server that needs to be monitored. The switch must be configured for port mirroring. Below is a web address containing more details on port mirroring:
http://www.miarec.com/faq/what-is-port-mirroring
Essentially the TCP traffic generated by the robotic response time agent hitting the SAP server will be analyzed by the WRT agent as shown in the figure below:

Computer System with WRT agent
SAP server
Switch with port mirroring
Router
RRT agent playback
SharedTCP traffic
SharedTCP traffic
Figure 19: Port Mirroring showing WRT and SAP Server
6.1.2 Enabling network monitoring protocol on the WRT machine with Windows OS
For WRT agents running on Windows, install the network monitoring driver. To do this, go to Control Panel->Add or Remove Programs, and select Add/Remove Windows Components. Choose Network Monitoring Protocol. This is only necessary for WRT agents running on Windows OS.
6.1.3 Configuring TCP and HTTP monitoring on the WRT agent
Configure the WRT agent to monitor all TCP traffic and all HTTP transactions as shown in Figure 20:

Figure 20: TCP settings for WRT
In the advanced monitoring configuration of the agent, enable monitoring network traffic as shown in the figure below. You can also use network and server masks to filter out other unnecessary traffic which may clutter the data in the TEPS workspaces as shown below:

Figure 21: Advanced settings for WRT
6.2SAP playback
In this section, record the transactions and configure the Robotic Response time agent playback to generate TCP traffic for agent-less transaction tracking. It is suggested to read the following document at this web address:
http://www.ibm.com/developerworks/wikis/display/tivolimonitoring/Monitoring+SAP+applications+with+Rational+Performance+Tester+and+ITCAM+for+Response+Time?decorator=printable
This document outlines in detail how to record SAP transactions and monitor SAP using the RRT agent. In the next sections, we’ll briefly discuss how it was done for this solution.

6.2.1 Recording SAP ABAP transactions
Obviously, you will need to target important ABAP enterprise transactions that capture key performance and availability for your enterprise. To record, install the SAP GUI where the Rational Function Tester is installed. Ensure you’re able to log into SAP from the GUI before recording. Choose SAP transaction when you record in RFT. In our solution, we recorded a transaction made up of 15 sub-transactions that accessed the SAP database.
6.2.2 Recording SAP J2EE transactions
In addition to capturing ABAP transactions in our solution, we recorded a HTTP transaction in RFT using the Web Dynpro for Java application.
The transaction consisted of 20 steps which also accessed the SAP database. Both scripts were then uploaded to the AMC.
6.2.3 Setting up the playback agent
Using the Application Management Configuration editor in the TEPS console, create a RRT profile for each script. Configure each sub transaction’s number of retries or response time thresholds if necessary as shown in the figure below. Assign the playback to agents in the Distribution tab.

Figure 22: RRT profile in AMC editor
6.2.4 Verifying the data in the TEPS console
Once the transactions are playing back, navigate to the Network view in the WRT workspaces. This view and workspaces show the agent-less data as shown in this figure:

Figure 23: Network workspaces in WRT
In these workspaces, you will see a summary of components, servers, and connections based like the HTTP server, DB2 server, and NetWeaver. This agent-less data is “stitched” together by the Transaction Reporter agent. The agent-less data workspace in the Transaction Reporter view shows all of server stitched together as shown in the following figure:

Figure 24: Reporter Network Topology showing SAP components
Also, details on the network interactions such as the interaction between the SAP server and the remote DB/2 database are shown. In the example above we see some critical alerts. These alerts can now be forwarded to OMNIbus which is described in the next section.

7 Forwarding Events from ITM to OMNIbus
In this section, you complete the procedures to enable the data flow shown in Figure 9 in section 3.2 that goes from the agent to Tivoli Monitoring and from Tivoli Monitoring to OMNIbus. We’ll use the SAP monitoring agent as an example, but the steps can be followed for any other agent such as the ITCAM for Transaction RRT or an OS agent.
7.1Validating workspaces in Tivoli Monitoring
When the SAP Tivoli Monitoring agent instances are configured and started, the workspaces are displayed in the Tivoli Monitoring portal server console:

Figure 25: SAP agent navigator tree

As shown in Figure 25 a SAP navigator tree in the portal server contains a SAP node with instance and system subnodes. Additional subnodes for managed groups can also be defined. By using managed groups, you can monitor subsets of information in the SAP system:
Figure 26: SAP agent managed groups
To define managed groups, you must select monitors and monitor sets within SAP. See this section of the documentation for details:
http://publib.boulder.ibm.com/infocenter/tivihelp/v24r1/topic/com.ibm.itmfa.doc/main_r314.htm#maintainmanagedgroups
For troubleshooting agent issues, see the following documentation:
• Appendix D. Problem determination in the IBM Tivoli Monitoring for Applications: SAP Agent User's Guide
• SAP Agent Wiki: https://www.ibm.com/developerworks/wikis/display/tivolimonitoring/SAP+Agent
7.2 Sending Situation Alerts from ITM to the EIF probe
Given a Tivoli Monitoring environment consisting of a monitoring server, portal server, and the SAP agent with multiple instances, configure the monitoring server to forward situation events to the EIF probe. Complete this setup by configuring the monitoring server through the Manage Tivoli Enterprise Monitoring Services and reconfiguring the monitoring server as shown in the following figure:

Figure 27: Tivoli Monitoring Manage Situations
The default situations for IBM Tivoli Composite Application Manager (ITCAM) for Transaction Tracking should be started and sending events to the EIF. However, you can validate and manage the situations by selecting a SAP agent subnode and right-clicking on Manage Situations, which launches the Manage Situation panel:

Figure 28: Tivoli Monitoring Manage Situations
In this window, you start, stop, and edit situations. Figure 28 shows the default situations that can be stopped, started, or edited from this view. To immediately send situation events to OMNIbus, click Select All, and click the Start Situation icon at the top-left side of the panel.

7.3 Validating events in the OMNIbus Active Events List
To ensure that events are flowing from Tivoli Monitoring to the OMNIbus object server, log in to the TBSM dashboard server (or the OMNIbus Event List application), and validate that you’re receiving events from the SAP agent instances. If you have many events, filter on the Node field that corresponds to the node in the SAP navigator tree in the Tivoli Enterprise Portal (portal) console.
Figure 29: Tivoli Monitoring Manage Situations
For instance, in Figure 29 above, notice the events with Node fields equal to “ST1-xenmaster_ST1_00:Ins.” This name is also the name of the Tivoli Monitoring instance node for a SAP server on xenmaster with system ID ST1. Double-click a SAP event and verify the Summary field:

Figure 30: Alert status details showing SAP summary
The summary field provides the Key Performance Indicator (KPI) that triggered the event; it should contain the condition that was violated. When you verify that an event flow is coming from your SAP servers through Tivoli Monitoring, it is time to correlate the events with the service nodes.

8 Configuring Discovery Library Adaptors
To map Tivoli Monitoring events to the SAP service nodes in the TBSM service tree and enable the launch from the service back to Tivoli Monitoring, you must run Discovery Library Adaptors (DLAs), and then bulk-load the output IDML book into TADDM.
8.1Loading OS and DB agent data
Service nodes corresponding to monitored computer systems and databases are mapped to incoming ITM loading the ITM IDML book into TADDM. On the system where the Tivoli Enterprise Portal is located, run the tmsdla script. Copy the output IDML to the TADDM system. Then run the loadidml command to load the data into TADDM. Example:
loadidml.sh –f /tmp/TMSDISC620-A.bsmitm.2011-08-19T23.35.12Z.xml
8.2 Loading SAP agent data
In order to map SAP agent events to SAP system and instance service nodes in TBSM, first install the SAP extension for the ITM DLA. Copy the ksa_tmsdla.xml into the tmsdla directory. Run the tmsdla script and the SAP BSM identities will now be mapped with the SAP components within the output ITM IDML book. Load the IDML book into TADDM as usual.
9 Building SAP services using TADDM
9.1 Configuring sensor discovery using the TADDM Discovery Management Console
The following procedure shows how to create a summary configuration in the TADDM Discovery Management Console to enable SAP discovery:

9.1.1 Scope sets
Add a scope set to contain the computer systems where the SAP systems are running. Optionally, you can add other computer systems that contain supporting servers such as IBM DB2® and the Tivoli Monitoring agent (if running agent-less monitoring).
Figure 31 : Adding TADDM Scope Sets
9.1.2 Access List Entry for the Operating System
Add an access list entry for the user that will securely access the operating system. This access is required so that TADDM can discover the SAP CIs (configuration items) when logged in to a secure session.

Figure 32: OS user
9.1.3 Access List entry for the SLD user
Add an access list entry for the System Landscape Directory (SLD) user that will discover the J2EE components of the SAP server:

Figure 33: SLD user
9.1.4 Access List entry for the CCMS user
Add an access list entry for the Computing Center Management System (CCMS) user that will discover the ABAP components of the SAP server:

Figure 34: CCMS user
9.2 Running and scheduling discoveries
To run the discovery, select Overview in the navigation panel, and press the Run Discovery button. The details for running a basic discovery are located in the documentation at this link:http://publib.boulder.ibm.com/infocenter/tivihelp/v46r1/topic/com.ibm.taddm.doc_721/UserGuide/c_cmdb_runbasicdiscoveries.html

Figure 35: Running SAP Discovery
To schedule a discovery, select Schedule in the Navigation panel, and press the Add button. The details for scheduling a discovery are documented here:http://publib.boulder.ibm.com/infocenter/tivihelp/v46r1/topic/com.ibm.taddm.doc_721/UserGuide/t_cmdb_establishingaschedule.html
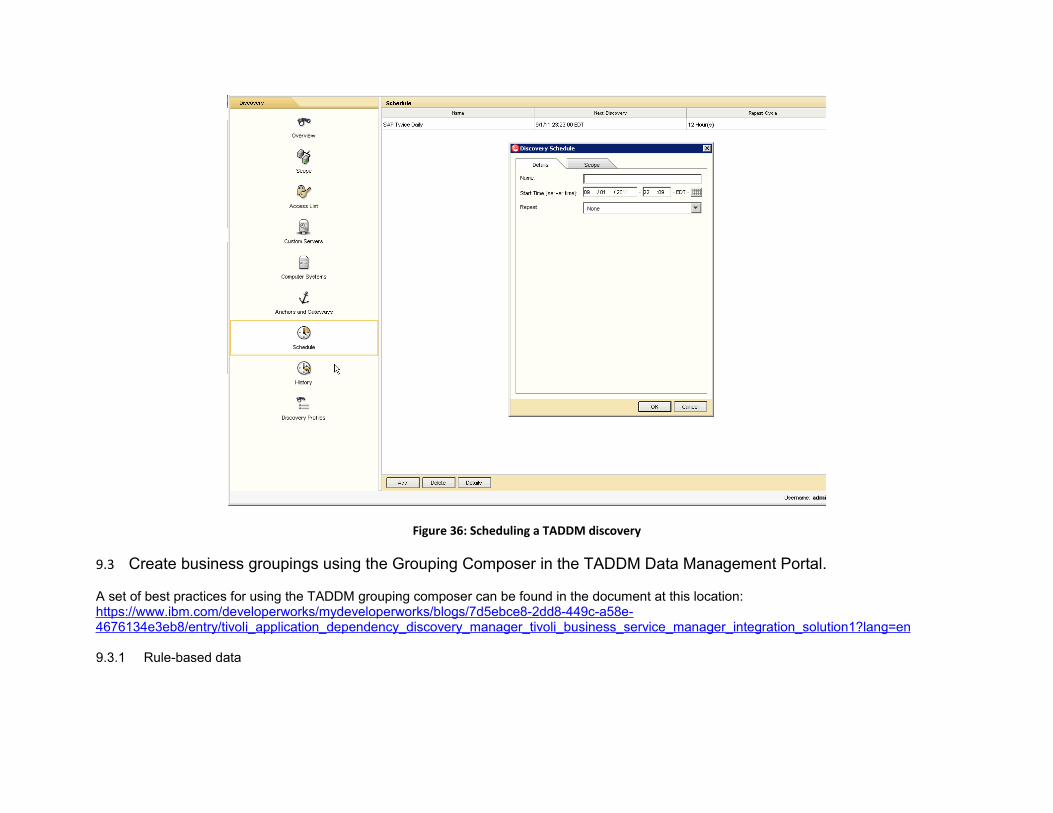
Figure 36: Scheduling a TADDM discovery
9.3 Create business groupings using the Grouping Composer in the TADDM Data Management Portal.
A set of best practices for using the TADDM grouping composer can be found in the document at this location:https://www.ibm.com/developerworks/mydeveloperworks/blogs/7d5ebce8-2dd8-449c-a58e-4676134e3eb8/entry/tivoli_application_dependency_discovery_manager_tivoli_business_service_manager_integration_solution1?lang=en
9.3.1 Rule-based data

For this solution, a rule-based application was created to define the components of the SAP business application. In an example scenario, the SAP database had to be moved to another machine, and the rules based grouping dynamically included the relocated SAP database in the business application.
Select Grouping Composer from the Discovery tab in the navigation panel, and create a new grouping composer. On the General Information tab, give the group a name, and select the Business Application type. Create a set of rules that will select the SAP databases, clusters, servers, application, and J2ee components that make up the SAP application environment.
For example, in the figure below, the query rule is defined to dynamically select the SAP database, based on the selected naming convention for the database instance. Note that the full qualified Common Data Model (CDM) class name was used in the select from clause for the query: com.collation.platform.model.topology.app.db.db2.Db2Instance
Figure 37: Rule editor in the TADDM Grouping Composer
The grouping rules that were configured for this solution example were:• For dynamically selecting the SAP database based on the database instance naming convention:Select * from com.collation.platform.model.topology.app.db.db2.Db2Instance where (displayName contains “db2st1”)• For dynamically selecting the SAP cluster based on the naming convention:Select * from com.collation.platform.model.topology.app.packagedapp.mysap.basis.MySAPCluster where (displayName contains "ST1:")

• For dynamically selecting the SAP and DB2 computer systems based on naming conventionSelect * from ComputerSystem,AppServer where (AppServer.host.guid == ComputerSystem.guid AND AppServer.displayName contains "ST1:")• For dynamically selecting the J2ee instance based on naming conventionSelect * from com.collation.platform.model.topology.app.packagedapp.mysap.basis.MySAPJ2EEEngineInstance where (displayName contains "ST1:")• For dynamically selecting the SAP application components based on naming conventionSelect * from AppServer,AppServerCluster where (displayName contains "ST1:")
9.3.2 Content-based data
For this solution, a content based application was also created to define a static business application that contains the discovered components.
9.4 Loading the IDML books into TADDM storage server
The ITDM books generated by the DLAs were loaded into the TADDM storage server by using the procedure documented at this linkhttp://publib.boulder.ibm.com/infocenter/tivihelp/v46r1/topic/com.ibm.taddm.doc_721/UserGuide/c_cmdb_blbulkload.html
10 Configuring the Discovery Library Toolkit
Start the DLT service with the tbsmrdr_start command and start the discovery
/data/IBM/Tivoli/tbsm/XMLtoolkit/bin/cmdbdiscovery –b –r
In this case, you are also running an immediate bulk discovery that pulls the business groupings into TBSM.
After a successful discovery, log in to the TBSM dashboard and navigate to Availability > Service Availability. Expand the Imported Business Services node. The service node is created by TBSM with the name of the TADDM business application:

Figure 38: Business service “SAP Env – static” in the TBSM service tree
As seen in the example in Figure 38, all the components contained in the business application container are created in TADDM. Verify each node by expanding the node and ensure each subnode is shown. Notice that the service nodes are showing event status since we loaded IDML books into TADDM.
11 Creating the SAP Business Impact Dashboard in TBSM

11.1 Create transaction scorecard with real time status
One of the portlets customized for the SAP business impact dashboard is the transaction scorecard shown in the figure below.
Figure 39: Custom scorecard for SAP transactions
This scorecard displays real time data from the robotic transactions. The steps for creating the data fetcher, creating the templates, and creating the services are described in the document posted at the following link.
https://www.ibm.com/developerworks/mydeveloperworks/blogs/7d5ebce8-2dd8-449c-a58e-4676134e3eb8/entry/creating_a_tbsm_robotics_dashboard_with_real_time_data19?lang=en
To create the transaction scorecard, navigate to Settings->Page and create a new page. Enter a name for the page, specify the page location in the navigation tree, and select the Freeform page layout option as shown in the figure below, and press OK.

Figure 40: Naming the custom page
Scroll through the palette of portlets available using the arrow button, until the Service Tree portlet is available as shown below. Drag and drop the Service Tree portlet into the page builder area customize it to be the desired location and size.
Figure 41: Choosing the Service Tree portlet

Customize the content of the service tree portlet to display the real time robotic transaction status using the service tree and templates previously configured.
Figure 42: Customizing the Service Tree
In the service tree portlet settings panel, set the title of the scorecard on the General Tab. Select the service tree in on the context panel to the service tree created for the SAP robotic transactions which will define the Starting Instance. On the View tab, select the template previously created the SAP robotic transactions.

Figure 43: Choosing the starting node for the service tree
Select OK, and then select the Save option to save the page. The robotic transactions scorecard has now been created for the dashboard page.

11.2 Create web service chart portlet
In this section, you will create a chart portlet from the ITM web service. For more details on the charting in TIP, refer to this web address:
http://publib.boulder.ibm.com/infocenter/tivihelp/v3r1/index.jsp?topic=%2Fcom.ibm.tivoli.itbsm.doc%2Ftip%2Fttip_admin_config_morewebsvcs.html
11.2.1 Single sign-on
Single sign-on must be configured in order to use ITM web service for charting as described in Section 4 of this paper. You must also be logged into TIP as an LDAP user with the appropriate roles in the ITM TEPS console.
11.2.2 Adding the portlet to the page
You can edit the existing page, add the chart portlet , and configure the chart source as the ITM web service. Choose agent data from groups pull-down. For example, the figure below shows agent data from the SAP monitoring agent:

Figure 44: SAP agent groups
From there, choose a chart to be shown in real-time. Ultimately you can add the charting portlet containing the IBM workspace along with the rest of the portlets in your dashboard as shown in the figure below:

Figure 45: SAP transaction scorecard page
12 Conclusion
In this paper, you learned how to set up application performance monitoring of your SAP environment by configuring ITCAM agent-less transaction tracking to monitor the end user response time, and recording ITCAM robotic transactions to proactively monitor transaction response time.
You also learned how to set up the ITCAM for Applications - SAP agent and Tivoli monitoring OS agents to provide monitoring data to Tivoli Monitoring, which then forwards the events to OMNIbus.
You also learned how to create business application containers for SAP-discovered components that were pulled in by TBSM to populate a service tree.
Finally, you learned how to build a TBSM dashboard provides visual representation of your SAP business services and impact.

Appendix A: Architecture:
Computer OS Product name and version number
Tivoli Monitoring environment (HUB
monitoring server and portal server)
RedHat 5.2 Tivoli Monitoring 6.2.2 Fix Pack 6
ITCAM for Applications – SAP Agent
RedHat 5.2 mySAP V6.2
ITCAM for Applications – Linux OS Agent
RedHat 5.2 Tivoli Monitoring 6.2.2 Fix Pack 6
ITCAM for Transactions – Response Time and Web
Response Time agent
Windows 2003
Enterprise SP2 ITCAM 7.3
OMNIbus ObjectServerRedHat
5.2 OMNIbus V7.2.1
Tivoli EIF ProbeRedHat
5.2 TBSM 6.1
Tivoli Application Dependency Discovery
ManagerRedHat
5.2 TADDM 7.2.1 FP 1

Tivoli Business Service Manager
RedHat 5.2 TBSM 6.1
Appendix B: Information centers
Products Information center
TBSM data server, TBSM discovery library toolkit, Tivoli EIF Probe, Webtop (TBSM dashboard)
IBM Tivoli Business Service Manager
ITCAM for Applications – SAP Agent IBM Tivoli Composite Application Manager for Applications – SAP Agent
Tivoli Application Dependency Discovery Manager
IBM Tivoli Dependency Discovery Manager
OMNIbus ObjectServer IBM Tivoli Netcool/ OMNIbus InfoCenter
ITCAM for Transactions IBM Tivoli Composite Application Manager for Transactions
Appendix C: Acronyms
Acronym Meaning

DLT Discovery Library Toolkit
ITCAM IBM Tivoli Composite Application Monitoring
EIF Event Integration Facility
TADDM Tivoli Application Dependency Discovery Manager
TBSM Tivoli Business Service Manager
TEPS Tivoli Enterprise Portal Server
TEMS Tivoli Enterprise Management Server
AEL Active Event List
ITM IBM Tivoli Monitoring
LDAP Light-weight Directory Access Protocol
TIP Tivoli Integrated Portal