
Application of Video Image Correlation Techniques … of Video Image Correlation Techniques to the...
18
American Institute of Aeronautics and Astronautics 1 Application of Video Image Correlation Techniques to the Space Shuttle External Tank Foam Materials Mark W. Hilburger * and Michael P. Nemeth † NASA Langley Research Center, Hampton Virginia 23681-2199 Results that illustrate the use of a video-image-correlation-based displacement and strain measurement system to assess the effects of material nonuniformities on the behavior of the sprayed-on foam insulation (SOFI) used for the thermal protection system on the Space Shuttle External Tank are presented. Standard structural verification specimens for the SOFI material with and without cracks and subjected to mechanical or thermal loading conditions were tested. Measured full-field displacements and strains are presented for selected loading conditions to illustrate the behavior of the foam and the viability of the measurement technology. The results indicate that significant strain localization can occur in the foam because of material nonuniformities. In particular, elongated cells in the foam can interact with other geometric or material discontinuities in the foam and develop large- magnitude localized strain concentrations that likely initiate failures. Furthermore, some of the results suggest that continuum mechanics and linear elastic fracture mechanics might not adequately represent the physical behavior of the foam, and failure predictions based on homogeneous linear material models are likely to be inadequate. I. Introduction Maintaining the structural integrity of the sprayed-on foam insulation (SOFI) materials used on the Space Shuttle External Tank (ET) is a key element of maintaining flight safety and mission success until retirement of the Space Shuttle in 2010. To perform this task, a better understanding of the mechanical properties of the SOFI materials and improved structural verification measures are needed. The SOFI materials used on the Space Shuttle ET are closed-cell foams that exhibit a significant amount of nonuniformity in their microstructure. An in-depth description of these materials are presented in Ref. 1 and an example of the nonuniformity in the microstructure is shown in figure 1.This nonuniformity produces localization effects in the material response when subjected to thermal and mechanical loads. These localization effects are similar to random point-wise couples that prevent the development of smoothly varying strain fields that are commonly encountered in metals. In addition, these SOFI materials exhibit a significant amount of irregular anisotropy that is caused by the propensity of these materials to rise in the direction of least resistance during application and the presence of irregular structural features such as a bolted flange. Specifically, the cells elongate in the rise direction, which produces a directional bias in properties such as stiffness, strength, and fracture toughness. For most of the Space Shuttle Program (SSP), the emphasis was on thermal protection and not structural integrity of the SOFI materials. As a result, material properties such as modulus and fracture toughness, have been determined mostly by using relatively low-fidelity, bulk engineering measurements and generally exhibit a substantial amount of scatter in the test data. The nonuniformity of the SOFI microstructure is likely to be a major contributor to this scatter, and is likely to affect the onset and progression of failures in the SOFI materials. Thus, a three-dimensional displacement and strain measurement system that yields high-fidelity, full-field measurements is very useful for providing insight into the fundamental material behavior and for assessing and refining material- property characterization tests. Moreover, this type of measurement system is useful for reconciling the test-data scatter and for providing insight into unexpected and unexplained specimen failures. Structural verification procedures for structures made of well-defined engineering materials (e.g., aluminum) generally rely heavily on validated structural analysis tools to augment structural testing. For example, combined mechanical, thermal, and aerodynamic loads usually exist that cannot be simulated adequately in a laboratory environment and analyses are conducted to help assess and put test results into perspective. For SOFI materials, * Senior Research Engineer, Mechanics of Structures and Materials Branch, Member, AIAA. † Senior Research Engineer, Mechanics of Structures and Materials Branch, Associate Fellow, AIAA. https://ntrs.nasa.gov/search.jsp?R=20060013507 2018-07-13T01:41:17+00:00Z
Transcript of Application of Video Image Correlation Techniques … of Video Image Correlation Techniques to the...

American Institute of Aeronautics and Astronautics
1
Application of Video Image Correlation Techniques to the Space Shuttle External Tank Foam Materials
Mark W. Hilburger* and Michael P. Nemeth† NASA Langley Research Center, Hampton Virginia 23681-2199
Results that illustrate the use of a video-image-correlation-based displacement and strain measurement system to assess the effects of material nonuniformities on the behavior of the sprayed-on foam insulation (SOFI) used for the thermal protection system on the Space Shuttle External Tank are presented. Standard structural verification specimens for the SOFI material with and without cracks and subjected to mechanical or thermal loading conditions were tested. Measured full-field displacements and strains are presented for selected loading conditions to illustrate the behavior of the foam and the viability of the measurement technology. The results indicate that significant strain localization can occur in the foam because of material nonuniformities. In particular, elongated cells in the foam can interact with other geometric or material discontinuities in the foam and develop large-magnitude localized strain concentrations that likely initiate failures. Furthermore, some of the results suggest that continuum mechanics and linear elastic fracture mechanics might not adequately represent the physical behavior of the foam, and failure predictions based on homogeneous linear material models are likely to be inadequate.
I. Introduction Maintaining the structural integrity of the sprayed-on foam insulation (SOFI) materials used on the Space Shuttle External Tank (ET) is a key element of maintaining flight safety and mission success until retirement of the Space Shuttle in 2010. To perform this task, a better understanding of the mechanical properties of the SOFI materials and improved structural verification measures are needed. The SOFI materials used on the Space Shuttle ET are closed-cell foams that exhibit a significant amount of nonuniformity in their microstructure. An in-depth description of these materials are presented in Ref. 1 and an example of the nonuniformity in the microstructure is shown in figure 1.This nonuniformity produces localization effects in the material response when subjected to thermal and mechanical loads. These localization effects are similar to random point-wise couples that prevent the development of smoothly varying strain fields that are commonly encountered in metals. In addition, these SOFI materials exhibit a significant amount of irregular anisotropy that is caused by the propensity of these materials to rise in the direction of least resistance during application and the presence of irregular structural features such as a bolted flange. Specifically, the cells elongate in the rise direction, which produces a directional bias in properties such as stiffness, strength, and fracture toughness. For most of the Space Shuttle Program (SSP), the emphasis was on thermal protection and not structural integrity of the SOFI materials. As a result, material properties such as modulus and fracture toughness, have been determined mostly by using relatively low-fidelity, bulk engineering measurements and generally exhibit a substantial amount of scatter in the test data. The nonuniformity of the SOFI microstructure is likely to be a major contributor to this scatter, and is likely to affect the onset and progression of failures in the SOFI materials. Thus, a three-dimensional displacement and strain measurement system that yields high-fidelity, full-field measurements is very useful for providing insight into the fundamental material behavior and for assessing and refining material-property characterization tests. Moreover, this type of measurement system is useful for reconciling the test-data scatter and for providing insight into unexpected and unexplained specimen failures. Structural verification procedures for structures made of well-defined engineering materials (e.g., aluminum) generally rely heavily on validated structural analysis tools to augment structural testing. For example, combined mechanical, thermal, and aerodynamic loads usually exist that cannot be simulated adequately in a laboratory environment and analyses are conducted to help assess and put test results into perspective. For SOFI materials, * Senior Research Engineer, Mechanics of Structures and Materials Branch, Member, AIAA. † Senior Research Engineer, Mechanics of Structures and Materials Branch, Associate Fellow, AIAA.
https://ntrs.nasa.gov/search.jsp?R=20060013507 2018-07-13T01:41:17+00:00Z
American Institute of Aeronautics and Astronautics
2
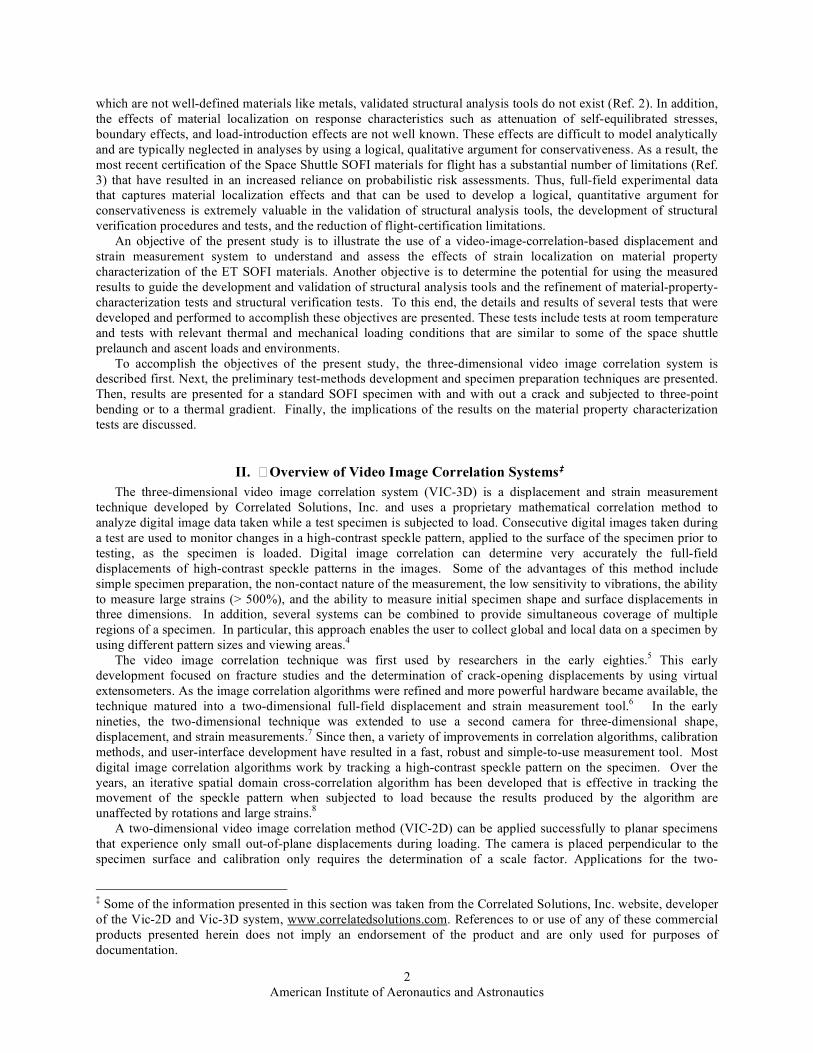
which are not well-defined materials like metals, validated structural analysis tools do not exist (Ref. 2). In addition, the effects of material localization on response characteristics such as attenuation of self-equilibrated stresses, boundary effects, and load-introduction effects are not well known. These effects are difficult to model analytically and are typically neglected in analyses by using a logical, qualitative argument for conservativeness. As a result, the most recent certification of the Space Shuttle SOFI materials for flight has a substantial number of limitations (Ref. 3) that have resulted in an increased reliance on probabilistic risk assessments. Thus, full-field experimental data that captures material localization effects and that can be used to develop a logical, quantitative argument for conservativeness is extremely valuable in the validation of structural analysis tools, the development of structural verification procedures and tests, and the reduction of flight-certification limitations. An objective of the present study is to illustrate the use of a video-image-correlation-based displacement and strain measurement system to understand and assess the effects of strain localization on material property characterization of the ET SOFI materials. Another objective is to determine the potential for using the measured results to guide the development and validation of structural analysis tools and the refinement of material-property-characterization tests and structural verification tests. To this end, the details and results of several tests that were developed and performed to accomplish these objectives are presented. These tests include tests at room temperature and tests with relevant thermal and mechanical loading conditions that are similar to some of the space shuttle prelaunch and ascent loads and environments. To accomplish the objectives of the present study, the three-dimensional video image correlation system is described first. Next, the preliminary test-methods development and specimen preparation techniques are presented. Then, results are presented for a standard SOFI specimen with and with out a crack and subjected to three-point bending or to a thermal gradient. Finally, the implications of the results on the material property characterization tests are discussed.
II. � Overview of Video Image Correlation Systems‡ The three-dimensional video image correlation system (VIC-3D) is a displacement and strain measurement technique developed by Correlated Solutions, Inc. and uses a proprietary mathematical correlation method to analyze digital image data taken while a test specimen is subjected to load. Consecutive digital images taken during a test are used to monitor changes in a high-contrast speckle pattern, applied to the surface of the specimen prior to testing, as the specimen is loaded. Digital image correlation can determine very accurately the full-field displacements of high-contrast speckle patterns in the images. Some of the advantages of this method include simple specimen preparation, the non-contact nature of the measurement, the low sensitivity to vibrations, the ability to measure large strains (> 500%), and the ability to measure initial specimen shape and surface displacements in three dimensions. In addition, several systems can be combined to provide simultaneous coverage of multiple regions of a specimen. In particular, this approach enables the user to collect global and local data on a specimen by using different pattern sizes and viewing areas.4 The video image correlation technique was first used by researchers in the early eighties.5 This early development focused on fracture studies and the determination of crack-opening displacements by using virtual extensometers. As the image correlation algorithms were refined and more powerful hardware became available, the technique matured into a two-dimensional full-field displacement and strain measurement tool.6 In the early nineties, the two-dimensional technique was extended to use a second camera for three-dimensional shape, displacement, and strain measurements.7 Since then, a variety of improvements in correlation algorithms, calibration methods, and user-interface development have resulted in a fast, robust and simple-to-use measurement tool. Most digital image correlation algorithms work by tracking a high-contrast speckle pattern on the specimen. Over the years, an iterative spatial domain cross-correlation algorithm has been developed that is effective in tracking the movement of the speckle pattern when subjected to load because the results produced by the algorithm are unaffected by rotations and large strains.8 A two-dimensional video image correlation method (VIC-2D) can be applied successfully to planar specimens that experience only small out-of-plane displacements during loading. The camera is placed perpendicular to the specimen surface and calibration only requires the determination of a scale factor. Applications for the two-
‡ Some of the information presented in this section was taken from the Correlated Solutions, Inc. website, developer of the Vic-2D and Vic-3D system, www.correlatedsolutions.com. References to or use of any of these commercial products presented herein does not imply an endorsement of the product and are only used for purposes of documentation.

American Institute of Aeronautics and Astronautics
3
dimensional technique include crack-tip opening displacement measurements and “dog-bone” tension tests. The error in the in-plane strain and displacement measurements due to out-of-plane motion of the viewing surface is proportional to the ratio of the out-of-plane displacement to the focal length of the camera (i.e., how far away the camera is from the specimen). Initial specimen geometry and three-dimensional displacements can now be measured by using a two-camera system. A calibration is required to determine camera parameters such as focal length, image center, and lens distortion in addition to the relative orientation of the two cameras in space. A calibration target is placed in the field of view and a sequence of images is acquired for different orientations of the target. The calibration parameters for the system are then calculated by using a special adjustment algorithm.8 A comprehensive discussion of digital image correlation methods and their applications is found in Ref. 9.
III. Test Methods Development Several test setups and approaches were studied to determine how to implement the video image correlation measurement system in order to measure displacements and strains of various SOFI specimens. First, a study was conducted to determine if it is necessary to use the VIC-3D system to minimize strain and displacement measurement errors that could be induced by potentially large-magnitude out-of-plane (normal to the viewing surface) deformations of the specimens. Second, a study was conducted to determine the effects of the speckle pattern applied to the specimen on the specimen response; that is, the study examined if the paint used to make the speckle pattern overly stiffened the SOFI material. Third, a study was conducted to determine the optimal speckle size needed to resolve adequately the displacement and strain gradients associated with stiffness and structural discontinuities. Fourth, a study was conducted to determine the effects of the various data processing parameters on the measured displacement and strain data. The results of the preliminary testing and development studies conducted to address the testing approach are presented subsequently.
A. VIC-2D versus VIC-3D First, a study was conducted to determine whether a VIC-2D (two-dimensional) system or a VIC-3D (three-dimensional) system is required to measure adequately the strains and displacements of selected specimen types. The VIC-2D system is easier to set up and requires less data processing, however, large out-of-plane deformations of a specimen can induce errors in the in-plane displacement and strain measurements that are on the order of the maximum out-of-plane deformation divided by the stand-off distance of the camera. The VIC-3D system accounts for the effects of out-of-plane deformations on the in-plane response, but the VIC-3D system requires the use of two cameras and the processing of twice the amount of data, as compared to the VIC-2D system. In addition, preliminary tests conducted on the SOFI using the VIC-3D system indicates some image convergence difficulties associated with SOFI-surface-texture-induced shadowing that can cause false speckles to appear in one camera image versus another camera image. It was determined from numerous tests that, for the types of specimens considered herein, the measurement error caused by out-of-plane deformations when using the VIC-2D system is typically less than 0.1% (e.g., 1mm/1000mm). Thus, all subsequent tests, and the results presented herein, were obtained by using VIC-2D systems. Because of this simplification, concurrent global and local setups can be easily used without all the additional calibration complexities and additional data manipulation associated with using two cameras images for one data point; that is, the imaging data is half of what was generated when using the VIC-3D system. There is an additional benefit in that correlation studies between the local and the global data can be used for data verification.
B. Effects of the Speckle Pattern on the SOFI Response Another study was conducted to determine if paint used to generate a speckle pattern (see Fig. 2) on the specimens was significantly increasing the stiffness of the SOFI material. Early on in the test-development phase of the present study, the speckle pattern was applied by first spraying several coats of flat white spray paint on a specimen to serve as a light, non-reflective background for the dark speckle pattern. Reflections of light off the surface of any specimen will cause convergence problems so reflections need to be minimized. Then, once the white paint was dry, a random spattering of flat black paint was applied to the specimen using a short-bristle paint brush to flick paint onto the specimen. It was quickly determined that this speckle pattern technique was stiffening the foam by a considerable amount. This problem was first noticed in three fracture-type specimens used to study crack growth in the material. Specifically, the observed response indicated that the paint was retarding the growth of the cracks on the side of the specimen that was painted. In addition, the paint was causing the crack to grow in a zig-zag pattern, as compared to a relatively straight crack path observed on the opposite, unpainted side of the

American Institute of Aeronautics and Astronautics
4
specimen. The evidence suggests that the zig-zag behavior of the crack was occurring when the crack encountered a void in the SOFI that had filled up with paint and produced a locally stiff region in the material. Similar problems were observed in uniaxial-tension specimens that were overly stiff from the excessive paint. Thus, a new speckle pattern preparation technique was developed and verified that required minimal paint application to the specimen. This new technique consisted of lightly spraying the specimen with flat black spray paint only to create the speckle pattern, and using the natural off-white coloration of the foam as the contrasting background. Then, an inert dulling spray was used to eliminate the reflections on the surface of the foam when illuminated. These reflections had to be eliminated because they were causing significant imaging and data reduction problems. Results using this new speckle pattern technique indicated no noticeable effect of the paint on the specimen response. In addition, the chemical contents of the inert dulling spray were not expected to cause any degradation of the SOFI material. The results presented subsequently are for specimens used with the latter speckle-pattern preparation technique.
C. Optimal Speckle Pattern Size General rules of thumb to maximize resolution and to minimize noise in the measured data have been established by Correlated Solutions, Inc. These rules of thumb include the following: each speckle should be approximately three to five pixels in diameter, the speckles should be evenly distributed throughout the specimen, and there should exist a one-to-one ratio between dark and light regions of the speckle pattern. For example, if the spatial resolution of the camera is 325 pixels/inch, then the optimal speckle diameter is between 0.009 inch and 0.015 inch. One aspect of the initial test development activity was to determine what was the best speckle pattern size that could be easily and consistently applied to the specimens while, at the same time, providing the resolution required to resolve the effects of small detail features in the foam such as naturally occurring elongated cells and voids and strain gradients due to stiffness and geometry discontinuities. It was determined that a speckle size of approximately 0.006-inch diameter would be optimal for several reasons. First, this speckle size enabled the use of a global system with a viewing area of approximately 3.0 inches by 4.0 inches and a local system with a viewing area of approximately 1.0 inch by 1.3 inches. These numbers correspond to a 1:3 magnification between global and local views and a corresponding increase in the data resolution. It was also determined that this speckle size was adequate to resolve local displacement and strain gradients near elongated cells (typically 0.03 inch in diameter), voids, stiffness discontinuities between dissimilar materials, and crack tips. The accuracy of the gradient measurements were verified, in many cases, by performing hand calculations to directly obtain strain and displacement data from the digital images. In addition, a digital microscope was incorporated into the VIC-2D system to determine the localized cell deformations at a crack tip in a specimen. A 0.1-in by 0.1-in field of view was considered and corresponded to a magnification 100 times greater than the original local image. The strain and displacement data obtained from the microscope images agreed well with the original local camera measurements. Finally, an optimal speckle size and uniform pattern are easily obtained by using standard spray paint to lightly spray the surface of the specimen.
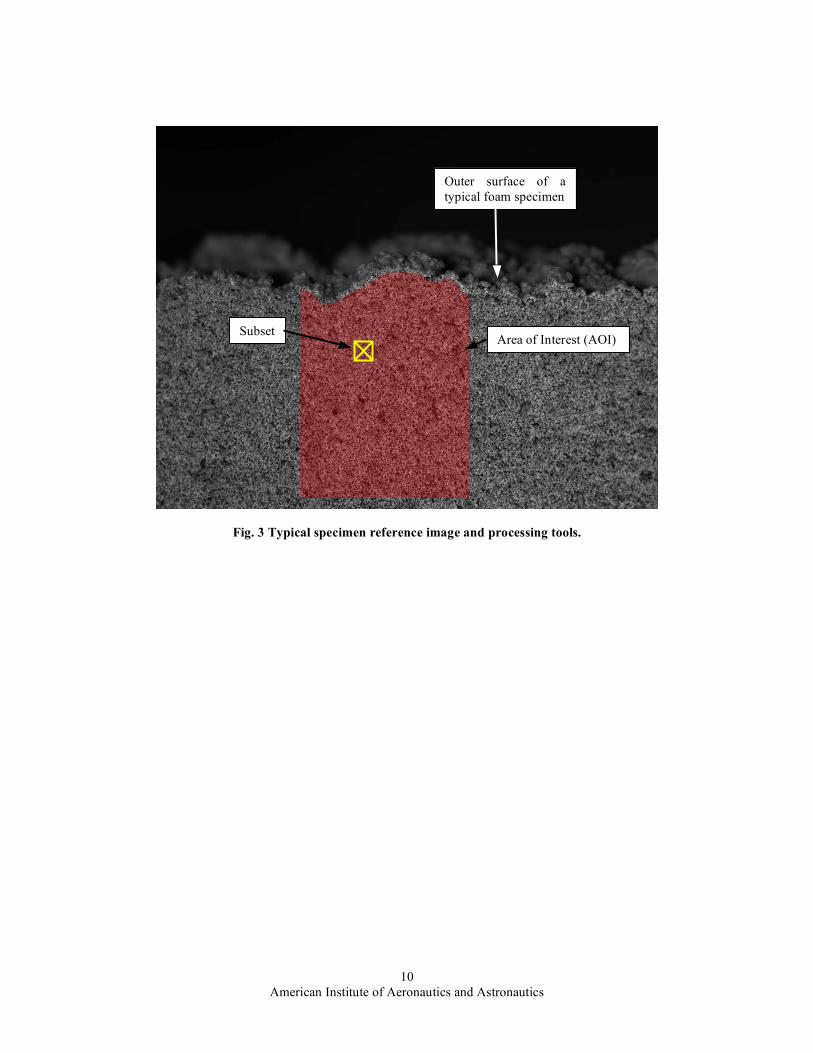
D. Data Processing Procedure and Parameters The VIC-2D system used in the present study is a robust displacement and strain measurement tool and includes many different processing parameters and options to customize the measurement setup and data processing and output. The effects of some of the more commonly used data processing parameters were examined in a comprehensive parametric study. A description of the measurement-system-software operation, and selected processing parameters are presented in this section. A series of images of a test specimen are obtained during the test and are processed to calculate the displacements and strains. The processing of these images is broken up into several steps as follows. First, a reference image, to which all subsequent images are referenced to, is selected. This reference image is typically the first image taken just before the load application begins. However, any image captured during the test can be selected as the reference image. Then, regions of the test specimen are selected for data processing. This area is referred to herein as the area of interest (AOI) and an example is indicated by the red shaded box in figure 3. A single AOI or multiple AOIs can be selected and these AOIs do not have to be contiguous. Next, the pixel subset and step size are chosen for each AOI. This subset is a square set of pixels used to calculate displacement data at the center point of the subset and is indicated by the yellow box in figure 3. The displacements are calculated by tracking the movement of the speckle pattern within the subset from the reference position, defined by the reference image, to the deformed position of the current image of interest. To do so, the deformed speckle pattern within the subset is fit with either a zeroth-order (rigid body), first-order, or second-order shape function. Once the pattern has been fit, a displacement vector is calculated for the center point of the subset. The default size of the subset is 29; that is, a 29 pixel by 29 pixel box, over which a displacement field is fit. It was determined from several studies that

American Institute of Aeronautics and Astronautics
5
subset sizes that range from 17 to 21 were optimal for the speckle pattern considered, and this range of subset size was used for the data reported herein. The subset is moved throughout the entire AOI with a fixed increment or step size to characterize the displacement field. The step size refers to the number pixels the subset is moved within the AOI for each displacement calculation. The default step-size value is five and was useful for situations where the specimen exhibited a uniform or slowly varying displacement and strain response. However, several studies indicated that a step size of three gave better results for situations where the specimen exhibited rapidly varying displacement and strain gradients. A step size of one was also considered, but typically resulted in a significant amount of noise in the data that needed to be filtered out in the postprocessing. Once all the displacement data is generated for each image, the strains are calculated. The strain calculation process is similar to the process used for the displacements in that a square window is chosen that fits a selected number of data points to shape functions associated with the window. The strain distribution is then calculated within the window. Larger window sizes use more data points in the fit and thus more averaging occurs. The default window size is 15 data points. A window size of between 9 and 11 was used for the tests presented herein. Strain data calculated from windows smaller than 9 data points typically exhibit excessive numerical noise.
IV.Results and Discussion Three tests were developed and conducted to illustrate the use of a video-image-correlation-based displacement and strain measurement system to assess the effects of material localization on material property characterization of the ET SOFI. Test methods and typical test results for three “Cryoflex” specimens made of NCFI-24-124 or BX-265 material (see Ref. 1) are presented in this section. First, typical test results for two Cryoflex specimens with and without an outer-surface crack and subjected to three-point bending at room temperature are presented. Then, typical test results for a Cryoflex specimen subjected to a 280o F through-the-thickness temperature gradient are presented. The test setups are described and some of the testing limitations are discussed. The Cryoflex specimen is one of the standard structural verification specimens used by NASA to qualify the ET SOFI materials subjected to combined thermal and mechanical loads. The Cryoflex specimens consist of a 0.125-in-thick aluminum substrate with SOFI material sprayed on, e.g., see figure 2. The specimen is 1.3 inches wide. The SOFI thickness ranges from approximately 1.5 inches to 4.0 inches thick and is applied to the substrate in multiple passes. Each foam application pass typically results in the deposition of approximately 0.2 to 0.3 inches of foam and these layers are demarcated by a thin region of dense foam, commonly referred to as a knitline. The knitlines and top surface of the specimens have a naturally occurring undulating geometry that is associated with the nonuniform rising of the foam material during application. For the 1.5-in-thick specimens, this nonuniform region at the top of the specimen is machined off.
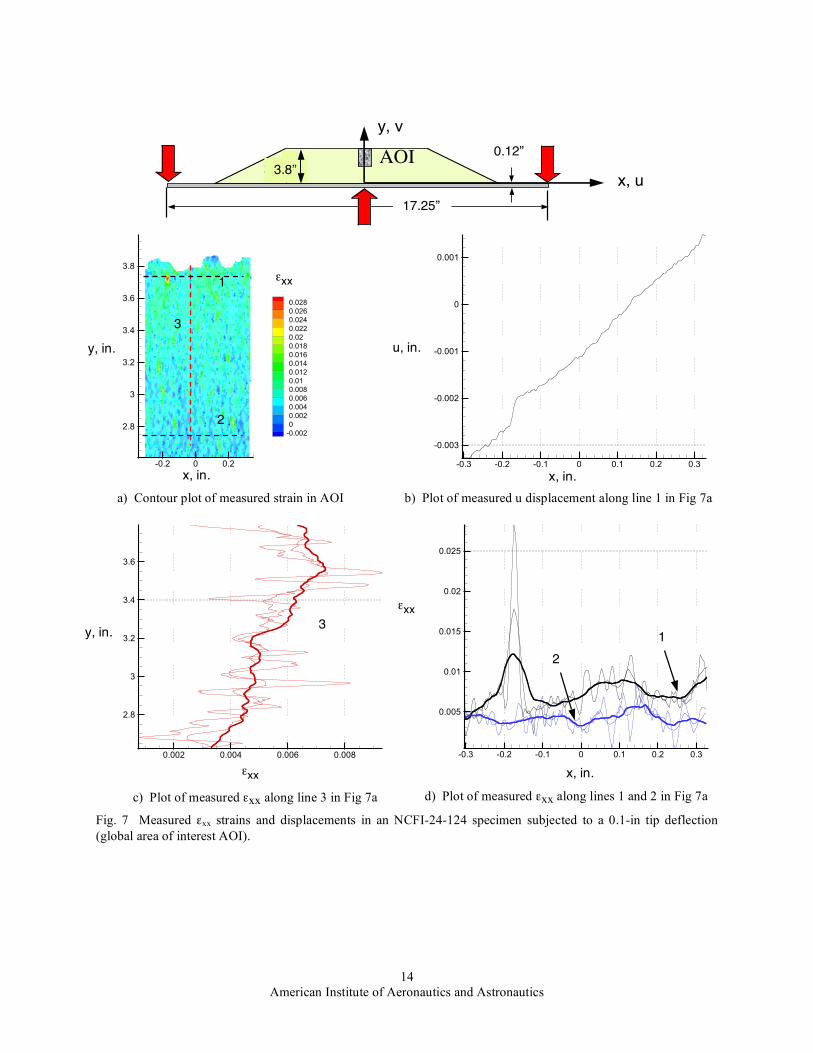
A. Bending of a Cryoflex Specimen Without a Crack A three-point-bending test was developed to apply a mechanical load to a 3.8-in-thick Cryoflex specimen at room temperature. The test setup consisted of a 15-in-radius mandrel, placed in a 120-kip uniaxial test stand, that served as the centrally located loading point on the specimen. Two cylindrical tups where attached to the upper loading platen of the load frame and applied the bending load to the specimen. This test setup is shown in figures 4 and 5. The specimens were loaded in three-point bending with a maximum center deflection of 0.1 inch and were loaded at a rate of 0.03 inch/minute. The video image correlation system was set up in the two-dimensional mode (VIC-2D) to record a global and local view of the specimens and the reference images are shown in figures 6a and 6b, respectively. The global image is approximately 3 inches tall by 4 inches wide and the local image is 1 inch tall by 1.33 inches wide. Typical measured longitudinal strain εxx contours at maximum load obtained using the global AOI are presented in figure 7a. The contours are plotted in a consistent x and y coordinate system (Fig. 7) with the origin at the mid-length of the specimen and the interface between the foam and the substrate. The global AOI covers a 0.6-in-wide by 1.2-in-tall region of the specimen located at the top of the specimen and centered at its mid-length, as shown in figure 7. In addition, displacement and strain results from three traces across the specimen AOI are presented in figures 7b-7d. The traces from which the data was taken are identified in figure 7a and are labeled 1, 2, and 3. The results from the strain contours in figure 7a indicate wide-spread rapidly-oscillating strain variations, as expected, because of the cellular structure of the SOFI. The maximum longitudinal strains εxx near the top surface of the specimen are approximately 7500 µε, with variations of +/- 3000 µε. The local short-wave-length variations can be directly correlated to the local structural detail features of the foam; that is, many of the ellipse-like strain contours correspond to large elongated cells or voids. A very noticeable example of these local variations appears in the upper left corner of the εxx contour plot where a strain concentration, with a magnitude of approximately 2.8%

American Institute of Aeronautics and Astronautics
6
strain, is clearly visible (see figure 7a). This concentration is attributed to large magnitude local deformations of a very large elongated cell on the specimen surface. Figure 6b shows a local view of the actual test specimen, and several ellipse-shaped cells are outlined in red. These elongated cells or voids are typically 1/32 to 3/64 of an inch in length and are distributed randomly throughout the specimens. The local deformations of the cell in the top left part of Fig. 7a are clearly identified in a plot of the longitudinal u displacements extracted from line 1 that are shown in figure 7b. Specifically, there is a significant discontinuity in the u displacements at this cell. Similarly, a plot of the εxx strains along line 1 are shown in figure 7d by a series of three black solid lines and clearly indicate the local strain concentration as well as other smaller-magnitude, rapidly oscillating strain variations across the region. The series of black lines are all data extracted from line 1 but are processed in several ways to help illustrate the overall strain behavior. The smoother data (denoted by a thick line in all the plots) illustrates better the long-wave-length overall strain variation due to the surface undulations associated with the uneven rind of the material. This data was obtained by using a step size of three to calculate the displacement field and a window size of 15 to calculate the strain contours. Increasingly refined data, indicated by the two thin lines, (short-wave-length strain response) illustrates the influence of the smaller-scale microstructure effects on the strain response. The increased data refinement was achieved by using smaller window sizes of 11 and 9 (marked in the figure) to calculate the strain data. Specifically, less data smoothing occurs as the window size is reduced. Similar data was extracted from line 2 (blue solid lines) and indicates that the outer-surface-induced variations (specifically, the long-wave-length response indicated by the thick blue line) in the strains from line 1 are somewhat reduced, indicating attenuation of the localized response in the foam near the top surface rind. However, long-wave-length average strain variations still exist throughout the specimen that are attributed to the internal undulating knitlines in the foam. Similarly, data extracted from line 3 in Fig 7a is shown in Fig. 7c and indicates a rapidly oscillating short-wave-length strain variation through the thickness of the specimen as well as a gradual increase in the overall average strain towards the outer surface of the specimen (increasing from y of 2.6 in. to 3.8 in.) as expected for this three-point-bending loading condition. It is important to note that engineering beam theory predicts a linear strain variation for a homogeneous linear material. To assess the accuracy of the results obtained by using the global AOI, results were obtained using a local AOI near line 1 in Fig. 7a. These results are shown in figure 8. This data has approximately four times the resolution of the corresponding data obtained using the global AOI presented in figure 7. For the most part, the local data shows the same trends as the global data. However, the magnitudes of the local strain variations are typically much larger due to the increased resolution, which provide more accurate measurements of the material behavior. In particular, these results indicate that the local strain concentration at the ellipse-like void near the outer surface previously described is approaching 10% strain in contrast to the 3% strain measurement obtained from the global AOI shown in figure 7. It is conceivable that such voids could interact with outer-surface-geometry-induced strain concentrations in such a way as to cause a crack to develop if the strains reach some critical value before the specimen fails in some other manner (like at the tapered edge).
B. Bending of a Cryoflex Specimen with a Crack Results that illustrate the behavior of a 1.6-in-tall Cryoflex specimen with an outer-surface crack and subjected to three-point bending are presented in this section. This particular cryoflex specimen had the outer surface rind machined off and had a relatively smooth surface quality. The crack was approximately 0.1 inch long and was oriented perpendicular to the outer surface of the specimen. Measured local longitudinal strains εxx are presented in figure 9a. Data extracted for the three lines shown in Fig 9a are presented in Figs. 9b-9d. One set of data is shown in this figure to illustrate the strain response near the crack tip in which the rapidly oscillating micro-structure-induced strain variations, similar to those shown in Fig. 8, are smoothed out. The local AOI measured in this test is approximately 0.008 inch from the crack tip and covers a 0.5 in. by 0.6 in. rectangular region. The region was offset from the tip of the crack because of limitations in the processing capabilities of the software. Specifically, the data processing algorithm uses a section of the digital image, in this case a 20 pixels by 20 pixels square subset, to calculate a best-fit displacement at the center of the subset. If the subset overlaps a region of the specimen with an anomaly such as a crack, it can give erroneous local displacement results. These errors are not quantifiable at this time so it was decided that it is best to neglect any data that might be affected by the crack. Thus, a 0.008-inch stand-off distance which corresponds to a distance approximately equal to one subset size was used and will insure that data will not be extracted from regions of the image that contain the crack. The contour results in figure 9a indicate a significant strain concentration near the tip of the crack, as expected, and a relatively small process zone indicated by the rapid attenuation of the strains shown in figures 9c and 9d. The magnitude of the strain concentration (0.008 inch from the tip) is monotonically increasing as a function of time and is illustrated in figure 9b, and appears to have three distinct phases of the response. A possible explanation to the

American Institute of Aeronautics and Astronautics
7
observed response characteristics is as follows: In the first phase, the cells near the crack tip are elastically deforming (elastic phase) in which time the crack is steadily opening with a “sharp” crack tip. In phase two, a significant increase in the strains near the crack tip occurs at around 25% strain that continues to increase up until approximately 75% strain (material yielding phase). It is in this time that the crack tip becomes very blunt and large-magnitude local deformations are visible to the naked eye. When strains near the crack tip reach approximately 75%, 1390 seconds into the test, the crack begins to propagate (failure). The results in figure 9 also indicate that the through-the-thickness strain εyy and the shear strain εxy near the crack tip drastically change their character at the same time as the crack propagates past the measurement point. These results were observed in all of the crack propagation tests. For the most part, the specimens exhibited unstable, catastrophic crack growth (i.e., crack growth to the substrate). However, one specimen exhibited some small amount of initial stable crack growth followed by unstable catastrophic crack growth. It might be possible that the crack-growth stability was affected by the crack tip being close to a knitline, however, more tests need to be conducted to verify this result. It is likely that a significant amount of the large-magnitude strains observed near the crack tips and near some of the voids are associated with large-magnitude local cell deformations, as opposed to actual constituent straining. In addition, it should be noted that these very large-magnitude localized strain concentrations are very sensitive to data processing parameters and the actual values need additional verification. Cryoflex Specimen with Thermal Gradient A series of seven tests were conducted on a 1.6-in-thick Cryoflex specimen made of BX-265 material to develop and verify a method for testing a specimen subjected to substrate cooling and outer surface heating. Thermocouples were used to measure the temperature at the substrate and at selected locations in the SOFI material. A cryostat was constructed and placed inside an environmental chamber and used to cool the substrate of the specimen as shown in Fig. 10. The environmental chamber was used to help control humidity levels and to enable outer-surface heating of the specimen. The specimen was attached to the cryostat in such a way that it was free to expand and contract in the plane of the substrate, see schematic in Fig. 11. The tests were able to sustain - 190o F at the substrate and +90o F at the outer surfaces of the specimen. Image data was taken throughout the entire temperature cycle with condensation and frost problems only occurring on the substrate at very low temperatures (less than -100o F). The condensation and frost did not interfere with data collected on the SOFI. Photographs of the test setup are shown in figure 10. The AOI considered in the test consisted of the 2.5-in-long area near the mid-length of the specimen as illustrated at the top of Fig 11. A contour plot of the measured transverse strains εyy obtained from the AOI are shown in Fig. 11a and data extracted from selected lines within the AOI are presented in Figs. 11c and 11d. In addition, strain versus time history at two points in the AOI are presented in Fig. 11b. Point A is near the aluminum substrate and point B is near the top outer surface of the specimen, as indicated by the X symbols in Fig. 11a. The initial thermal loading of the specimen consisted of a dry nitrogen purge of the environmental chamber to help remove some of the humidity in the air and a heating of the oven to approximately +120o F for 460 seconds. During this time the specimen exhibited slight expansion, as expected, and is indicated by the longitudinal and transverse tension strains at points A and B shown in Fig 11b. After 460 second had elapsed, the cryostat was filled with liquid nitrogen and cooled the aluminum substrate to - 190o F. As a result, the chamber also cooled slightly to a steady state temperature of +90o F because the chamber heating element was not able to sustain the +100o F as desired. The cooling caused as rapid contraction of the specimen, as indicated in Fig 11b, until a steady-state thermal equilibrium was achieved at 900 seconds into the test. In particular, the contraction of the substrate imparted a longitudinal compression strain of almost 1% to the foam near point A while the strains near the point B were approximately 0.33%. The transverse strains εyy (strains normal to the substrate) ranged from -3% at the substrate to - 0.2% at the outer surface at maximum substrate cooling, as shown in the contours in Fig 11a. The corresponding longitudinal strains were, for the most part, uniformly distributed across the specimen width (uniform contraction with no bending) and equal to - 0.3% to - 0.4% strain. In addition, strain localization occurred in the specimen with variations in the strains on the order of +/- 10%. Results in Fig 11c indicate a similar strain distribution as shown in Fig. 7 for the Cryoflex specimen subjected to room temperature three-point-bending loads. In particular, there are overall long-wave-length variations associated with the undulating knitlines in the foam and short-wave-length variations associated with the foam microstructure. In addition, the results indicate a slight reduction in strain from x equals -1.0 to 1.5 and is likely due to cryogen pooling in the bottom of the cryostat, thus causing more contraction in the lower portions of the specimen. The effects of knitlines were also apparent in the distribution of the measured transverse strains. In particular, the regions at the knitlines tended to exhibit slightly lower strains relative to other strains away from the knit lines; that is, the knit lines appear to locally stiffen the material, as illustrated in figure 11d.
American Institute of Aeronautics and Astronautics
8
V. � Concluding Remarks Results that illustrate the use of a video-image-correlation-based displacement and strain measurement system to assess the effects of material nonuniformities on the behavior of the sprayed-on foam insulation (SOFI) used for the thermal protection system on the Space Shuttle External Tank have been presented. Standard structural verification specimens for the SOFI material with and without cracks and subjected to mechanical or thermal loading conditions were tested. The results indicate that significant strain localization and premature failures can occur in the foam due to material nonuniformities. In particular, elongated cells in the foam can interact with other geometric or material discontinuities in the foam and develop large-magnitude localized strain concentrations. Furthermore, some of the results suggest that continuum mechanics and linear elastic fracture mechanics might not adequately represent the physical behavior of the foam and, as a result, may not be suitable for predicting SOFI failures. The preliminary results presented in this paper are potentially far-reaching, both in the short-term and the long-term. In the short-term, high-fidelity displacement and strain measurements obtained by using a video image correlation system can provide new insight into the response of the SOFI when subjected to mechanical and thermal loads. In particular, much insight can be gained into the effects of localization and microstructure-induced anisotropy on the response of the foam. Such insight can be extremely valuable in developing a logical, quantitative argument for conservativeness of analysis and testing and in refining verification test methods. In the long-term, data from these types of test could be used for analysis tool development and validation activities. Specifically, nonlinear, fully anisotropic material models and models that include the effects of material nonuniformities could be developed and validated. In addition, the measurement technique can be used to determine the amount of material induced strain variability within the various specimens and quantify how the variability affects the material properties, and to assess the current practice of using linear elastic facture mechanics for crack propagation predictions.
VI. � References 1. Weiser, E. S., Nemeth, M. P., and St. Clair, T. L., “Assessment of Technologies for the Space Shuttle
External Tank Thermal Protection System and Recommendations for Technology Improvement, Part 1: Materials Characterization and Analysis,” NASA/TM-2004-213238, July 2004.
2. Knight, N. F., Nemeth, M. P., and Hilburger, M. W., “Assessment of Technologies for the Space Shuttle External Tank Thermal Protection System and Recommendations for Technology Improvement, Part 2: Structural Analysis technologies and Modeling Practices,” NASA/TM-2004-213256, August 2004.
3. Space Shuttle-Verification Limitations for the External Tank Thermal Protection System, Johnson Space Center: NSTS 60555, June 6, 2005.
4. McGowan, D. M., Ambur, D. R., Hanna, T. G., and, McNeil, S. R., “Evaluating the Compressive Response of Notched Composite Panels using Full-field Displacement,” Journal of Aircraft, Vol. 38, No. 1, pp. 122-129, 2001.
5. Peters, W. H., Ranson, W. F., “Digital imaging techniques in experimental stress analysis,” Opt. Eng. 21(3), pp 427-431, 1982.
6. Sutton, M. A., Cheng, M., Peters, W. H, Chao, Y. J., McNeill, S. R., “Application of an optimized digital image correlation method to planar deformation analysis,” Image and Vision Computing, 4(3), pp. 143-151, 1986.
7. Helm, J., McNeill, S. R., Sutton, M. A., “Improved 3-D Image Correlation for Surface Displacement Measurement,” Opt. Eng. 35(7), pp. 1911-1920, 1996.
8. Triggs, B., McLauchlan, P. F., Hartley, R. I., and Fitzgibbon, A.. “Bundle adjustment – a modern synthesis,” Vision Algorithms: Theory & Practice, Springer-Verlag, pp 56- 62, 2000.
9. Rastogi, Ed, “Advances in 2D and 3D Computer Vision for Shape and Deformation Measurements,” Topics in Applied Physics: Photomechanics, Springer Verlag, pp. 323-372, 2000.

American Institute of Aeronautics and Astronautics
9
Fig. 1 Image of typical SOFI microstructure.
Fig. 2 Cryoflex specimen with a global-local speckle pattern applied to the viewing surface.
American Institute of Aeronautics and Astronautics
10
Fig. 3 Typical specimen reference image and processing tools.
Outer surface of a typical foam specimen
Area of Interest (AOI) Subset

American Institute of Aeronautics and Astronautics
11
Fig. 4 Three-point-bending test setup.

American Institute of Aeronautics and Astronautics
12
Fig. 5 Three-point-bending test setup, including cameras and data system (cameras shown in a 3D configuration).
Camera system Specimen and loading fixture
Data acquisition system

American Institute of Aeronautics and Astronautics
13
Fig. 6a Global reference image (1300x1000 pixels)
Fig. 6b Local reference image (1300x1000 pixels) with typical large voids outlined in red (1/32 to 3/64 inch long)
Top surface
Top surface
Elongated cells
American Institute of Aeronautics and Astronautics
14
3.6”
0.12”
17.25”
x, u
y, v
AOI
-0.2 0 0.2
2.8
3
3.2
3.4
3.6
3.8
0.028
0.026
0.024
0.022
0.02
0.018
0.016
0.014
0.012
0.01
0.008
0.006
0.004
0.002
0
-0.002
-0.3 -0.2 -0.1 0 0.1 0.2 0.3
-0.003
-0.002
-0.001
0
0.001
0.002 0.004 0.006 0.008
2.8
3
3.2
3.4
3.6
-0.3 -0.2 -0.1 0 0.1 0.2 0.3
0.005
0.01
0.015
0.02
0.025
Fig. 7 Measured εxx strains and displacements in an NCFI-24-124 specimen subjected to a 0.1-in tip deflection (global area of interest AOI).
1
2
3
a) Contour plot of measured strain in AOI b) Plot of measured u displacement along line 1 in Fig 7a
c) Plot of measured εxx along line 3 in Fig 7a d) Plot of measured εxx along lines 1 and 2 in Fig 7a
1 2
3
y, in.
x, in. x, in.
u, in.
y, in.
x, in.
εxx
εxx
εxx
3.8” 0.12”
17.25”

American Institute of Aeronautics and Astronautics
15
3.6”
0.12”
17.25”
x, u
y, v
AOI
-0.2 -0.1 0 0.1 0.2 0.3
0
0.01
0.02
0.03
0.04
0.05
0.06
0.07
0.08
0.09
0 0.005 0.01 0.015
3.6
3.65
3.7
3.75
-0.2 -0.1 0 0.1 0.2 0.3
-0.003
-0.002
-0.001
0
-0.2 -0.1 0 0.1 0.2 0.3
3.6
3.65
3.7
3.75
3.8
3.85
3.9
0.1
0.09
0.08
0.07
0.06
0.05
0.04
0.03
0.02
0.01
0
Fig. 8 Measured εxx strains and displacements in an NCFI-24-124 specimen subjected to a 0.1-in tip deflection (local AOI).
1 2
a) Contour plot of measured strain b) Plot of measured u displacement along line 1 in Fig 8a
c) Plot of measured εxx along line 2 in Fig 8a d) Plot of measured εxx along line 1 in Fig 8a
y, in.
x, in.
x, in.
u, in.
y, in.
x, in.
εxx
εxx
εxx
3.8” 0.12”
17.25”

American Institute of Aeronautics and Astronautics
16
3.6”
0.12”
17.25”
x, u
y, v
AOI
650 700 750
900
950
1000
0.28
0.26
0.24
0.22
0.2
0.18
0.16
0.14
0.12
0.1
0.08
0.06
0.04
0.02
0 200 400 600 800 1000 1200 1400
0
0.5
1
920 940 960 980 10000
0.05
0.1
0.15
0.2
650 700 750
0.05
0.1
0.15
0.2
0.25
Fig. 9 Measured εxx strains in an BX-265 specimen subjected to a 0.1-in tip deflection (global view).
1.8”
a) Contour plot of measured strain at time = 1145 seconds
b) Plot of measured strain at 0.008 inches from crack tip (marked with an x in Fig 9a)
c) Plot of measured εxx along line 3 in Fig 9a at time = 1145 seconds
d) Plot of measured εxx along lines 1 and 2 in Fig 9a at time = 1145 seconds.
1
2
3
crack
1
2
3
x
εxx
εxy
εyy
y, pixel
x, pixel Time, seconds
y, pixel x, in.
εxx εxx
εxx
strain, in./in.
1.6” 0.12”
17.25”

American Institute of Aeronautics and Astronautics
17
Fig. 10 Preliminary test setup for testing of a cryoflex specimen subjected to substrate cooling and outer surface heating in an environmental.
Cryoflex specimen
Cryostat
Thermocouple wires

American Institute of Aeronautics and Astronautics
18
0 0.5 1 1.5
0
0.5
1
1.5
2
2.5
-0.002
-0.004
-0.006
-0.008
-0.01
-0.012
-0.014
-0.016
-0.018
-0.02
-0.022
-0.024
-0.026
-0.028
0 200 400 600 800
-0.008
-0.006
-0.004
-0.002
0
0.002
-0.014 -0.012 -0.01 -0.008 -0.006 -0.004 -0.002 0
0.5
1
1.5
2
2.5
0 0.5 1 1.5
-0.015
-0.01
-0.005
0
Fig. 11 Measured εyy strains in an BX-265 specimen subjected to thermal loading (global AOI)
a) Contour plot of measured εyy strain at time = 900 seconds
b) Measured strain history at points A and B in Fig. 11a.
c) Plot of measured εyy along lines 2 and 3 in Fig 11a d) Plot of measured εyy along line 1 in Fig 11a (approximate location of knit lines are marked with dashed vertical lines)
1
2 3
I. A II. � B X
X
εxx at point A
εyy at point A
εxx at point B
εyy at point B
-190oF +90oF
1
2 3
x, in.
y, in. time, seconds
y, in.
εyy
εyy
εyy
X A B
0
-.5
1
.5
1.5
0
-.5
1
.5
1.5
x, in.
-1
x, u
y, v
initial heating phase
cooling phase
strain, in/in
AOI

![Video coding [??]. Video coding Types of redundancies: – Spatial: Correlation between neighboring pixel values – Spectral: Correlation between different.](https://static.fdocuments.in/doc/165x107/56649e635503460f94b5fcc5/video-coding-video-coding-types-of-redundancies-spatial-correlation.jpg)


![Video Shooting Techniques [digitalmedia]](https://static.fdocuments.in/doc/165x107/5464739aaf7959f2058b67bd/video-shooting-techniques-digitalmedia.jpg)


