Statistical Control Techniques: Partial and Semipartial Correlation · 2017-06-11 · Chapter 7...
37
® Chapter 7 Slide 1 of 37 Statistical Control Techniques: Partial and Semipartial Correlation Chapter 7
Transcript of Statistical Control Techniques: Partial and Semipartial Correlation · 2017-06-11 · Chapter 7...

®
Chapter 7 Slide 1 of 37
Statistical Control Techniques:Partial and Semipartial Correlation
Chapter 7
Overview● Today’s Lecture
Statistical Control
Partial Correlation
MeasurementErrors
SemipartialCorrelation
Multiple PartialCorrelation
Wrapping Up
®
Chapter 7 Slide 2 of 37
Today’s Lecture
● Statistical control techniques.
● Partial correlation.
● Semipartial correlation.
Overview
Statistical Control● Visualizing
Control● Example Data Set
Partial Correlation
MeasurementErrors
SemipartialCorrelation
Multiple PartialCorrelation
Wrapping Up
®
Chapter 7 Slide 3 of 37
Statistical Control
● Statistical control can be equated to controlling for variability.
● In experimental research (with human subjects), this is oftenaccomplished by random assignment to a set ofexperimenter controlled conditions.
● In quasi-experimental research random assignment cannotbe accomplished, although experimental conditions mayexist.
● In nonexperimental or observational research, the“experimenter” does not control anything...but can observemany things.
● To obtain control when none is present, statistics can beuseful.

Overview
Statistical Control● Visualizing
Control● Example Data Set
Partial Correlation
MeasurementErrors
SemipartialCorrelation
Multiple PartialCorrelation
Wrapping Up
®
Chapter 7 Slide 4 of 37
Venn Diagrams
One way to visualize the concepts described in this lecture isto imagine the variability of a variable as being represented bya circle.
Y X1 X2

Overview
Statistical Control● Visualizing
Control● Example Data Set
Partial Correlation
MeasurementErrors
SemipartialCorrelation
Multiple PartialCorrelation
Wrapping Up
®
Chapter 7 Slide 5 of 37
Venn Diagrams
Using X1 to predict Y :
Y X1

Overview
Statistical Control● Visualizing
Control● Example Data Set
Partial Correlation
MeasurementErrors
SemipartialCorrelation
Multiple PartialCorrelation
Wrapping Up
®
Chapter 7 Slide 6 of 37
Venn Diagrams
Using X1 and X2 to predict Y :
Y X1
X2
Overview
Statistical Control● Visualizing
Control● Example Data Set
Partial Correlation
MeasurementErrors
SemipartialCorrelation
Multiple PartialCorrelation
Wrapping Up
®
Chapter 7 Slide 7 of 37
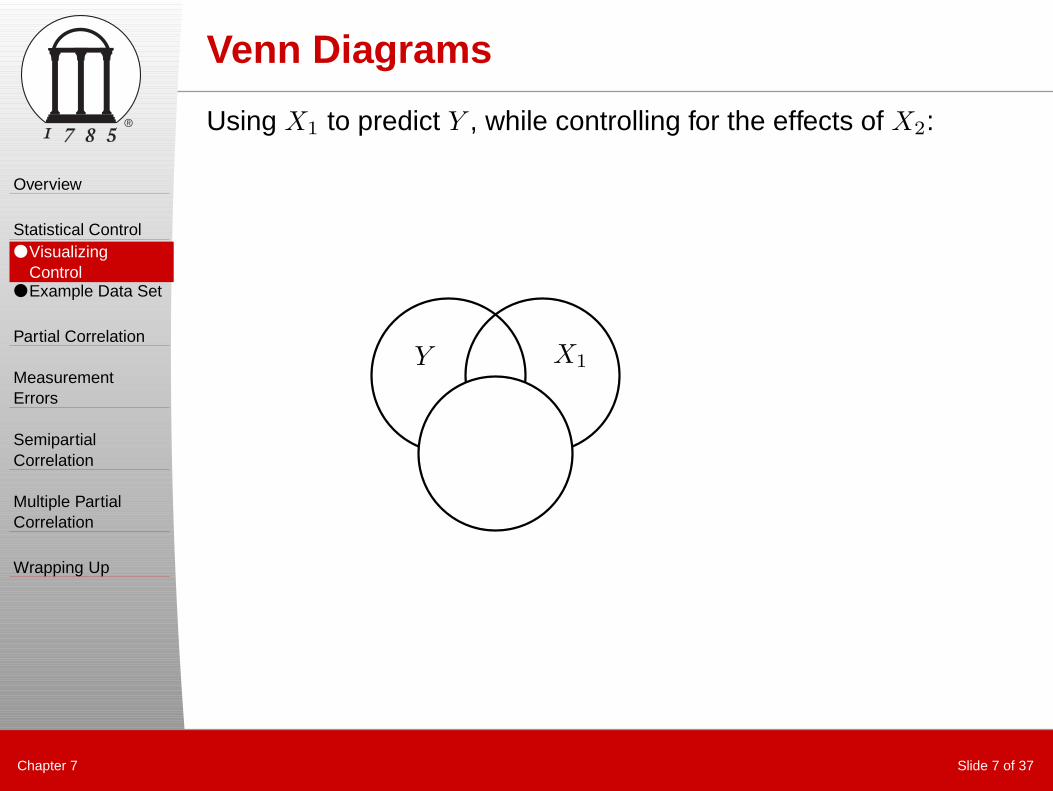
Venn Diagrams
Using X1 to predict Y , while controlling for the effects of X2:
Y X1

Overview
Statistical Control● Visualizing
Control● Example Data Set
Partial Correlation
MeasurementErrors
SemipartialCorrelation
Multiple PartialCorrelation
Wrapping Up
®
Chapter 7 Slide 8 of 37
Today’s Example Data Set
From Weisberg (1985, p. 240).
“Property taxes on a house are supposedly dependent on thecurrent market value of the house. Since houses actually sellonly rarely, the sale price of each house must be estimatedevery year when property taxes are set. Regression methodsare sometimes used to make up a prediction function.”

Overview
Statistical Control● Visualizing
Control● Example Data Set
Partial Correlation
MeasurementErrors
SemipartialCorrelation
Multiple PartialCorrelation
Wrapping Up
®
Chapter 7 Slide 9 of 37
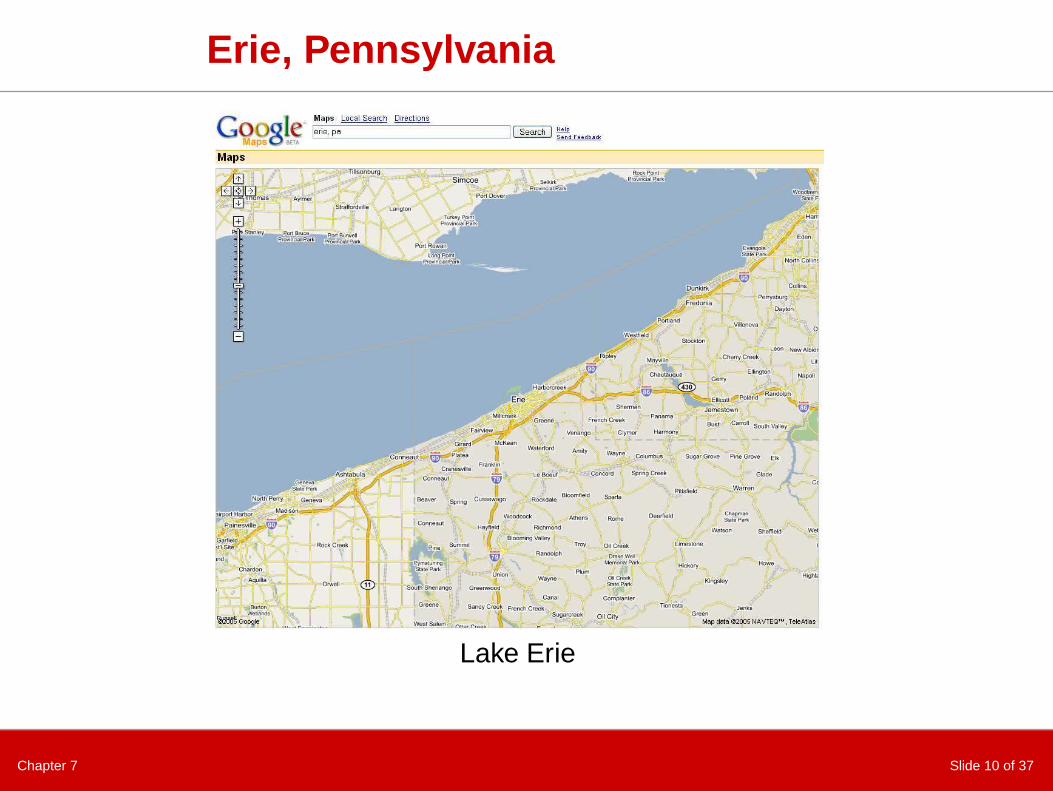
Erie, Pennsylvania
We have data for 27 houses sold in the mid 1970’s in Erie,Pennsylvania:
● X1: Current taxes (local, school, and county) ÷ 100 (dollars).● X2: Number of bathrooms.● X3: Lot size ÷ 1000 (square feet).● X4: Living space ÷ 1000 (square feet).● X5: Number of garage spaces.● X6: Number of rooms.● X7: Number of bedrooms.● X8: Age of house (years).● X9: Number of fireplaces.● Y : Actual sale price ÷ 1000 (dollars).
Chapter 7 Slide 10 of 37
Erie, Pennsylvania
Lake Erie

Chapter 7 Slide 11 of 37
Erie, Pennsylvania
Jack

Chapter 7 Slide 12 of 37
Erie, Pennsylvania
Paula
Overview
Statistical Control● Visualizing
Control● Example Data Set
Partial Correlation
MeasurementErrors
SemipartialCorrelation
Multiple PartialCorrelation
Wrapping Up
®
Chapter 7 Slide 13 of 37
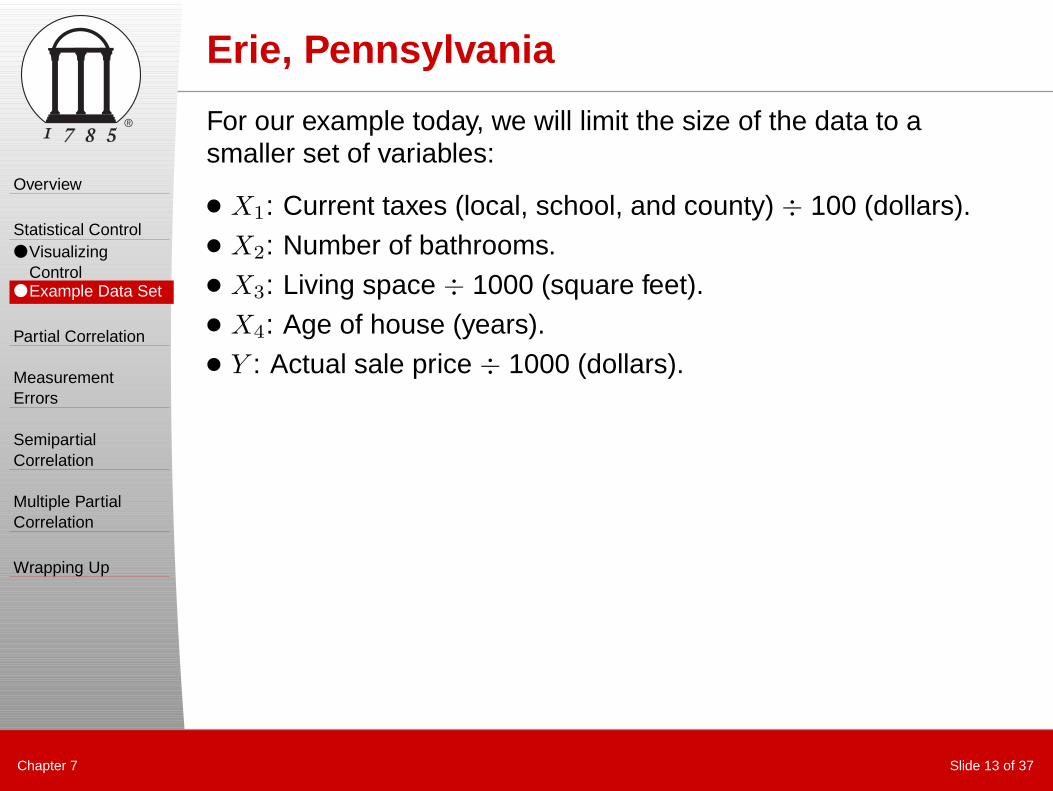
Erie, Pennsylvania
For our example today, we will limit the size of the data to asmaller set of variables:
● X1: Current taxes (local, school, and county) ÷ 100 (dollars).● X2: Number of bathrooms.● X3: Living space ÷ 1000 (square feet).● X4: Age of house (years).● Y : Actual sale price ÷ 1000 (dollars).
Overview
Statistical Control● Visualizing
Control● Example Data Set
Partial Correlation
MeasurementErrors
SemipartialCorrelation
Multiple PartialCorrelation
Wrapping Up
®
Chapter 7 Slide 14 of 37
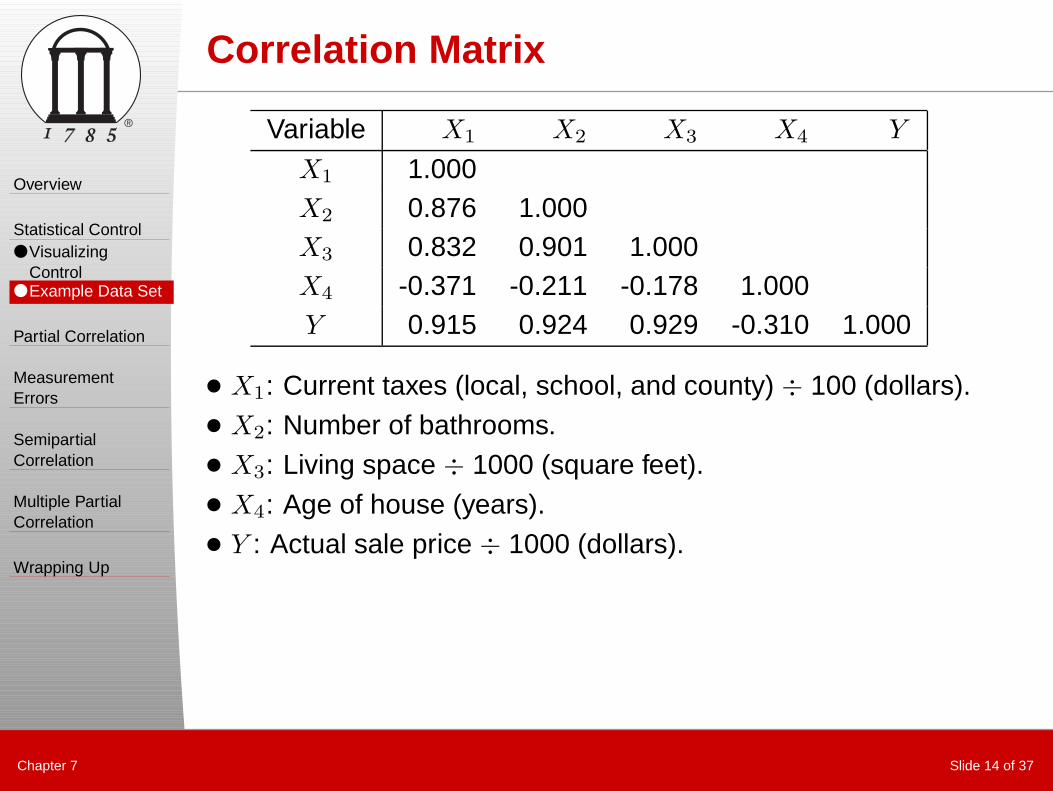
Correlation Matrix
Variable X1 X2 X3 X4 Y
X1 1.000X2 0.876 1.000X3 0.832 0.901 1.000X4 -0.371 -0.211 -0.178 1.000Y 0.915 0.924 0.929 -0.310 1.000
● X1: Current taxes (local, school, and county) ÷ 100 (dollars).● X2: Number of bathrooms.● X3: Living space ÷ 1000 (square feet).● X4: Age of house (years).● Y : Actual sale price ÷ 1000 (dollars).

Overview
Statistical Control
Partial Correlation● Partial Correlation● Higher-Order
Partial Correlation● Partial Correlation
From Regression● Higher Orders
from Regression● More SPSS
MeasurementErrors
SemipartialCorrelation
Multiple PartialCorrelation
Wrapping Up
®
Chapter 7 Slide 15 of 37
Partial Correlation
A partial correlation is a correlation between two variables fromwhich the linear relations, or effects, of another variable(s)have been removed.
r12.3 =r12 − r13r23
√
1 − r213
√
1 − r223
1 2
3

Overview
Statistical Control
Partial Correlation● Partial Correlation● Higher-Order
Partial Correlation● Partial Correlation
From Regression● Higher Orders
from Regression● More SPSS
MeasurementErrors
SemipartialCorrelation
Multiple PartialCorrelation
Wrapping Up
®
Chapter 7 Slide 16 of 37
Partial Correlation in SPSS
● To perform a partial correlation in SPSS go toAnalyze...Correlation...Partial.
● In the Variables box, put the variables you would like to getpartial correlations for.
● In the Controlling For box, put the variables you would like tocontrol for.
Partial correlation of Y (1) (actual sale price ÷ $1000) withX3(2) (living space), controlling for X1(3) (current taxes):
ryx3.x1=
ryx3− ryx1
rx3x1√
1 − r2yx1
√
1 − r2x3x1
=
0.929 − (0.915 × 0.832)√
1 − 0.9152√
1 − 0.8322= 0.748
Overview
Statistical Control
Partial Correlation● Partial Correlation● Higher-Order
Partial Correlation● Partial Correlation
From Regression● Higher Orders
from Regression● More SPSS
MeasurementErrors
SemipartialCorrelation
Multiple PartialCorrelation
Wrapping Up
®
Chapter 7 Slide 17 of 37
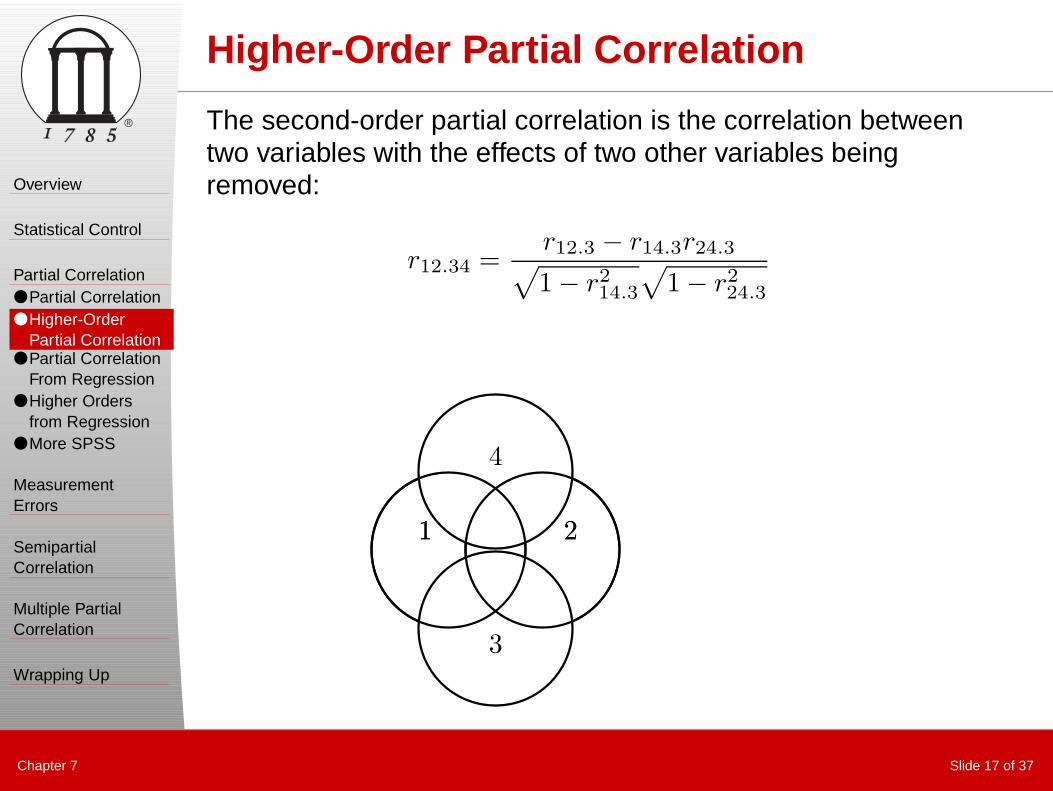
Higher-Order Partial Correlation
The second-order partial correlation is the correlation betweentwo variables with the effects of two other variables beingremoved:
r12.34 =r12.3 − r14.3r24.3
√
1 − r214.3
√
1 − r224.3
1 2
3
4
1 2
Overview
Statistical Control
Partial Correlation● Partial Correlation● Higher-Order
Partial Correlation● Partial Correlation
From Regression● Higher Orders
from Regression● More SPSS
MeasurementErrors
SemipartialCorrelation
Multiple PartialCorrelation
Wrapping Up
®
Chapter 7 Slide 18 of 37
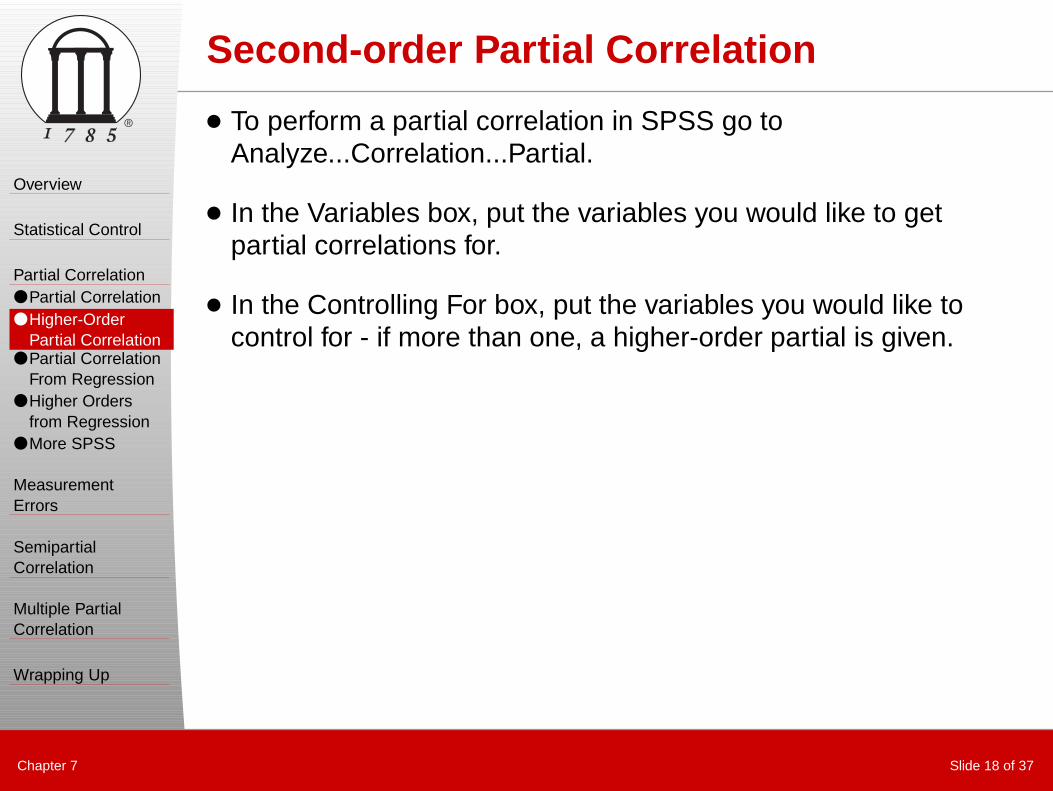
Second-order Partial Correlation
● To perform a partial correlation in SPSS go toAnalyze...Correlation...Partial.
● In the Variables box, put the variables you would like to getpartial correlations for.
● In the Controlling For box, put the variables you would like tocontrol for - if more than one, a higher-order partial is given.
Overview
Statistical Control
Partial Correlation● Partial Correlation● Higher-Order
Partial Correlation● Partial Correlation
From Regression● Higher Orders
from Regression● More SPSS
MeasurementErrors
SemipartialCorrelation
Multiple PartialCorrelation
Wrapping Up
®
Chapter 7 Slide 19 of 37
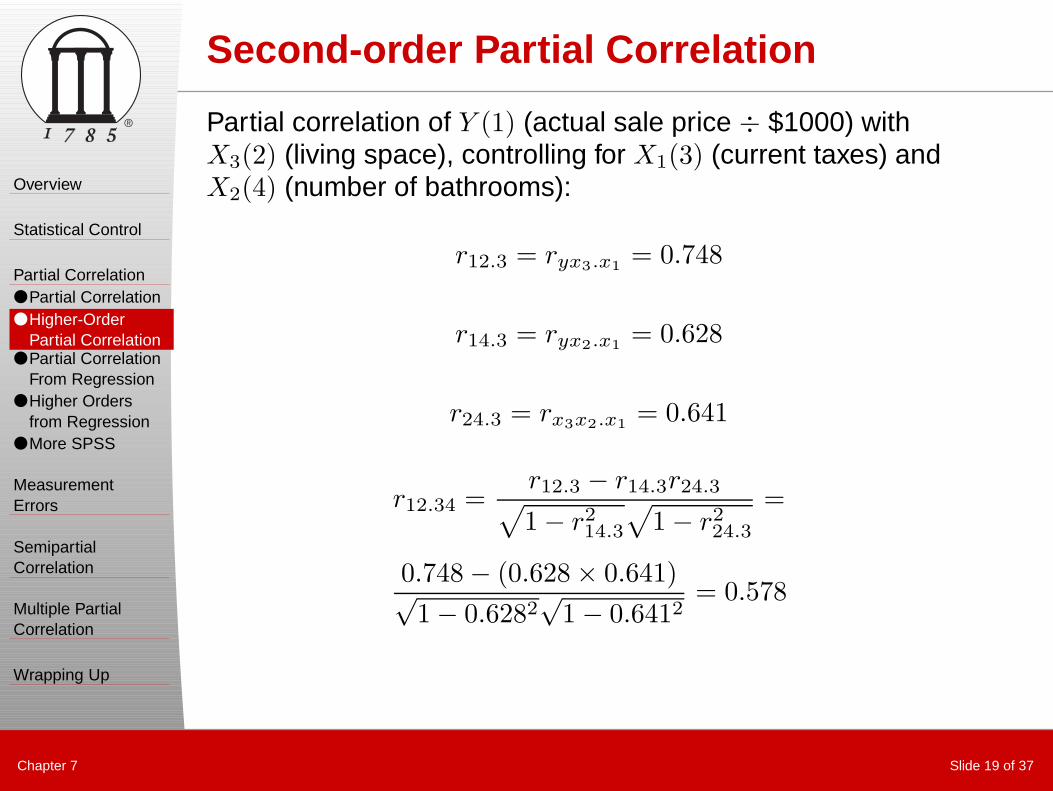
Second-order Partial Correlation
Partial correlation of Y (1) (actual sale price ÷ $1000) withX3(2) (living space), controlling for X1(3) (current taxes) andX2(4) (number of bathrooms):
r12.3 = ryx3.x1= 0.748
r14.3 = ryx2.x1= 0.628
r24.3 = rx3x2.x1= 0.641
r12.34 =r12.3 − r14.3r24.3
√
1 − r214.3
√
1 − r224.3
=
0.748 − (0.628 × 0.641)√
1 − 0.6282√
1 − 0.6412= 0.578

Overview
Statistical Control
Partial Correlation● Partial Correlation● Higher-Order
Partial Correlation● Partial Correlation
From Regression● Higher Orders
from Regression● More SPSS
MeasurementErrors
SemipartialCorrelation
Multiple PartialCorrelation
Wrapping Up
®
Chapter 7 Slide 20 of 37
Partial Correlations from Multiple Correlations
As you could probably guess, partial correlations can be foundfrom regression analyses...
Squared partial correlation:
r212.3 =
R21.23 − R2
1.3
1 − R21.3
● R21.23 is the R2 from a multiple regression with 1 being Y and
2 and 3 being the predictor variables.
● R21.3 is the R2 from a simple regression with 1 being Y and 2
being X - the single predictor variable.

Overview
Statistical Control
Partial Correlation● Partial Correlation● Higher-Order
Partial Correlation● Partial Correlation
From Regression● Higher Orders
from Regression● More SPSS
MeasurementErrors
SemipartialCorrelation
Multiple PartialCorrelation
Wrapping Up
®
Chapter 7 Slide 21 of 37
Partial Correlations from Multiple Correlations
Partial correlation of Y (1) (actual sale price ÷ $1000) withX3(2) (living space), controlling for X1(3) (current taxes):
R21.23 = 0.928
R21.3 = 0.838
r212.3 =
R21.23 − R2
1.3
1 − R21.3
=0.928 − 0.838
1 − 0.838= 0.865
r12.3 =√
r212.3 =
√0.865 = 0.748

Overview
Statistical Control
Partial Correlation● Partial Correlation● Higher-Order
Partial Correlation● Partial Correlation
From Regression● Higher Orders
from Regression● More SPSS
MeasurementErrors
SemipartialCorrelation
Multiple PartialCorrelation
Wrapping Up
®
Chapter 7 Slide 22 of 37
Partial Correlations from Multiple Correlations
Alternatively:
r212.3 =
R22.13 − R2
2.3
1 − R22.3
Partial correlation of Y (1) (actual sale price ÷ $1000) withX3(2) (living space), controlling for X1(3) (current taxes):
R22.13 = 0.865
R22.3 = 0.693
r212.3 =
R22.13 − R2
2.3
1 − R22.3
=0.865 − 0.693
1 − 0.693= 0.865
r12.3 =√
r212.3 =
√0.865 = 0.748
Overview
Statistical Control
Partial Correlation● Partial Correlation● Higher-Order
Partial Correlation● Partial Correlation
From Regression● Higher Orders
from Regression● More SPSS
MeasurementErrors
SemipartialCorrelation
Multiple PartialCorrelation
Wrapping Up
®
Chapter 7 Slide 23 of 37
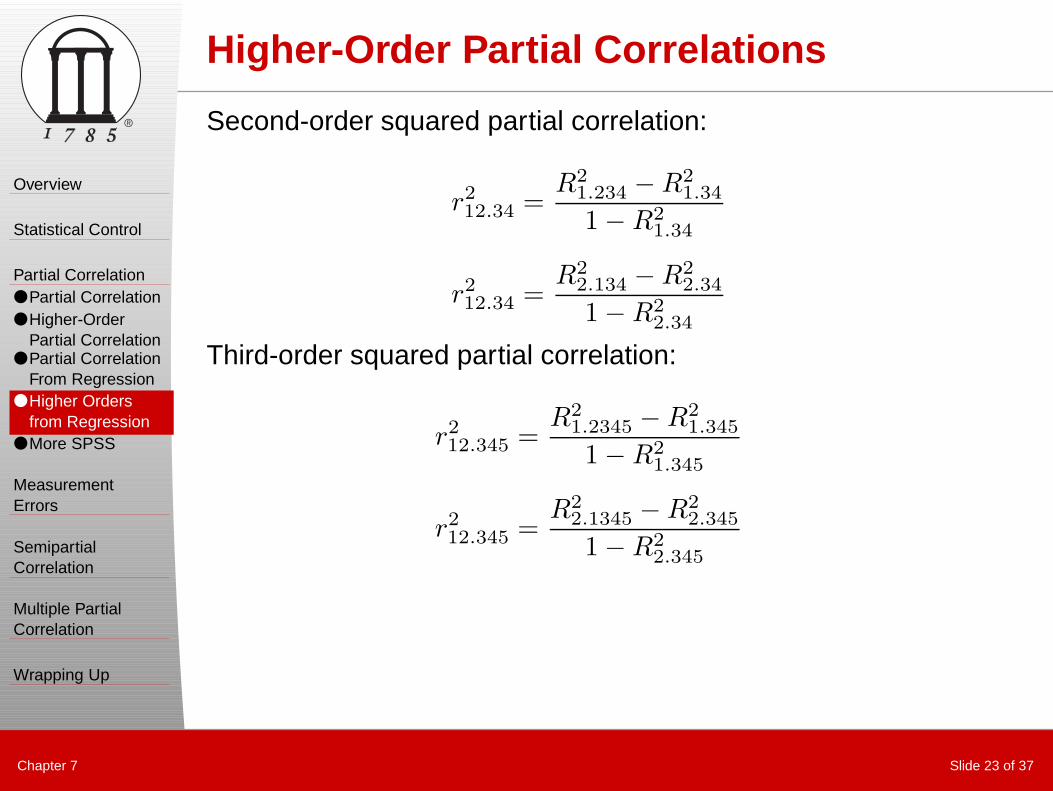
Higher-Order Partial Correlations
Second-order squared partial correlation:
r212.34 =
R21.234 − R2
1.34
1 − R21.34
r212.34 =
R22.134 − R2
2.34
1 − R22.34
Third-order squared partial correlation:
r212.345 =
R21.2345 − R2
1.345
1 − R21.345
r212.345 =
R22.1345 − R2
2.345
1 − R22.345

Overview
Statistical Control
Partial Correlation● Partial Correlation● Higher-Order
Partial Correlation● Partial Correlation
From Regression● Higher Orders
from Regression● More SPSS
MeasurementErrors
SemipartialCorrelation
Multiple PartialCorrelation
Wrapping Up
®
Chapter 7 Slide 24 of 37
Higher-Order Partial Correlations
Partial correlation of Y (1) (actual sale price ÷ $1000) withX3(2) (living space), controlling for X1(3) (current taxes) andX2(4) (number of bathrooms):
R21.234 = 0.935
R21.34 = 0.902
r212.34 =
R21.234 − R2
1.34
1 − R21.34
=0.935 − 0.901
1 − 0.902= 0.337
r12.34 =√
r212.34 =
√0.337 = 0.578

Overview
Statistical Control
Partial Correlation● Partial Correlation● Higher-Order
Partial Correlation● Partial Correlation
From Regression● Higher Orders
from Regression● More SPSS
MeasurementErrors
SemipartialCorrelation
Multiple PartialCorrelation
Wrapping Up
®
Chapter 7 Slide 25 of 37
Partial Correlations in Regression
You can obtain partial correlations (and semipartial correlations- called part correlations by SPSS) from the regressionanalysis subroutine:
● Go to Analyze...Regression...Linear.
● Click on Statistics box.
● Check Part and Partial Correlations.
Overview
Statistical Control
Partial Correlation
MeasurementErrors● Correction For
Attenuation● Corrected Partial
Correlation
SemipartialCorrelation
Multiple PartialCorrelation
Wrapping Up
®
Chapter 7 Slide 26 of 37
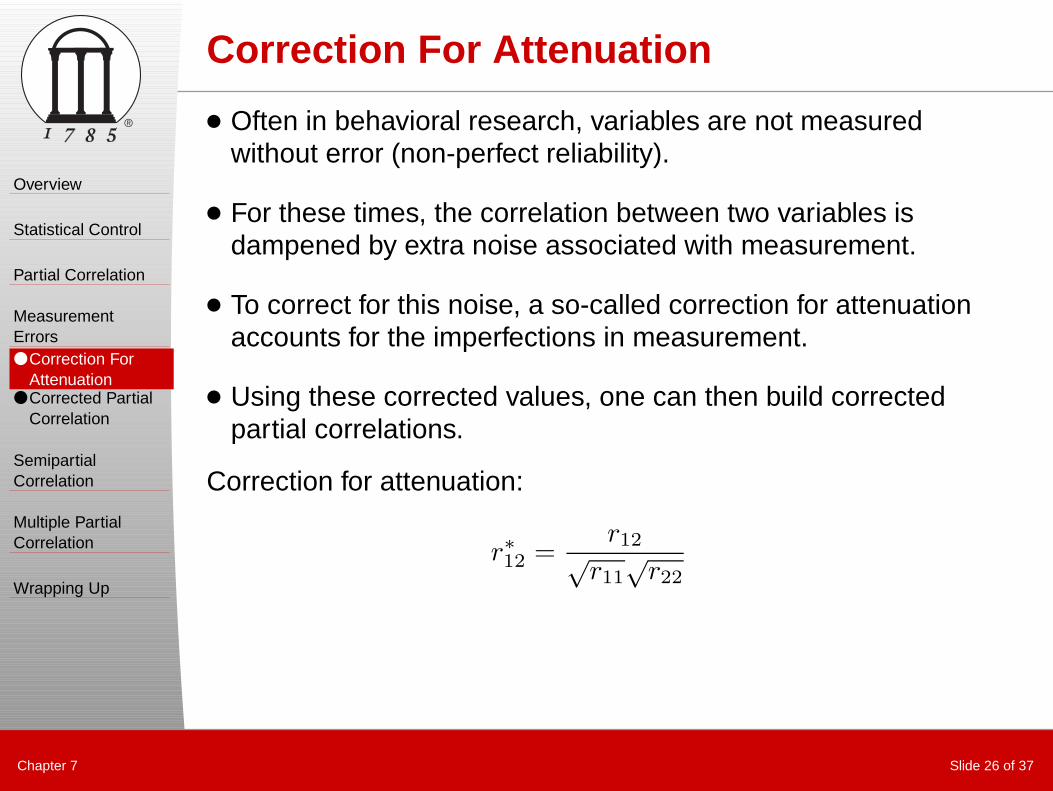
Correction For Attenuation
● Often in behavioral research, variables are not measuredwithout error (non-perfect reliability).
● For these times, the correlation between two variables isdampened by extra noise associated with measurement.
● To correct for this noise, a so-called correction for attenuationaccounts for the imperfections in measurement.
● Using these corrected values, one can then build correctedpartial correlations.
Correction for attenuation:
r∗12 =r12
√r11
√r22

Overview
Statistical Control
Partial Correlation
MeasurementErrors● Correction For
Attenuation● Corrected Partial
Correlation
SemipartialCorrelation
Multiple PartialCorrelation
Wrapping Up
®
Chapter 7 Slide 27 of 37
Corrected Partial Correlation
Recall the formula for the first-order partial correlation:
r12.3 =r12 − r13r23
√
1 − r213
√
1 − r223
First-order partial correlation correction for attenuation:
r∗12.3 =r33r12 − r13r23
√
r11r33 − r213
√
r22r33 − r223
Overview
Statistical Control
Partial Correlation
MeasurementErrors
SemipartialCorrelation● Semipartial
Correlation fromRegression
● Tests ofSignificance
● MultipleRegression
Multiple PartialCorrelation
Wrapping Up
®
Chapter 7 Slide 28 of 37
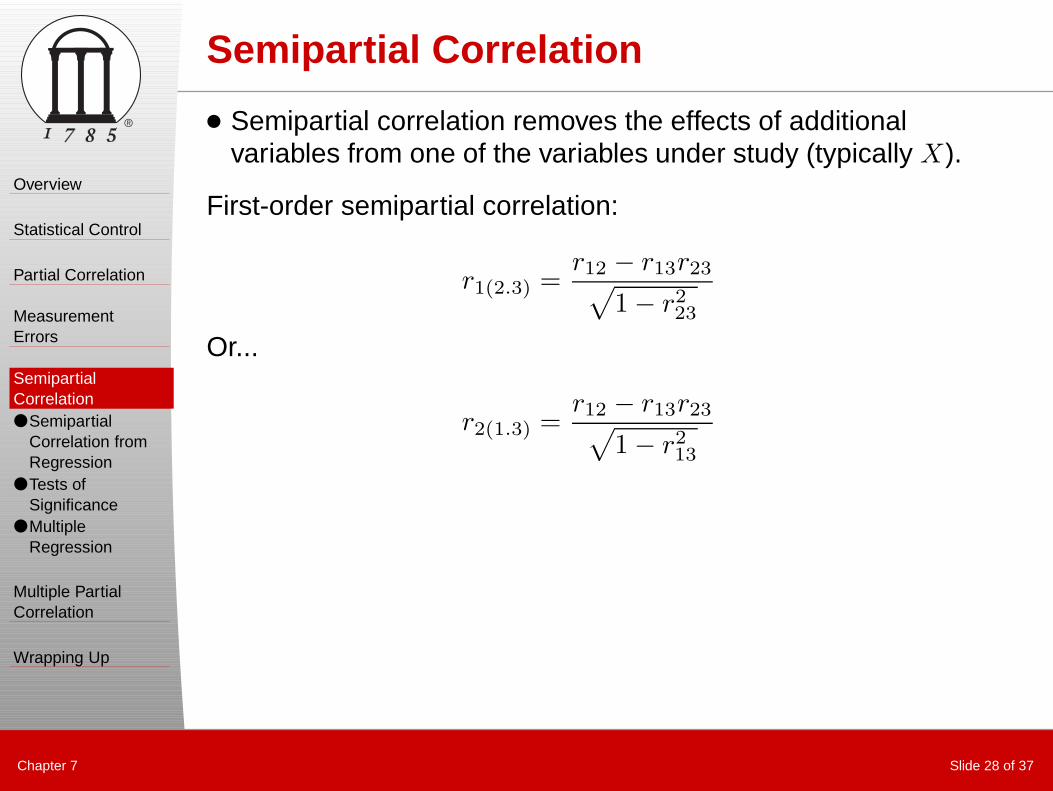
Semipartial Correlation
● Semipartial correlation removes the effects of additionalvariables from one of the variables under study (typically X).
First-order semipartial correlation:
r1(2.3) =r12 − r13r23√
1 − r223
Or...
r2(1.3) =r12 − r13r23√
1 − r213
Overview
Statistical Control
Partial Correlation
MeasurementErrors
SemipartialCorrelation● Semipartial
Correlation fromRegression
● Tests ofSignificance
● MultipleRegression
Multiple PartialCorrelation
Wrapping Up
®
Chapter 7 Slide 29 of 37
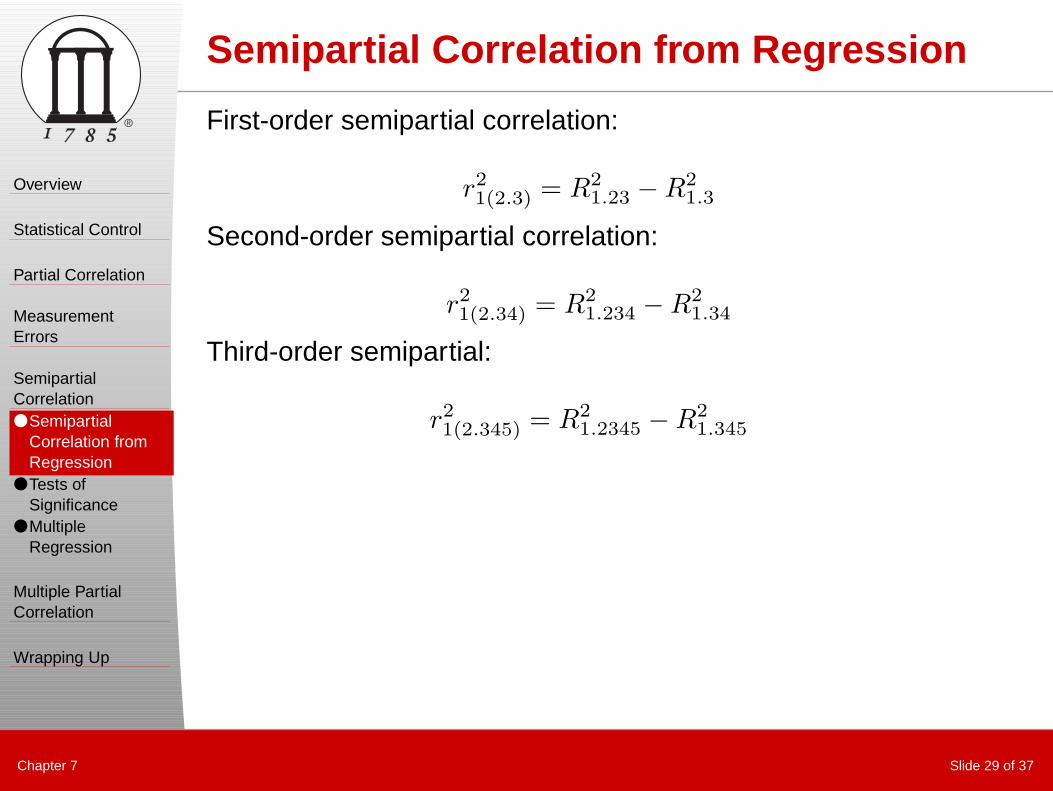
Semipartial Correlation from Regression
First-order semipartial correlation:
r21(2.3) = R2
1.23 − R21.3
Second-order semipartial correlation:
r21(2.34) = R2
1.234 − R21.34
Third-order semipartial:
r21(2.345) = R2
1.2345 − R21.345
Overview
Statistical Control
Partial Correlation
MeasurementErrors
SemipartialCorrelation● Semipartial
Correlation fromRegression
● Tests ofSignificance
● MultipleRegression
Multiple PartialCorrelation
Wrapping Up
®
Chapter 7 Slide 30 of 37
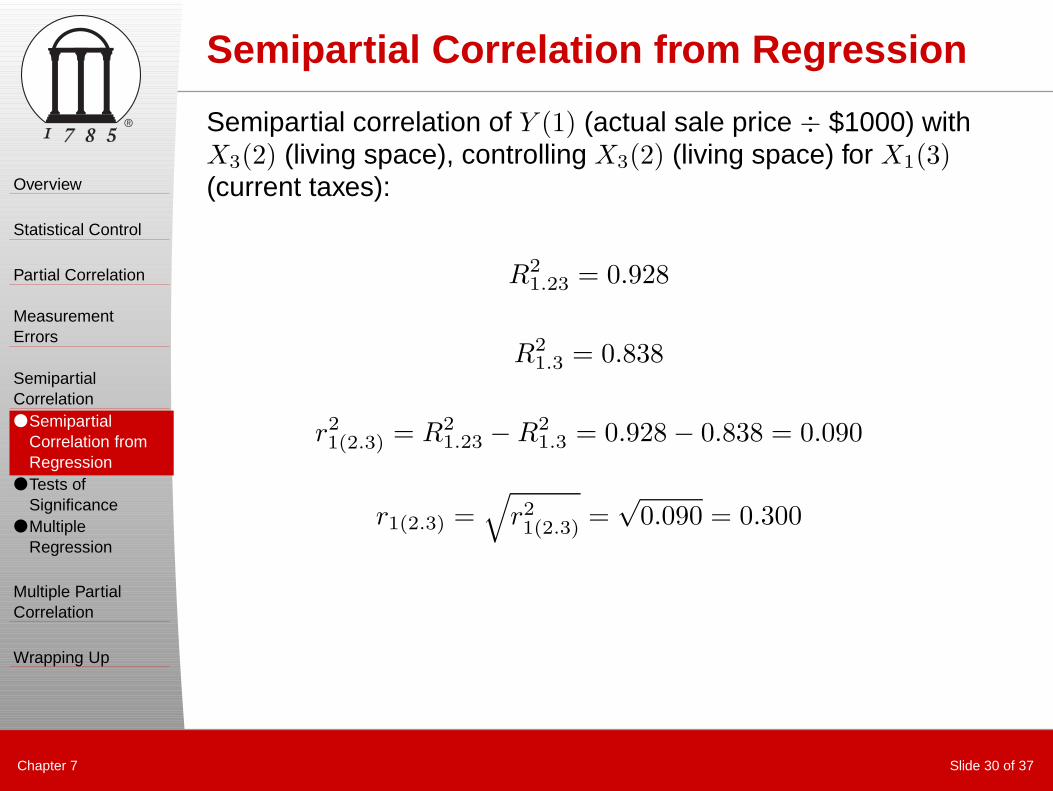
Semipartial Correlation from Regression
Semipartial correlation of Y (1) (actual sale price ÷ $1000) withX3(2) (living space), controlling X3(2) (living space) for X1(3)(current taxes):
R21.23 = 0.928
R21.3 = 0.838
r21(2.3) = R2
1.23 − R21.3 = 0.928 − 0.838 = 0.090
r1(2.3) =√
r21(2.3) =
√0.090 = 0.300

Overview
Statistical Control
Partial Correlation
MeasurementErrors
SemipartialCorrelation● Semipartial
Correlation fromRegression
● Tests ofSignificance
● MultipleRegression
Multiple PartialCorrelation
Wrapping Up
®
Chapter 7 Slide 31 of 37
Semipartial Correlation from Regression
Semipartial correlation of Y (1) (actual sale price ÷ $1000) withX3(2) (living space), controlling X3(2) (living space) for X1(3)(current taxes) and X2(4) (number of bathrooms):
R21.234 = 0.935
R21.34 = 0.902
r21(2.34) = R2
1.234 − R21.34 = 0.935 − 0.902 = 0.033
r1(2.3) =√
r21(2.3) =
√0.090 = 0.182

Overview
Statistical Control
Partial Correlation
MeasurementErrors
SemipartialCorrelation● Semipartial
Correlation fromRegression
● Tests ofSignificance
● MultipleRegression
Multiple PartialCorrelation
Wrapping Up
®
Chapter 7 Slide 32 of 37
Tests of Significance
Semipartial correlations are found using the formulasdeveloped for the test of the increment in the proportion ofvariance accounted for in regression:
F =R2
y.12...k1− R2
y.12...k2/(k1 − k2)
1 − R2y.12...k1
/(N − k1 − 1),
where k1 > k2, with:
● dfnum = k1 − k2
● dfdenom = N − k1 − 1

Overview
Statistical Control
Partial Correlation
MeasurementErrors
SemipartialCorrelation● Semipartial
Correlation fromRegression
● Tests ofSignificance
● MultipleRegression
Multiple PartialCorrelation
Wrapping Up
®
Chapter 7 Slide 33 of 37
Multiple Regression
You can begin to see how multiple regression uses the staticalconcepts from today’s to control the prediction of the Yvariable:
R2y.1234 = r2
y1 + r2y(2.1) + r2
y(3.12) + r2y(3.123)
Overview
Statistical Control
Partial Correlation
MeasurementErrors
SemipartialCorrelation
Multiple PartialCorrelation● Multiple Partial
Correlation● Multiple
SemipartialCorrelation
Wrapping Up
®
Chapter 7 Slide 34 of 37
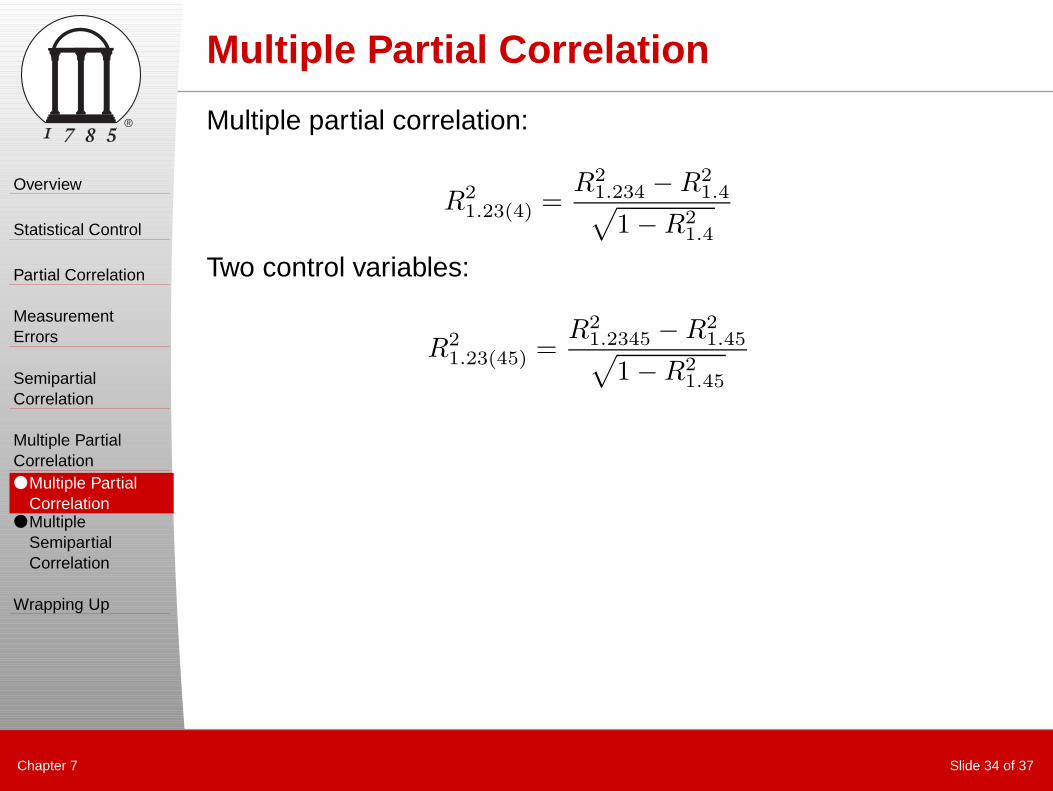
Multiple Partial Correlation
Multiple partial correlation:
R21.23(4) =
R21.234 − R2
1.4√
1 − R21.4
Two control variables:
R21.23(45) =
R21.2345 − R2
1.45√
1 − R21.45

Overview
Statistical Control
Partial Correlation
MeasurementErrors
SemipartialCorrelation
Multiple PartialCorrelation● Multiple Partial
Correlation● Multiple
SemipartialCorrelation
Wrapping Up
®
Chapter 7 Slide 35 of 37
Multiple Semipartial Correlation
Multiple semipartial correlation:
R21(23.4) = R2
1.234 − R21.4
Two control variables:
R21(23.45) = R2
1.2345 − R21.45

Overview
Statistical Control
Partial Correlation
MeasurementErrors
SemipartialCorrelation
Multiple PartialCorrelation
Wrapping Up● Final Thought● Next Class
®
Chapter 7 Slide 36 of 37
Final Thought
● Often times, experimentalcontrol is not possible.
● Using statisticaltechniques, one can get anidea of how variables arerelated to one another byremoving the effects ofspurious variables
● Partial and semipartial are statistical techniques to providepost-hoc control.

Overview
Statistical Control
Partial Correlation
MeasurementErrors
SemipartialCorrelation
Multiple PartialCorrelation
Wrapping Up● Final Thought● Next Class
®
Chapter 7 Slide 37 of 37
Next Time
● Midterm handed out.
● Midterm discussion.