APPLICATION OF SAR INTERFEROMETRIC · PDF fileAPPLICATION OF SAR INTERFEROMETRIC TECHNIQUES...
10
APPLICATION OF SAR INTERFEROMETRIC TECHNIQUES FOR SURFACE DEFORMATION MONITORING Urs Wegmüller, Charles Werner, Tazio Strozzi, and Andreas Wiesmann Gamma Remote Sensing, Worbstrasse 225, 3073 Gümligen, Switzerland Email: [email protected] Abstract: Over the last years surface deformation monitoring with interferometric SAR (INSAR) techniques reached some maturity. Important elements contributing to this increasing importance included the development of advanced processing techniques and the rich existing SAR data archives - containing information on surface movements since 1991, the currently operated SAR sensors in orbit (ERS-2, ENVISAT ASAR, Radarsat, ALOS PALSAR) and the planned upcoming SAR missions (TerraSAR, Radarsat2) which shall ensure data continuity. Based on examples mainly from the mining sector potential and limitations of INSAR for surface deformation monitoring as well as related recent developments are discussed. The selected test cases cover a variety of characteristic deformation types, ranging from stable conditions to rapid subsidence above underground coal excavation. 1. Introduction There exists a significant demand for deformation information for a number of reasons including legal obligations, safety, environmental monitoring, and geosciences research. Space-borne INSAR is one possible approach to measure such deformation. The required data are available from several satellites, processing techniques have reached pre-operational status and existing non-EO techniques are rather expensive. In the following potential and limitations of INSAR techniques for surface deformation monitoring are discussed. 2. Differential SAR interferometry (DINSAR) 2.1. Introduction to the technique In repeat-pass INSAR two or more Synthetic Aperture Radar (SAR) images are acquired at different times with the same or a corresponding sensor from almost the identical aspect angle. Over some areas the resulting images have almost the identical speckle and the phase difference is related to the imaging path length difference. The phase difference is determined as the argument of the normalized interferogram, g, defined as the normalized complex correlation coefficient of the complex backscatter intensities. The degree of coherence, a measure of the phase noise, is defined as the magnitude of the normalized interferogram g = g . The interferometric phase is sensitive to both surface topography and coherent displacement along the look vector occurring between the acquisition of the interferometric data pair. Inhomogeneous propagation delay and phase noise are the main error sources. 3rd IAG / 12th FIG Symposium, Baden, May 22-24, 2006
Transcript of APPLICATION OF SAR INTERFEROMETRIC · PDF fileAPPLICATION OF SAR INTERFEROMETRIC TECHNIQUES...

APPLICATION OF SAR INTERFEROMETRIC TECHNIQUES FOR SURFACE DEFORMATION MONITORING
Urs Wegmüller, Charles Werner, Tazio Strozzi, and Andreas Wiesmann Gamma Remote Sensing, Worbstrasse 225, 3073 Gümligen, Switzerland
Email: [email protected]
Abstract: Over the last years surface deformation monitoring with interferometric SAR (INSAR) techniques reached some maturity. Important elements contributing to this increasing importance included the development of advanced processing techniques and the rich existing SAR data archives - containing information on surface movements since 1991, the currently operated SAR sensors in orbit (ERS-2, ENVISAT ASAR, Radarsat, ALOS PALSAR) and the planned upcoming SAR missions (TerraSAR, Radarsat2) which shall ensure data continuity. Based on examples mainly from the mining sector potential and limitations of INSAR for surface deformation monitoring as well as related recent developments are discussed. The selected test cases cover a variety of characteristic deformation types, ranging from stable conditions to rapid subsidence above underground coal excavation.
1. Introduction There exists a significant demand for deformation information for a number of reasons including legal obligations, safety, environmental monitoring, and geosciences research. Space-borne INSAR is one possible approach to measure such deformation. The required data are available from several satellites, processing techniques have reached pre-operational status and existing non-EO techniques are rather expensive. In the following potential and limitations of INSAR techniques for surface deformation monitoring are discussed.
2. Differential SAR interferometry (DINSAR)
2.1. Introduction to the technique In repeat-pass INSAR two or more Synthetic Aperture Radar (SAR) images are acquired at different times with the same or a corresponding sensor from almost the identical aspect angle. Over some areas the resulting images have almost the identical speckle and the phase difference is related to the imaging path length difference. The phase difference is determined as the argument of the normalized interferogram, γ, defined as the normalized complex correlation coefficient of the complex backscatter intensities. The degree of coherence, a measure of the phase noise, is defined as the magnitude of the normalized interferogram γ = γ . The interferometric phase is sensitive to both surface topography and coherent displacement along the look vector occurring between the acquisition of the interferometric data pair. Inhomogeneous propagation delay and phase noise are the main error sources.
3rd IAG / 12th FIG Symposium, Baden, May 22-24, 2006

The basic idea of the DINSAR approach is to separate the effects of surface topography and coherent displacement, permitting to retrieve displacement maps. This is achieved by subtracting the topography related phase, which is either simulated based on an available Digital Elevation Model (DEM), or estimated from an independent interferogram. The use of a DEM is usually more robust and operational and therefore more frequently used. From the complex valued interferograms, interferometric phases are only known Modulo 2π. Phase unwrapping to estimate unambiguous differential interferometric phases is therefore an important required step. The sensitivity of the interferometric phase to surface deformation is very high. In the case of a C-band SAR (ERS, ENVISAT, Radarsat) 2π displacement phase corresponds to only 2.8 cm displacement along the look vector. For a more comprehensive introduction to DINSAR it is referred to [1,2,3].
The accuracy of the deformation estimated from individual differential interferograms is mainly limited by the atmospheric path delay term. A well established method to reduce this error is interferogram stacking. The basic idea of interferogram stacking is to combine multiple observations into a single result. The main assumption is that the deformation phase is highly correlated and the error terms (atmosphere, signal noise, and baseline related) are uncorrelated between the independent pairs. This is not entirely true (e.g. topography related atmospheric error term) but can often been used as a reasonable assumption. While the signal term of the independent terms add linearly the error terms increase at a lower rate because they are uncorrelated leading to a reduced error in the stacked result. By combining sufficient observation time it is possible to achieve mm/year accuracies for relatively slow uniform deformations in urban areas, as was shown in [4,5]. An important pre-requisites is of course the availability of suited pairs with adequate time intervals and short enough baselines. Furthermore, it has to be kept in mind that the spatial coverage is restricted to the spatial coverage of the individual results.
2.2. Potential and limitations of C-band DINSAR Based on ERS-1, ERS-2, ENVISAT ASAR, and Radarsat-1 data there exists an immense experience with C-band (frequency: 5.3 GHz, wavelength: 5.6cm) DINSAR. Over urban areas as well as over some other such as rocks, semi-arid and arid areas, the coherence is high enough permitting interpretation of the differential interferometric phase even for time intervals of more than one year. On the other hand temporal decorrelation prevents from interpreting the signal for vegetated areas, water surfaces, and typically also for snow covered areas. Apart from temporal decorrelation spatial decorrelation, related to the baseline, and non-overlapping Doppler spectra are important considerions. Baselines significantly shorter than the critical baseline ([1,2] approx. 1.1 km for ERS and ASAR IS2 mode) are required. In practice baselines up to about 25% of the critical baseline are preferred. This “short baseline requirement” reduced the availability of adequate image pairs significantly, and it reduces the possible temporal sampling (e.g. 35 day repeat-data available but baseline is too long). Decorrelation is a major limiting factor for the applicability of C-band DINSAR.
Furthermore, previous investigations [6] have shown that the use of C-band DINSAR is problematic in the presence of high phase gradients. High in this context means that the spatial sampling of the phase is insufficient to permit practical unwrapping of the phase. Our experience using ERS data is that it often becomes impossible to correctly resolve gradients of more than 3 phase cycles (fringes) per 1 km horizontal distance. For underground coal mining up to about 10 fringes may occur over this distance. In such a case only the location of the subsidence cone and the lower deformation rates can be reliably retrieved. Reducing the
3rd IAG / 12th FIG Symposium, Baden, May 22-24, 2006
observation period, increasing the wavelength used (see also L-band discussion below), and improving the spatial resolution are possible mitigation strategies. This limitation is therefore less severe for Radarsat-1 for its shorter repeat interval (24 days) and higher spatial resolution of fine-beam mode data.
Concerning the deformation rate accuracy achievable for areas of sufficient coherence, the main error term is related to the heterogeneity of the atmospheric path delay. Statistically, this error is significantly smaller than a full phase cycle, especially if relatively small areas (e.g. 20 km x 20 km) are considered. At C-band a phase error of π/2 corresponds to a line-of-sight displacement error of 0.7 cm. Consequently, the accuracy is limited for very low deformation rates. Improving the accuracy is possible, though, through the stacking of multiple observations as demonstrated in Figure 1.
(a) (b)
(c) (d)
Figure 1: Differential interferogram (a), filtered differential interferogram (b), unwrapped interferometric phase for high coherence areas (c), and average deformation map calculated
from several interferometric pairs by stacking (d).
2.3. Potential and limitations of L-band DINSAR Incomplete spatial coverage caused by temporal decorrelation and problems in resolving high spatial phase gradients were identified as important limitations of the C-band INSAR. At L-band (frequency: 1.275 GHz, wavelength: 23.5cm) these limitations are reduced due to the longer wavelength. Strozzi et al. [7] demonstrated that L-band coherence over forest can be high enough to permit interpretation of the interferometric phases. Furthermore, the phase gradient corresponding to a given deformation rate gradient is four times smaller with the longer at L-band wavelength than at C-band.
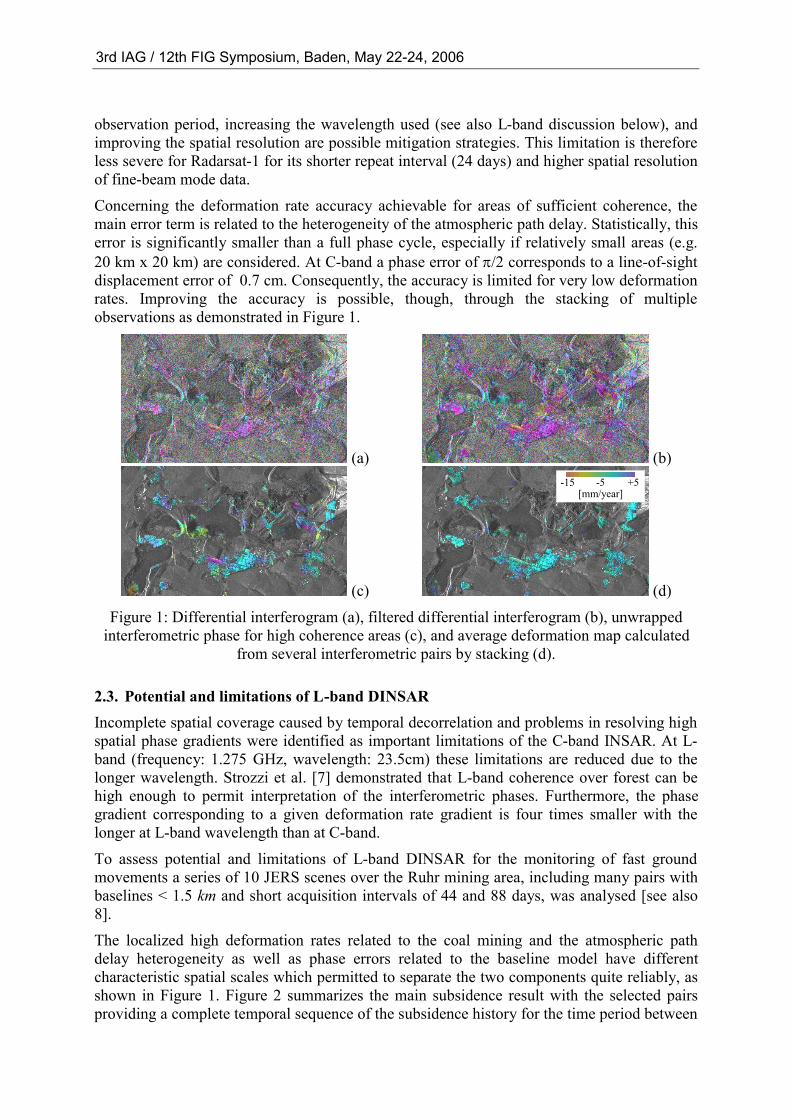
To assess potential and limitations of L-band DINSAR for the monitoring of fast ground movements a series of 10 JERS scenes over the Ruhr mining area, including many pairs with baselines < 1.5 km and short acquisition intervals of 44 and 88 days, was analysed [see also 8].
The localized high deformation rates related to the coal mining and the atmospheric path delay heterogeneity as well as phase errors related to the baseline model have different characteristic spatial scales which permitted to separate the two components quite reliably, as shown in Figure 1. Figure 2 summarizes the main subsidence result with the selected pairs providing a complete temporal sequence of the subsidence history for the time period between
-15 -5 +5 [mm/year]
3rd IAG / 12th FIG Symposium, Baden, May 22-24, 2006
the first and the last acquisitions. The spatial coverage achieved is also almost complete, thanks to the relatively short baselines and time intervals used. For this area this corresponds to a tremendous improvement over the only partial spatial coverage (low coherence of vegetated areas) and unreliable information for fast deformations derived using C-band INSAR (ERS). L-band DINSAR subsidence mapping was found to be applicable for rural and forested areas as well as for the high deformation gradients above underground coal excavation. Sufficient coherence to permit interpretation of the phase was obtained even over forest for pairs with a perpendicular baseline component < 1.0km and time intervals < 88days.
Apart from the applicability the quality of L-band interferometry was investigated. The main error source of DINSAR based deformation maps is the atmospheric path delay. Expressed as deformation error this term is comparable at C- and L-band. Similarly, the same deformation error results from a height error. But the corresponding phase errors are about four times lower at L-band than at C-band facilitating phase unwrapping at L-band. The lower L-band phase-to-displacement sensitivity makes signal noise a more important error source. But noise effects can often be strongly reduced by spatial or temporal filtering. JERS has a particularly low signal-to-noise ratio (SNR) because of some instrument failure – nevertheless, high quality results could be achieved as was confirmed by the quantitative validation conducted. Future L-band sensors will have high SNR, narrow orbital tubes (i.e. short baselines), accurate orbit information, increased spatial resolution and comparable or shorter revisit intervals, all factors further improving the applicability and quality of L-band INSAR. Stacking multiple observations to improve the accuracy is of course also possible at L-band.
Figure 1: JERS DINSAR over Ruhr mining area (19980713_19980826, 44days, B⊥ 352m). The left image shows the low-frequency phase correction applied, the center image the
resulting corrected differential interferogram, both for a 92km x 127km area, the right the resulting deformation map for the considered 44day period for a 32km x 16km subsection.
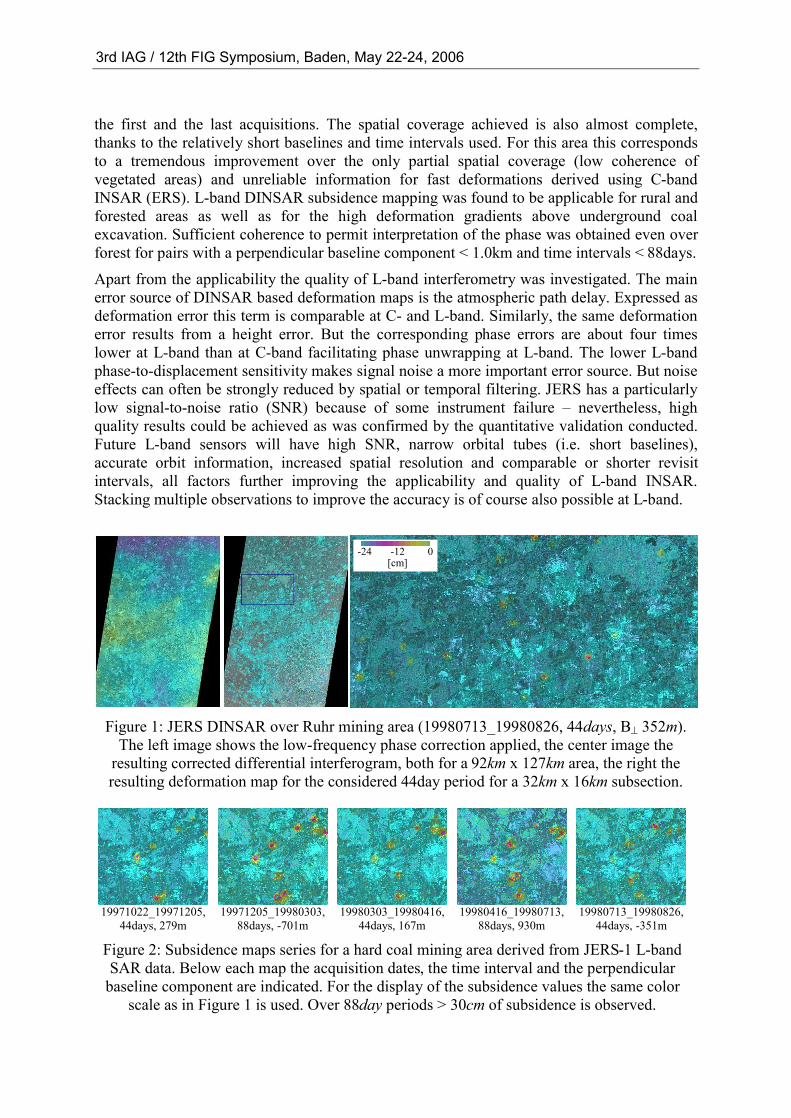
19971022_19971205,
44days, 279m 19971205_19980303,
88days, -701m 19980303_19980416,
44days, 167m 19980416_19980713,
88days, 930m 19980713_19980826,
44days, -351m
Figure 2: Subsidence maps series for a hard coal mining area derived from JERS-1 L-band SAR data. Below each map the acquisition dates, the time interval and the perpendicular
baseline component are indicated. For the display of the subsidence values the same color scale as in Figure 1 is used. Over 88day periods > 30cm of subsidence is observed.
-24 -12 0 [cm]
3rd IAG / 12th FIG Symposium, Baden, May 22-24, 2006
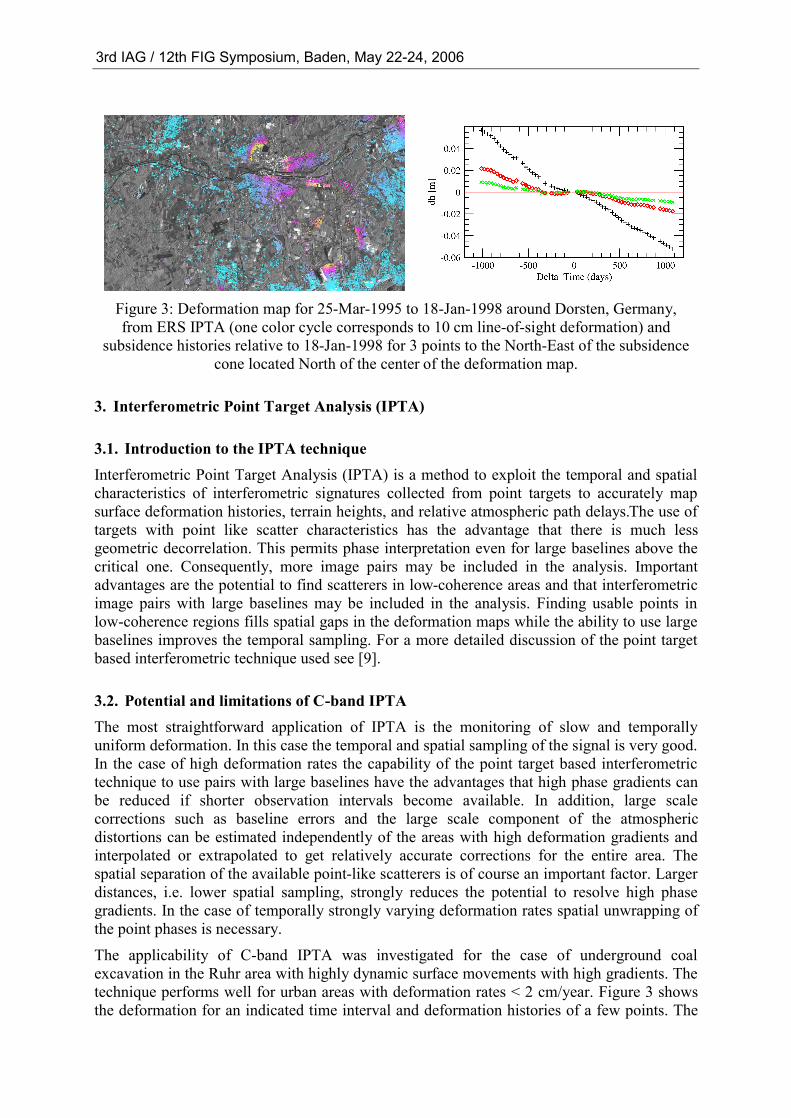
Figure 3: Deformation map for 25-Mar-1995 to 18-Jan-1998 around Dorsten, Germany, from ERS IPTA (one color cycle corresponds to 10 cm line-of-sight deformation) and
subsidence histories relative to 18-Jan-1998 for 3 points to the North-East of the subsidence cone located North of the center of the deformation map.
3. Interferometric Point Target Analysis (IPTA)
3.1. Introduction to the IPTA technique Interferometric Point Target Analysis (IPTA) is a method to exploit the temporal and spatial characteristics of interferometric signatures collected from point targets to accurately map surface deformation histories, terrain heights, and relative atmospheric path delays.The use of targets with point like scatter characteristics has the advantage that there is much less geometric decorrelation. This permits phase interpretation even for large baselines above the critical one. Consequently, more image pairs may be included in the analysis. Important advantages are the potential to find scatterers in low-coherence areas and that interferometric image pairs with large baselines may be included in the analysis. Finding usable points in low-coherence regions fills spatial gaps in the deformation maps while the ability to use large baselines improves the temporal sampling. For a more detailed discussion of the point target based interferometric technique used see [9].
3.2. Potential and limitations of C-band IPTA The most straightforward application of IPTA is the monitoring of slow and temporally uniform deformation. In this case the temporal and spatial sampling of the signal is very good. In the case of high deformation rates the capability of the point target based interferometric technique to use pairs with large baselines have the advantages that high phase gradients can be reduced if shorter observation intervals become available. In addition, large scale corrections such as baseline errors and the large scale component of the atmospheric distortions can be estimated independently of the areas with high deformation gradients and interpolated or extrapolated to get relatively accurate corrections for the entire area. The spatial separation of the available point-like scatterers is of course an important factor. Larger distances, i.e. lower spatial sampling, strongly reduces the potential to resolve high phase gradients. In the case of temporally strongly varying deformation rates spatial unwrapping of the point phases is necessary.
The applicability of C-band IPTA was investigated for the case of underground coal excavation in the Ruhr area with highly dynamic surface movements with high gradients. The technique performs well for urban areas with deformation rates < 2 cm/year. Figure 3 shows the deformation for an indicated time interval and deformation histories of a few points. The
3rd IAG / 12th FIG Symposium, Baden, May 22-24, 2006
spatial coverage achieved is incomplete in areas of high deformation rates. The problem are high spatial gradients and the movements are highly non-uniform in time. In areas of lower deformation rates and gradients the deformation history could be monitored. There are also some point targets in rural areas permitting to get a more complete image of the deformation field. In forested and to some degree also for agricultural areas there remain important gaps in the spatial coverage.
The SAR onboard RADARSAT 1 operates also at C-band but in a 24 days repeat cycle and with a higher range resolution, respectively wider chirp bandwidth (in fine beam mode). The shorter repeat-cycle and higher spatial resolution permit a better temporal and spatial sampling which has advantages in the case of fast and dynamic deformation.
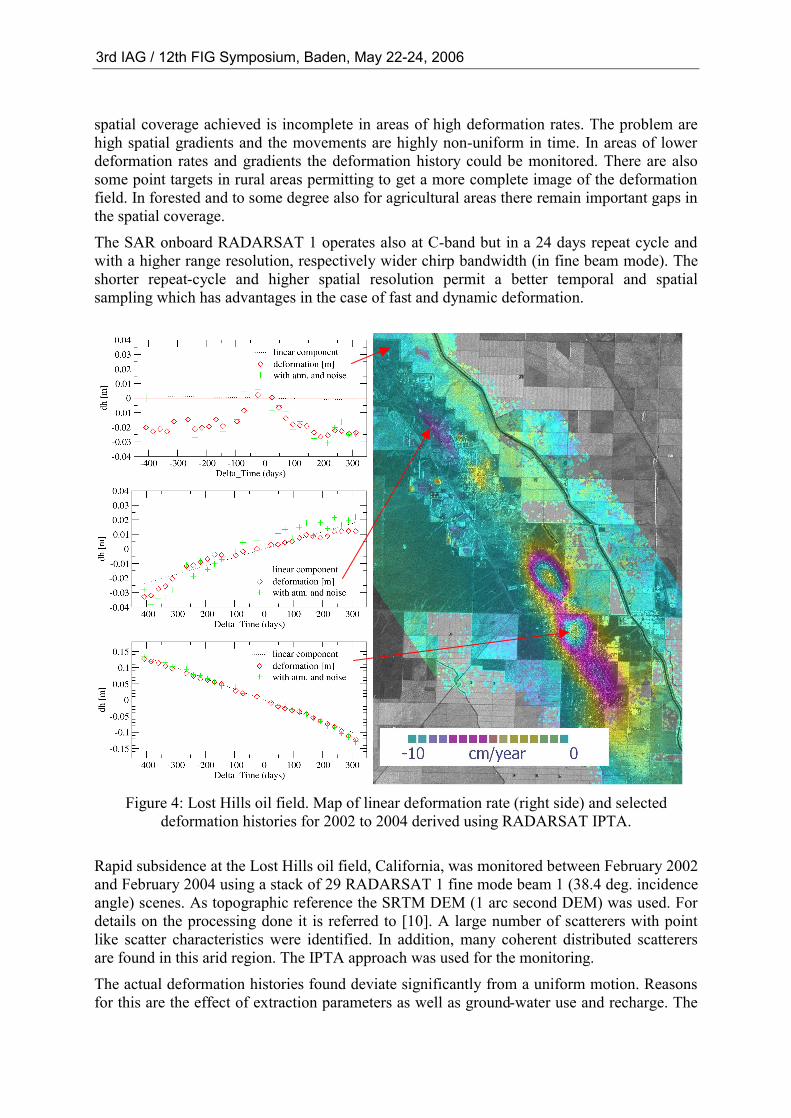
Figure 4: Lost Hills oil field. Map of linear deformation rate (right side) and selected deformation histories for 2002 to 2004 derived using RADARSAT IPTA.
Rapid subsidence at the Lost Hills oil field, California, was monitored between February 2002 and February 2004 using a stack of 29 RADARSAT 1 fine mode beam 1 (38.4 deg. incidence angle) scenes. As topographic reference the SRTM DEM (1 arc second DEM) was used. For details on the processing done it is referred to [10]. A large number of scatterers with point like scatter characteristics were identified. In addition, many coherent distributed scatterers are found in this arid region. The IPTA approach was used for the monitoring.
The actual deformation histories found deviate significantly from a uniform motion. Reasons for this are the effect of extraction parameters as well as ground-water use and recharge. The
3rd IAG / 12th FIG Symposium, Baden, May 22-24, 2006
main result are the displacement histories of the selected points. As an attempt to visualize both the spatial and temporal dimensions of the result Figure 5 shows the linear deformation component as well as several plots of deformation histories. For significantly non-uniform deformation, as observed in the Lost Hills case, the separation of atmosphere and deformation cannot be perfectly resolved. Therefore, not only the estimated deformation but also the entire signal, i.e. the deformation and the previously subtracted atmospheric and noise components are shown. Compared to other regions, the atmospheric effects are quite small for this arid site. This is clearly an IPTA example where the derivation of deformation histories for relatively high deformation rates was possible.
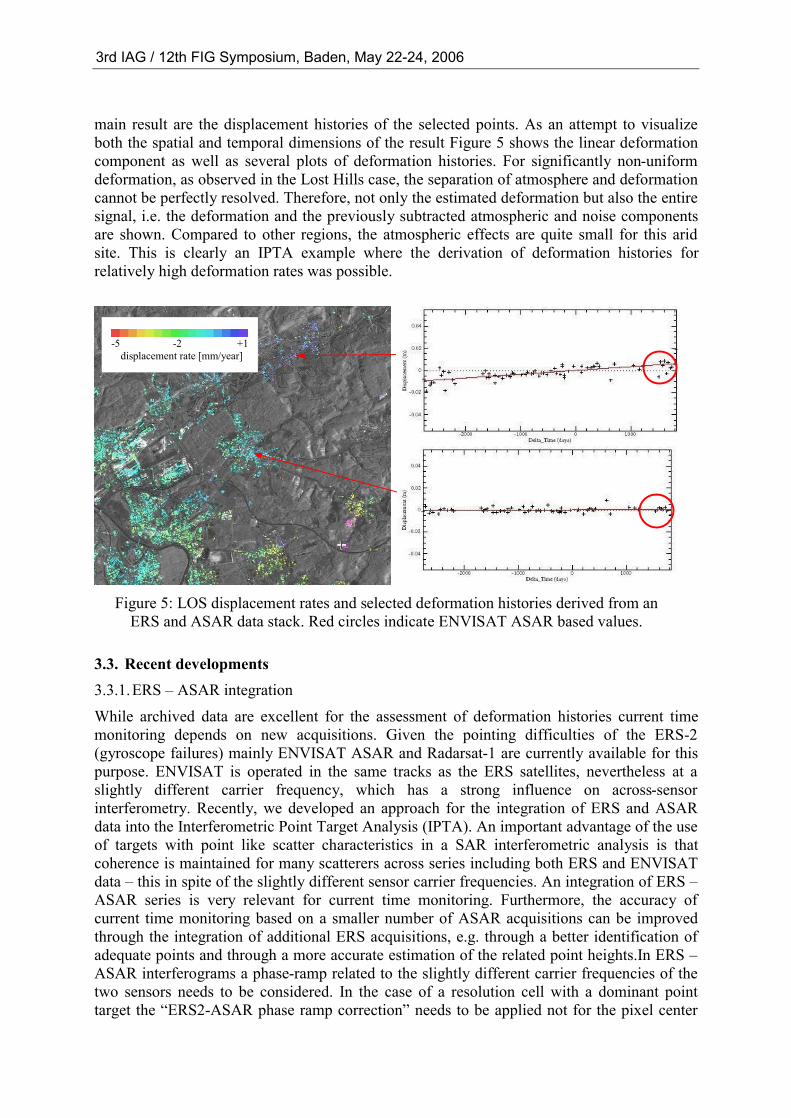
Figure 5: LOS displacement rates and selected deformation histories derived from an ERS and ASAR data stack. Red circles indicate ENVISAT ASAR based values.
3.3. Recent developments 3.3.1. ERS – ASAR integration
While archived data are excellent for the assessment of deformation histories current time monitoring depends on new acquisitions. Given the pointing difficulties of the ERS-2 (gyroscope failures) mainly ENVISAT ASAR and Radarsat-1 are currently available for this purpose. ENVISAT is operated in the same tracks as the ERS satellites, nevertheless at a slightly different carrier frequency, which has a strong influence on across-sensor interferometry. Recently, we developed an approach for the integration of ERS and ASAR data into the Interferometric Point Target Analysis (IPTA). An important advantage of the use of targets with point like scatter characteristics in a SAR interferometric analysis is that coherence is maintained for many scatterers across series including both ERS and ENVISAT data – this in spite of the slightly different sensor carrier frequencies. An integration of ERS – ASAR series is very relevant for current time monitoring. Furthermore, the accuracy of current time monitoring based on a smaller number of ASAR acquisitions can be improved through the integration of additional ERS acquisitions, e.g. through a better identification of adequate points and through a more accurate estimation of the related point heights.In ERS – ASAR interferograms a phase-ramp related to the slightly different carrier frequencies of the two sensors needs to be considered. In the case of a resolution cell with a dominant point target the “ERS2-ASAR phase ramp correction” needs to be applied not for the pixel center
-5 -2 +1 displacement rate [mm/year]
3rd IAG / 12th FIG Symposium, Baden, May 22-24, 2006
but for the actual location of the point target scattering phase center. Relative to the pixel center this means a difference in this correction between ± 5.1 radian (which is more than a full phase cycle). For an IPTA analysis this means that for each pixel such an ERS - ASAR phase offset φEA needs to be considered. For every pixel the sub-pixel location of the phase center of the dominant point scatterer is different, consequently, φEA differs from point to point (looking like noise); but for a selected point the same offset φEA applies for all ERS – ASAR pairs. This behaviour was confirmed in a small experiment and a simple method to integrate ERS and ASAR data into a single IPTA time series was presented [11]. Examples of deformation histories derived from a combined ERS – ASAR series are shown in Figure 5.
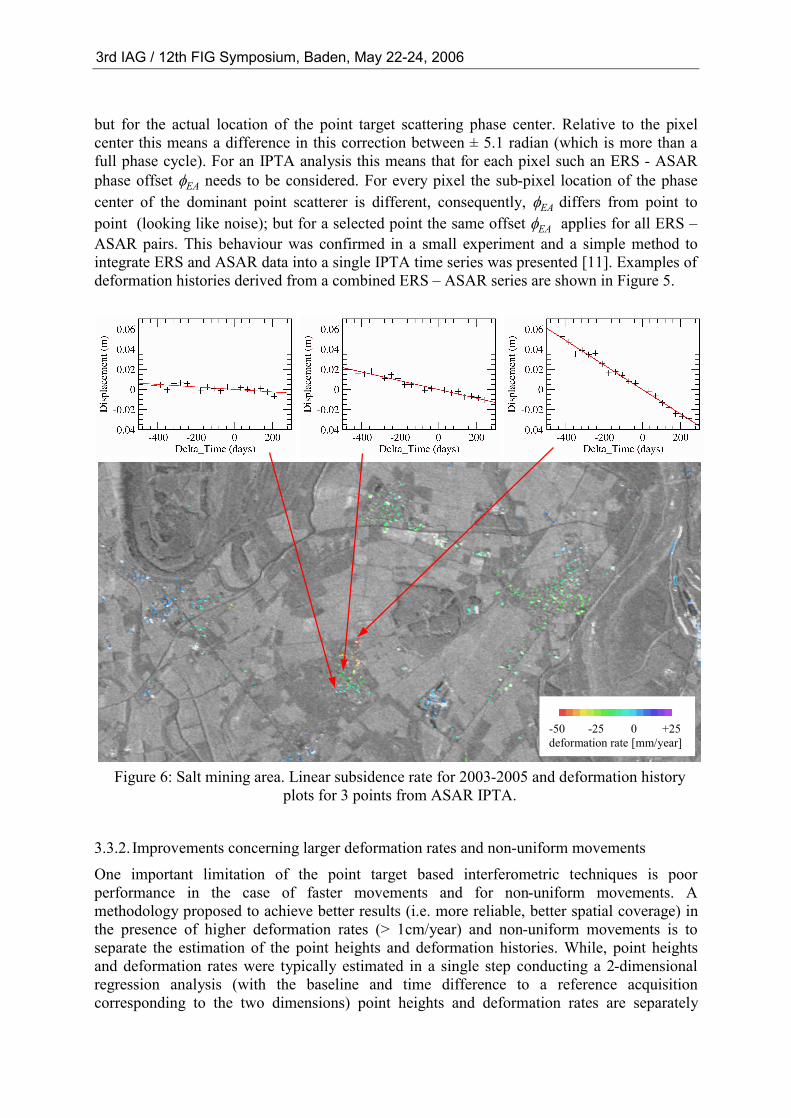
Figure 6: Salt mining area. Linear subsidence rate for 2003-2005 and deformation history
plots for 3 points from ASAR IPTA.
3.3.2. Improvements concerning larger deformation rates and non-uniform movements
One important limitation of the point target based interferometric techniques is poor performance in the case of faster movements and for non-uniform movements. A methodology proposed to achieve better results (i.e. more reliable, better spatial coverage) in the presence of higher deformation rates (> 1cm/year) and non-uniform movements is to separate the estimation of the point heights and deformation histories. While, point heights and deformation rates were typically estimated in a single step conducting a 2-dimensional regression analysis (with the baseline and time difference to a reference acquisition corresponding to the two dimensions) point heights and deformation rates are separately
-50 -25 0 +25 deformation rate [mm/year]
3rd IAG / 12th FIG Symposium, Baden, May 22-24, 2006
estimated in the new alternative processing approach. For the estimation of the point heights many short interval pairs (e.g. ≤ 105 days) are considered. This is done using multiple reference scenes. At this stage possible deformation phases are ignored or a known model is considered. One effect of using these short-interval pairs is that fewer points are lost in areas with higher deformation rates and non-uniform deformation. Once a list of points is accepted and related point heights are determined a stack with a single reference is used to determine point deformation histories and the atmospheric phases. At least a first estimation of an average deformation rate is done without correcting the point height, which reduces the dimension of the regression used. Such reduction of the dimension is also an advantage in the case of a relatively small data stack, e.g. with fewer observations available. Figure 6 shows an example of a result produced with this novel approach. Deformation rates of up to more than 5cm/year were obtained. The spatial pattern of the deformation rates appears plausible. No validation with independent reference data has yet been performed.
4. Outlook Concerning presently available and planned SAR sensors the situation is as follows: ENVISAT ASAR (C-band, ESA) and RADARSAT-1 (C-band, RSI/MDA) are fully operational. ALOS PALSAR (L-band, JAXA) was launched in January 2006. Currently, testing and calibration activities are ongoing. Data shall become available in summer 2006. Further launches planned for the near future include RADARSAT-2 (C-band, RSI/MDA) and TerraSAR-X (X-band, Germany). The follow on generation is already be discussed and it is likely that it will include constellations of several satellites to assure for more frequent repeat observations.
On the side of the processing techniques further improvements are expected. Furthermore, we expect significant improvements in the characterization of the quality of the INSAR based results. Another, important domain where important developments are still possible is in the design and use of artificial targets, active or passive, to fill spatial information gaps and to mark important locations (e.g. infrastructure) in persistent scatterer interferometry.
5. Conclusions Based on specific examples potential and limitations of INSAR for surface deformation monitoring were discussed. The potential can be summarized as follows: In vegetated areas and for fast deformations L-band INSAR has advantages over C-band INSAR. For its longer wavelength decorrelation in vegetation at L-band is reduced. Furthermore, the lower phase-to-deformation sensitivity reduces the problems in the case of high deformation gradients making L-band SAR well suited for the monitoring of fast deformation. Point target based interferometric techniques are particularly well suited for the monitoring of slow, uniform deformation. Slow non-uniform deformation can also be identified quite easily and accurately. The availability of many SAR observations permits achieving average deformation rate accuracies on the order of 1 mm/year. The accurate monitoring of more rapid deformations remains challenging, especially for rapid deformations which are non-uniform. Recent developments included the integration of ERS and ASAR series and modifications to the processing to improve the potential of the point based interferometric techniques to monitor fast and non-uniform movements.
In so-called pre-commercial projects Gamma Remote Sensing evaluates at present together with partners the utility of the INSAR based deformation mapping methods for the mining sector as part of an ongoing ESA Earth Observation Market Development Project.
3rd IAG / 12th FIG Symposium, Baden, May 22-24, 2006
6. Acknowledgements This work was supported by ESA contracts 17731/03/I-IW, 17897/03/I-IW, CAT-1 No. 2726, and JAXA ALOS RA #094.. SAR and DEM data courtesy ESA, JAXA, RSI, and USGS.
7. References [1] Bamler R. and P. Hartl, Synthetic aperture radar interferometry, Inverse Problems, 14: R1-R54,
1998. [2] Rosen P., S. Hensley, I. Joughin, F. Li, S. Madsen, E. Rodriguez and R. Goldstein, Synthetic
Aperture Radar Interferometry, Proceedings of the IEEE, 88(3): 333-382, March 2000. [3] Wegmüller U. and T. Strozzi, Characterization of differential interferometry
approaches, EUSAR'98, 25-27 May, Friedrichshafen, Germany, VDE-Verlag, ISBN 3-8007-2359-X, pp. 237-240, 1998.
[4] Strozzi T., L. Tosi, L. Carbognin, U. Wegmüller, and A. Galgaro, Monitoring Land Subsidence in the Euganean Geothermal Basin with Differential SAR Interferometry, Proc. Fringe'99, Liège (B), 1999.
[5] Tosi L., L. Carbognin, P. Teatini, T. Strozzi and U. Wegmüller, Evidence of the present relative stability of Venice, Italy, from land, sea and space observations, Geophysical Research Letters, 29, 2002, doi:10.1029/2001GL013211.
[6] Spreckels V., J. Musiedlak, U. Wegmüller, T. Strozzi, and C. Wichlacz, “Detection of underground coal mining-induced surface deformation by differential InSAR data”, ISPRS WG I/2, I/5, IV/7 Workshop on High resolution mapping from space, Hannover, Germany, 19-21 Sep. 2001.
[7] Strozzi T., U. Wegmüller, C. Werner, A. Wiesmann, and V. Spreckels, JERS SAR interferometry for land subsidence monitoring, IEEE Trans. Geosci. Remote Sensing, Vol. 41, No. 7, pp. 1702-1708, 2003.
[8] Wegmüller U., V. Spreckels, C. Werner, T. Strozzi, and A. Wiesmann, “Monitoring of mining induced surface deformation using L-band SAR interferometry”, Proc. IGARSS 2005, Seoul, Korea, 25-29 Jul. 2005.
[9] Wegmüller U., C. Werner, T. Strozzi, and A. Wiesmann, “Multi-temporal interferometric point target analysis”, in Analysis of Multi-temporal remote sensing images, Smits and Bruzzone (ed.), Series in Remote Sensing, Vol. 3, World Scientific (ISBN 981-238-915-61), pp. 136-144, 2004.
[10] Wegmüller U., C. Werner, T. Strozzi, and A. Wiesmann, “Potential and challenges of SAR interferometric techniques for the monitoring of mining induced surface deformation”, Proc. 4th Int. Symp. on Retrieval of Bio- and Geophysical Parameters form SAR data for Land Applications, Innsbruck, Austria, 16-19 Nov. 2004.
[11] Wegmüller U., C. Werner, T. Strozzi, and A. Wiesmann, "ERS ASAR Integration in the Interferometric Point Target Analysis”, Procs. FRINGE 2005 Workshop, Frascati, Italy, 28. Nov. - 2 Dec., 2005; http://earth.esa.int/workshops/fringe2005.
3rd IAG / 12th FIG Symposium, Baden, May 22-24, 2006