3D Data from Interferometric SAR and Stereo Radargrammetry...
15
3D Data from Interferometric SAR and Stereo Radargrammetry in Mapping of Forest Resources Kirsi Karila 1 , Mika Karjalainen 1 , Xiaowei Yu 1 , Mikko Vastaranta 2 1 Finnish Geospatial Research Institute, Finland; 2 University of Helsinki, Finland
Transcript of 3D Data from Interferometric SAR and Stereo Radargrammetry...
3D Data from Interferometric SAR and Stereo Radargrammetry in Mapping of Forest Resources
Kirsi Karila1, Mika Karjalainen1, Xiaowei Yu1, Mikko Vastaranta2 1Finnish Geospatial Research Institute, Finland; 2University of Helsinki, Finland
Purpose of this study • 3D digital elevation models (DEM) are created from
satellite SAR data using two alternative approaches: – 1) SAR interferometry (InSAR) – 2) radargrammetry
• These DEMs are related to the forest canopy height models using accurate digital terrain model based on airborne lidar surveys.
• The study area is located in Evo, Southern Finland, from which plot- and stand-wise reference data of standard forest resources related parameters are available.

3D SAR techniques INSAR Stereo-radargrammetry
• Phase difference
• Baseline of hundreds of meters
• Simultaneous imaging required
• Stereoscopic measurement (automatic image matching)
• Baseline of hundreds of kilometers
• Similar conditions required
[0, 2π]
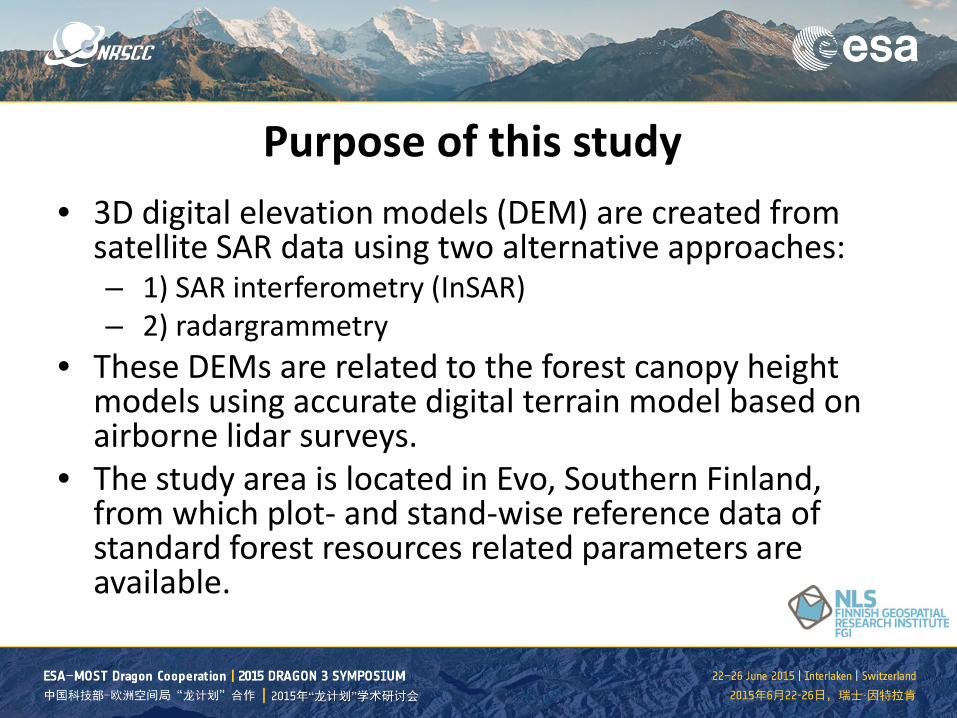
Study area: Evo
Aerial image © NLS
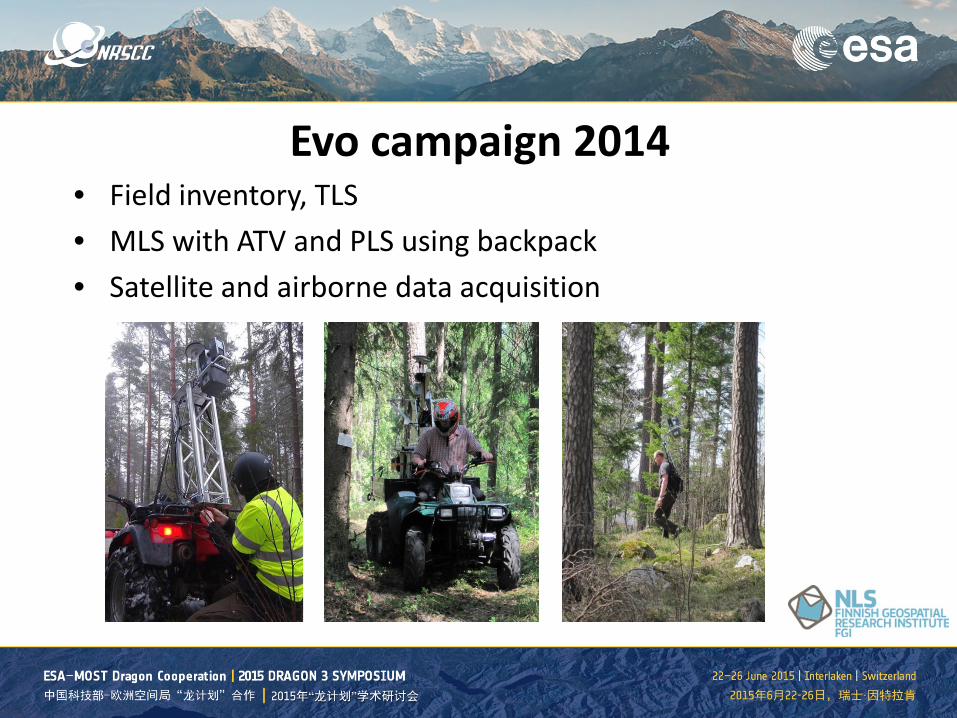
Evo campaign 2014 • Field inventory, TLS • MLS with ATV and PLS using backpack • Satellite and airborne data acquisition
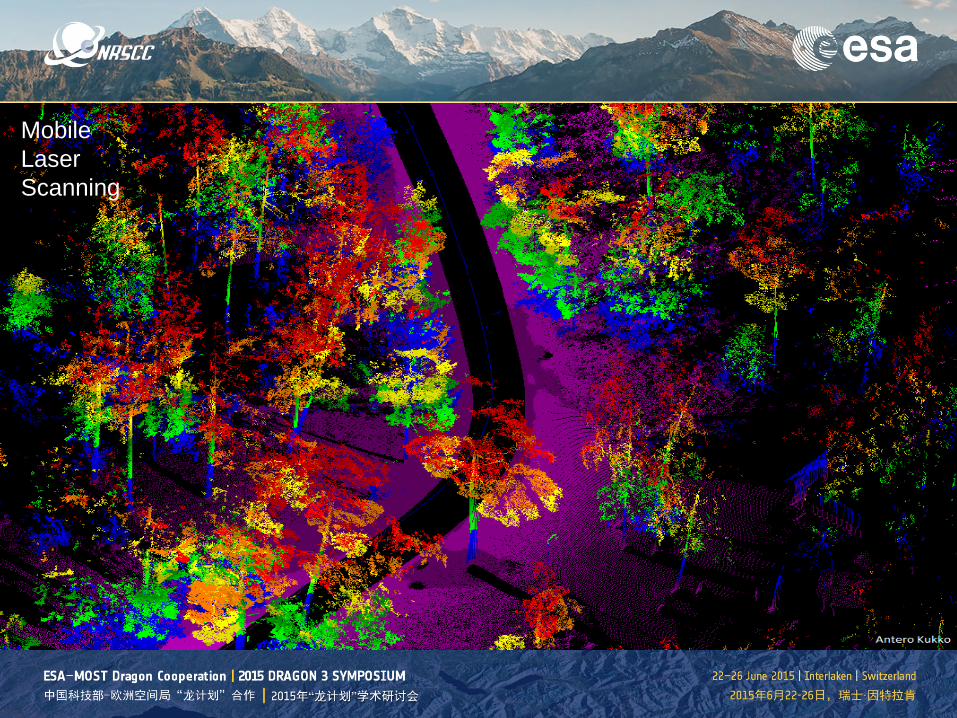
Mobile Laser Scanning
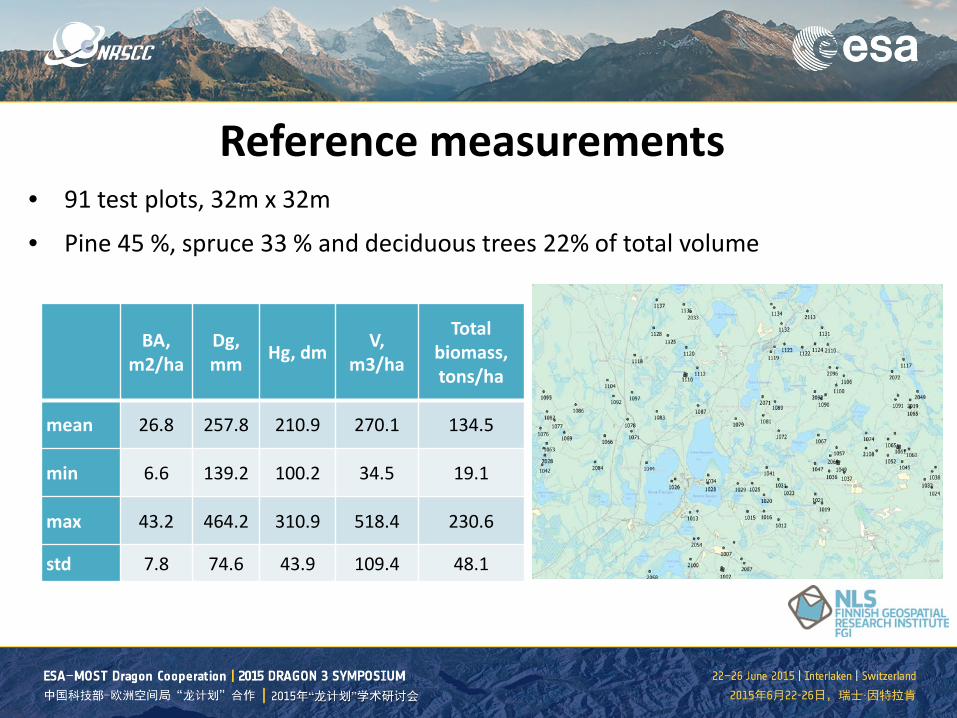
Reference measurements • 91 test plots, 32m x 32m
• Pine 45 %, spruce 33 % and deciduous trees 22% of total volume
BA, m2/ha
Dg, mm Hg, dm V,
m3/ha
Total biomass, tons/ha
mean 26.8 257.8 210.9 270.1 134.5
min 6.6 139.2 100.2 34.5 19.1
max 43.2 464.2 310.9 518.4 230.6
std 7.8 74.6 43.9 109.4 48.1
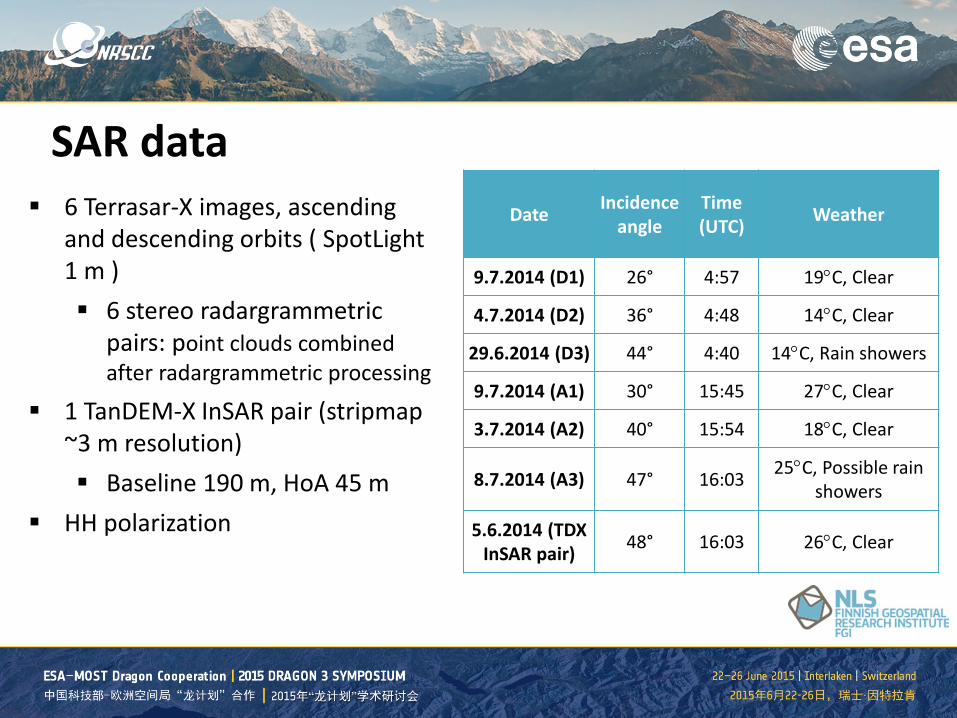
SAR data Date Incidence
angle Time (UTC) Weather
9.7.2014 (D1) 26° 4:57 19°C, Clear
4.7.2014 (D2) 36° 4:48 14°C, Clear
29.6.2014 (D3) 44° 4:40 14°C, Rain showers
9.7.2014 (A1) 30° 15:45 27°C, Clear
3.7.2014 (A2) 40° 15:54 18°C, Clear
8.7.2014 (A3) 47° 16:03 25°C, Possible rain showers
5.6.2014 (TDX InSAR pair) 48° 16:03 26°C, Clear
6 Terrasar-X images, ascending and descending orbits ( SpotLight 1 m ) 6 stereo radargrammetric
pairs: point clouds combined after radargrammetric processing
1 TanDEM-X InSAR pair (stripmap ~3 m resolution) Baseline 190 m, HoA 45 m
HH polarization
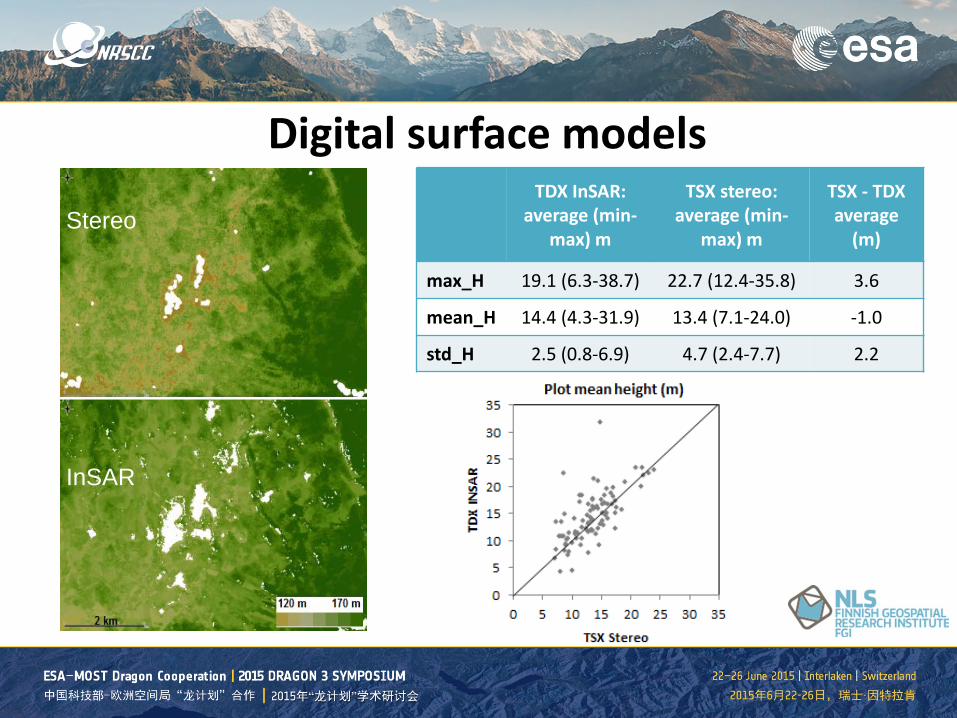
Digital surface models TDX InSAR:
average (min-max) m
TSX stereo: average (min-
max) m
TSX - TDX average
(m)
max_H 19.1 (6.3-38.7) 22.7 (12.4-35.8) 3.6
mean_H 14.4 (4.3-31.9) 13.4 (7.1-24.0) -1.0
std_H 2.5 (0.8-6.9) 4.7 (2.4-7.7) 2.2
Stereo
InSAR
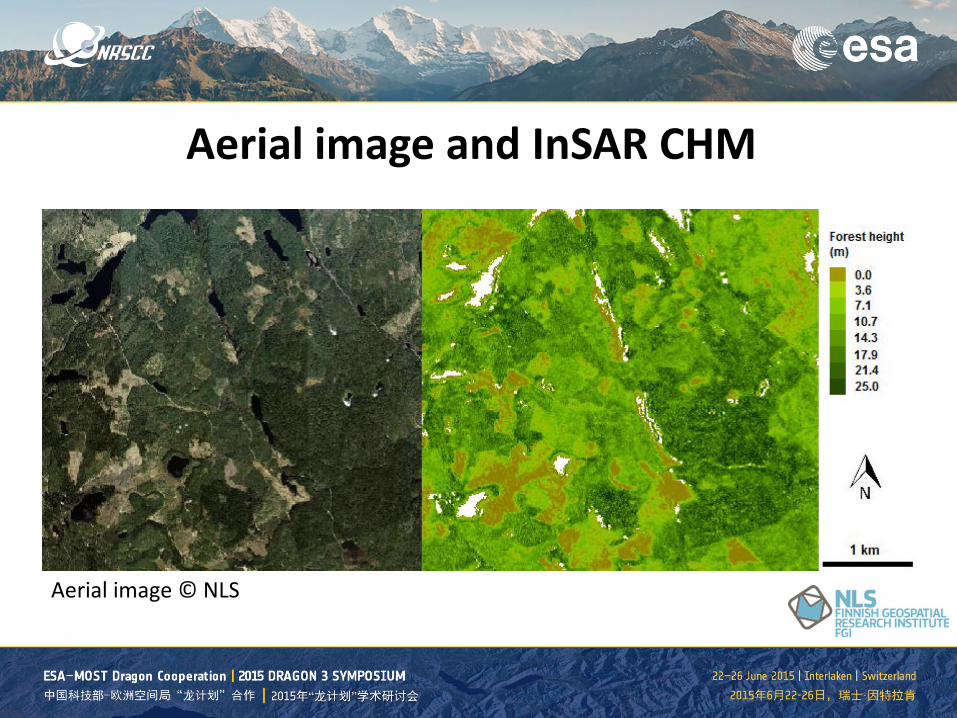
Aerial image and InSAR CHM
Aerial image © NLS
Forest attribute prediction • Attributes studied: Basal area, stem volume, biomass, mean
DBH and Lorey’s height (basal area weighted mean height) • From the SAR CHMs mean, max, min, std height, CV,
10,20,30,40,50,60,70,80,90% percentiles of height distribution for the plots were extracted for the 32x32 m areas
• Area based approach and random forests (RF) technique were used in the prediction of the forest plot attributes
• Forest variables measured in the field were used as target observations and plot-specific metrics derived from SAR data were used as predictors.
• The predicted were compared to the reference values
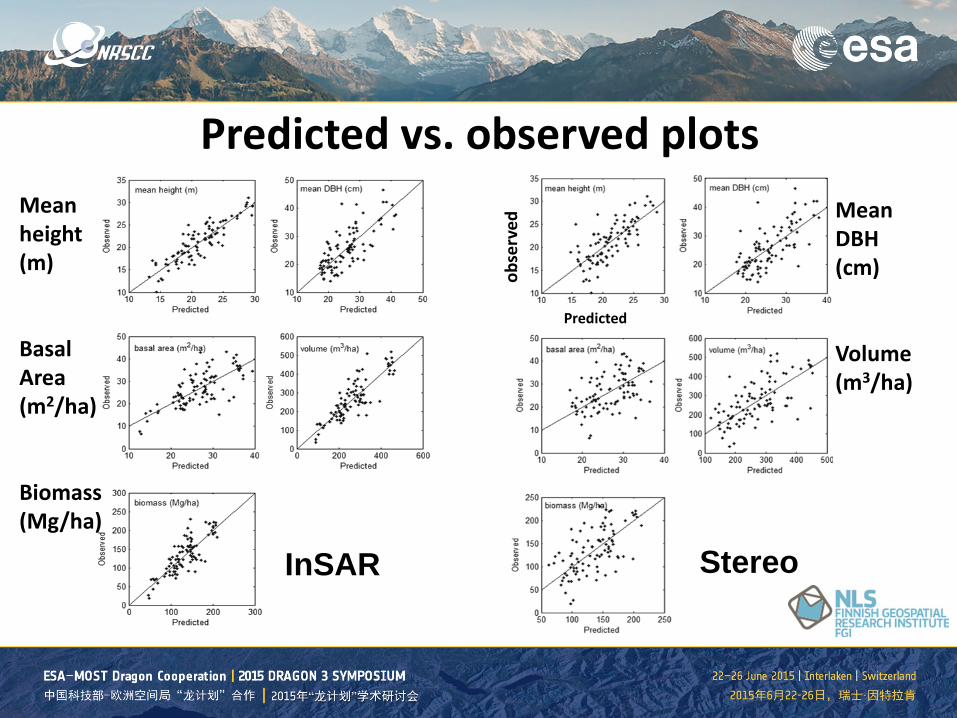
Predicted vs. observed plots
InSAR Stereo
Mean height (m) Basal Area (m2/ha) Biomass (Mg/ha)
Mean DBH (cm) Volume (m3/ha)
Predicted
obse
rved
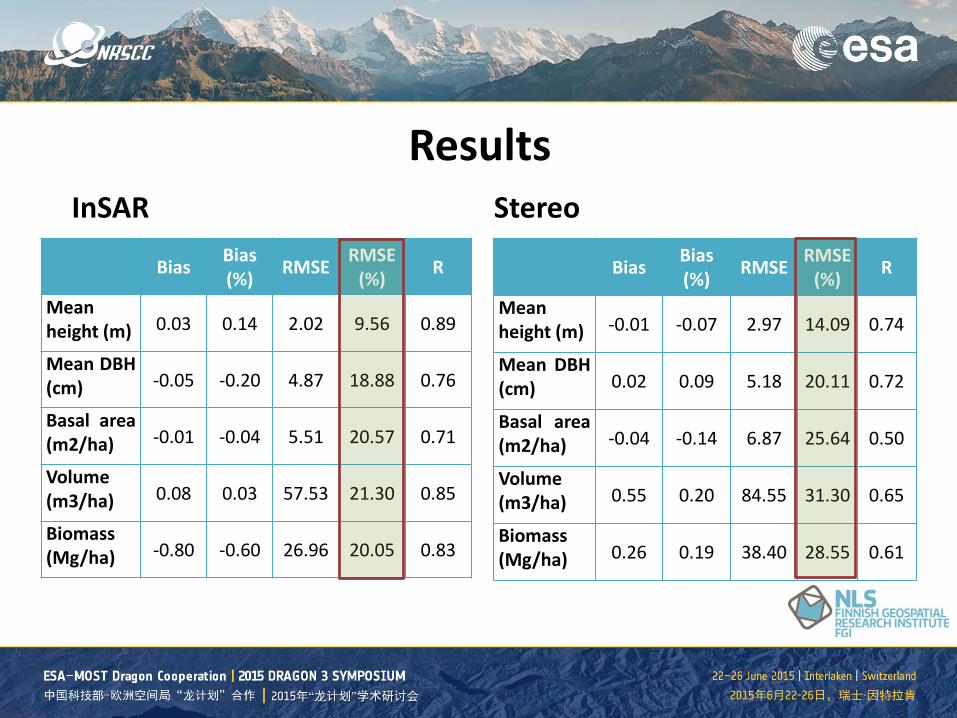
Results InSAR Stereo
Bias Bias
(%) RMSE RMSE (%) R
Mean height (m) 0.03 0.14 2.02 9.56 0.89
Mean DBH (cm) -0.05 -0.20 4.87 18.88 0.76
Basal area (m2/ha) -0.01 -0.04 5.51 20.57 0.71
Volume (m3/ha) 0.08 0.03 57.53 21.30 0.85
Biomass (Mg/ha) -0.80 -0.60 26.96 20.05 0.83
Bias Bias
(%) RMSE RMSE (%) R
Mean height (m) -0.01 -0.07 2.97 14.09 0.74
Mean DBH (cm) 0.02 0.09 5.18 20.11 0.72
Basal area (m2/ha) -0.04 -0.14 6.87 25.64 0.50
Volume (m3/ha) 0.55 0.20 84.55 31.30 0.65
Biomass (Mg/ha) 0.26 0.19 38.40 28.55 0.61
Conclusions and future • InSAR results (1 pair) slightly better than stereo
(6 pairs) • Forest inventories of wide areas are possible
using SAR data combined with an accurate terrain model
• Forest change detection using SAR 3D data • Comparison to other 3D and 2D remote sensing
techniques
Thank you!
More information www.fgi.fi